This article presents an analysis of the composition and ownership pattern of outstanding deposits1 with scheduled commercial banks (including regional rural banks) as on March 31, 2016 based on the branch level data submitted by scheduled commercial banks through annual Basic Statistical Return (BSR) – 4. The analysis brings out broad trends in institutional sectors’ deposits at the aggregate level and also across types of deposit accounts, population groups, bank groups and States over the period 2012 to 2016. Introduction The annual survey on Composition and Ownership Pattern of Bank Deposits with Scheduled Commercial Banks (SCBs) including Regional Rural Banks (RRBs) as on March 31, 2016, was conducted by the Reserve Bank. The branch-wise data were collected, according to type of deposits (viz., current, savings and term deposits), and institutional categories of depositors (i.e., households, Government, nonfinancial private corporate, financial, and foreign) from 1,32,810 branches/ offices under this survey. The aggregated data so collected under the survey were published on the Bank’s website under ‘data release’ (https://rbi.org.in/Scripts/BS_PressReleaseDisplay.aspx?prid=39036) in December 2016. 2. This article presents a brief review of the trends and pattern in various institutional sectors’ deposits as observed from the above data. Ownership pattern of aggregate deposits and those under various types of deposits accounts are discussed first. Subsequently, the pattern in ownership of deposits across various population groups is analysed. Institutional preference for specified bank-groups, if any, has also been looked into. Ownership patterns of bank deposits in various states as on March 31, 2016 are presented in the final section. Households share in total deposits increased 3. During 2015-16, deposits from foreign sector (18.0 per cent), non-financial private corporate sector (17.4 per cent) and household2 sector (12.3 per cent) recorded higher growth as compared to overall deposits’ growth (9.7 per cent), thus pulling their share in total deposits upward (Table 1). Further, in the net increase of ₹8,686 billion in total deposits during 2015-16, households contributed ₹6,656 billion (76.6 per cent), which was the highest in recent years. This led to a jump in households’ share in total deposits from 60.1 per cent in March 2015 to 61.5 per cent in March 2016. Within household sector, individuals3 continued to be the single major constituent comprising around 84 per cent of households’ deposit as on March 31, 2016. (Details were provided in the ‘data release’). 4. Government sector was the second largest contributor (12.8 per cent) in total outstanding deposits as on March 31, 2016 followed by nonfinancial private corporate sector (10.8 per cent), foreign sector (7.8 per cent), and financial sector (7.0 per cent) (Chart 1) respectively. 5. Deposits of Government sector and financial sector declined during 2015-16. Under financial sector, inter-bank deposits and deposits of other financial institutions contracted by 19.7 per cent and 3.0 per cent, respectively (Table 1). Non-financial private corporate sector maintained positive growth in bank deposits during last two financial years after witnessing contractions during 2012-13 and 2013-14. | Table 1: Total Deposits by Major Institutional Sectors | | (Amounts in ₹ Billion; Growth in Per cent) | | Major Institutional Sectors | Mar-12 | Mar-13 | Mar-14 | Mar-15 | Mar-16 | | I. Government Sector | 9,361 | 9,912 | 11,402 | 12,900 | 12,620 | | | (19.5) | (5.9) | (15.0) | (13.1) | (-2.2) | | Of which, Public Sector Corporations | 3,017 | 2,726 | 3,735 | 3,719 | 4,069 | | | (26.7) | (-9.6) | (37.0) | (-0.4) | (9.4) | | II. Private Corporate Sector (Non-Financial) | 9,384 | 8,875 | 8,065 | 9,076 | 10,656 | | | (14.7) | (-5.4) | (-9.1) | (12.5) | (17.4) | | III. Financial Sector | 6,019 | 7150 | 7,928 | 7,361 | 6,923 | | | (11.7) | (18.8) | (10.9) | (-7.2) | (-5.9) | | Of which, Banks | 2,652 | 2,939 | 3,736 | 3,384 | 2,718 | | | (6.3) | (10.8) | (27.1) | (-9.4) | (-19.7) | | Other Financial Institutions | 1,548 | 1,662 | 2,136 | 1,918 | 1,860 | | | (7.2) | (7.4) | (28.5) | (-10.2) | (-3.0) | | Other Financial Companies | 1,819 | 2,549 | 2,056 | 2,060 | 2,345 | | | (27.1) | (40.1) | (-19.3) | (0.2) | (13.8) | | IV. Household Sector | 37,249 | 42,568 | 48,567 | 53,914 | 60,571 | | | (15.2) | (14.3) | (14.1) | (11.0) | (12.3) | | Of which, Individuals (including Hindu undivided Families) | 28,660 | 33,314 | 40,468 | 44,199 | 50,930 | | | (14.5) | (16.2) | (21.5) | (9.2) | (15.2) | | V. Foreign Sector | 2,097 | 2,960 | 5,348 | 6,475 | 7,643 | | | (7.7) | (41.2) | (80.7) | (21.1) | (18.0) | | Of which, Non-Residents | 1,951 | 2,811 | 5,013 | 5,807 | 7,461 | | | (10.2) | (44.1) | (78.3) | (15.8) | (28.5) | | Total Deposits | 64,110 | 71,466 | 81,310 | 89,727 | 98,413 | | | (15.1) | (11.5) | (13.8) | (10.4) | (9.7) | | Note: Figures in brackets represent the annual growth rates. The estimates for March 2011 were not released. Therefore, the growth rates for 2012 are the compounded annual growth rates (CAGR) over 2010. |
| Table 2: Composition of Types of Deposits According to Institutional Ownership | | (Per cent) | | Types of Deposits/ Sector of the Economy | Current | Savings | Term | Total | | 2015 | 2016 | 2015 | 2016 | 2015 | 2016 | 2015 | 2016 | | I. Government Sector | 14.8 | 16.0 | 11.3 | 9.8 | 15.5 | 13.7 | 14.4 | 12.8 | | II. Non-Financial Private Corporate Sector | 25.0 | 30.6 | 0.7 | 0.6 | 11.7 | 12.4 | 10.1 | 10.8 | | III. Financial Sector | 11.8 | 15.4 | 0.4 | 0.3 | 10.8 | 8.7 | 8.2 | 7.0 | | IV. Household Sector | 46.1 | 36.7 | 83.1 | 83.7 | 53.0 | 55.6 | 60.1 | 61.5 | | V. Foreign Sector | 2.3 | 1.3 | 4.5 | 5.6 | 9.0 | 9.6 | 7.2 | 7.8 | | Total Deposits | 100.0 | 100.0 | 100.0 | 100.0 | 100.0 | 100.0 | 100.0 | 100.0 | Households had the largest shares across all types of deposits 6. The contribution of various institutional sectors in different types of deposits indicated that the household sector, also held the largest shares across all three types of deposits, viz., current, savings and term deposits as on March 31, 2016 (Table 2). Around 37 per cent of the current deposits, 84 per cent of the savings deposits and 56 per cent of the term deposits are held by the households. Non-financial private corporate sector was the second largest contributor in the current deposits followed by the Government sector. On the other hand, the Government sector was the second largest contributor in term deposits followed by the non-financial corporate sector. Term deposits constituted major part of total deposits across all institutional sectors; Current and savings accounts (CASA) constitute more than 40 per cent of households’ deposits 7. During 2012-16, more than two-third of total deposits were of fixed tenure (i.e., term deposits) across all institutional sectors except for the households sector where term deposits constituted 56-58 per cent (Table 3). Savings deposits was the second major constituent in all the sectors except for non-financial private corporate and financial sectors, where current deposits was the second most important constituent with savings deposits having a negligible share. | Table 3: Composition of Deposits by Various Institutional Sectors | | (Per cent) | Year
(As on March 31) | Sector/ Type of Deposits | Government
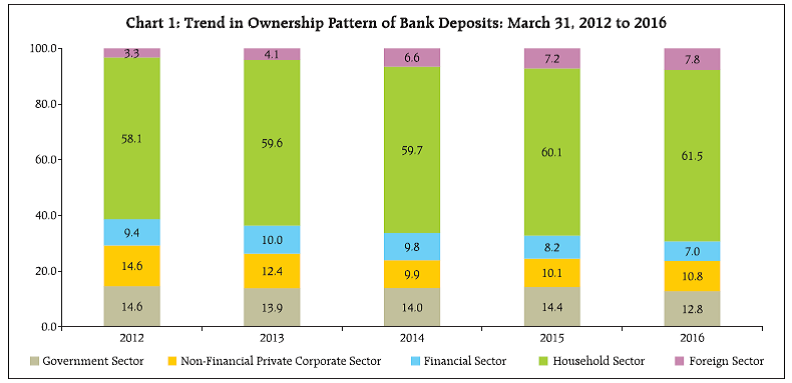
Sector | Private Corporate Sector (Non-Financial) | Financial
Sector | Household
Sector | Foreign Sector | Total | | | Current | 12.1 | 22.0 | 12.3 | 7.8 | 6.1 | 10.8 | | 2012 | Savings | 18.7 | 3.0 | 1.4 | 36.3 | 33.0 | 25.5 | | | Term | 69.2 | 75.0 | 86.2 | 55.9 | 60.8 | 63.6 | | | Total | 100.0 | 100.0 | 100.0 | 100.0 | 100.0 | 100.0 | | | Current | 12.1 | 22.9 | 11.7 | 6.8 | 3.8 | 9.9 | | 2013 | Savings | 18.1 | 2.2 | 1.1 | 36.5 | 24.5 | 25.7 | | | Term | 69.8 | 74.9 | 87.2 | 56.7 | 71.7 | 64.5 | | | Total | 100.0 | 100.0 | 100.0 | 100.0 | 100.0 | 100.0 | | | Current | 9.6 | 24.7 | 10.8 | 6.3 | 4.5 | 8.9 | | 2014 | Savings | 19.4 | 1.6 | 0.9 | 36.7 | 20.2 | 26.2 | | | Term | 70.9 | 73.7 | 88.3 | 57.0 | 75.4 | 64.9 | | | Total | 100.0 | 100.0 | 100.0 | 100.0 | 100.0 | 100.0 | | | Current | 9.6 | 23.0 | 13.3 | 7.1 | 3.0 | 9.3 | | 2015 | Savings | 20.1 | 1.8 | 1.3 | 35.4 | 16.0 | 25.6 | | | Term | 70.3 | 75.2 | 85.4 | 57.5 | 81.0 | 65.1 | | | Total | 100.0 | 100.0 | 100.0 | 100.0 | 100.0 | 100.0 | | | Current | 11.3 | 25.6 | 19.7 | 5.4 | 1.5 | 9.0 | | 2016 | Savings | 20.7 | 1.5 | 1.1 | 36.9 | 19.5 | 27.1 | | | Term | 68.0 | 72.9 | 79.2 | 57.7 | 79.0 | 63.8 | | | Total | 100.0 | 100.0 | 100.0 | 100.0 | 100.0 | 100.0 | 8. Households are keeping around 42 per cent of their total deposits in current and savings accounts (CASA) (having lower interest rates), which constitute a quite stable and cheaper source of funds for banks. While Government sector keeps around 32 per cent of their total deposits in the form of CASA, the share in the case of non-financial private corporate sector is around 27 per cent. Households contributed maximum deposits across all population groups4 9. Households also remained the major owner of bank deposits across all population groups (Table 4) with shares varying between 48.5 per cent in metropolitan branches and 89.8 per cent in rural branches. In the metropolitan area, other notable contributing sectors were non-financial private corporate sector (17.0 per cent), Government sector (14.7 per cent) and financial sector (10.7 per cent). | Table 4: Institution X Population Group-wise Ownership of Deposits – March 31, 2016 | | (Amounts in ₹ Billion; Shares in per cent) | | Major Institutional Sectors | Rural | Semi- urban | Urban | Metro- politan | Total | | I. Government Sector | 594 | 1,461 | 3,118 | 7,447 | 12,620 | | | (5.8) | (9.7) | (13.9) | (14.7) | (12.8) | | II. Private Corporate Sector (Non- Financial) | 138 | 458 | 1,444 | 8,616 | 10,656 | | | (1.4) | (3.0) | (6.4) | (17.0) | (10.8) | | III. Financial Sector | 77 | 356 | 1,053 | 5,437 | 6,923 | | | (0.8) | (2.4) | (4.7) | (10.7) | (7.0) | | IV. Household Sector | 9,159 | 11,560 | 15,275 | 24,577 | 60,571 | | | (89.8) | (76.5) | (68.2) | (48.5) | (61.5) | | V. Foreign Sector | 227 | 1,282 | 1,504 | 4,630 | 7,643 | | | (2.2) | (8.5) | (6.7) | (9.1) | (7.8) | | Total Deposits | 10,195 | 15,117 | 22,393 | 50,708 | 98,413 | | | (100.0) | (100.0) | (100.0) | (100.0) | (100.0) | | Note: Population group are based on Census 2001. Figures in parentheses represent shares. | Share of savings deposits by households in metropolitan areas increased 10. Share of term deposits in total households’ deposits either increased or remained same across various population groups during 2015-16 (Chart 2). Share of savings deposits, however, increased across all population groups (0.8 percentage points in rural and urban areas; 1 percentage point in semi-urban areas and 2.2 percentage points in metropolitan areas). As such, the share of current deposits by household sector shrunk across all population groups. 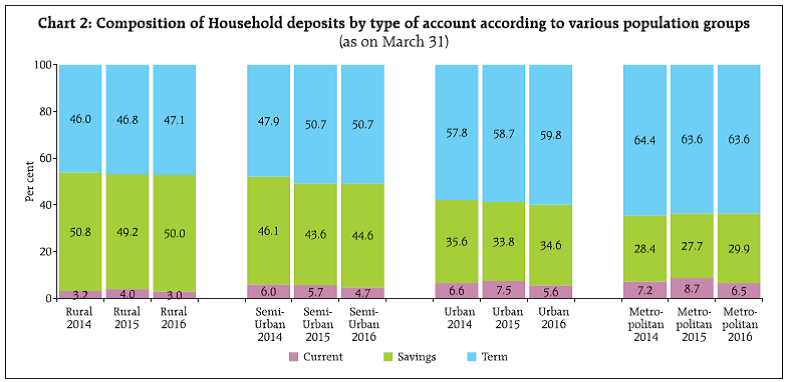
| Table 5: Bank Group Wise Pattern of Ownership of Deposits – March 31, 2016 | | (Amounts in ₹ Billion; Share in Per cent) | | Bank Group/Sector of the Economy | State Bank of India & its Associates | Natina-lised Banks | Regional Rural Banks | Private Sector Banks | Foreign Banks | All Scheduled Commercial Banks | | I. Government Sector | 3,985 | 7,271 | 157 | 1,197 | 9 | 12,620 | | | {18.3} | {15.2} | {5.1} | {5.6} | {0.2} | {12.8} | | | (31.6) | (57.6) | (1.2) | (9.5) | (0.1) | (100.0) | | II. Private Corporate Sector (Non-Financial) | 1,458 | 2,545 | 20 | 4,297 | 2,335 | 10,656 | | | {6.7} | {5.3} | {0.6} | {20.2} | {50.9} | {10.8} | | | (13.7) | (23.9) | (0.2) | (40.3) | (21.9) | (100.0) | | III. Financial Sector | 456 | 3,725 | 58 | 2,270 | 414 | 6,923 | | | {2.1} | {7.8} | {1.9} | {10.7} | {9.0} | {7.0} | | | (6.6) | (53.8) | (0.8) | (32.8) | (6.0) | (100.0) | | IV. Household Sector | 14,055 | 32,173 | 2,845 | 10,754 | 743 | 60,571 | | | {64.6} | {67.4} | {92.2} | {50.6} | {16.2} | {61.5} | | | (23.2) | (53.1) | (4.7) | (17.8) | (1.2) | (100.0) | | V. Foreign Sector | 1,787 | 2,034 | 7 | 2,731 | 1,083 | 7,643 | | | {8.2} | {4.3} | {0.2} | {12.9} | {23.6} | {7.8} | | | (23.4) | (26.6) | (0.1) | (35.7) | (14.2) | (100.0) | | Total Deposits | 21,742 | 47,749 | 3,087 | 21,251 | 4,585 | 98,413 | | | {100.0} | {100.0} | {100.0} | {100.0} | {100.0} | {100.0} | | | (22.1) | (48.5) | (3.1) | (21.6) | (4.7) | (100.0) | Note: 1. Figures in curly brackets represent composition of deposits of a bank group across institutional sectors.
2. Figures in parentheses represent composition of deposits kept by an institutional sector across bank groups. | Non-financial private corporate sector constitutes more than half of the total deposits of foreign banks 11. As on March 31, 2016, households accounted for the highest share in total deposits in all the bank groups except for the foreign banks’ group, where the non-financial private corporate sector held the largest share of deposits (Table 5). In foreign banks, foreign sector was the second largest contributor of total deposits. Target groups for different bank groups varied 12. Around 89 per cent of the Government deposits were with the public sector banks. Around 60 per cent of financial sector’s deposits were kept with the nationalised banks followed by another one-third kept with private sector banks. Non-financial private corporate sector preferred private sector banks for keeping their deposits (40 per cent), followed by public sector banks (38 per cent) and foreign banks (22 per cent). More than three-fourth of the household deposits, especially of individuals (largest constituent of household sector) were with the public sector banks, perhaps on account of wider network of these banks across the country. Another 18 per cent of households’ deposits were with private sector banks (Table 5). Deposits of non-household sectors concentrated in a few states 13. Households maintained dominant contribution in total bank deposits, but with varying degree, in different regions (Table 65). Their share in total deposits in the Central Region was the highest at 76 per cent (with the constituent states/ union territories having the share in the range between 69 and 81 per cent), followed by the North Eastern Region at 73.3 per cent (with the constituents’ having the share ranging between 63 to 77 per cent) and Eastern Region at 72.5 per cent (share varying between 61 to 76 per cent). The share of households in total deposits was comparatively lower in the Northern Region (64.0 per cent), the Southern Region (61.0 per cent) and in the Western Region (48.1 per cent). In these regions, Government sector, non-financial private corporate sector, and other sectors also had sizeable shares. 14. Of the total deposits by non-fi nancial private corporates, 60.1 per cent was concentrated in three states, namely, Maharashtra (33.6 per cent), Delhi (15.8 per cent), and Karnataka (10.8 per cent). Maharashtra contributed around 62 per cent in total bank deposits of the fi nancial sector, mainly due to concentration of fi nancial business in Mumbai. Moreover, Maharashtra and Delhi together contributed around 38 per cent of total Government deposits. In the total foreign sector deposits, Maharashtra contributed to 34.8 per cent followed by Kerala (17.8 per cent), Delhi (8.1 per cent), Gujarat (7.1 per cent), Karnataka (6.4 per cent) and Tamil Nadu (6.4 per cent). | Table 6: Region-wise Ownership Pattern of Deposits across Institutional Sectors – March 2016 | | (Amounts in ₹ Billion; Shares in per cent) | | Region/ State/ Union Territory | Government Sector | Foreign Sector | Private Corporate Sector (Non-Financial) | Financial sector | Household Sector | Total | | Northern Region | 3,060 | 1,185 | 2,238 | 779 | 12,906 | 20,168 | | | (15.2) | (5.9) | (11.1) | (3.9) | (64.0) | (100.0) | | | {24.3} | {15.5} | {21.0} | {11.2} | {21.3} | {20.5} | | Of which, NCT of Delhi | 2,288 | 622 | 1,688 | 488 | 4,780 | 9,866 | | | (23.2) | (6.3) | (17.1) | (5.0) | (48.4) | (100.0) | | | {18.1} | {8.1} | {15.8} | {7.1} | {7.9} | {10.0} | | Punjab | 148 | 275 | 58 | 85 | 2,423 | 2,989 | | | (5.0) | (9.2) | (1.9) | (2.9) | (81.1) | (100.0) | | | {1.2} | {3.6} | {0.5} | {1.2} | {4.0} | {3.0} | | North-Eastern Region | 335 | 7 | 47 | 75 | 1,274 | 1,738 | | | (19.3) | (0.4) | (2.7) | (4.3) | (73.3) | (100.0) | | | {2.7} | {0.1} | {0.4} | {1.1} | {2.1} | {1.8} | | Eastern Region | 2,010 | 241 | 815 | 394 | 9,203 | 12,664 | | | (15.9) | (1.9) | (6.4) | (3.1) | (72.7) | (100.0) | | | {15.9} | {3.2} | {7.7} | {5.7} | {15.2} | {12.9} | | Of which, West Bengal | 747 | 156 | 502 | 146 | 4,650 | 6,201 | | | (12.0) | (2.5) | (8.1) | (2.4) | (75.0) | (100.0) | | | {5.9} | {2.0} | {4.7} | {2.1} | {7.7} | {6.3} | | Central Region | 1,454 | 219 | 935 | 403 | 9,631 | 12,644 | | | (11.5) | (1.7) | (7.4) | (3.2) | (76.2) | (100.0) | | | {11.5} | {2.9} | {8.8} | {5.8} | {15.9} | {12.8} | | Of which, Uttar Pradesh | 740 | 145 | 401 | 239 | 6,123 | 7,648 | | | (9.7) | (1.9) | (5.2) | (3.1) | (80.1) | (100.0) | | | {5.9} | {1.9} | {3.8} | {3.4} | {10.1} | {7.8} | | Western Region | 2,894 | 3,338 | 4,016 | 4,486 | 13,625 | 28,358 | | | (10.2) | (11.8) | (14.2) | (15.8) | (48.0) | (100.0) | | | {22.9} | {43.7} | {37.7} | {64.8} | {22.5} | {28.8} | | Of which, Gujarat | 305 | 545 | 392 | 176 | 3,907 | 5,325 | | | (5.7) | (10.2) | (7.4) | (3.3) | (73.4) | (100.0) | | | {2.4} | {7.1} | {3.7} | {2.5} | {6.5} | {5.4} | | Maharashtra | 2,547 | 2,659 | 3,583 | 4,283 | 9,320 | 22,392 | | | (11.4) | (11.9) | (16.0) | (19.1) | (41.6) | (100.0) | | | {20.2} | {34.8} | {33.6} | {61.9} | {15.4} | {22.8} | | Southern Region | 2,866 | 2,652 | 2,604 | 786 | 13,933 | 22,841 | | | (12.5) | (11.6) | (11.4) | (3.4) | (61.0) | (100.0) | | | {22.7} | {34.7} | {24.4} | {11.3} | {23.0} | {23.2} | | Of which, Karnataka | 913 | 488 | 1,152 | 217 | 4,339 | 7,109 | | | (12.8) | (6.9) | (16.2) | (3.0) | (61.0) | (100.0) | | | {7.2} | {6.4} | {10.8} | {3.1} | {7.2} | {7.2} | | Kerala | 208 | 1,360 | 113 | 170 | 1,886 | 3,738 | | | (5.6) | (36.4) | (3.0) | (4.6) | (50.5) | (100.0) | | | {1.6} | {17.8} | {1.1} | {2.5} | {3.1} | {3.8} | | Tamil Nadu | 439 | 486 | 762 | 202 | 4,194 | 6,084 | | | (7.2) | (8.0) | (12.5) | (3.3) | (68.9) | (100.0) | | | {3.5} | {6.4} | {7.2} | {2.9} | {6.9} | {6.2} | | Telangana | 974 | 218 | 497 | 142 | 1,791 | 3,621 | | | (26.9) | (6.0) | (13.7) | (3.9) | (49.5) | (100.0) | | | {7.7} | {2.8} | {4.7} | {2.0} | {3.0} | {3.7} | | All-India | 12,620 | 7,643 | 10,656 | 6,923 | 60,571 | 98,413 | | | (12.8) | (7.8) | (10.8) | (7.0) | (61.5) | (100.0) | | | {100.0} | {100.0} | {100.0} | {100.0} | {100.0} | {100.0} | | Note: Figures in parentheses indicate institutional composition of bank deposits across Regions/ States. Figures in curly brackets represent contribution of states in total institutional deposits. |
|