The aggregated sales of the private non-financial corporate business sector grew by 1.4 per cent in H1:2016-17 after contractions during H2:2014-15 and H1: 2015-16 and stagnation in H2:2015-16. Falling raw-material prices that boosted nominal GVA and operating profit growth (Y-o-Y) since H2:2014-15, witnessed a reversal in trend in H1:2016-17. Higher sales growth and support from other income, however, helped to maintain a stable GVA growth. Operating profit margin improved to reach the highest level in past seven half-years. An analysis of the performance of listed non-financial private corporates over the quarters revealed that the slowdown in the aggregate sales growth (Y-O-Y) was arrested in Q4:2015-16, but the sales stagnated again in Q1:2016-17 before some improvement was seen in Q2:2016-17. In the first two quarters of 2016-17, operating and net profit margins remained higher than the long term quarterly average since 2010-11. The manufacturing sector turned around in terms of major performance parameters in H1:2016-17. Sales of ‘Petroleum Products’ and the ‘Iron & Steel’ industries, which were contracting heavily since H2:2014-15, continued to contract, but at a much lower rate. The ‘Textiles’ industry improved in terms of sales growth. The risk profile of the manufacturing sector improved significantly mainly due to reduction in debt held by vulnerable ‘Iron & Steel’ companies in H1:2016-17. Analysis of the sources and uses of funds by the manufacturing sector in H1:2016-17 revealed that a sizeable portion of funds may have been sourced from retained profits reflecting in the accretion to reserves and surplus. Reduction in assets held in the form of loans and advances also contributed towards the source of funds . These funds were mainly used for creation of gross fixed assets in H1:2016-17. Sales of the Services (Non-IT) sector contracted for the first time in previous seven half years. Slowdown of the performance of the IT sector was observed in H1:2016-17 compared with the previous half year. This article analyses the performance of listed nonfinancial companies during the first half (April- September) of 2016-17, based on the earnings results of 2,880 listed non-government non-financial (NGNF) companies. Other important financial statements including the balance sheets as available have also been referred. To analyse the trends in major performance parameters, a longer time-horizon is considered. Besides analysing the aggregate performance, the article provides a brief analysis by sector and major industry groups. The analysis is primarily based on various ratios and year on year (Y-o-Y) growth rates for the common set of companies derived from the profit & loss statements and balance sheets of companies. Detailed quarterly data has been made available periodically in the website of the Reserve Bank of India (Data for Q2:2016-17 has been released on 4th January 2016). 1. Sales growth improved; profit margins at long term high levels 1.1. Sales of 2,880 companies at the aggregate level grew by 1.4 per cent in H1:2016-17 after contractions during H2:2014-15 and H1: 2015-16 and stagnation in H2:2015-16. However, successive contractions in expenditure since H2:2014-15 got reversed in H1:2016- 17,reflecting similar trend in global commodity prices. Though, out of contractions, both sales and expenditure growth remained low when viewed over a longer horizon (Chart 1, Table 1). 1.2. Despite higher growth rate in expenditure, nominal GVA growth remained stable in H1:2016-17 as compared with the GVA growth in H2:2015-16 (Table 1). Revival in sales growth and higher support from other income helped to maintain the GVA growth rate (Table 1). 1.3. Growth in operating profit decelerated significantly in H1:2016-17 compared with H2:2015-16 while the net profit growth was maintained (Table 1). However, both operating and net profit growth rates remained higher than the corresponding levels observed during H2:2014-15 and H1:2015-16 (Table 1, 2). | Table 1: Performance of the Listed Non-Government Non-Financial Companies | | Period | H1: 2015-16* | H2: 2015-16 | H1: 2016-17 | H1: 2016-17 | | Items | Y-o-Y Growth @ in Per cent | Amount (₹ billion) | | 1 | 2 | 3 | 4 | | No. of companies | 2,846 | 2,577 | 2,880 | 2,880 | | Sales | -3.5 | 0.2 | 1.4 | 14,706 | | Value of Production | -4.1 | -1.0 | 1.6 | 14,746 | | GVA | 6.3 | 9.1 | 9.1 | 4,592 | | Expenditure | -5.8 | -3.2 | 0.4 | 12,253 | | CRM ** | -15.7 | -10.7 | -1.4 | 5,542 | | Staff Cost | 9.8 | 7.4 | 9.9 | 1,631 | | Power & fuel | -3.2 | -4.4 | -8.9 | 512 | | Operating Profits | 6.8 | 13.4 | 8.2 | 2,492 | | Other Income@@ | -4.9 | -5.9 | 11.2 | 469 | | Depreciation | 4.1 | 8.4 | 8.8 | 646 | | Gross Profits (EBIT) | 4.8 | 10.5 | 8.7 | 2,316 | | Interest | 9.3 | 5.0 | 2.3 | 625 | | Earnings before tax (EBT)^ | 1.4 | 8.2 | 15.0 | 1,725 | | Tax provision | 7.3 | -4.2 | 15.8 | 487 | | Net Profits^ | -0.7 | 14.4 | 14.7 | 1,239 | | Paid-up Capital | 4.4 | 4.2 | 3.4 | 1,325 | * : Published in February 2016 issue of the RBI Bulletin.
@ : Growth rates calculated on the basis of common set of companies during any period.
** : CRM : Consumption of Raw Materials.
@@ : Includes forex gain while forex losses are included in Expenditure.
^ : Adjusted for non-operating surplus/deficit. |
| Table 2 : Important Performance Parameters of Listed Non-Government Non-Financial Companies | | (Per cent) | | Period | No. of Companies | Sales Growth | Expenditure Growth | GVA Growth | Operating Profit Growth | Net Profit Growth | Operating Profit Margin | Net Profit Margin | | 1 | 2 | 3 | 4 | 5 | 6 | 7 | 8 | | H1:2013-14 | 2,731 | 5.4 | 5.6 | 5.2 | -0.8 | -14.9 | 12.5 | 5.2 | | H2:2013-14 | 2,864 | 4.7 | 4.8 | 5.8 | 1.6 | -4.9 | 12.3 | 5.1 | | H1:2014-15 | 2,965 | 5.8 | 5.0 | 11.3 | 12.6 | 32.6 | 13.7 | 6.8 | | H2:2014-15 | 2,585 | -2.3 | -2.8 | 5.3 | 2.0 | -21.0 | 13.6 | 5.1 | | H1:2015-16 | 2,846 | -3.5 | -5.8 | 6.3 | 6.8 | -0.7 | 15.3 | 7.2 | | H2:2015-16 | 2,577 | 0.2 | -3.2 | 9.1 | 13.4 | 14.4 | 15.0 | 5.6 | | H1:2016-17 | 2,880 | 1.4 | 0.4 | 9.1 | 8.2 | 14.7 | 16.9 | 8.4 | 1.4. Operating and net profit margins, stood at the highest level since H1:2013-14, indicating sustained profitability of the private corporate sector (Table 2). 2. Operating Profit Margins improved across size groups 2.1. The listed companies have been classified into three size groups according to their sales in the respective period. Companies having annualised sales more than ₹10 billion, between ₹1 billion to ₹10 billion and less than ₹1 billion are classified as large, medium and small, respectively. 2.2. Large companies and medium sized companies showed an improvement in sales growth in H1:2016- 17, after near stagnation observed in H2:2015-16. Small companies, as a whole, indicated no signs of improvement (Table 3). It may, however, be noted that the method of classification (referred in section 2.1) creates a downward bias in the sales growth of small-sized companies. Companies migrate to a lower size class when sales decline and companies migrate to a higher size class when sales increase. Barring these migrations, small companies showed lower rate of sales contraction in H2:2015-16 and H1:2016-17 as compared with the previous two half years. 2.3. Operating profit growth improved significantly for the large and the medium sized companies in H2:2015- 16 and moderated subsequently in H1:2016-17. 2.4. Operating profit margins improved across all size groups. Net profit margins improved for the large and the medium sized companies while the extent of losses narrowed for the small companies. | Table 3 : Size Class wise Performance Parameters of Listed Non-Government Non-Financial Companies | | (Per cent) | | Period | Large | Medium | Small | | Sales Growth | Operating Profit Growth | Net Profit Growth | Operating Profit Margin | Net Profit Margin | Sales Growth | Operating Profit Growth | Net Profit Growth | Operating Profit Margin | Net Profit Margin | Sales Growth | Operating Profit Growth | Net Profit Growth | Operating Profit Margin | Net Profit Margin | | 1 | 2 | 3 | 4 | 5 | 6 | 7 | 8 | 9 | 10 | 11 | 12 | 13 | 14 | 15 | | H1:2013-14 | 6.7 | 2.0 | -10.4 | 13.0 | 6.0 | 0.3 | -16.8 | -56.1 | 10.0 | 1.4 | -19.1 | -56.8 | $ | 4.1 | -7.8 | | H2:2013-14 | 6.4 | 7.4 | 4.1 | 13.4 | 6.7 | -1.7 | -38.5 | @ | 6.3 | -2.6 | -25.8 | @ | $ | -5.9 | -25.0 | | H1:2014-15 | 7.5 | 13.2 | 31.4 | 14.4 | 7.9 | -0.8 | 5.6 | 52.1 | 9.5 | 1.0 | -24.3 | 33.2 | $ | 4.9 | -12.1 | | H2:2014-15 | -1.7 | 2.8 | -16.5 | 14.7 | 6.6 | -5.4 | -2.9 | $ | 7.4 | -3.3 | -15.0 | @ | $ | -2.6 | -23.9 | | H1:2015-16 | -3.1 | 8.1 | 0.1 | 16.2 | 8.5 | -3.5 | -0.7 | @ | 9.3 | -0.5 | -23.6 | -70.9 | $ | 2.5 | -16.0 | | H2:2015-16 | 0.7 | 13.4 | 14.7 | 16.4 | 7.5 | -1.3 | 37.2 | $ | 9.0 | -1.5 | -18.1 | $ | $ | -21.7 | -60.3 | | H1:2016-17 | 1.9 | 8.0 | 14.9 | 17.9 | 9.6 | 1.9 | 12.6 | 23.3 | 11.6 | 2.5 | -22.8 | -34.4 | $ | 2.4 | -18.3 | @: Denominator negligible
$: Denominator negative | 3. Turnaround in performance of the Manufacturing sector 3.1. Manufacturing sector witnessed a turnaround in terms of sales growth in H1:2016-17 on the back of successive contractions in the previous three half years. Improvement in sales growth was mainly due to much lower contractions in the sales of ‘Petroleum Products’ and ‘Iron & Steel’ industries. The manufacturing sector also recorded highest growth in operating profits and nominal GVA in H1:2016-17 over the previous seven half years, aided by the reversal in trend of sales growth. This sector registered the highest profit margins in the current half year since H1:2013- 14 (Table 4). 3.2. Contraction was observed in the sales of the Services (Non-IT) sector in the first half of 2016-17. This contraction was the first instance in the last seven half years, which impacted growth in operating profits and nominal GVA as well. However, operating profit margin stood at similar level as observed in the previous half year. Net profit margin improved after declining in second half of 2015-16. 3.3. In H1:2016-17, the IT sector could not sustain the robust performance in terms of growth in sales, operating profit and nominal GVA observed in the previous half year. The operating profit margin of this sector also continued its declining trend since H2:2013-14. 4. Improvement in the Risk Profile of the Manufacturing sector 4.1. The half-yearly financial statements of 1,694 common manufacturing companies over the last five half years were analysed to study the trends in debt (long-term plus short-term borrowings) held by the vulnerable set of companies, i.e., those companies having debt-equity ratio greater than 200 per cent and interest coverage ratio less than one. Companies having negative net worth were also considered as vulnerable. The number of vulnerable manufacturing companies slightly increased in H1:2016-17 compared with H1:2015-16. However, the debt held by these companies (‘debt at risk’) decreased significantly in the current half year compared with H1:2015-16. The share of ‘debt at risk’ in the total debt of 1,694 companies also reduced significantly and stood at 21.2 per cent in H1:2016-17 compared with 26.8 per cent in H1:2015-16. Thus, there is a clear indication of improvement in the risk profile of the manufacturing sector in the first half of 2016-17 (Table 5). | Table 4 : Sector wise Performance Parameters of Listed Non-Government Non-Financial Companies | | (Per cent) | | Period | Manufacturing | Services (Non-IT) | IT | | Sales Growth | GVA Growth | Oper- ating Profit Gro-wth | Net Profit Gro-wth | Oper- ating Profit Margin | Net
Profit Margin | Sales Gro-wth | GVA Gro-wth | Oper- ating Profit Gro-wth | Net Profit Gro-wth | Oper- ating Profit Margin | Net Profit Margin | Sales Gro-wth | GVA Gro-wth | Oper- ating Profit Gro-wth | Net Profit Gro-wth | Oper- ating Profit Margin | Net Profit Margin | | 1 | 2 | 3 | 4 | 5 | 6 | 7 | 8 | 9 | 10 | 11 | 12 | 13 | 14 | 15 | 16 | 17 | 18 | | H1:2013-14 | 4.2 | 2.2 | -3.6 | -15.3 | 10.6 | 4.5 | 8.0 | 1.0 | -5.2 | -31.3 | 16.6 | 3.9 | 19.1 | 21.0 | 21.8 | 14.9 | 27.6 | 20.3 | | H2:2013-14 | 4.7 | 4.6 | 1.8 | -7.9 | 10.8 | 4.5 | 3.0 | -8.9 | -19.3 | -86.9 | 13.0 | 0.4 | 21.1 | 22.6 | 33.1 | 33.5 | 28.1 | 21.2 | | H1:2014-15 | 5.6 | 11.1 | 12.1 | 32.1 | 11.4 | 5.4 | 4.0 | 19.1 | 17.3 | 99.3 | 18.6 | 8.2 | 11.4 | 10.7 | 11.8 | 26.7 | 27.5 | 22.9 | | H2:2014-15 | -4.7 | 1.0 | -1.4 | -32.1 | 11.6 | 3.8 | 11.1 | 34.1 | 49.7 | $ | 18.4 | 5.8 | 8.2 | 11.4 | 3.4 | -3.6 | 26.9 | 19.7 | | H1:2015-16 | -6.4 | 7.5 | 7.6 | -0.5 | 13.3 | 6.0 | 7.0 | 7.5 | 19.1 | -19.6 | 19.9 | 5.7 | 10.9 | 8.9 | 6.1 | 15.1 | 27.0 | 24.3 | | H2:2015-16 | -1.3 | 9.5 | 11.9 | 30.7 | 12.7 | 4.4 | 2.6 | 10.6 | 20.3 | -27.1 | 21.8 | 4.4 | 12.0 | 9.3 | 16.3 | 9.7 | 26.3 | 20.7 | | H1:2016-17 | 1.9 | 12.3 | 12.3 | 29.3 | 15.1 | 7.9 | -2.1 | 6.7 | 5.4 | -20.7 | 21.4 | 5.3 | 9.2 | 8.6 | 6.2 | 5.9 | 25.8 | 21.4 | | $: Denominator negative |
| Table 5 : Debt at Risk –Listed Manufacturing & Construction Companies | | Period | No of vulnerable companies | Debt at risk
(₹ Billion) | Total Debt
(₹ Billion) | Share of debt at risk
(Per cent) | No of vulnerable companies | Debt at risk
(₹ Billion) | Total Debt
(₹ Billion) | Share of debt at risk
(Per cent) | No of vulnerable companies | Debt at risk
(₹ Billion) | Total Debt
(₹ Billion) | Share of debt at risk
(Per cent) | | Manufacturing | ‘Iron & Steel’ | ‘Construction’ | | No. of Companies | 1,694 | 142 | 151 | | 1 | 2 | 3 | 4 | 5 | 6 | 7 | 8 | 9 | 10 | 11 | 12 | | H1:2014-15 | 263 | 1,361 | 5,985 | 22.7 | 31 | 496 | 1,518 | 32.7 | 24 | 296 | 1,210 | 24.5 | | H2:2014-15 | 271 | 1,661 | 6,290 | 26.4 | 39 | 802 | 1,589 | 50.5 | 19 | 280 | 1,249 | 22.4 | | H1:2015-16 | 276 | 1,677 | 6,264 | 26.8 | 38 | 794 | 1,636 | 48.5 | 26 | 368 | 1,339 | 27.5 | | H2:2015-16 | 273 | 1,469 | 6,445 | 22.8 | 40 | 730 | 1,696 | 43.0 | 28 | 412 | 1,390 | 29.7 | | H1:2016-17 | 278 | 1,398 | 6,578 | 21.2 | 40 | 626 | 1,702 | 36.7 | 31 | 460 | 1,410 | 32.6 | 4.2. Number of companies and their share in debt in various Interest Coverage Ratio (ICR) classes, revealed that there have been an increase in the number of manufacturing companies having ICR greater than or equal to 3, from H1:2014-15 to H1:2016-17. Further, around 32 per cent of the overall debt in the sample is held by these companies in H1:2016-17. Slight reduction in share of debt held by companies having weak ICR (i.e., ICR less than 1 or negative EBIT) is also observed in the current half year as compared with H1:2015-16 (Table 6A). 4.3. Number of companies and their share in debt in various Leverage Ratio (Debt to Equity) classes provided further evidence towards the strengthening of the risk profile of the manufacturing sector in H1:2016-17. There has been an increase in number of low leveraged companies (zero debt or debt to equity ratio less than 100 per cent) in the current half year. Also, share of debt held by highly leveraged (greater than 300 per cent) or negative net worth companies remained around the same level in H1:2016-17 compared with H1:2015-16 (Table 6B). 4.4. The risk profile of the ‘Iron & Steel’ companies was a major cause of concern and contributed heavily towards the worsening of the risk profile of the manufacturing sector in 2015-16. However in the first half of 2016-17, this industry exhibited significant recovery in terms of ‘debt at risk’. The share of ‘debt at risk’ out of total debt of 142 common ‘Iron & Steel’ companies reduced to 36.7 per cent in H1:2016-17 compared with 48.5 per cent in H1:2015-16 (Table 5). | Table 6A : Distribution of Debt according to Interest Coverage Ratio (ICR) of listed Manufacturing Companies | | | No of companies | Debt held
(₹ Billion) | Share of debt held
(Per cent) | No of companies | Debt held
(₹ Billion) | Share of debt held (Per cent) | No of companies | Debt held
(₹ Billion) | Share of debt held (Per cent) | | Period | H1:2014-15 | H1:2015-16 | H1:2016-17 | | ICR Class | 1 | 2 | 3 | 4 | 5 | 6 | 7 | 8 | 9 | | EBIT <0 | 254 | 1,101 | 18.4 | 264 | 1,194 | 19.1 | 260 | 1,037 | 15.8 | | 0-1 | 153 | 829 | 13.8 | 135 | 902 | 14.4 | 106 | 1,032 | 15.7 | | 1-2 | 339 | 1,401 | 23.4 | 317 | 1,941 | 31.0 | 282 | 1,121 | 17.0 | | 2-3 | 159 | 698 | 11.7 | 166 | 427 | 6.8 | 142 | 1,156 | 17.6 | | >=3 | 535 | 1,943 | 32.5 | 544 | 1,784 | 28.5 | 627 | 2,113 | 32.1 | | Zero Interest | 254 | 14 | 0.2 | 268 | 16 | 0.3 | 277 | 119 | 1.8 | | Total | 1,694 | 5,985 | 100.0 | 1,694 | 6,264 | 100.0 | 1,694 | 6,578 | 100.0 |
| Table 6B : Distribution of Debt according to Leverage Ratio (Debt to Equity) of listed Manufacturing Companies | | | No of companies | Debt held
(₹ Billion) | Share of debt held
(Per cent) | No of companies | Debt held
(₹ Billion) | Share of debt held
(Per cent) | No of companies | Debt held
(₹ Billion) | Share of debt held
(Per cent) | | Period | H1:2014-15 | H1:2015-16 | H1:2016-17 | | Leverage Class | 1 | 2 | 3 | 4 | 5 | 6 | 7 | 8 | 9 | | Zero Debt | 181 | - | - | 194 | - | - | 213 | - | - | | 0- 100 | 872 | 2,883 | 48.2 | 880 | 3,013 | 48.1 | 894 | 3,408 | 51.8 | | 100 – 200 | 275 | 1,441 | 24.1 | 252 | 1,320 | 21.1 | 224 | 1,476 | 22.4 | | 200-300 | 86 | 563 | 9.4 | 78 | 615 | 9.8 | 63 | 293 | 4.5 | | Above 300 | 114 | 705 | 11.8 | 112 | 695 | 11.1 | 98 | 748 | 11.4 | | Net worth <0 | 166 | 393 | 6.6 | 178 | 622 | 9.9 | 202 | 653 | 9.9 | | Total | 1,694 | 5,985 | 100.0 | 1,694 | 6,264 | 100.0 | 1,694 | 6,578 | 100.0 | 4.5. The risk profile of the ‘Construction’ industry deteriorated further in the current half year. The number of vulnerable companies and share of ‘debt at risk’ in total debt of 151 common ‘Construction’ companies increased in H1:2016-17 compared with H1:2015-16 (Table 5). 5. Increase in Gross Fixed Asset creation in the Manufacturing sector 5.1. The balance sheet size of the manufacturing companies (same set of companies mentioned in section 4.1) increased by ₹1,389 Billion (5.5 per cent) from H2:2015-16 to H1:2016-17. The corresponding increase in H1:2015-16 from H2:2014-15 was ₹852 Billion (3.6 per cent). The sources and uses of funds by the 1,694 select set of listed manufacturing companies has been compiled by taking the difference between items appearing in balance sheet ending in September and balance sheet ending in March . The sources and uses of funds results could be possibly affected by change in accounting standards and format of financial statements, a detailed explanation of which can be found in Section 8. 5.2. The sources and uses of funds derived from the balance sheets, revealed that the manufacturing sector generated funds worth ₹2,856 Billion in the current half year compared with ₹1,273 Billion in H1:2015-16. However, a sizeable portion of these funds (i.e., ₹1,194 Billion out of ₹2,856 Billion) in H1:2016-17 were sourced from decrease in long term and short term loans and advances, (i.e., loans and advances given to subsidiaries, group/associate companies, deposits with governments and others, etc.). On the positive side, increase in reserves and surplus also contributed heavily as a source of fund. Increase in reserves and surplus amounted to ₹1,240 Billion in H1:2016-17 compared with ₹739 Billion in H1:2015-16. This indicated that the manufacturing sector was able to retain greater earnings in the current half year than in H1:2015-16 (Table 7). 5.3. The funds generated by the manufacturing sector were deployed and mainly used for creation of gross fixed assets, non-current and current investments and other non-current and current assets in H1:2016-17. The increase in gross fixed assets amounted to ₹667 Billion in the current half year compared with ₹394 Billion in H1:2015-16. This is an indication of greater capital expenditures in H1:2016-17 compared with H1:2015-16. Share capital decreased by ₹36 Billion in H1:2016-17, largely due to the impact of the Indian Accounting Standards (Ind-AS). Preferential shares are required to be classified as debt instruments as per Ind-AS (Table 7). | Table 7: Sources and Uses of Funds by Listed Manufacturing Companies | | (₹ Billion) | | Sources of Funds | Uses of Funds | | Period | H1: 2015-16 | H1: 2016-17 | Period | H1: 2015-16 | H1: 2016-17 | | By Increase in Liability | By Increase in Assets | | A. Share Capital | 13 | - | I. Non-Current assets | 748 | 1,481 | | B. Reserves and Surplus | 739 | 1,240 | 12. Gross Fixed Assets | 394 | 667 | | C. Money received against share warrants | 1 | 2 | 13. Noncurrent investments | 278 | 320 | | D. Non-current liabilities | 28 | 158 | 14. Long-term loans and advances | 36 | - | | 1. Deferred tax liabilities (Net) | 17 | 121 | 15. Deferred tax assets (Net) | 31 | 46 | | 2. Other long-term liabilities | 5 | 36 | 16. Other non-current assets | 9 | 448 | | 3. Long Term provisions | 6 | 1 | J. Current assets | 193 | 1,084 | | E. Current liabilities | 403 | 261 | 17. Current investments | 0 | 266 | | 4. Short-term borrowings | - | 155 | 18. Inventories | - | 36 | | 5. Trade payables | - | 60 | 19. Trade receivables | 160 | 115 | | 6. Other current liabilities | 403 | 46 | 20. Other current assets | 33 | 667 | | F. Other equity and liabilities | - | 1 | K. Other assets | - | 18 | | TOTAL | 1,184 | 1,662 | TOTAL | 941 | 2,583 | | By Decrease in Assets | By Decrease Liability | | 7. Long-term loans and advances | - | 529 | L. Share Capital | - | 36* | | G. Current assets | 82 | 665 | M. Share application money pending allotment | 20 | 1 | | 8. Inventories | 22 | - | 21. Long-term borrowings | 25 | 22 | | 9. Cash and cash equivalents | 58 | 97 | N. Current liabilities | 274 | 215 | | 10. Short term loans and advances | 2 | 569 | 22. Short-term borrowings | 1 | - | | H. Other assets | 7 | - | 23. Trade payables | 5 | - | | TOTAL | 89 | 1,194 | 24. Short term provisions | 268 | 215 | | 11. GRAND TOTAL | 1,273 | 2,856 | O. Other equity and liabilities | 12 | - | | | | | TOTAL | 332 | 273 | | | | | 25. GRAND TOTAL | 1,273 | 2,856 | | *largely due to impact of Ind-AS as ‘preferential shares’ are treated as ‘debt’ under Ind-AS. Contra entry appearing under non-current liabilities. |
6. Mixed picture among select major industries 6.1. In the basic goods sector, sales growth of ‘Cement’ industries decelerated to 2.6 per cent in H1:2016-17 after an improvement observed in H2:2015-16. The successive contraction observed in the ‘Iron & Steel’ industry since H2:2014-15 was arrested in H1:2016-17. However, the ‘Iron & Steel’ industry is yet to witness any significant positive sales growth. Operating profit margin improved significantly for both ‘Cement’ and ‘Iron & Steel’ industry, being the highest levels for the respective industries, within the six half years under consideration (Charts 2,3). 6.2. In the consumer goods sector, ‘Motor Vehicles’ industry witnessed a moderation in sales growth in H1:2016-17 as compared with H2:2015-16. Operating profit margin however, improved in H1:2016-17 and stood at the highest level since H1:2013-14. In the ‘Pharmaceuticals and Medicine’ industry, sales growth dropped significantly in H1:2016-17. The operating profit margin picked up in H1:2016-17 after a fall in H2:2015-16. The ‘Textiles’ industry improved in term of sales growth in H1:2016-17, after successive contractions in the previous three half years. Operating profit margin also improved significantly in H1:2016-17 (Charts 4, 5 & 6). 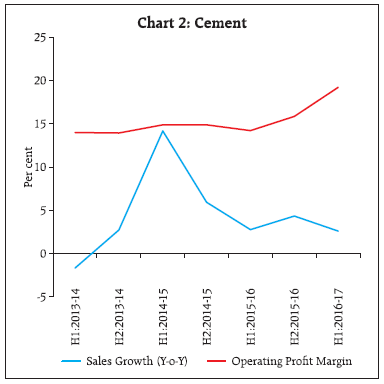 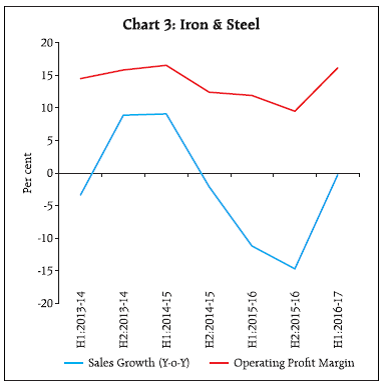 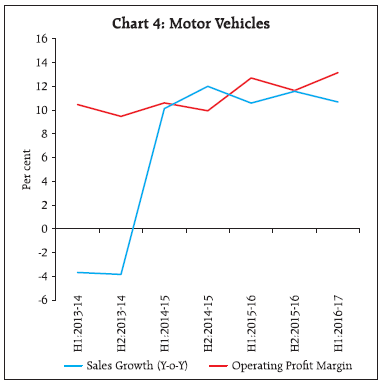 6.3. In the capital goods sector ‘Machinery’ industry decelerated in terms of sales growth in H1:2016-17 from the highest level in six half years observed in H2:2015-16. Operating profit margin also showed a marginal decline in H1:2016-17 from the previous half year. However, it still remained higher than the average operating profit margin since H1:2013- 14 (Chart 7). 6.4. The ‘Construction’ industry contracted in terms of sales once again in H1:2016-17 after temporary improvement observed in the previous two half years. Operating profit margin however, continued to improve for two successive half-years for the industry (Chart 8). 7. On a quarterly basis, sales growth revived, profit margin sustained 7.1. The successive contraction in aggregate sales growth observed during the first three quarters of 2015-16, recovered temporarily in Q4:2015-16. Subsequently it stagnated in Q1:2016-17, but showed signs of improvement in Q2:2016-17. With a reversal in the fall in global commodity prices, cost of raw materials and overall expenditure started increasing since Q2:2016-17. This caused a moderation in the GVA and operating profit growth in Q2:2016-17. Operating Profit margin although declined marginally in Q2:2016- 17 as compared with Q1:2016-17, remained higher than the long term average since 2010-11 (Table 8). 7.2. Interest expenses remained unchanged in Q2:2016-17, after a moderation of growth in Q1:2016- 17. Interest coverage ratio (EBIT/interest expenses) also showed significant improvement in Q2:2016-17, reaching the highest level since 2011-12. Net profit growth improved in Q2:2016-17 on account of lower interest outgo. Net profit margin in Q2:2016-17, stood at the highest level since Q2:2010-11 (Table 8). | Table 8 : Performance of Select Companies over the Quarters of the Listed Non-Government Non-Financial Companies | | (Per cent) | | Indicator | 2015-16 | 2016-17 | | Q1 | Q2 | Q3 | Q4 | Q1 | Q2 | | 1 | 2 | 3 | 4 | 5 | 6 | | No. of Companies | 2,723 | 2,711 | 2,736 | 2,702 | 2,775 | 2,702 | | Y-o-Y Growth | | Sales | -2.4 | -4.6 | -3.4 | 2.3 | 0.1 | 1.9 | | Expenditure | -3.5 | -7.8 | -6.0 | -1.6 | -1.4 | 1.3 | | GVA | 5.6 | 6.9 | 8.7 | 9.5 | 9.3 | 8.0 | | Operating Profits | 3.7 | 8.9 | 9.0 | 16.8 | 9.6 | 5.5 | | Other Income | 1.8 | -5.8 | 3.7 | -8.5 | 5.9 | 14.8 | | Depreciation | 3.6 | 4.0 | 6.1 | 10.4 | 7.7 | 10.1 | | Gross Profits (EBIT) | 3.4 | 6.5 | 8.9 | 12.4 | 9.5 | 6.2 | | Interest | 9.5 | 8.4 | 3.4 | 6.1 | 5.8 | 0.0 | | Net Profits | -9.5 | 9.9 | 15.9 | 16.4 | 11.2 | 16.0 | | Ratio | | Operating Profit to Sales | 15.2 | 15.3 | 14.9 | 15.1 | 17.0 | 16.6 | | EBIT to Sales | 14.0 | 14.6 | 13.3 | 13.7 | 15.5 | 15.6 | | Net Profit to Sales | 6.7 | 7.7 | 5.2 | 5.9 | 7.5 | 8.7 | | Interest to Sales | 4.5 | 4.4 | 4.5 | 4.3 | 4.9 | 4.1 | | Interest Burden | 31.9 | 30.3 | 33.7 | 31.2 | 31.5 | 26.2 | | Interest Coverage (times) | 3.1 | 3.3 | 3.0 | 3.2 | 3.2 | 3.8 | 8. Ind-AS implementation and its impact 8.1. The newly implemented Indian Accounting standards is a convergence from the so far prevalent Indian GAAP towards the globally accepted International Financial Reporting Standards (IFRS). The Ministry of Corporate Affairs (MCA) notified the ‘Companies (Indian Accounting Standards) Rules, 2015’ i.e., Ind-AS vide notification dated February 16, 2015 which has now become applicable. Transition to Ind-AS from the previously applicable Indian GAAP is expected to have a wide-ranging impact on accounting of all the important performance parameters. However, only limited information is available in the interim financial statements available so far. 8.2. As per the MCA mandated road map for the Indian companies (excepting banks, insurance companies and non-bank financial companies), all companies whose networth is ₹500 crore and above, are to adopt Ind-AS from FY: 2016-17 onwards. The remaining listed companies and unlisted companies with networth more than ₹250 crores are to adopt it from FY:2017-18. Networth is to be calculated in accordance with the stand-alone financial statements as on 31 March 2014 or the first audited financial statements for the accounting period, which ends after that date. As a company adopts Ind-AS, it is mandatory, irrespective of networth, for its holding, subsidiary, associate and joint venture companies to also adopt Ind-AS. 8.3. Comparable earnings results under Indian GAAP and Ind-AS are available for H1:2015-16. The earnings results of 2,572 companies for H1:2015-16 were analysed to estimate the impact of transition to Ind-AS. Out of the 2,572 companies 1,414 companies showed a difference in results under the two accounting standards. Around 380 companies had networth more than ₹500 crores in H1:2015-16. Each of these companies have shown a variation in the two results for H1:2015-16. Items from profit and loss statements of individual companies were observed to have been impacted in either direction. But at the aggregate level, the impact of the transition remained muted for most items. Other income, tax provisions and net profit were found to be impacted by more than two per cent at the aggregate level. 8.4. A comparative study of balance sheets of 2,126 companies for the first half of 2015-16 reported under Indian GAAP and Ind-AS reveals that there was no major variation in the composition of assets and liabilities and also in financial ratios due to the change in the accounting system. Even, the companies which had networth (share capital and reserves & surplus) more than ₹500 crores, did not exhibit significant change. 8.5. The MCA notification dated April 06, 2016, brought out the revised Schedule III to the Companies Act 2013, which altered the format of half yearly balance sheets to be filed by the companies. This was also enforced by SEBI circulars dated July 05 and August 10, 2016. Companies have published the balance sheet for H1:2016-17 as per the new format. As such some of the changes in the balance sheet items may also be on account of the reclassification undertaken to implement the new Schedule III to Companies Act 2013. 8.6. The impact of the new accounting standards would be clear only when the detailed audited financial statements and comparative audited figures for the previous period will be available. Also, as many relaxations and exemptions are provided to ease the transition to Ind-AS, the full impact may be ascertained only after a period of time.
Annex Explanatory Notes 1. To compute the growth rates in any period, a common set of companies for the current and previous period is considered. 2. Selection of companies: a. Results of companies which were available for H1: 2016-17 i.e., April 2016 to September 2016 were directly included in the sample. b. Profit and loss statements of companies which do not publish results for half year ending September 2016 were also included in the sample. Profit and Loss statements for such companies were generated from the comparable quarterly earnings results filed by them during H1: 2016-17. 3. Companies having net worth more than ₹500 crores and their associated companies (subsidiaries, joint ventures etc.) have been mandated to adopt Ind-AS in Q1:2016-17. Data on performance parameters from the profit and loss statements, especially the ratios, therefore, may not be fully comparable. 4. The balance sheet items and the figures derived, may not be fully comparable due to implementation of Ind-AS and the revised Schedule III to Companies Act 2013. 5. Sector and Industry wise figures may vary slightly from earlier data released, as the industry classification system has been updated broadly following the National Industrial Classification (NIC 2008). 6. The manufacturing sector consists of industries like ‘Iron and Steel’, ‘Cement and Cement Products’, ‘ Machinery and Machine Tools’, ‘Motor Vehicles’, etc. This does not include ‘Agriculture and Related Activities’ and ‘Mining & Quarrying’ industries. The services (non-IT) sector includes ‘Real Estate’, ‘Wholesale and Retail Trade’, ‘Hotel and Restaurants’, etc. This does not include ‘Construction’ and ‘Electricity and Gas - Supply’ industries. 7. FOREX gain and loss are reported on net basis by companies and included in the net profit calculation. While net FOREX loss is considered as a part of the expenditure and thus included in operating profit, net FOREX gain is considered as a part of other income and included in EBIT. 8. Other income includes various regular incomes like rents, dividends, royalties etc. and does not include extra-ordinary income/expenses. 9. Extra-ordinary income/expenses are included in EBT and net profit. As the name suggests, these income/ expenses can be very large for some of the companies in a particular quarter. 10. Some companies report interest on net basis. However, some companies include the interest expenses on gross basis, where, interest received is reported in other income. 11. ‘$’/‘@’ (across all tables) indicates that the ratio / growth rate is not calculated as denominator is negative or negligible respectively. | Glossary of Terms | | VOP | - | Value of Production | - | Sales + Change in Stock | | GVA | - | Gross Value Added | - | Value of Production-Expenditure excluding Staff Cost+Other Income | | Operating Profit | - | | - | Sales + Change in Stock – Expenditure | | EBITDA | - | Earnings before Interest, Tax, Depreciation & Amortization | - | Operating Profit + Other Income | | EBIT | - | Gross Profits/Earnings before Interest & Tax | - | EBITDA+ Other Income – Depreciation & Amortisation | | EBT | - | Earnings before Tax | - | EBIT – Interest Payment + Extra-ordinary income/expenses | | Net Profit | - | | - | EBT – Tax | | Interest Burden | - | | - | Interest Payment / EBIT*100 | | Interest Coverage | - | | - | EBIT/Interest Payment | | Debt | - | | - | Short Term Borrowings + Long Term Borrowings |
|