Prospects are brightening for the economy achieving escape velocity from the pandemic as the second wave wanes and preparedness for future remains on war-alert status. Aggregate demand is gaining firmer ground, while on the supply side, IIP and core industries mirror improvement in industrial activity and services sector indicators point towards sustained recovery. The trajectory of inflation is shifting down more favourably than anticipated. As pandemic scars heal and supply conditions are restored with productivity gains, a sustained easing of core inflation can be expected, which will reinforce the growth-supportive stance of monetary policy. Introduction In the August issue of the SOE, we serenaded the onset of the month of Sravana, sensing a turn in the wind in the course of the Indian economy. It evoked a range of emotions, ranging from amusement to opprobrium. In the event, what a month August has turned out to be! New infections and fatalities fell appreciably, and vaccination picked up to touch a record daily level of 1.33 crore by the end of the month. Kharif sowing surpassed the normal sown area by end-August, followed by the revival of precipitation in September. Chances are that even the record sowing coverage of 2020-21 will be exceeded this year. Front run by the output of core industries, industrial production closed in on pre-pandemic levels – the July 2021 index just 0.3 per cent below its level in July 2019 – with mining and electricity generation having already exceeded their levels in July 2019. This is setting the stage for a rebound in industrial activity over the rest of the year, even as purchasing managers’ indices (PMI) reported cost pressures easing up a bit in August for the first time this year. The silver lining came in the form of the services PMI, which surged to a 18-month high on new orders placed with service providers, stemming from greater consumer footfalls, reopening of several firms and aggressive advertising. Exports are emerging as the gamechanger and potentially the pivot of a higher growth trajectory for the economy. A dynamic export sector enables an economy to grow faster than the pace that is possible with the size of the domestic market. Beyond a vent for surpluses, exports are an expression of international competitiveness, technological maturity and productivity. Merchandise exports remained above US$ 30 billion for the sixth consecutive month. The pace of export growth has actually sustained and accelerated in the pandemic, emboldening the setting of an ambitious target of US$ 400 billion for 2021-22 and US$ 1 trillion by 2027-28. The export performance during the year so far is powered by double digit volume growth and market diversification. The Production Linked Incentive (PLI) scheme is attracting international attention as it works towards making Indian manufacturing globally competitive, creating economies of scale and integrating India into the global value chain. Districts as export hubs, scaling up micro, small and medium enterprise (MSME) exports from a share of 48 per cent of total exports to 60 per cent and exports of geographical indication (GI) products will impart competitive edge and product/market diversification. Agriculture exports have remained robust during the post-COVID-19 period. The new products with GI tags, having high nutritional and medicinal properties, have brought exclusivity in India’s agricultural export basket, which would benefit more in the long run. India’s services exports remained strong in April-July 2021, rising by 15 per cent year-on-year (y-o-y) on the back of software exports. Major information technology (IT) companies recorded a revenue growth of over 20 per cent in Q1:2021-22 (y-o-y) in US dollar terms, led by the demand for cloud platform services, cyber security, analytics and insights and enterprise application services. The demand for IT services stemmed from verticals such as life sciences and healthcare, retail and consumer packaged goods, banking, financial services and insurance (BFSI) and manufacturing. Going forward, global IT spending (both software and hardware) is projected to increase by 8.6 per cent in 2021. In anticipation of growing demand, domestic IT companies are increasingly focusing on enhancing the domestic cloud talent pool. In the financial markets, Indian equities have outperformed all emerging economy peers in 2021-22 so far, delivering the highest returns. By September 13, the BSE Sensex was more than 20 per cent higher on a year to date basis, on track for the best annual gain in four years. Valuations are stretched but supported by expectations of strong earnings growth (Chart 1). A record 29 companies1 filed draft prospectuses for public listings, riding on the rally in equity markets. This was the highest tally in a single month in the past 17 years. At least 25 more companies2 are expected to come out with initial public offerings (IPOs) in the remaining months of the year, and the fact that most companies that listed in 2020 and 2021 are trading above their offer prices is fuelling the IPO rush. Typically, such rallies are driven by foreign portfolio investors (FPIs) and they are buying hand over fist, as discussed subsequently, but this time, the exuberance is a domestic investor story. Equity mutual funds attracted net inflows for the sixth consecutive month in August (Chart 2a). The number of systematic investment plan (SIPs) accounts registered in August alone was the highest-ever (Chart 2b). The phenomenon of the retail investor is also evident from the ballooning of the number of Demat accounts.
From net sellers in the market in the previous month, FPIs turned net buyers in August in both equity and debt markets. As a result, total FPI inflows crossed an intra-year peak in 2021-22 so far. India has become the third largest recipient of portfolio equity flows, after China and Brazil, in the calendar year 2021. FPI interest in the debt segment has gained traction in recent months in response to rising yield differentials and strengthening macro-fundamentals. At the end of the month, the Q1 GDP data arrived. In April-June 2021, real GDP recorded its highest ever quarterly growth of 20.1 per cent, just a shade below the Reserve Bank’s projection of 21.4 per cent and our nowcast of 22.1 per cent presented in the June edition of this article. In fact, if government final consumption expenditure is excluded, real GDP growth would have clocked 25.0 per cent. While attention has largely been drawn to base effects and the shortfall relative to pre-pandemic levels, the terrible experience with the second wave of the pandemic – when this GDP was being produced – should not be forgotten (Chart 3). The innate resilience of the Indian economy during the second wave stands out – the loss of output in Q1:2021-22 was 40 per cent of what was suffered during Q1:2020-21 when measured from the level of GDP recorded in Q1:2019-20 (pre-pandemic), owing no less to better adaptability of businesses and consumers and a surge in online deliveries and digital payments, as to the localised nature of restrictions. 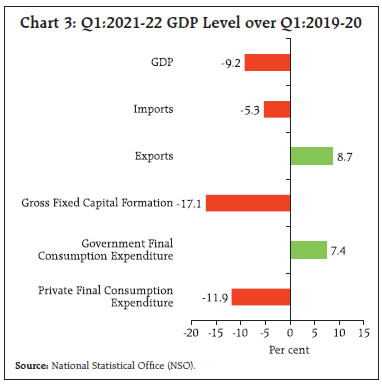 Exports outstripped pre-pandemic levels and imports are poised to catch up, but private consumption and fixed investment are still work in progress. On the supply side, agriculture and allied activities continued to exhibit robust pandemic-proofing and industrial output reached 97 per cent of its pre-pandemic level. Financial, real estate and professional services, constituting the largest share in the services sector, are near catch-up but contact-intensive trade, hotels, transport and construction remained sluggish. The plateauing of infections and faster pace of vaccination is likely to hasten the convergence to pre-pandemic levels in various sectors. Authors’ economic activity index (Kumar, 2021) nowcasts real GDP growth for Q2:2021-22 at 7.7 per cent, albeit, with support from the low base of last year. Incoming data suggest that the global recovery has peaked, reflecting, in part, the wide divergences in the paths of advanced and emerging economies through the pandemic. With GDP data now available for the second quarter of 2021 across countries, the focus is shifting to the even wider divergences rending the emerging world asunder, which is most visible in recent monetary policy actions. Why have some emerging economies chosen to attack what they deem transitory inflation by tightening monetary policy even pre-emptively, while others like India have preferred to persist with accommodation and wait for their own cue to commence normalisation? The proximate answer lies in differing underlying macroeconomic configurations. Countries that have tightened monetary policy are also growing rapidly. Several of them are commodity and services exporters. The boom in commodity prices and revenge tourism has translated into favourable terms of trade, growing incomes and the rapid escalation of inflationary pressures. A few emerging market economies (EMEs) are also beneficiaries of spillovers and trade advantages from better growth prospects in the US. Some of the most aggressive rate hikers of 2021 registered a near doubling of net exports in Q2 over Q1 (Chart 4). A few of these EMEs recovered to their pre-pandemic level of output by Q2:2021. 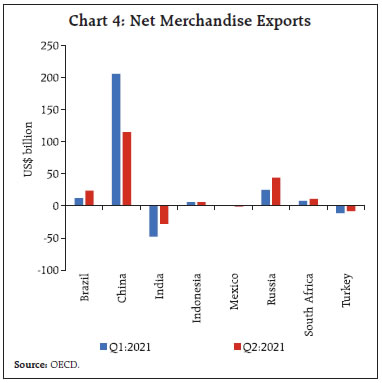 Commodity importers and/or those with relatively low proportions of their populations having been vaccinated are forced to tolerate above target inflation. These countries have resolutely maintained a pause as a hasty tightening in response to inflation largely brought on by supply-side disruptions and other pandemic-induced factors could stump growth prospects in a scenario where aggregate demand remains on a weak wicket. There are a few EMEs – dominant global suppliers – which enjoy low inflation with economic expansion, in spite of the waves of the pandemic. With growth stalling in recent months, they have initiated monetary accommodation through cuts in reserve requirement ratios or targeted lending even in the face of increase in producer prices inflation. | Table 1: Economic Indicators for Select EMEs | | Country | Inflation Target
(Per cent) | Inflation
(Per cent) | GDP Growth
(Y-o-y growth, per cent) | YTD Change in Policy Rate
(Basis points) | YTD Change in Exchange Rate
(Per cent) | YTD Change in Stock Market Index
(Per cent) | | Average H1:2021 | Average H2:2021 so far | Q2:2020 | Q1:2021 | Q2:2021 | | | Monetary Tightening; Terms of Trade Gainers | | Brazil | 3.75 ± 1.5 | 6.5 | 9.3 | -10.9 | 1.0 | 12.4 | 325 | -1.0 | -4.0 | | Chile | 3.0 ± 1.0 | 3.3 | 4.7 | -14.3 | 0.5 | 18.1 | 100 | -9.9 | 6.9 | | Hungary | 3.0 ± 1.0 | 4.2 | 4.8 | -13.3 | -2.1 | 17.9 | 90 | 0.2 | 25.5 | | Mexico | 3.0 ± 1.0 | 5.0 | 5.7 | -18.7 | -3.6 | 19.6 | 25 | 0.1 | 16.9 | | Russia | 4.0 | 5.8 | 6.6 | -7.8 | -0.7 | 10.5 | 250 | 1.2 | 21.7 | | South Africa* | 3.0 - 6.0 | 4.0 | 4.6 | -16.9 | -2.6 | 19.3 | 0 | 3.4 | 8.2 | | Turkey | 5.0 ± 2.0 | 16.3 | 19.1 | -10.4 | 7.2 | 21.7 | 200 | -12.2 | -2.6 | | | Monetary Pause | | India | 4.0 ± 2.0 | 5.2 | 5.4 | -24.4 | 1.6 | 20.1 | 0 | -0.9 | 22.1 | | Malaysia | | 2.4 | 2.2 | -17.2 | -0.5 | 16.1 | 0 | -2.8 | -3.1 | | Philippines | 3.0 ± 1.0 | 4.4 | 4.5 | -17.0 | -3.9 | 11.8 | 0 | -3.9 | -2.4 | | Saudi Arabia | | 5.5 | 0.4 | -7.0 | -3.0 | 1.8 | 0 | 0.0 | 31.4 | | | Monetary Easing; Subdued Growth | | Indonesia | 3.0 ± 1.0 | 1.5 | 1.6 | -5.3 | -0.7 | 7.1 | -25 | -2.4 | 1.9 | | Thailand** | 1.0 - 3.0 | 0.9 | 0.2 | -12.1 | -2.6 | 7.5 | 0 | -8.5 | 8.2 | | | Monetary Easing; Economic Expansion and Low Inflation | | China*** | | 0.5 | 0.9 | 3.2 | 18.3 | 7.9 | 0 | 1.3 | 6.6 | *: Not hiked rates yet, forward guidance of rate hike in Q4:2021.
**: Not cut rates, last MPC meet one-third votes were for rate cut.
***: Not cut rates, non-rate actions to promote liquidity and lending.
Note: Year-to-date (YTD) changes are up to September 10.
Sources: Bloomberg; and centralbanking.com. | A smaller set of EMEs is experiencing low inflation, but growth is way below desirable rates (Table 1). These are the countries that are trying to rev up monetary stimulus, by either indicating a cut in rates going forward or extending asset purchase programmes. The proportion of their immunised population compares unfavourably with the countries that are growing strongly or have better growth prospects. We have looked at a group of EMEs. This selection comprises the biggest EMEs, including BRICS and a few others from within the G20 group as also a few other prominent ones from outside the group. This selection includes both inflation targeting (IT) countries and non-IT countries. Also includes countries that have exchange rate pegged to the dollar. There is at least one country from each of the continents. Growth rate – the current pace or the prognosis for subsequent quarters – is the main criterion for the compartmentalisation. Countries that have relatively higher growth are further bifurcated based on inflation outcomes. It is observed that amongst the ‘growth leaders’, IT countries have high inflation and the non-IT countries such as China have low consumer price inflation. Almost all IT growth leaders have tightened monetary policy or given indication of the same. These are the first group of countries in Table 1. These countries have a common characteristic of terms of trade gains accruing from commodity prices boom and also tourism revenues in a few cases. On the other hand, the non-IT growth leaders are initiating measures to support the flagging recovery. Low growth countries are those where the rebound in Q2:2021 is not as strong as the decline in Q2:2020. This includes IT countries such as India and Philippines and non-IT countries such as Malaysia and Saudi Arabia. The latter two are also commodity exporters, but do not match up on the growth statistic with their peers. Inflation is a concern in two of them. Amongst low growth countries, there are two where central banks have undertaken further support measures. Clearly, one factor that is causing macroeconomic performance differentials is the vaccine reach (Table 2). India is difficult to compartmentalise into any of these categories. The sporadic episodes of high inflation since the outbreak of the pandemic have coincided mostly with lockdowns or waves of infections. As the lockdown eases or the waves wane, headline inflation begins to shed the impact of the supply disruptions. India is a rare EME that broke out of contraction in Q4:2020, further edged up in the positive territory in Q1:2021 and posted a growth of 20 per cent plus in Q2:2021 in spite of a second wave. Yet, aggregate demand remains weak and below pre-pandemic levels, despite a record-setting number of doses being administered in recent days. Not surprisingly in the July Update of the World Economic Outlook, the International Monetary Fund (IMF) revised upwards the growth projections for most EMEs, while India’s was marked down. India has chosen not to join the EME bandwagon of rate-hikers that is gathering numbers and instead, to maintain an accommodative stance as long as necessary to revive and sustain growth, with the limited space provided by inflation remaining within the tolerance band, despite being elevated, and not outside it. It is a judgment call; it is all about giving growth a chance to reclaim a place in the sun while pursuing a graduated reduction in inflation from the pandemic high, spreading out output losses over the disinflation horizon. Table 2: COVID-19 Vaccination Status
(as on September 12, 2021) | | Country | Percentage of population fully vaccinated | | Brazil | 34.6 | | Chile | 72.8 | | China | 69.3 | | India* | 12.8 | | Indonesia | 15.6 | | Malaysia | 52.3 | | Mexico | 30.4 | | Philippines | 15.0 | | Russia | 27.0 | | Saudi Arabia | 49.4 | | South Africa | 12.2 | | Thailand | 16.7 | | Turkey | 48.5 | Source: Bloomberg.
*: The percentage of adult population vaccinated as on September 14, 2021 is 19 per cent. | The rest of this article is structured into four sections. Section II encapsulates recent global economic dynamics. Section III explores the domestic economy. Section IV evaluates unfolding financial conditions, and the last Section sets out some concluding remarks. II. Global Setting The shape of the global economic recovery is being chiselled by divergences across sectors and economies under the impact of the pandemic and the differentials in the pace of vaccination across geographies. The reopening of economies is facing headwinds from the delta variant, more pronouncedly since August. Downside risks to the global recovery have accordingly become accentuated. According to the provisional estimates of the Organisation for Economic Co-operation and Development (OECD) released on August 30, economic activity in the OECD area – which accounts for 50 per cent of world GDP in purchasing power parity terms – trails below pre-pandemic levels, despite a pick-up in growth to 1.6 per cent in Q2:2021 from 0.6 per cent a quarter ago. The global composite purchasing managers’ index (PMI) slid to a seven-month low in August as economic activity decelerated in the US and the Euro area and floundered in the Asian region (Chart 5). Within manufacturing, deceleration was observed across consumer, intermediate and investment goods sub-groups. In the tertiary sector, financial services was the only sub-group that registered an acceleration in growth. Trade in goods remains strong despite the tightening constraints of supply and logistics bottlenecks, shortages of containers and personnel in international shipping, elevated freight rates and choked supplies of chips and semiconductors. These factors are, however, exerting pressure on the prices of traded goods. The US economy added 2,35,000 jobs in August, about 40 per cent of the average monthly job growth in 2021 so far and a sharp markdown from the 1.1 million jobs created in July. The weak jobs data reflects the impact of the rampaging delta variant on hiring plans, throwing up nation-wide labour shortages. Although the unemployment rate eased to 5.2 per cent – its best reading since March 2020 – it understates the amount of labour slack as the recovery in labour force participation is lagging well behind. 
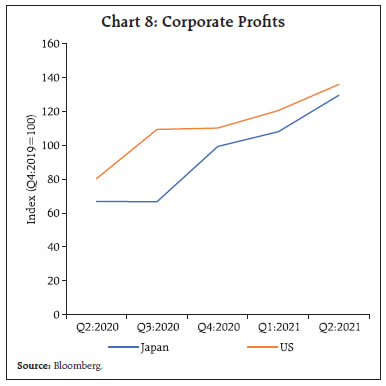
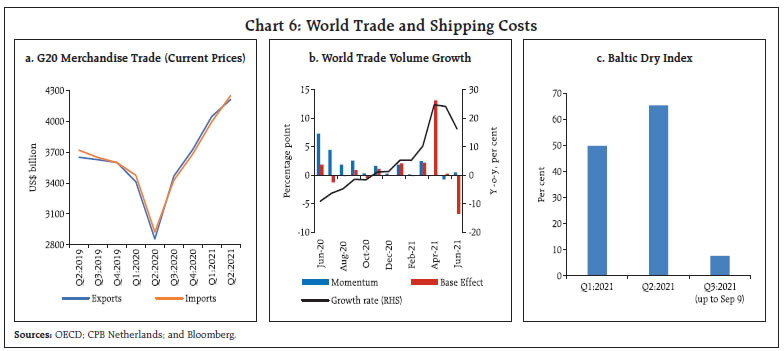 In August, the Goods Trade Barometer compiled by the World Trade Organization (WTO) hit its highest level in the last five years. According to the OECD, in Q2:2021, international merchandise trade (in nominal terms) in the G20 region surpassed the record scaled in the previous quarter (Chart 6a). On a monthly basis, merchandise trade grew y-o-y in double digits despite an unfavourable base (Chart 6b). Shipping charges continue to mount, with new supply disruptions in major hubs in Asia (Chart 6c). The PMIs show that the suppliers’ delivery time sub-index dipped further into the negative zone for eight important Asian economies in August while the average vendor lead time increased, leading to a decline in output. In this regard, the unabated spread of infections in Vietnam – which acted as a global trade powerhouse during the most severe phase of the pandemic in 2020 and emerged as a potential pivot in global value chains – is throttling the functioning of global supply chains. Delta variant concerns led to a cooling of the commodities market in August. Towards the last week of August and into early September, however, as new infections in China slid down, the commodity markets began bouncing back. The Bloomberg commodity index inched up to near the peak touched in July (Chart 7a). Crude oil prices eased by 5.9 per cent in August, the first monthly decline since April and the steepest since September 2020 as the global scale of COVID-19 outbreaks escalated concerns about the strength of the demand in the near-term (Chart 7b). Concomitantly, gold saw renewed interest both as an inflation hedge and as safe haven, leading to prices rising to US$ 1,828 per troy ounce by early September (Chart 7c). After two consecutive months of moderation, food prices rose in August, led by sugar, vegetable oils and cereals (Chart 7d). Financial markets remained resilient, taking in their stride the Federal Reserve’s indication of tapering in 2021. Stock markets in advanced economies (AEs) are powering ahead due to strong corporate earnings as also due to optimism generated by impending elections in Japan (Chart 8). The US S&P index has scaled a new peak in every month up to September. EME stock markets, on the other hand, lag behind, reflecting China’s regulatory actions as also the delta variant threat to the recovery (Chart 9a). US 10-year Treasury yields remained range-bound, with some hardening more recently (Chart 9b). Notwithstanding some volatility, the US dollar remained strong in August but weakened thereafter with poor payroll data (Chart 9c). 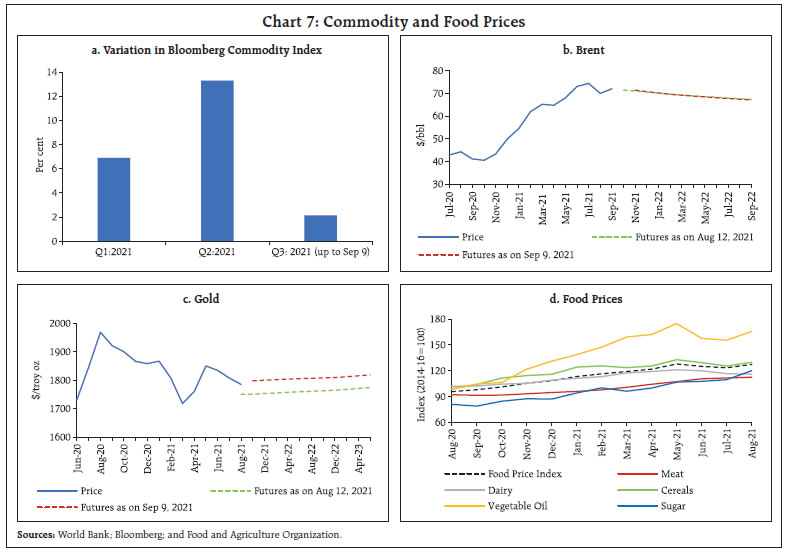
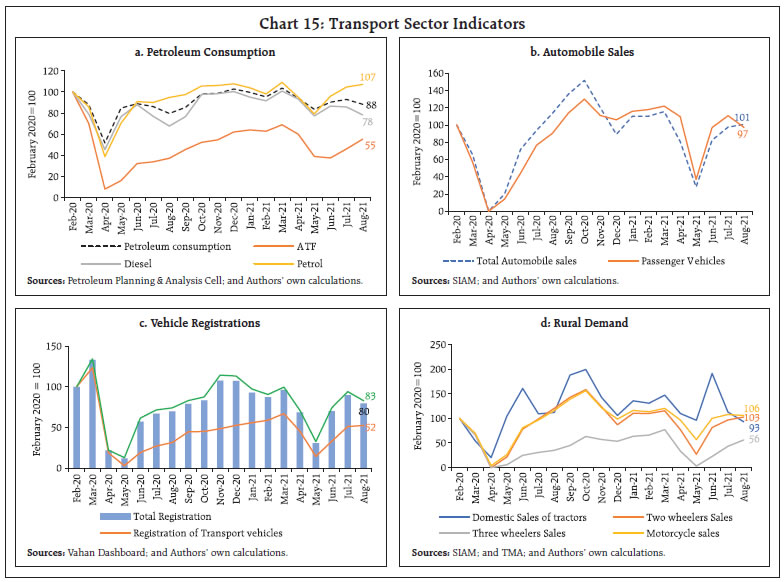
 EME currencies are in a sweet spot, having strengthened since the latter part of August on the back of renewed capital flows (Chart 9d). The diverging policy paths of central banks has led to carry trade opportunities in EME currency markets, also due to recent weakness of the US dollar. The Bloomberg cumulative forex carry trade basket for eight EME currencies, representing the carry trade returns, has risen since the last week of August (Chart 9e). This holds for the Indian rupee (INR) too, and positive sentiments on the INR implied in falling US$-INR forward premia have also added to its attractiveness for carry-trade strategies. The US$-INR 30-day implied volatility has also fallen (Chart 9f). 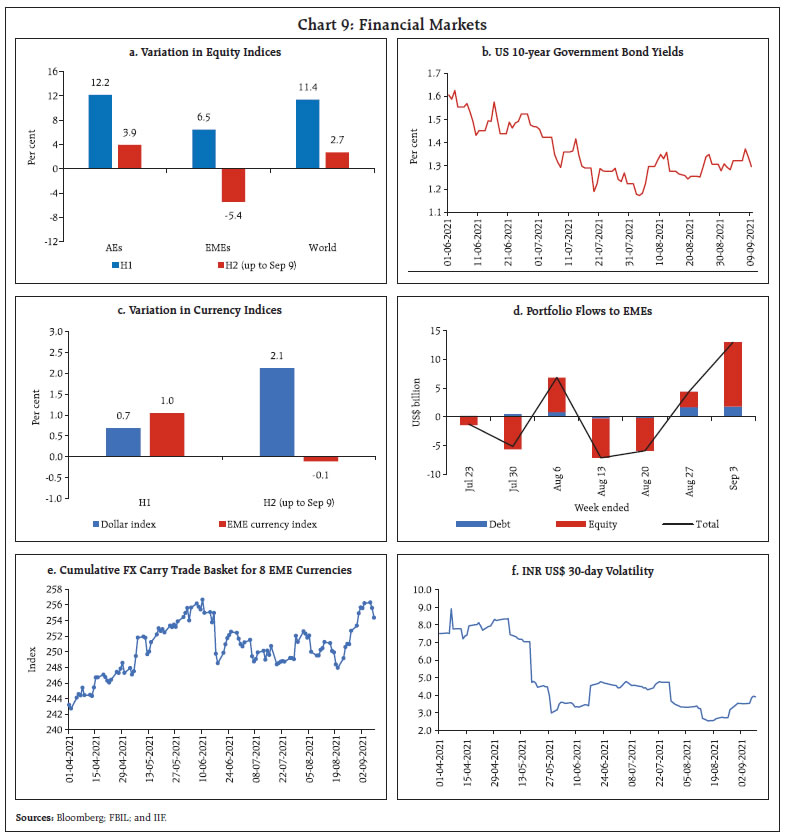 In the Euro area, inflation rose to 3.0 per cent in August, its highest level since October 2008, driven by supply chain bottlenecks, the ongoing economic rebound and the reversal of last year’s cut in the value added tax in Germany (Chart 10a). Only four Euro area countries had inflation prints below 2 per cent, as compared with 16 countries in March. US core personal consumption expenditure (PCE) inflation remained unchanged at the 30-year high of 3.6 per cent in July. Among the BRICS economies, inflation edged up in Brazil in August to 9.7 per cent, its highest level since February 2016 (Chart 10b). In Russia, at 6.7 per cent, inflation was at a 5-year high in August. 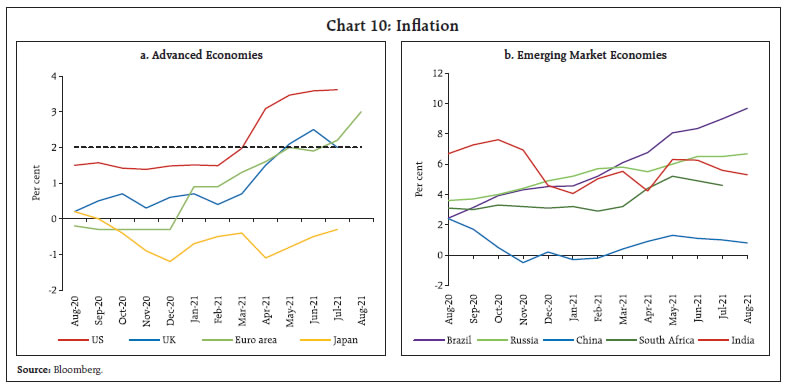 In August, South Korea became the first major AE and the third overall to hike rates. It effected a 25 basis points (bps) hike in key rate in response to above target inflation and financial stability risks, even in the face of a resurgence in COVID-19 infections (Chart 11). Two other AEs – Czech Republic and Iceland – effected their second 25 bps hikes in August. Among major EMEs, Brazil stepped up its policy tightening by effecting a 100 bps hike in policy rate in August, while Mexico resorted to its second consecutive policy rate increase in response to persisting high inflation. Hungary raised rates for a third successive month by 30 bps, while Chile followed on the tightening that commenced in July with a more aggressive hike of 75 bps in August. Other Latin American economies such as Peru, Uruguay and Paraguay also raised policy rates. Russia effected its fifth rate hike of 2021 in September with an increase of 25 bps. The European Central Bank (ECB) has announced a reduced pace of bond purchases compared with the previous two quarters while not changing the total quantum of purchases under the Pandemic Emergency Purchase Programme. On the other hand, Australia postponed a review of its bond-buying programme by five months from mid-September 2021 to mid-February 2022, due to COVID-19 resurgence. It would continue to buy bonds at a weekly pace of AUD 4 billion till then. 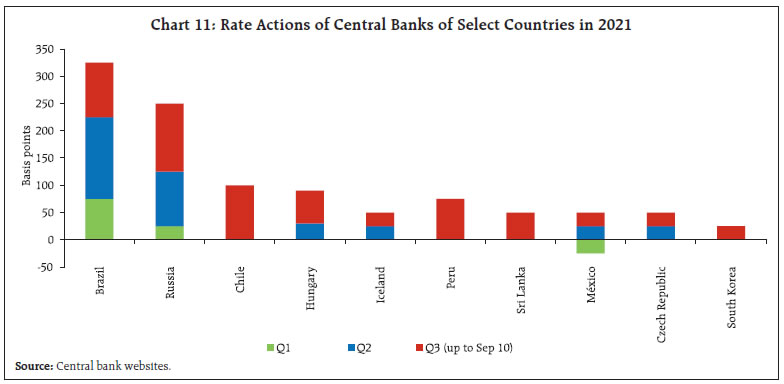 Overall, the near-term outlook stays downcast with the contagious delta variant putting a chill into economic activity and posing headwinds for world trade. Starkly diverging monetary policy actions and stances could precipitate a hasty tightening of financial conditions, which could put a brake on the nascent recovery. III. Domestic Developments Domestic economic conditions rounded a turning point in August as growth impulses gathered momentum with the progressive opening up of the economy and scaling up of the vaccination drive. Prospects are brightening for the economy achieving escape velocity from the pandemic as the second wave wanes and preparedness for future remains on war-alert status. The 7-day moving average of daily new cases retreated to 35,464 on September 12, 2021 from the peak of 3,92,322 on May 8, 2021 (Chart 12). For the third time beginning August 27, 2021 till September 8, 2021, India administered more than one crore doses of COVID-19 vaccine in a day. The total number of doses administered has crossed the 72 crore mark (till September 9, 2021). As a result, double dose vaccination covered 12.8 per cent of the population by September 12, 2021. 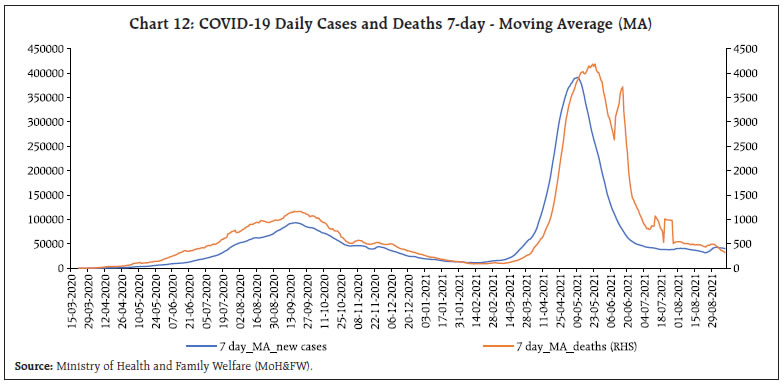 The National Statistical Office (NSO) released India’s real GDP for Q1:2021-22 on August 31 at 20.1 per cent, largely attributable to a favourable base effect as GDP in Q1:2020-21 had plummeted. In fact the seasonally adjusted q-o-q annualised rate of GDP plunged, indicative of the weakened momentum of underlying activity in Q1. The level of GDP in Q1:2021-22 is still lower than in Q1:2019-20, reflecting the substantial slack in the economy. Nonetheless, the impact of the second wave on the real economy has been limited in comparison with the first wave, despite relatively higher rates of morbidity and mortality. With confidence resurging, mobility rose (up to September 9, 2021) to its highest levels since the onset of the pandemic (Chart 13a and 13b). Electricity generation recovered to pre-pandemic levels of two years ago, i.e., September 2019 (Chart 13c). The new electricity amendment bill 2021 aims to delicense electricity distribution and allow entry of private players. This should promote competition and increase efficiency in distribution. Aggregate Demand Aggregate demand is gaining firmer ground. Petrol consumption recorded an uptick in August 2021 even as aviation turbine fuel (ATF) continued to be tepid. Total consumption of fuel moderated as diesel consumption sequentially declined on account of monsoon rains stalling inter-state movement of trucks (Chart 15a). In August, e-way bills – both intra-state and inter-state – remained above pre-pandemic levels of February 2020 (Chart 14a), signalling higher goods and services tax (GST) collections going forward (Annex). E-way bill collections for September (up to 9th) registered a strong growth in y-o-y terms as well as over corresponding levels of 2019. Toll collections jumped sharply in August, increasing by 107.8 per cent y-o-y and by 4.6 per cent over last month’s level (Chart 14b). Automobile wholesales recorded an uptick in August with positive momentum in growth across all categories barring passenger vehicles, where acute supply shortages of semiconductor chips impacted production3. The bottlenecks arise at a crucial juncture, ahead of the 32- day festival season. Retail sales of motor vehicles registered growth over a low base in August last year, but contracted sequentially in relation to July 2021 due to contraction in respect of non-transport vehicles as pent-up demand declined and customers waited for festival discounts. Further moderation occurred in the first week of September (Chart 15b and c). Rural demand remained upbeat, with two wheelers reverting to pre-pandemic levels after the blip recorded during the second wave of the pandemic. Tractor sales recorded a seasonal decline in domestic sales as the kharif season came to an end. Sales of motorcycles remained robust, while sales of three wheelers picked up to about 60 per cent of pre-pandemic levels (Chart 15d). With monsoons normal and sowing gaining traction, industry experts remain bullish on the segment, expecting a good sales run in the coming months. 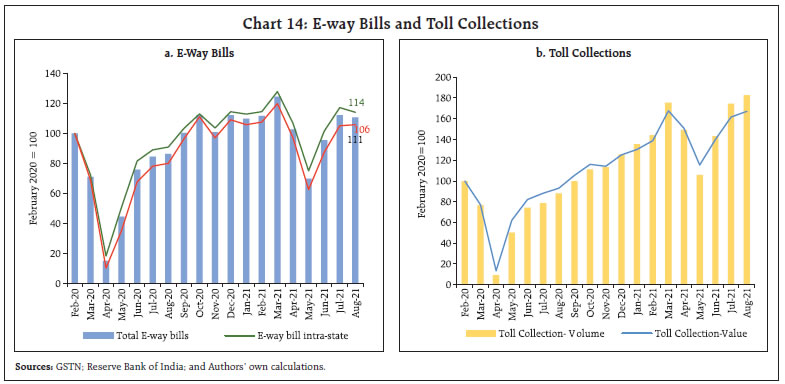
 In the services sector, Indian Railways freight continued to be impressive, marking an increase of 16.9 per cent in August (110 million tonnes) over its level a year ago. Even though it registered a decline on a m-o-m basis, it improved by 21.5 per cent over the pre-pandemic level of August 2019. Of the major commodities, cement freight recorded a sequential improvement in August (Chart 17). Normalised to February 2020 levels, high frequency indicators of construction activity - steel consumption and cement production - remained below the baseline: however, cement production registered growth above pre-pandemic levels (Chart 16). Among various infrastructure segments, roads received the highest government projects worth ₹22,200 crore in January-July 2021 – three times compared with the corresponding period of the previous year. This, together with improving execution, increasing labour availability and timely release of payments by the government, augurs well for road construction companies going ahead.4 In the aviation sector, the cargo segment continued to outperform the passenger segment in August. While some uptick was recorded in domestic passenger segment, with traffic increasing to 40 per cent vis-à-vis pre-pandemic levels in February 2020, international passenger segment remained dismal at only about 15 per cent of pre-pandemic traffic (Chart 17b). The fast-moving consumer goods (FMCG) sector surged in August 2021, with demand for goods remaining broad-based across regions. Notwithstanding supply constraints, most FMCG companies registered an uptick in footfalls in the second and third week of August. With the festival season nearing, companies expect a pick-up in sales in September 2021 going well beyond pre-pandemic levels.5 As per the household survey of the Centre for Monitoring Indian Economy (CMIE), the labour participation rate at 40.5 per cent in August 2021 has recovered to January 2021 levels, but there was an increase in the unemployment rate from 7 per cent in July 2021 to 8.3 per cent in August 2021 (Chart 18). Weekly labour market indicators suggest that the unemployment rate fell significantly to 7.35 per cent and the labour participation rate improved marginally to 40.87 per cent in the second week of September 2021.
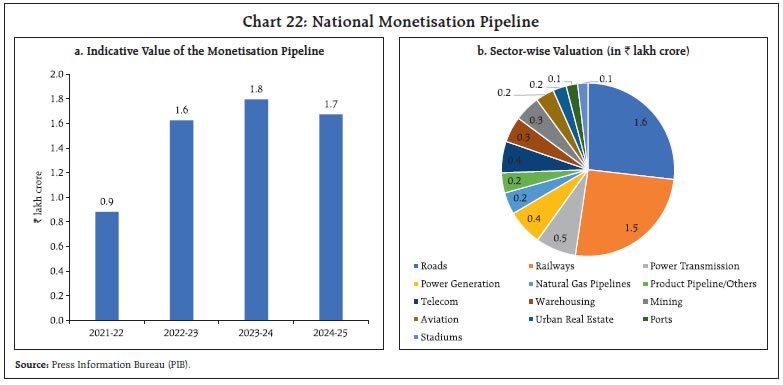
Organised sector labour market data, as captured by the Employees’ Provident Fund Organisation (EPFO) and the Employees’ State Insurance Corporation (ESIC), show that the impact of the second wave has been relatively muted (Chart 19). The employment sub-index of the PMI reveals a mixed picture. While the sub-index for manufacturing reverted to a marginal contraction at 49.9 in August 2021 after expanding marginally at 50.6 in July 2021, the rate of job shedding in services moderated from 47.5 in July 2021 to 49.5 in August 2021 (Chart 20). During April-July, the fiscal deficit of the Centre remained contained at 21.3 per cent of budget estimates (BE), on the back of buoyant tax revenues and lower revenue expenditure (Chart 21a). Capital expenditure registered a growth of 14.8 per cent relative to the same period a year ago, led by the Ministry of Road Transport and Highways which has exhausted 44.7 per cent of its budgeted capital expenditure for 2021-22 (Chart 21b). Capital creation and infrastructure development have received a boost with the launch of the National Monetisation Pipeline (NMP). Asset monetisation, which entails license/lease of a government-owned asset to a private sector entity for a limited period, unlocks the value of public investment from infrastructure by tapping private sector capital. The funds so received by the government could be reinvested in new infrastructure or deployed for other developmental purposes. The NMP envisages an aggregate monetisation potential of ₹6.0 lakh crore over a four-year period from 2021-22 to 2024-25, of which ₹0.88 lakh crore is projected to be garnered in the current financial year. The top 5 sectors estimated to generate maximum value include: roads (27 per cent); railways (26 per cent); power (15 per cent); oil and gas pipelines (8 per cent); and telecom (6 per cent) [Chart 22]. GST collections (Centre plus states) stayed their course, remaining well above the ₹1 lakh crore mark in July and August after a transitory blip in June, reflecting a revival in economic activity after the second wave (Chart 23). 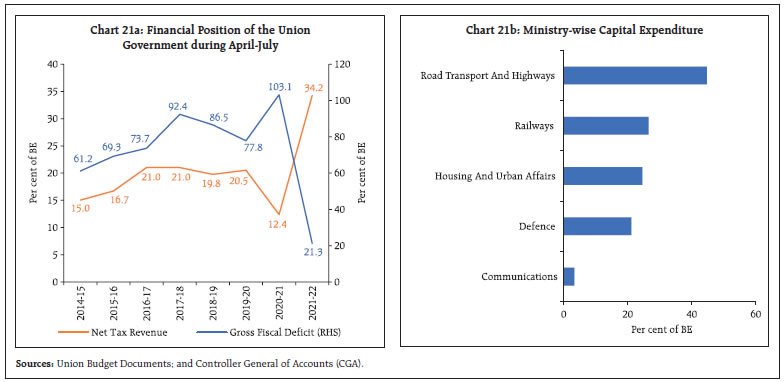
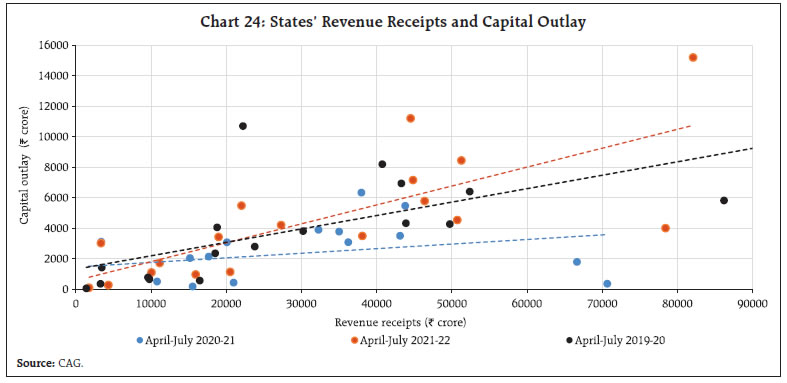
 As per the latest information available for 18 states, their revenue collections improved by 17.9 per cent in April-July 2021 as compared with a contraction in April-July 2020. Higher collections occurred under both tax and own non-tax revenues, attributable to easing of state-specific lockdowns. This, coupled with better prospects for the remaining part of the year, is encouraging states to expand their capital outlay. During April-July 2021, capital outlay expanded by 99 per cent, as against a decline of 44.5 per cent in the corresponding period a year ago. In terms of both revenue receipts and capital outlay, states fared better than in the corresponding pre-COVID period of April-July 2019 (Chart 24). During the same period, states’ gross fiscal deficit was contained to 23 per cent of budget estimates as against 29 per cent a year ago. 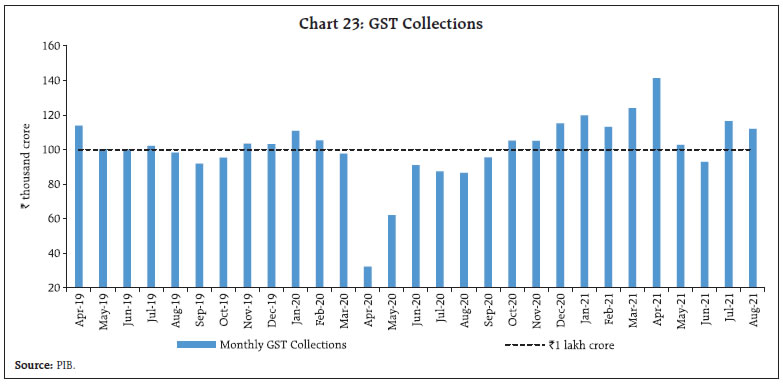
 India’s merchandise exports continued with their stellar performance (Chart 25). High growth was driven by demand in partner countries for engineering goods, petroleum products and chemicals (Chart 25b). Export growth remained broad-based as 9 out of 10 major commodity groups - accounting for more than 80 per cent of the export basket - recorded expansion during the month over a year ago. India’s merchandise imports grew by 18 per cent over pre-COVID-19 levels (Chart 26a). Non-oil-non-gold imports have been in excess of US$ 25 billion for the ninth consecutive month, reflecting the on-going recovery in the economy. Import growth has remained broad-based as 8 out of 10 major commodity groups (which account for more than 80 per cent of import basket) expanded vis-à-vis pre-pandemic levels (Chart 26b).
Gold imports, after contracting sharply through May-June 2021, surged in July and August, far exceeding their pre-COVID levels. This is reflective of the impact of pent-up demand for weddings and improved business sentiment in the gems and jewellery industry. Aggregate Supply The cumulative rainfall (SW Monsoon) during June 1 - September 14, 2021 was 5 per cent below the long period average (LPA) (Chart 27). The southern peninsula region received 12 per cent above LPA rainfall. However, East/North East India, Central India and North West India received below normal rainfall (Chart 28). The spatial distribution shows that rainfall was large excess/excess in 7 sub-divisions, normal in 22 sub-divisions and deficient/large deficient in 7 sub-divisions out of 36 sub-divisions during June 1 - September 14, 2021.
The overall sown area stood at 1096.7 lakh hectares, which is just 0.9 per cent lower than the record coverage a year ago, but above the normal (5-year average) acreage by 3.5 per cent and the full season acreage (5-year average) by 2.2 per cent (Table 3). The India Meteorological Department (IMD) has forecast above normal rainfall (greater than 10 per cent over LPA) for September. The forecast suggests that above normal to normal rainfall is likely over many areas of central India. Normal to below normal rainfall is most likely over many areas of north-west and north-east India, and most parts of peninsular India. | Table 3: All India Crop Situation - Kharif (2021-22) as on September 10, 2021 | | Crop Name | Cumulative Acreage
(Lakh hectares) | Percentage variation | Area covered
(Per cent of Full Season Normal*) | Over normal*
(as on date) | Over last Year | | 1. Rice | 409.6 | 6.5 | 0.4 | 103.5 | | 2. Coarse Cereals | 173.8 | -2.7 | -2.5 | 94.7 | | 2a. Jowar | 14.5 | -16.2 | -3.3 | 74.2 | | 2b. Bajra | 63.3 | -6.4 | -7.7 | 86.3 | | 2c. Maize | 81.1 | 1.9 | 1.6 | 108.6 | | 3. Total Pulses | 139.6 | 2.2 | 1.9 | 103.2 | | 3a. Tur | 49.8 | 5.4 | 3.9 | 109.2 | | 3b. Urad | 38.9 | 0.1 | 1.5 | 104.3 | | 3c. Moong | 35.1 | 5.6 | -0.3 | 104.8 | | 3d. Kulthi (Horse Gram) | 0.5 | -16.3 | -3.6 | 23.5 | | 3e. Others | 15.3 | -8.2 | 2.4 | 91.6 | | I. Total Foodgrains (1+2+3) | 723.0 | 3.3 | 0.0 | 101.2 | | 4. Oilseeds | 192.6 | 5.8 | -1.6 | 107.0 | | 4a. Groundnut | 49.0 | 12.5 | -3.8 | 117.5 | | 4b. Soyabean | 121.7 | 7.2 | 0.4 | 107.8 | | 4c. Sunflower | 1.5 | 20.6 | 26.1 | 105.9 | | 4d. Sesame | 13.2 | -6.5 | -4.2 | 100.2 | | 5. Cotton | 119.5 | 0.1 | -5.8 | 96.7 | | 6. Sugarcane | 54.7 | 6.0 | 1.4 | 115.1 | | 7. Jute& Mesta | 7.0 | -0.2 | 1.0 | 95.4 | | II. Commercial Crops (4+5+6+7) | 373.7 | 3.8 | -2.5 | 104.2 | | III. All-Crops (I+II) | 1096.7 | 3.5 | -0.9 | 102.2 | *: Normal Area: Average of last five years.
Note: Area figures are as per eye assessment of state Agriculture Departments.
Source: Ministry of Agriculture and Farmers' Welfare (MOAFW). |
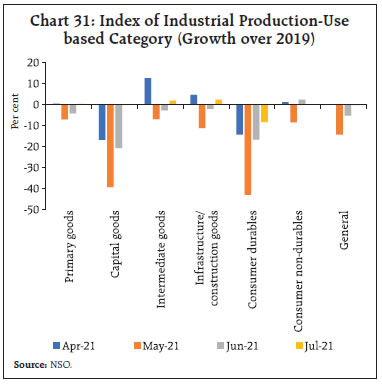
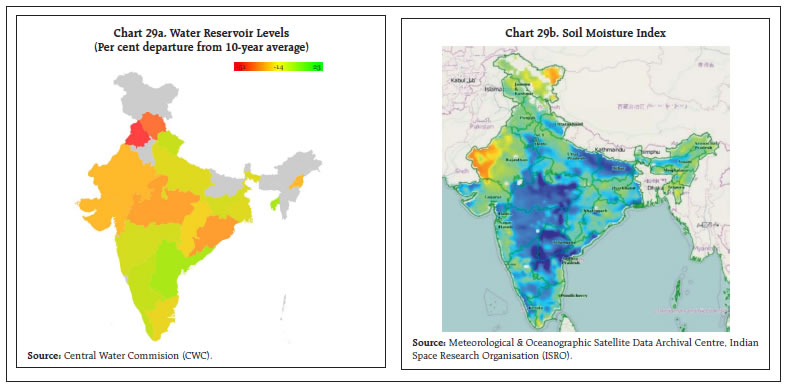 As of September 9, 2021 reservoir levels were just 6 per cent below the decadal average with lower levels mainly in Punjab, Haryana, Rajasthan, Gujarat, Madhya Pradesh and Odisha. The soil wetness index is positive across regions, barring the western parts (Chart 29). As of end-August 2021, the stock levels of cereals are comfortable at 2.8 and 1.9 times the buffer norms of rice and wheat, respectively. On September 8, 2021 new minimum support prices (MSP) for the upcoming rabi sowing season (2021-22) were announced, which marked an increase of 2.0-8.6 per cent over a year ago (Chart 30). The maximum raise in MSP was recorded for rapeseed and mustard (8.6 percent) followed by lentils (7.8 per cent) and gram (2.5 per cent). The mark-up in the MSP has ensured a return of at least 50 per cent over the cost of production (as measured by A2 plus FL[2]) for all the crops. The announcement of higher MSP well ahead of the sowing season is likely to bode well for the agriculture sector. The government has set a target of 307 million tonnes for foodgrains production for 2021-22. The index of industrial production (IIP) for the month of July 2021 signalled improvement in activity as it grew by 11.5 per cent y-o-y and the pace of decline came down to 0.3 per cent over July 2019 (-5.2 per cent in June 2021 over 2019). All indicators showed sequential improvement when compared to 2019. Among use-based categories all except consumer durables showed improvement over pre-pandemic levels of July 2019 (Chart 31). 
 The headline PMI manufacturing expanded by 52.3 in August 2021, moderating from 55.3 in July 2021. Uncertainties surrounding the pandemic and rising input costs led to the moderation. Output and new orders expanded but less as in relation to the previous month. The headline PMI services, after staying in contraction for the past three months, expanded to 56.7 in August 2021. Moreover, the business expectations index for services, that entered contraction in July 2021 for the first time in the year, reverted strongly to a five-month high of 57.1 in August 2021. Firms expect demand to improve as COVID-19 restrictions ease (Chart 32). The services sector’s strong growth is supported by improvement in trade, hotels, transport and communication; however, in relation to corresponding 2019 levels, growth remained robust for most of the high frequency indicators of the services sector (Table 4).
Overall, the domestic economic activity shows signs of rebound with the ebbing of second wave. IIP and eight core industries reflect improvement in industrial activity while available high frequency indicators for services sector in August point towards sustained recovery. Strong growth is witnessed in e-way bills, GST revenue, railway freight, electricity demand and labour force participation rates. PMI future output index continues to remain high for August with easing of COVID-19 restrictions and increased marketing effort. Further improved global demand reflected in strong export growth supports the domestic recovery. Inflation Headline CPI inflation for the month of August 2021 was released on September 13 by the NSO. It brought relief, registering a moderation for the second consecutive month (Chart 33 a). A deceleration in the price momentum (month-on-month change in prices in the current month) to around 20 bps from 70 bps a month ago, along with a favourable base effect (month-on-month change in prices a year ago) of around 50 bps, which completely offset the price momentum, brought headline inflation down 30 bps from its level a month ago to 5.3 per cent in August from 5.6 per cent in July 2021. Among constituents, food and beverages inflation moderated to 3.8 per cent in August from 4.5 per cent in July. In fact, the food and beverages index remained unchanged between August and July. A deepening of the deflation in vegetables, continuing deflation in cereals and sugar and the softening of inflation in eggs, fruits, pulses and non-alcoholic beverages were the main factors underlying the softening of food inflation. On the other hand, inflation in oils and fats, remained stubbornly elevated. Although inflation in meat and fish, and milk edged up, there was a decline in price momentum of meat and fish and a deceleration in price momentum of milk. Fuel inflation edged up by around 60 bps to an all-time high of 12.9 per cent (in the 2012=100 base year series). LPG, kerosene, and firewood and chips continued to be its key drivers. Fuel (weight of 6.84 per cent in the CPI) contributed around 15 per cent of headline inflation in August (Chart 33 b). CPI inflation excluding food and fuel or core inflation remained steady at 5.8 per cent in August 2021. While inflation under personal care and effects, transport and communication, and pan-tobacco and intoxicants sub-groups registered moderation, inflation under education, clothing and footwear and household goods and services sub-groups registered a pick-up. Inflation in housing, recreation and amusement, and health remained more or less steady in August. High frequency data from the Ministry of Consumer Affairs, Food and Public Distribution (Department of Consumer Affairs) for September so far (until 13th) point to a further decline in cereal prices. On the other hand, prices of pulses, which have been on a downward trajectory in recent months, has reversed course in September, with a sharp increase in prices of masoor. Prices of all major edible oils have edged up further in September. Prices of key vegetables - tomatoes, onions and potatoes (TOP) - have registered a decline and are lower year-on-year (Chart 34). Pump prices (average of the pump prices in the four major metros) registered some softening in September so far (September 1-13, 2021) to ₹102.26 per litre for petrol and ₹92.45 per litre for diesel (as on September 13, 2021). While kerosene prices declined in the first half of September, LPG prices were increased by ₹25 per cylinder each on August 17, 2021 and September 1, 2021 (Table 5). Input costs, as reflected in the PMIs, increased further in August across manufacturing and services. While the rate of expansion in input costs quickened in services, it showed some softening in manufacturing. The pass-through of higher input costs to selling prices remained muted in both manufacturing and services, with weakening of pricing power in the latter vis-à-vis the former. 
| Table 5: Petroleum Product Prices | | Item | Unit | Domestic Prices | Month-over-month
(per cent) | | Sep-20 | Aug-21 | Sep-21^ | Aug-21 | Sep-21 | | Petrol | ₹/litre | 84.36 | 103.03 | 102.29 | 0.2 | -0.7 | | Diesel | ₹/litre | 76.10 | 93.32 | 92.48 | -0.2 | -0.9 | | Kerosene (subsidised) | ₹/litre | 22.47 | 34.29 | 33.18 | 2.8 | -3.2 | | LPG (non-subsidised) | ₹/cylinder | 604.63 | 870.13 | 895.13 | 3.0 | 2.9 | ^: For the period September 1-13, 2021.
Note: Other than kerosene, prices represent the average Indian Oil Corporation Limited (IOCL) prices in four major metros (Delhi, Kolkata, Mumbai and Chennai). For kerosene, prices denote the average of the subsidized prices in Kolkata, Mumbai and Chennai.
Sources: IOCL; Petroleum Planning and Analysis Cell (PPAC); and RBI staff estimates. | IV. Financial Conditions The Reserve Bank remained engaged in steering and developing financial markets by enhancing operational flexibility and broadening participation, ensuring appropriate systemic liquidity, containing undue volatility and facilitating an orderly evolution of the yield curve. Efforts are underway to streamline regulations and build the necessary infrastructure for sound and efficient payments and settlement systems. During August and Septemeber so far, domestic financial conditions stayed benign, with liquidity remaining comfortable across market segments. In the money markets, there has been a perceptible easing of rates commencing from early August, notwithstanding the upscaling of amounts absorbed under variable rate reverse repo (VRRR) auctions. These operations further elicited strong appetite with the bid cover ratio of 1.8, 1.7 and 1.5, respectively, on August 13, August 27 and September 9. Furthermore, auction cut-offs have trended steadily lower since June 18, 2021. 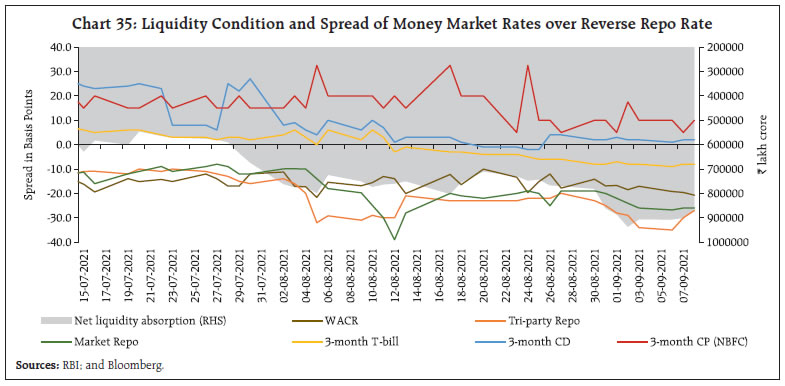 In the overnight money market segment, the spread of the weighted average call rate (WACR) below the reverse repo rate remained largely steady at around 16 bps; however, the tri-party repo and market repo rates traded, on an average, 25 bps and 21 bps below the reverse repo rate during August through September (up to 13th September). Surplus liquidity also pulled down T-bill and certificates of deposit (CD) rates below the reverse repo rate (Chart 35). During August-September (up to 13th September), the liquidity surplus absorbed under the liquidity adjustment facility (LAF) ballooned to ₹8.0 lakh crore as government spending picked up. During 2021-22 so far, the Reserve Bank has injected durable liquidity to the tune of ₹2.4 lakh crore through secondary market operations, which comprises ₹1.9 lakh crore through the G-sec acquisition programme (G-SAP) (including SDLs) and the remaining through open market purchases on the NDS-OM platform. The softening bias in money market rates also spilled over to the debt market and was amplified at the long end of the curve by dovish comments on US monetary policy normalisation at the Jackson Hole symposium (Chart 36). The lower than anticipated CPI inflation print for July 2021, softening of US treasury yields, fall in crude oil prices and expectations that additional borrowings may not be needed to bridge the GST shortfall combined to support market sentiments. The 10-year G-sec yield eased to 6.19 per cent on September 13, 2021 from 6.22 per cent at end-August 2021. In the primary market, all the auctions conducted in August sailed through smoothly, leading to the completion of nearly 89 per cent of the budgeted government borrowing slated for H1:2021-22.
The term spread, usually measured as the difference between the 10-year and the 2-year G-sec yield, has been increasing, reflected in a steepening of the yield curve since July 2021 (Chart 37a and 37b). In tandem with G-sec yields, corporate bond yields eased during August and September so far (up to 13th September). Relatively lower supply of corporate bonds than in preceding months, coupled with congenial financing conditions, imparted a softening bias to yields. Spreads over the corresponding government securities, however, widened across issuers and rating categories during September (up to 9th September) as compared with the preceding month (Table 6). | Table 6: Corporate Bond Yield and Spread | | Issuer | Rating | Yield | Spread | | Aug-21 | Sep-21 | Variation
(Sep 2021 over Aug 2021) | Aug-21 | Sep-21 | Variation
(Sep 2021 over Aug 2021) | | PSU, Banks and FIs | AAA | 5.40 | 5.25 | -14 | 44 | 47 | 3 | | AA | 6.14 | 6.05 | -9 | 118 | 127 | 9 | | BBB- | 9.28 | 9.20 | -8 | 433 | 442 | 9 | | Corporates | AAA | 5.20 | 5.19 | -1 | 24 | 40 | 16 | | AA | 6.04 | 6.02 | -2 | 108 | 123 | 15 | | BBB- | 9.99 | 9.96 | -3 | 504 | 517 | 14 | | NBFCs | AAA | 5.35 | 5.29 | -6 | 40 | 50 | 10 | | AA | 6.25 | 6.23 | -2 | 130 | 144 | 14 | | BBB- | 10.44 | 10.42 | -2 | 549 | 563 | 14 | Note: Yields and spreads are monthly averages for 3-year corporate bonds. Data for September 2021 is up to September 9.
Source: FIMMDA. |
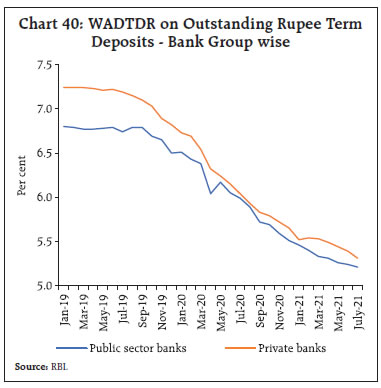
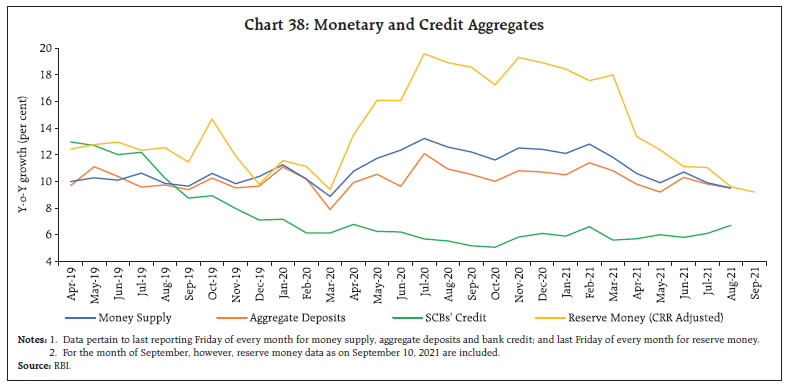 Overall monetary and credit conditions remained supportive of the economic recovery. Reserve money (RM) growth (y-o-y), excluding the first-round impact of the cash reserve ratio (CRR) restoration, slackened to 9.2 per cent as on September 10, 2021 (19.0 per cent a year ago) [Chart 38]. Currency in circulation - the largest component of RM - grew at its slowest pace of 9.4 per cent since November 2017 (22.4 per cent a year ago), mirroring subdued precautionary demand in contrast to the surge recorded a year ago during the first wave. Money supply (M3) increased by 9.5 per cent as on August 27, 2021 (12.6 per cent a year ago), below its decennial average (2012-21) of 10.9 per cent. Aggregate deposits of banks – the largest constituent of M3 – remained strong, with y-o-y growth at 9.5 per cent (10.8 per cent a year ago). Scheduled commercial banks’ (SCBs) credit to the commercial sector, which has grown faster than a year ago since July 2021, clocked a growth of 6.7 per cent (5.5 per cent a year ago) as on August 27, 2021. Surplus liquidity, coupled with forward guidance by the Reserve Bank, facilitated monetary transmission. There has been a complete pass-through of the policy rate cuts to the weighted average lending rate (fresh rupee loans) and term deposit rates of SCBs since March 2020 (Chart 39). The median term deposit rate moderated by 152 bps through March 2020 to August 2021. A bigger dip of 181 bps is discernible across shorter tenor deposits of maturity of up to one year. Private banks have effected higher pass-through to term deposit rates than public sector banks (PSBs) on account of higher deposit growth in the former. This has resulted in a convergence of weighted average domestic term deposit rates (WADTDR) on outstanding deposits of public and private sector banks (Chart 40). Since March 2020, the 1-year median marginal cost of funds-based lending rate (MCLR) of SCBs has softened cumulatively by 100 bps. In August and the first half of September, the Indian equity market remained upbeat on supportive global cues, robust GST collections, strong corporate earnings results for Q1:2021-22, and a strong pick up in the vaccination drive. The BSE benchmark gained by 9.4 per cent in August 2021, and 1.2 per cent in September so far (up to 14th September) to close at 58,247 (Chart 41). The benchmark indices crossed multiple record highs and the market closed with moderate gains with mid-cap and small-cap indices gaining by 3.3 per cent and 0.5 per cent in August, respectively, and 5.0 per cent and 4.2 per cent, respectively, in September so far. 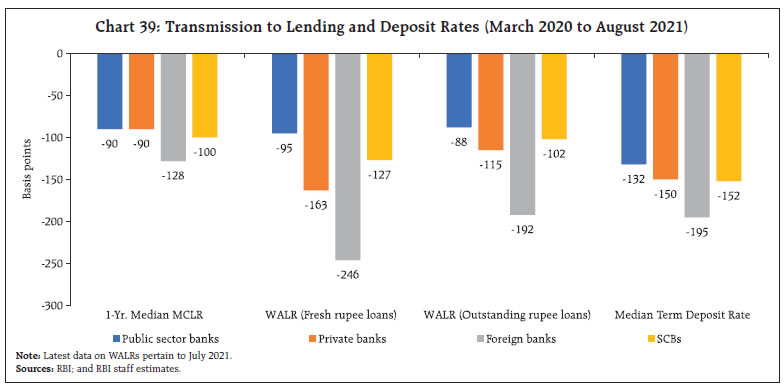
 One-year forward valuations are at 25 times earnings, as against 7-17 times for other comparator countries. Foreign portfolio investors (FPIs) bought equities in August to the tune of ₹7,454 crore, despite offloading stocks in the last week of the month. In 2021-22 so far, FPIs have been sellers in the secondary market segment while being net buyers in the primary market – investment in IPOs and other primary issuances. Domestic mutual funds expanded their investments in the Indian equity market in August and September, propelled by the success of various new fund offers. Equity funds attracted an investment of ₹8,057 crore in August. There has been a record entry of new retail investors into the stock markets through mutual funds. The contribution of monthly SIPs, which allow retail investors to invest small amounts over a long period recorded a new high of ₹9,923 crore in August (8.1 per cent higher than ₹9,182 crore in March 2021). The number of retail SIP accounts surged to 4.32 crores with 24.92 lakh new registrations in August alone6. Cumulatively, net FDI increased to US$ 13.4 billion in April-July 2021 from US$ 3.1 billion a year ago (Chart 42).
In the domestic debt market, FPIs remained net buyers for the second straight month in August 2021 on the back of an increase in domestic yields vis-à-vis global yields. In 2021-22 (up to 13th September), net investment under the Voluntary Retention Route (VRR) was to the tune of US$ 1.3 billion as compared with US$ 1.3 billion a year ago (Chart 43). The approvals and disbursements of external commercial borrowings (ECB) to India recorded a sharp increase in July 2021, reflecting an improvement in domestic business environment. Cumulatively, ECB inflows (including intercompany borrowings) to India increased to US$ 6.3 billion in April-July 2021 from US$ 6.0 billion a year ago. However, non-resident deposit flows have moderated in 2021-22 so far with net accretions to the tune of US$ 3.1 billion in April-July 2021 as compared to US$ 4.3 billion a year ago. Foreign exchange reserves reached an all-time high of US$ 642.5 billion on September 3, 2021, partly reflecting the general allocation of Special Drawing Rights (SDRs) to member countries by the International Monetary Fund (IMF) of which India received US$ 17.9 billion (Chart 44).7 The level of reserves is close to 15 months of imports projected for 2021-22. In the foreign exchange market, the INR appreciated against the US dollar in August 2021 by 0.5 per cent (m-o-m), amidst FPI inflows and softening crude oil prices. This development is reflected in the movement of the INR in terms of the 40-currency real effective exchange rate (REER) index, which appreciated by 0.4 per cent over its level a month ago (Charts 45a and 45b). Payment Systems In the payments space, digital transactions through major payment instruments sustained growth (y-o-y) in August and September (up to September 9) both in value and volume terms (Table 7). Real Time Gross Settlement (RTGS) transactions, an indicator of overall business activity, accelerated for the third consecutive month. On the retail side, payments through the National Electronic Funds Transfer (NEFT), the Unified Payments Interface (UPI), and the Bharat Bill Payments System (BBPS) gained further traction. There was a spike in the National Automated Clearing House (NACH) transaction values, owing to disbursals under the PM Kisan Samman Nidhi of more than ₹19,500 crore to beneficiaries on August 9, 20218. This bodes well for rural retail spending in the upcoming days. As a testament to the potential of the e-RUPI, the number of issuer banks has grown from 11 (on launch) to 16.9 On August 17, 2021 the Reserve Bank introduced its Financial Inclusion Index, a comprehensive index comprising 97 indicators grouped under the three broad heads – access (35 per cent weight), usage (45 per cent), and quality (20 per cent). Indicative of cumulative efforts of various stakeholders towards financial inclusion coming to fruition, the index improved to 53.9 in 2020-21 from 43.4 in 2016-17.10 In a bid to enhance financial inclusion through digital payments, the Reserve Bank has decided to extend its Payments Infrastructure Development Fund (PIDF) scheme11 to street vendors identified as part of the PM Street Vendor’s Atma Nirbhar Nidhi (PM SVANidhi Scheme) in tier-1 and tier-2 centres12, in addition to those in tier-3 to tier-6 centres who were already eligible for the PIDF scheme. 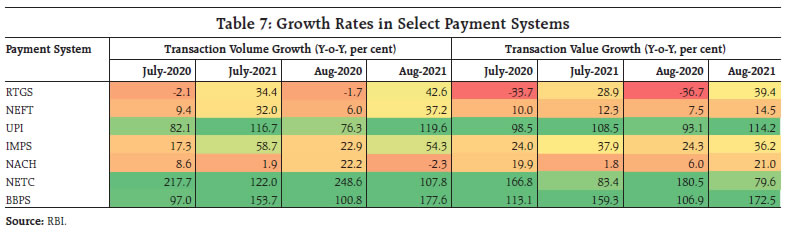 The Reserve Bank also announced a slew of changes in the card tokenisation framework to augment security of transactions and buttress customer data privacy. In addition to mobile phones and tablets, the facility of device-based tokenisation has been extended to include consumer devices – laptops, desktops, wearables, and other Internet of Things (IoT) devices.13 With effect from January 1, 2022, no entity in the card transaction/payment chain (except card issuers and card networks) would be allowed to store actual card data14 in the interest of customer data protection. However, it has also been decided to extend the device-based tokenisation framework to card-on-file (CoF) tokenisation as well, which will save customers the hassle of keying in card details for each transaction by using their tokenised cards instead. In doing so, the Bank has endeavoured to maintain a balance between customer convenience and data security. Exciting developments are underway on the account aggregator (AA) front15. AAs are NBFCs licensed by the Reserve Bank that obtain customer consent, collect their data from financial information providers (e.g., banks) and share it with financial information users (e.g., digital lenders) that provide financial services to the customers. Access to financial data under this framework creates the potential to expand the delivery of financial products and services in a secure, transparent and efficient manner. The expansion of the AA ecosystem is expected to bolster financial inclusion and provide ample room for FinTech innovation by breaking down data silos. Conclusion In the August issue, we wrote about the music of autumn drowning out the songs of spring. We did so because we believe that at the current juncture, the Indian economy is evenly poised for that gravitational slingshot that will launch it on its aspirational growth trajectory. As the enervating effects of the pandemic recede, giving way to dormant growth impulses, the choice of strategy becomes critical. Stabilisation policy – of which monetary policy is an integral element – is invested with steering the economy across the peaks and troughs of the business cycle; and as an influential voice from the central banking community pointed out – not attempt to offset what are likely to be temporary fluctuations; this ‘may do more harm than good’. Moreover, stabilisation policies operate with long and variable lags and, therefore, time-consistent policy actions that fit the prevailing conditions when they impact the economy is key. The pandemic is a shock like no other. Its short-term effects are evident and policy responses are addressing them on an ongoing basis. Policies for sustainable and inclusive growth with stability must be conditioned by an awareness of the longer-term effects of the pandemic. The trajectory of inflation is shifting down more favourably than anticipated. The inflation outcome for August has vindicated the MPC’s call for treating the May price shock as transitory and looking through it. The softening of prices of various food items is likely to extend into Q3 and contain the upside price pressures stemming from fuel and core prices on headline inflation. The task now is to consolidate these gains and carry them forward into Q4 as well. India is a price taker in respect of fuel prices, which have been broadly aligned over time with international prices. The outlook for core inflation is tied to the fortunes of the Indian economy going forward. As pandemic scars heal and supply conditions are restored with productivity gains that typically accrue after a large shock, a sustained easing of core inflation can be expected and this will reinforce the growth-supportive stance of monetary policy. In August, we believe that India passed a turning point which consolidates and thrives come September. References Kumar P., “An Economic Activity Index for India”, RBI monthly bulletin, November 2020.
Annex: E-way Bills as a Lead Indicator of GST Under the goods and services tax (GST) introduced in July 2017, all businesses with aggregate turnover of more than ₹5 crore in the previous financial year are required to file monthly GST return (GSTR-3B) by the 20th of the next month. Businesses with turnover less than ₹5 crore are allowed to file quarterly returns by 22nd or 24th of the month next to the quarter. In the last eleven months (Oct 2020 to August 2021), GST collections have exceeded ₹1 lakh crore in each month, except June 2021. This has been attributed to the ongoing economic recovery, closer monitoring against fake-billing, deep data analytics using data from multiple sources including GST, income-tax and customs IT systems and effective tax administration. Under the GST system, e-way bills are required to be generated for transport of goods whose value exceeds ₹50,000. While the e-way bills capture the transactions made in any particular month (t), the returns for these transactions are required to be filed in the next month (t+1). Thus, e-way bills generated in the month ‘t’ can be an advance indicator of GST collections in the month ‘t+1’. A plot of GST revenues in period ‘t+1’ and e-way bills in period ‘t’ reflects the close co-movement between the two (statistically significant lead correlation of around 70 per cent) [Chart A1]. It may be noted, however, that e-way bills are an indicator of trade in goods; they don’t contain any information on trade in services. In August, e-way bills registered a year-on-year growth of 33.3 per cent1, signalling that GST collections can be estimated at ₹1.1 lakh crore in September 20212. _________________________________________________________
|