by Abhyuday Harsh, Rajnish Kumar Chandra, Nandini Jayakumar and Brijesh P.^ Globally, non-banking financial institutions (NBFIs) have grown in size and complexity over the years, intertwining them with other entities in the financial system. In India too, non-banking financial companies (NBFCs) have become an integral part of the financial system which is reflected in a gradual rise in NBFCs’ credit to GDP ratio. Recognizing rapid developments in the sector along with rising interconnectedness and changing risk profile of NBFCs, the Reserve Bank introduced scale-based regulation (SBR) in October 2022. Amidst this transition, the NBFC sector remains resilient, with steady double-digit growth in credit, adequate capital, and lower delinquency ratio. Introduction Non-banking financial institutions1 (NBFIs) are important intermediaries in the global financial system, currently accounting for almost half of global financial assets. The characteristics of the NBFI sector differ across jurisdictions. With increasingly diverse and complex activities, NBFIs are becoming deeply interconnected with other segments of the financial and real economy (FSB, 2023a). Hence, it becomes critical to ensure that various policies applicable to supervised entities fit together from a system-wide perspective. One of the important features of any diverse financial system is the presence of different types of financial institutions with varying risk profiles, which necessitates differentiated regulatory treatment. To this end, scale-based regulation (SBR) for non-banking financial companies2 (NBFCs), put in place by the Reserve Bank of India (RBI) in October 2022, prescribes differential regulatory requirements based on the size, activity and perceived riskiness of NBFCs. It combines the best features of activity-based and entity-based regulations, without sacrificing the overarching goal of systemic risk management. In India, NBFCs have become an integral part of the financial system which is reflected by a gradual rise in metrics like NBFCs’ credit to GDP ratio and NBFCs’ credit to scheduled commercial banks’ (SCBs) credit (RBI, 2023). This article analyses the performance of the NBFC sector in recent times. The rest of the article is divided into the following sections. Section II provides an overview of the international landscape of the NBFI sector, with a special focus on India. Section III presents details of the regulatory evolution of the NBFC sector in India, highlighting the extant regulatory differences between banks and NBFCs and among NBFCs. Section IV analyses balance sheet dynamics, along with sectoral distribution of credit, profitability and asset quality of NBFCs. The last section of the article concludes with a few observations on emerging challenges. II. NBFIs in India: A Global Perspective NBFIs play a crucial role in the global financial system by providing services that are not necessarily provided by banks. They play a key role in enhancing access to credit and supporting economic growth. Over time, NBFIs have grown in size and complexity, which has enmeshed them with other entities in the financial system. By implication, the stress in NBFI sector may affect other parts of the financial system more rapidly and widely. To this extent the Financial Stability Board (FSB) created an annual system-wide monitoring framework for NBFIs to track innovations and identify systemic and emerging risks (FSB, 2023b). Since the Global Financial Crisis (GFC), NBFIs have increased in size and now constitute the largest component of the global financial system (Chart 1a). This ecosystem of institutions is very diverse and differ based on business models and jurisdictions. After the GFC, for the first time, NBFI assets globally contracted by more than 5 per cent in 2022. This was mainly due to the impact of higher interest rates and tightening liquidity and financial conditions which most economies experienced in 2022 owing to the inflationary pressures (FSB, 2023b). In India, the financial system remains bank-dominated. The NBFI sector trails the banking sector in terms of asset size, however, the gap between them is closing over time (Chart 1b & Table 1). Their systemic importance is increasing, as indicated in the size of NBFIs as a share of GDP. In 2022, NBFIs in India registered a growth of around 12 per cent (year-on-year), as opposed to contraction globally (Chart 2). The contraction in investment funds of the domestic NBFC sector was more than compensated by the expansion in size of lending companies which account for 79 per cent of total NBFI assets in the narrow measure (Table 2). Table 1: Key Participants in the Indian Financial System
(At end-March 2023) | | | As per cent of Total Assets | | 1. Scheduled Commercial Banks* | 53.7 | | 2. Co-operative Banks# | 4.7 | | 3. NBFIs | 41.6 | | 3.1. NBFCs^ | 15.2 | | 3.2. AIFIs^^ | 3.2 | | 3.3. Insurance Companies | 12.8 | | 3.4. Pension Funds | 1.9 | | 3.5. Mutual Funds | 8.4 | | Total | 100.0 | Notes: * refers to all scheduled commercial banks including RRBs.
# includes urban and rural credit co-operatives. Data for the latter pertain to end-March 2022.
^ includes all NBFCs and ARCs registered with RBI; and all HFCs registered with NHB.
^^ refers to five All India Financial Institutions namely, NABARD, EXIM Bank, SIDBI, NHB and NaBFID.
Sources: RBI, IRDAI and PFRDA. | To assess the extent of bank-like financial stability risks posed by NBFIs due to their interconnections, the FSB devised a ‘narrow measure’, which focuses on a subset of NBFI activities. The measure divides NBFIs into five economic functions (EFs) or activities (Table 2). At end-December 2022, the largest jurisdictions as per their share in the global narrow measure assets were the United States (30.4 per cent), eight participating Euro Area jurisdictions (21.5 per cent), China (16.3 per cent) and the Cayman Islands (12.8 per cent). The global narrow measure declined in 2022, almost entirely driven by decline in EF1 while the other four EFs continued to grow. In India, the narrow measure expanded by 7.5 per cent, almost entirely driven by EF2, while EF1 recorded a decline. 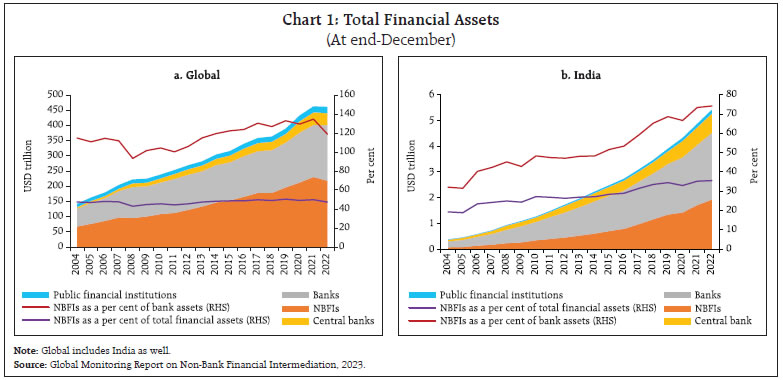

Table 2: Composition of Narrow Measure, by Entity-type and Activity
(at end-December 2022) | | Economic Function/Activity | Entity type | Economic Function wise share in Narrow Measure
(Per cent) | | AEs | EMEs | Global | India | | EF1 | Money market funds, fixed income funds, mixed funds, credit hedge funds, real estate funds | 72.6 | 81.0 | 74.3 | 20.1 | | EF2 | Finance companies, leasing/factoring companies, consumer credit Companies | 7.7 | 9.0 | 7.9 | 79.0 | | EF3 | Broker-dealers, custodial accounts, securities finance companies | 7.3 | 6.5 | 7.1 | 0.4 | | EF4 | Credit insurance companies, financial guarantors, monoline insurers | 0.3 | 0.1 | 0.2 | 0.0 | | EF5 | Securitisation vehicles, structured finance vehicles, asset-backed Securities | 9.1 | 3.1 | 7.8 | 0.4 | | Unallocated | Other financial auxiliaries assessed to be involved in bank-like financial stability risks from NBFI, but which could not be assigned to a specific economic function | 3.2 | 0.3 | 2.6 | - | | Total | | 100.0 | 100.0 | 100.0 | 100.0 | | Narrow Measure as a share of total NBFI sector | | 26.1 | 49.2 | 28.9 | 42.2 | Notes: 1. Based on data from 29 individual jurisdictions, which account for 85 per cent of global GDP and for which more granular data was available.
2. The entities listed are not exhaustive but indicate typical examples.
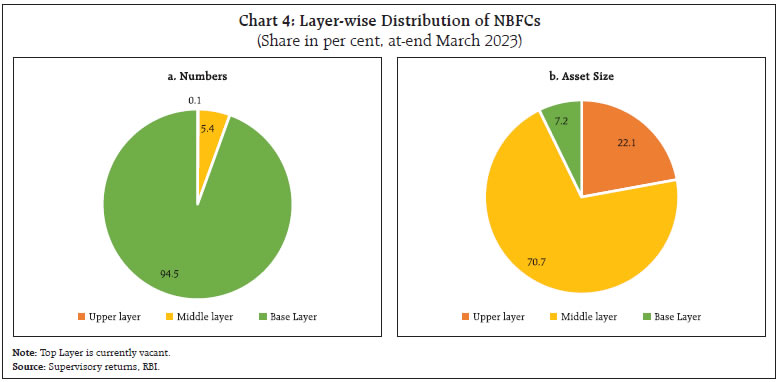
Source: Global Monitoring Report on Non-Bank Financial Intermediation, 2023. | Globally, in most advanced economies (AEs) as well as emerging market economies (EMEs), EF1 is the largest component. In countries like India and Indonesia, on the other hand, EF2, which includes lending institutions dependent on short-term funding, is the largest component. EF2 is dominated by finance companies which specialise in areas such as consumer finance, auto finance, retail mortgage provision, commercial property finance, and equipment finance. India had the third largest EF2 assets globally, behind the United States and the United Kingdom. The entities in EF2 merit special attention as they are involved in maturity transformation and may have higher interconnectedness with the banking sector. Akin to banks, along with credit intermediation, some of these entities might also be accepting public deposits and/or other forms of retail funding, which can exacerbate systemic risk during periods of stress. To address these concerns, regulators in jurisdictions where deposit-taking NBFIs operate typically differentiate these entities from banks by restricting NBFIs from offering current accounts/demand deposits. Further, these entities in general are subject to more stringent requirements as compared to other NBFI lenders (Ehrentraud, Mure, Noble, & Zamil, 2024). In India deposit-taking NBFIs do not have the deposit insurance coverage as only banks’ deposits are covered under the deposit insurance. Almost all the jurisdictions do not allow these entities to accept demand deposits (Chart 3). Thus, unlike bank regulation, for which there are global prudential standards, no such framework exists for NBFI regulation. III. Regulatory Evolution of the NBFC Sector in India Since 1964, NBFCs are being regulated by the Reserve Bank under the provisions of Chapter IIIB of the RBI Act, 1934 (RBI, 2021b). In response to the evolution of the sector over the years, the Reserve Bank has periodically updated the regulations applicable to NBFCs, transitioning from a rule-based to a principle-based regulatory approach. In 1998, NBFCs were categorised based on acceptance of public deposits, followed by introduction of systemic importance for non-deposit taking NBFCs (NBFC-ND-SI) with asset size of ₹100 crore and above in 2006. In 2014, a review of the regulatory framework for NBFCs was undertaken and the sector transitioned to an activity based regulation. Taking cues from the recommendations of expert committees3, new regulations were formulated, wherein, inter alia, threshold for systemic significance was raised from ₹100 to ₹500 crore, investment grade rating became mandatory for asset finance companies to renew existing or accept fresh public deposits and the limit for acceptance of public deposits across the sector was harmonized for rated NBFCs. Further, for NBFCs-ND-SI and NBFCs-D (deposit-taking), minimum Tier-1 capital requirement was raised to 10 per cent from 7.5 per cent along with bringing asset classification norms of NBFCs-D and NDSI in line with that of banks (RBI, 2014). 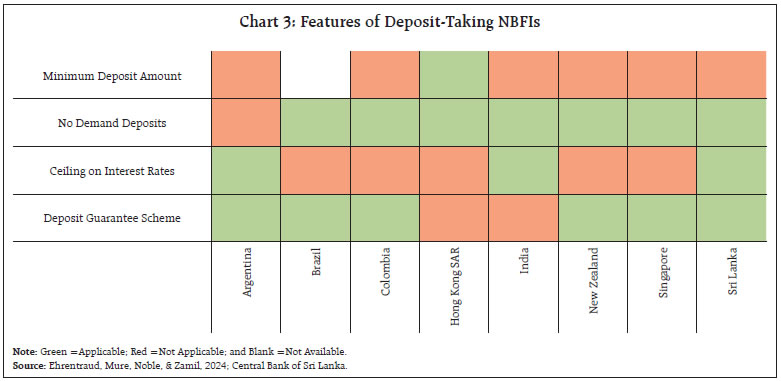 The most recent overhaul was in the form of Scale-Based Regulation (SBR), which took effect from October 1, 2022. This became imperative on account of rapid developments in the sector along with rising interconnectedness and the changing risk profile of NBFCs. Under this new regulatory framework, NBFCs are placed in any of the four layers (top, upper, middle, and base) based on size, activity, or perceived riskiness. At present, the top layer is kept vacant, and the Reserve Bank can shift NBFCs from the upper layer to the top layer, for higher scrutiny if required. SBR incorporates a hybrid approach to regulation, combining entity and activity-based regulation approaches under the pillars of prudential and conduct regulations. This approach is tailor-made for the ever-evolving NBFC sector without impeding their dynamism. Given the diverse business models within the NBFC sector, SBR envisages a layer-wise progressive increase in regulatory intensity. The extent of harmonisation of regulations between banks and upper-layer NBFCs (NBFCs-UL) on the one hand, and among NBFCs in different layers, on the other, in key areas of capital, prudential and governance guidelines is presented in Table 3. SBR places enhanced regulatory scrutiny on NBFCs-UL vis-à-vis other layers, but not at par with banks. In this way, SBR preserves the accommodative approach to regulation where the differential business models and capacity of varied players in the Indian financial ecosystem is maintained, while ensuring that financial stability is not compromised. A key area of difference between banks and NBFCs is the permissibility to accept public deposits, which exists only for a handful of NBFCs4. Since 1997, no certificate of registration has been granted to new NBFCs for acceptance of public deposits. In fact, the regulatory approach has been disincentivising deposit-taking activities of NBFCs. This allows the Reserve Bank to retain lower entry and exit barriers for starting or closing the business of NBFCs respectively and facilitate innovation and specialisation in their respective business domains (Rao, 2024). NBFCs in the base layer are subject to less stringent regulation than those in middle and upper layers in view of their small size and limited interconnectedness. Consequently, the analysis in this article is restricted to only NBFCs-UL and ML. The former occupies a significant space in the NBFC sector5, with nine NBFCs in the upper layer accounting for around one-fifth of the total assets at end-March 2023 (Chart 4). | Table 3: Important Regulatory Features of Banks and NBFCs | | Extant Regulatory Requirements | NBFCs | Banks | Remarks | | Base Layer | Middle Layer | Upper Layer | | Capital Guidelines | | Minimum Initial Capital | ✓ | ✓ | ✓ | ✓* | For a universal bank, it is ₹1,000 crore vis-à-vis ₹10 crore^ for an NBFC (to be achieved by March 31, 2027 in a phased manner). | | Capital to Risk-weighted Assets Ratio | – | ✓ | ✓* | ✓** | Capital requirement of a universal bank is comprised of credit, market, and operational risk capital charges. For NBFCs, it is based only on credit risk capital charge#. NBFC-UL are required to maintain common equity tier 1 capital of minimum nine per cent of risk weighted assets, within the overall capital requirement of 15 per cent. Gold loan NBFCs in the base layer, shall maintain a minimum Tier 1 capital of 12 percent. | | Standard Asset Provisioning | ✓ | ✓* | ✓** | ✓** | Akin to banks, NBFC-UL must maintain differential provisioning for standard assets. | | Internal Capital Adequacy Assessment Process (ICAAP) | – | ✓ | ✓ | ✓* | ICAAP for NBFCs on similar lines as prescribed for banks under Pillar 2 of Basel III norms. | | Prudential Guidelines | | Concentration of credit/Investment | – | ✓ | ✓* | ✓** | Akin to banks, large exposure framework is applicable to NBFC-UL@, however more detailed framework for banks. | | Internal Exposure Limits | – | ✓ | ✓ | ✓* | In addition to the internal limits on sensitive sector exposure, NBFC-UL must have internal exposure limits on other important (including NBFC) sector. More detailed regulation for banks. | | Governance and Disclosure Guidelines | | Disclosure Regulations | ✓ | ✓* | ✓*** | ✓** | Banks and NBFC-UL must meet disclosure requirements same as a listed company. NBFCs-UL, however, shall meet these requirements even before the actual listing. | | Listing | – | – | ✓* | ✓ | A new universal bank must get listed within six years post commencement of operations while an NBFC has three years to get listed post identification as NBFC-UL. | | Core Banking Solution (CBS)/Core Financial Services Solution (CFSS) | – | ✓ | ✓ | ✓ | NBFCs with 10 and more branches must adopt CFSS. | | Others | | Activities Permitted under relevant Acts | – | – | – | ✓ | Banks can only engage in activities that are specifically provided under the Banking Regulation Act, 1949. No such provision under RBI Act, 1934, governing NBFCs. | | Commercial Expansion | – | – | – | ✓ | Almost no regulatory restrictions on operations of NBFCs (except gold loans NBFCs), while detailed policy in place for banks. | | Priority Sector Lending (PSL) | – | – | – | ✓ | Minimum 40% of the adjusted net bank credit must be for PSL and for SFBs it is 75 per cent. NBFCs have no such requirements. | | Ceiling on Initial Public Offer (IPO) Funding | ✓ | ✓ | ✓ | ✓* | Ceiling on financing subscription to IPO for both banks and NBFCs. | Notes: 1. – Not Applicable; ✓ Applicable; ✓* Applicable and stringent; ✓** Applicable and more stringent
2. ^ For NBFC-P2P, NBFC-AA, and NBFC not availing public funds and not having any customer interface, the NOF is ₹2 crore. NBFC-IFC and IDFNBFC, the NOF is ₹300 crore.
# Except for SPDs where market risk capital applies.
@ A slightly higher limit is applicable to NBFC-IFC.
Sources: RBI, 2021a; RBI, 2021b and Rao, 2024. |
 IV. Performance of the NBFC Sector a. Balance sheet The NBFC sector continued to exhibit sustained growth during 2023, primarily driven by credit growth even as investments declined. On the liabilities side, borrowings by NBFCs grew at a lower rate than the previous year (Table 4). Assets To address some concerns regarding high growth in certain components of consumer credit, the Reserve Bank increased risk weights on select categories of retail loans by NBFCs in November 2023. The growth in unsecured loans has moderated subsequent to these measures (Chart 5). | Table 4: Consolidated Balance Sheet of NBFCs | | (₹ crore) | | | The amount outstanding at the end of | Y-o-y growth
(Per cent) | | Dec-22 | Mar-23 | Dec-23 | Dec 22 over Dec 21 | Dec 23 over Dec 22 | | 1. Share capital | 1,14,533 | 1,19,432 | 1,29,479 | 11.6 | 13.0 | | 2. Reserves and surplus | 7,97,827 | 8,58,744 | 8,79,323 | 20.8 | 10.2 | | 3. Public deposits | 1,15,850 | 89,322 | 1,06,405 | 22.5 | -8.2 | | 4. Total borrowings | 27,67,612 | 29,43,224 | 30,72,171 | 16.3 | 11.0 | | 5. Other liabilities | 2,91,141 | 3,29,415 | 3,25,561 | 7.1 | 11.8 | | Total liabilities / assets | 40,86,963 | 43,40,138 | 45,12,938 | 16.4 | 10.4 | | 1. Loans and advances | 31,42,244 | 33,65,863 | 35,88,631 | 16.4 | 14.2 | | 2. Investments | 5,25,669 | 5,38,714 | 4,98,172 | 19.7 | -5.2 | | 3. Cash & bank balances | 1,61,094 | 1,70,274 | 1,57,821 | 6.7 | -2.0 | | 4. Other assets | 2,57,956 | 2,65,287 | 2,68,315 | 17.0 | 4.0 | Notes: 1. Data are provisional and pertain to only NBFCs-UL and NBFCs-ML.
2. Numbers may not add up as all components are not reported here.
Source: Supervisory returns, RBI. |
 Unsecured loans comprise around 26 per cent of NBFCs’ credit, with middle layer having a higher share within their loan portfolio (Chart 6a). Across NBFC layers, the initial steep growth in unsecured loans and the subsequent deceleration was driven by middle layer NBFCs. The pace of expansion in unsecured loans by upper layer NBFCs has also softened, although it remains in double digits (Chart 6b). Over 70 per cent of NBFC credit is channeled toward industry and retail sectors, with the former accounting for around two-fifth share at end-December 2023, which makes it the largest recipient of NBFC credit (Chart 7a). In 2023, credit to industry, services and retail loans grew in double digits, while that of agriculture and allied activities moderated owing to base effect (Chart 7b). The credit to retail sector was driven on the back of strong growth in lending for vehicles, consumer durables, gold loans and credit card receivables segments.
A layer-wise and ownership-wise analysis provides insights into the structure of the sector. Industry is the largest recipient of NBFC credit benefitting from the presence of large government-owned6 NBFCs which lend to the infrastructure segment. All NBFCs in the upper layer are privately owned and mainly cater to the credit demands of the retail sector (Chart 8). Liabilities NBFCs rely heavily on borrowings, both from markets and banks for their funding needs (RBI, 2023). NBFCs-UL, by virtue of their strong balance sheets and market standing, rely more on secured borrowings. NBFCs-ML on the other hand, rely more on unsecured borrowings at presumably higher rates (Chart 9a). Banks remain the dominant source of funds for NBFCs, not only via direct lending, but also indirectly via subscription of debentures and commercial paper issued by NBFCs. In an attempt to encourage NBFCs to broad base their fund raising and limit reliance on banks, the Reserve Bank had increased risk weights on bank lending to NBFCs in November 2023. Since then, there has been a sharp deceleration in NBFCs’ borrowing from banks, particularly by NBFCs-UL (Chart 9b).
b. Financial Performance and Prudential Indicators of the NBFC Sector There has been a consistent improvement in the bottom line of the sector, as gauged by the profitability indicators, i.e., return on assets (RoA) and return on equity (RoE) [Chart 10]. NBFCs-UL have outperformed NBFCs-ML with regard to profitability, mainly on account of lower provisions against non-performing assets (NPA) and lower interest expenses.
The asset quality of the sector has also improved. While the gross NPA (GNPA) ratio of upper layer NBFCs is lower than that of middle layer, the latter maintained adequate provisions to account for their riskier loan portfolio, thereby bringing their net NPA (NNPA) ratio below that of NBFCs-UL (Chart 11). The decline in the GNPA ratio has been seen across sectors, with retail loan segment having the lowest GNPA ratio despite high unsecured retail lending (Chart 12a). The slippage ratios7 in important categories of retail loans such as, inter alia, vehicle loans and gold loans, have been elevated vis-à-vis other sectors, although they have moderated at end-December 2023 except in credit card receivables segment (Chart 12b).
Another important feature of the sector is the relatively low NPA ratio of government-owned NBFCs (Chart 13). As alluded to earlier, non-government NBFCs, especially in the middle layer, focus on retail lending, where slippages have been elevated in recent times. With the increase in risk weights on some categories of retail loans, NBFCs with a large portfolio of unsecured loans may require additional capital to adhere to regulatory capital requirements. However, the sector as a whole, both NBFCs-UL and NBFCs-ML, remains well-capitalised, indicating their financial readiness to meet higher requirements (Chart 14). Under the prompt corrective action (PCA) framework, capital and asset quality are the key areas for monitoring the health of NBFCs, and will become applicable for government-owned NBFCs from October 1, 2024. With adequate capital and low NNPA at end-December 2023, these NBFCs are comfortably placed. PCA framework is already effective for other NBFCs since October 1, 2022. V. Conclusion Globally, NBFIs play a key role in financing the real economy and supporting economic growth. Different countries implement regulations for NBFIs which suit their specific requirements. Compared to India, non-banks in advanced countries are much bigger in size and operate in a complex market environment. The NBFC sector in India remains resilient under the SBR framework. At end-December 2023, the sector continued to exhibit double-digit growth in credit, adequate capital and low delinquency ratio. The recent regulatory measure of extension of PCA norms to government-owned NBFCs is expected to further strengthen the sector. In response to the recent increase in risk weights on bank lending to NBFCs, they have begun to diversify their funding sources and reduce excessive reliance on borrowings from banks. Secured retail credit like gold loans, vehicle and housing loan, along with industry and service sector loans continue to exhibit robust growth. Going forward, NBFCs need to remain mindful of the rapidly evolving financial landscape and the emerging risks and challenges, especially in the domains of cyber-security and climate risk. The assurance functions namely, risk management, compliance and internal audit, play a crucial role in maintaining the robustness and resilience of both the financial entity and the overall financial system (J, Swaminathan, 2024). In light of their growing role in the Indian financial system, it is incumbent upon NBFCs to proactively identify and manage risks and bolster their assurance functions to ensure that the NBFC sector maintains a sustainable growth trajectory. References Ehrentraud, J., Mure, S., Noble, E., & Zamil, R. (2024). Safeguarding the financial system’s spare tyre: regulating non-bank retail lenders in the digital era. FSI Insights on policy implementation No 56. Bank for International Settlements. FSB. (2023a). Enhancing the Resilience of Non-Bank Financial Intermediation-Progress report. FSB. (2023b). Global Monitoring Report on Non-Bank Financial Intermediation. J, Swaminathan. (2024). Shared Vision, Shared Responsibilities: Advancing Assurance in Banking Supervision. Speech by Shri Swaminathan J, Deputy Governor, Reserve Bank of India. Rao, M. R. (2024). No More a Shadow (of a) Bank. Remarks delivered by Shri M. Rajeshwar Rao, Deputy Governor, Reserve Bank of India. RBI. (2014). Revised Regulatory Framework for NBFC. Retrieved from https://www.rbi.org.in/scripts/NotificationUser.aspx?Id=9327. RBI. (2023). Report on Trend and Progress of Banking in India, 2022-23 RBI. (2021a). Scale Based Regulation (SBR): A Revised Regulatory Framework for NBFCs. RBI. (2021b). Discussion Paper on Revised Regulatory Framework for NBFCs- A Scale Based Approach.
|