Global economic recovery is still weak even after eight years of large-scale monetary accommodation in advanced economies (AEs). This in turn has increased volatility in global financial markets creating challenges for the emerging market and developing economies (EMDEs). Leverage in general has increased since the global financial crisis, though for countries in which interest rates are close to zero or even negative, reducing debt may look less imperative. Developments on the Greek debt crisis and uncertainty over the timing of the rate increase by the US Fed remain immediate possible triggers for volatility in global financial markets and consequent capital outflow and exchange market pressures in EMDEs. On the domestic front, going forward, economic performance is expected to improve, though managing expectations continues to be a challenge for policymakers. While headline inflation has moderated, price pressures arising from a possible sub-normal monsoon and uncertainties about crude oil prices remain significant risks. External vulnerability has reduced on account of moderation of the current account deficit. Global backdrop 1.1 Eight years since the onset of global financial crisis and after easy money and tough regulations, the global economy is in search of a sustainable growth path, even as inflation in many advanced economies (AEs) is still below their respective ‘comfort’ levels. In an increasingly integrated world, the uncertainties associated with continuation/ withdrawal of large-scale stimulus by the world’s three biggest central banks have increased challenges for global financial markets and consequently for emerging market and developing economies (EMDEs). On the other hand, heightened activity in mergers and acquisitions worldwide, buyback of shares by companies and booming stock prices are indications that the stimulus programmes seem to have neither adequately translated into desirable levels of economic risk-taking nor stimulated business investments in new capacities with the resultant excessive ‘financial risk-taking’ underpinning the future of global financial stability. 1.2 One of the consequences of ultra-easy monetary policies is the build-up of excessive leverage and carry trades within and across borders creating potential volatilities in capital flows, exchange and interest rates and dilemmas for central banks, especially in EMDEs. In many countries an increase in leverage and the consequent debt overhang is making recovery even more difficult (Chart 1.1). Thus, if the global economy does not return to a sustainable path to recovery, and more so if the recovery falters, there is not much monetary and fiscal space available given the zero or near zero interest rates in most advanced economies and ballooning debt.  1.3 Amidst such dilemmas, the recurring theme of the actions taken by central banks over the last one year or so has been the ‘surprise element’1 even as forecasting central banks’ actions is becoming trickier. Either this might be the result of a rethink about the strategy of ‘forward guidance’, which may be creating complacency in markets or it might well be that the incoming data are not adequate for reasonable guidance. It could also be that central banks might be evaluating strategies of acting differently from expectations so as to contain the impact of speculative financial interests that may build up if such market expectations are allowed to be realised. This is all the more pertinent at this juncture for EMDEs since disorderly unwinding of speculative positions may trigger negative feedback loops in financial markets. 1.4 In the meanwhile, the announcement of large stimulus programme by the European Central Bank (ECB) initially pushed yields down, with around US$ 2 trillion worth of Eurozone bonds said to be yielding negative returns. It was clearly established that the zero lower bound for interest rates could be breached with some central banks in Europe (ECB, central banks of Switzerland and Denmark) offering interest rates that were sub-zero. Carry trades across the Atlantic picked up pushing the dollar index (Chart 1.2) to multi-year highs. The euphoria ended with sovereign bonds crashing in the Eurozone during April-May, inflicting large losses on bond holders thus turning apparent ‘safe haven’ assets into highly risky ones. 1.5 One explanation for the reversal of sentiments could be that markets are no longer worried about deflation and are even expecting inflation to pick up momentum as seen from the breakeven inflation rates (Chart 1.3a).2 However, while market measures of inflation expectations in AEs have been increasing since early 2015, the increase in government bond yields, especially German bunds, was not commensurate until the recent sudden and sharp spike in yields (Chart 1.3b). While the impact of the yield surge did not leave corporate/high yield bonds untouched, their spread3 over sovereign yields remained largely unchanged (Chart 1.4) perhaps indicating that it is the interest rate outlook rather than default risk that is driving the European bond prices.   1.6 One concern that engaged policymakers much earlier than the global financial crisis was the existence of global imbalances, that is, current account imbalances. Some countries had persistent large deficits and others experienced large and perpetual surpluses. While imbalances in countries such as the US and China have moderated, a strong US dollar and Germany’s expected record current account balances at close to 8 per cent of GDP is causing discomfiture both within the EU and for the US even as Germany’s expected current account surplus is far above the 6 per cent limit set by the European Commission4 (Chart 1.5). Such imbalances may further complicate global recovery. 1.7 Going ahead there are two immediate possible concerns for financial market volatility and stability. First, failure to arrive at a workable solution for the Greek debt crisis, though at this juncture bond markets in Europe appear to be sanguine to this (Chart 1.6). Second, the uncertainty over the timing of rate increase by the US Federal Reserve. These triggers could lead to rapid decompression of term and risk premia leading to financial market volatility and losses, especially since market making activity/market liquidity is getting concentrated around the most liquid instruments while falling in the relatively less liquid securities.5 EMDEs, including India, therefore need to be prepared for the risks of greater volatility in financial markets and reversal of capital flows. Domestic economy Growth 1.8 Economic growth in India is estimated to have improved to 7.3 per cent during 2014–15 as per the recent revisions in the National Account Statistics (base 2011–12). However, notwithstanding this improvement, higher growth seems at odds with low credit growth, relatively lower flow of resources to the commercial sector, low capacity utilisation, subdued growth in the index of industrial production and muted corporate performance6, among others (Chart 1.7). Progress is being made on reforms and economic performance is expected to improve going forward. Inflation 1.9 Consumer price index (CPI) based inflation is expected to be pulled down by base effects till August and thereafter to increase to about 6 per cent by January 2016.7 However, the El-Nino phenomenon and a projected sub-normal monsoon may have a potential inflationary impact. Similarly, the trend in global crude oil prices amidst considerable volatility and exchange rate movement could increase upside risks to inflation if capital flows moderate. 1.10 Utilising the policy space made available due to declining inflationary pressures against the backdrop of low capacity utilisation, credit off-take and signs of weak production, the Reserve Bank frontloaded monetary accommodation by reducing the policy interest rate by 75 basis points during H1(Jan- Jun) of 2015. Saving and investment 1.11 Declining trends in domestic savings and investment in recent years have been a cause of concern for the Indian economy (Chart 1.8a). The gross domestic saving rate declined for the second consecutive year to around 30 per cent of gross national disposable income (GNDI) in 2013–14 largely reflecting the reduction in the household saving rate (Chart 1.8b) even as the saving rate of private corporations improved and public sector (including general government) saving rate hovered around at a relatively low level. Concomitantly, the investment rate (gross capital formation as a per cent of GDP) declined in 2012–13 and 2013–14. Government finances 1.12 Over the last few years, government finances have been under greater strain. The fiscal consolidation process that has been followed has generally been expenditure-led as deficit targets have been met primarily through cuts in expenditure. Government total expenditure fell from 14.8 per cent of GDP in 2011-12 to 13.0 per cent of GDP in 2014-15 (provisional). However, this strategy has adversely impacted capital expenditure which is inimical to sustained growth. There is a reorientation in government expenditure in 2015-16 wherein capital expenditure is budgeted to be higher alongside a reduction in expenditure on major subsidies, which should improve the quality of government expenditure (Chart 1.9). Fiscal consolidation over the medium term has been designed with the judicious mix of reduction in total expenditure and improvement in gross tax revenue, both, as a percentage of GDP. To achieve improvement in the quality of government expenditure it is important to realise budgeted revenues on the one hand and adhering to budgeted expenditures on subsidies on the other. Government is committed to progressively pursuing subsidy reforms in a manner that will ensure efficient targetting of subsidies while also saving scarce financial resources for investment in infrastructure and pursuit of new development programmes announced by the government.  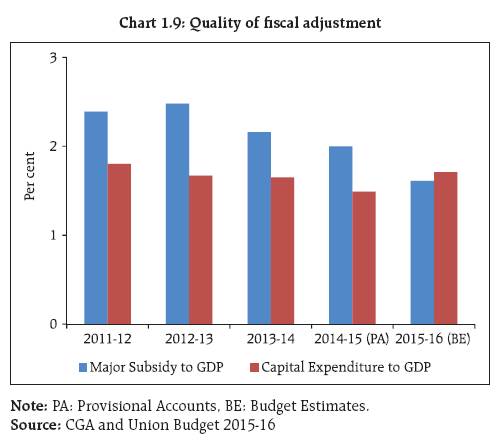 External sector 1.13 External vulnerability has reduced considerably due to a fall in the current account deficit and improvement in capital inflows. Moderation in gold imports and fall in crude oil prices have helped keep the trade deficit contained (Chart 1.10). However, given muted expected global growth and the possible lower trend in capital inflows following the anticipated increase in policy rates in the US, risks emanate from uncertainties in crude oil prices as well as from lower exports. Further possible adverse exchange rate movement arising out of financial market volatality may negatively affect corporates with unhedged foreign exchange exposures and may have implications for financial stability. In the meanwhile, the Reserve Bank has taken a significant step by proposing to allow Indian corporates to issue Rupee linked bonds overseas. Corporate sector 1.14 Concerns remain around corporate sector leverage, especially in the context of its ability to service debt. (It may, however, be seen from Chart 1.11 that India’s indebtedness declined since the onset of GFC). While leverage has increased, the ability to repay debt (solvency ratio)8 and debt servicing ability (interest coverage ratio)9 of the corporates has declined (Chart 1.7d and Chart 1.12)10. Besides its adverse impact on banks’ balance sheets, high leverage of corporates may hinder the transmission of monetary policy impulses as corporates may not be in a position to benefit from falling interest rates due to high levels of debt. Asset prices Housing 1.15 In terms of key asset prices, the housing sector has significant implications for growth and the stability of the financial sector. However in the Indian context, relatively simple financial products relating to housing sector as also the relatively low level of stressed assets in retail housing segment do not pose significant systemic risks. Besides, growth in house prices in India has moderated considerably in the recent past (Chart 1.13). Based on parameters such as the loan to income (LTI) ratio and the loan to value (LTV) ratio, stress in the Indian housing market appears to be low (Chart 1.14), though LTI ratios are looking up. Securities market 1.16 Concerns over foreign portfolio investors (FPIs) usually emerge from their potential short term destabilizing effects given their ability to move large amounts of capital over jurisdictions in short periods of time. Over 2013 and 2014 the Indian stock markets experienced robust growth (Chart 1.15a) and significant inflows from FPIs (Chart 1.15b). During 2015 (up to June 12, 2015), the performance of the Indian stock markets was relatively muted in comparison to other peer nations and FPIs turned net sellers in May. This trend could get accentuated further should risk aversion take hold in the face of possible shocks from global events against the perception of the gap between expectations and delivery in reforms. 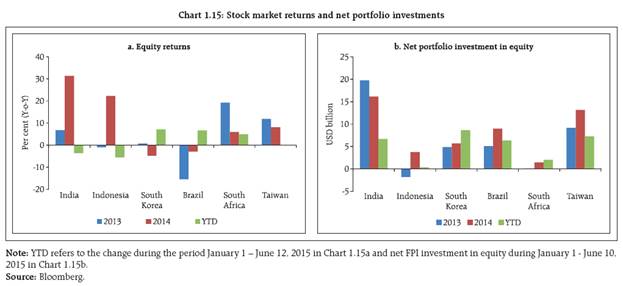 1.17 Over the past year, overall, there has been a significant increase in investments by FPIs in government securities and corporate bonds with a corresponding increase in utilisation of limits under both the categories (Chart 1.16). FPIs based in the US accounted for a large share of assets under custody (AUC) by all FPIs (Chart 1.17). The ‘search for yield’ inflows may be affected when the US Federal Reserve increases rates amid possible volatility in global financial markets and ‘safe haven flows’, though India seems to be better prepared to deal with volatility now than it was in the past.
|