During 2016-17, while deposit growth of scheduled commercial banks (SCBs) picked up, credit growth remained sluggish putting pressure on net interest income (NII), particularly of the public sector banks (PSBs). While profitability ratios of SCBs showed a marginal increase, PSBs as a group continue to show a negative return on assets (RoA). The gross non-performing advances (GNPAs) of the banking sector rose but the stressed advances ratio declined between September 2016 and March 2017. Overall, capital to risk-weighted assets ratio (CRAR) improved from 13.4 per cent to 13.6 per cent between September 2016 and March 2017 owing to improvement in capital adequacy of private and foreign banks. The macro stress test indicates that under the baseline scenario, GNPAs of SCBs may rise from 9.6 per cent in March 2017 to 10.2 per cent by March 2018. The banking stability indicator (BSI) worsened between September 2016 and March 2017 due to deterioration in asset quality and profitability. Section I Scheduled commercial banks1 2.1 In this section, the soundness and resilience of scheduled commercial banks (SCBs)2 is discussed under two broad sub-heads: i) performance and ii) resilience using macro-stress tests through scenarios and single factor sensitivity analyses. Performance 2.2 SCBs’ credit growth declined on y-o-y basis, across the bank-groups, whereas, deposit growth increased between September 2016 and March 2017. SCBs’ capital to risk-weighted assets ratio (CRAR) improved from 13.4 per cent to 13.6 per cent between September 2016 and March 2017. However, the Tier-I leverage ratio3 at the system level declined marginally during the same period (Chart 2.1). 2.3 SCBs’ annual profit after tax (PAT) expanded by 48.0 per cent in 2016-17 as against a decline of 61.6 per cent in 2015-16, mainly due to higher increase in other operating income (OOI) and lower rise in risk provisions. However, public sector banks (PSBs) once again recorded negative returns on their assets. The share of OOI in total operating income increased sharply from 30.7 per cent in 2015-16 to 36.2 per cent in 2016-17, mostly contributed by profit on securities trading. Continuing deceleration in the growth of assets of SCBs along with deterioration in their asset quality resulted in a secular decline in the share of net interest income (NII) in total operating income (Chart 2.1). Asset quality 2.4 The gross non-performing advances (GNPAs) ratio of SCBs rose from 9.2 per cent in September 2016 to 9.6 per cent in March 2017. The net non-performing advances (NNPAs) ratio of SCBs increased marginally from 5.4 per cent in Septement 2016 to 5.5 per cent in March 2017. The stressed advances7 ratio declined from 12.3 per cent to 12.0 per cent due to fall in restructured standard advances. While there is a fall in stressed advances ratio in agriculture, services and retail sectors, the stressed advances ratio in industry sector, however, rose from 22.3 per cent to 23.0 per cent mainly on account of sub-sectors such as cement, vehicle, mining & quarrying and basic metals. Accretion of new NPAs from restructured standard advances declined in 2016-17 (Chart 2.2). Credit quality of large borrowers8 2.5 Large borrowers account for 56 per cent of gross advances and 86.5 per cent of GNPAs of SCBs, whereas, top 100 large exposures account for 15.2 per cent of gross advances. Non-performing accounts within top 100 exposures contribute to 25.6 per cent of GNPAs of SCBs. While the level of GNPAs of large borrowers increased between September 2016 and March 2017, their restructured standard advances declined during the same period resulting in reduction of total stressed advances by 1.8 per cent. The category 2 of special mention accounts9 (SMA-2) as percentage of gross advances also declined across bank-groups. Moreover, the share of large borrowers in SCBs’ total loans as well as GNPAs showed a reduction between September 2016 and March 2017 (Chart 2.3). Risks Banking stability indicator 2.6 The banking stability indicator (BSI) worsened between September 2016 and March 2017. While the soundness, reflecting the capital position, showed improvement, the asset quality and profitability deteriorated further (Charts 2.4 and 2.5). Resilience – Stress tests Macro stress test-Credit risk10 2.7 The resilience of the Indian banking system against macroeconomic shocks was tested through a macro stress test for credit risk. These tests encompassed assumed baseline and two (medium and severe) adverse macroeconomic stress scenarios (Chart 2.6). The adverse scenarios were derived based on standard deviation in the historical values of the macroeconomic variables: up to 1 standard deviation (SD) for medium stress and 1.25 to 2 SD for severe stress (10 years historical data). 2.8 The stress test indicated that under the baseline scenario, the average GNPA ratio of all SCBs may increase from 9.6 per cent in March 2017 to 10.2 per cent by March 2018. However, if the macroeconomic conditions deteriorate, the GNPA ratio may increase further under such consequential stress scenarios (Chart 2.7). 2.9 Under the assumed baseline macro scenario, two banks may have CRAR below minimum regulatory level of 9 per cent by March 2018. However, if macro conditions deteriorate, six banks may record CRAR below 9 per cent under severe macro stress scenario. Under such severe stress scenario, the system level CRAR may decline from 13.3 per cent in March 2017 to 11.2 per cent by March 2018 (Chart 2.8). 2.10 Under such severe stress scenario, one bank may have common equity Tier 1 (CET 1) capital to risk-weighted assets ratio below minimum regulatory required level of 5.5 per cent by March 2018. The system level CET 1 capital ratio may decline from 10.2 per cent in March 2017 to 8.6 per cent by March 2018 (Chart 2.9). Sensitivity analysis: Bank level12 2.11 A number of single factor sensitivity stress tests13 (top-down), based on March 2017 data, were carried out on SCBs14 to assess their vulnerabilities and resilience under various scenarios.15 The same set of shocks was used on select SCBs to conduct bottom-up stress tests. SCBs’ resilience with respect to credit, interest rate, and liquidity risks as also due to drop in equity prices was studied. Credit risk 2.12 A severe credit shock is likely to impact capital adequacy and profitability of a significant number of banks. Under a severe shock of 3 SD16 (that is, if the average GNPA ratio of 59 select SCBs moves up to 15.6 per cent from 9.6 per cent), the system level CRAR and Tier-1 CRAR will decline to 10.4 per cent and 7.9 per cent respectively. The impairment in capital at the system level could be about 24 per cent. Reverse stress test results show that it requires a shock of 4.33 SD to bring down the system level CRAR to 9 per cent. On the other hand, the SCBs would lose their entire annual profit before tax (PBT) of FY 2016-17 if the GNPA ratio moves up by 0.71 SD to 11 per cent. At the individual bank-level, the stress test results show that 25 banks having a share of 44.4 per cent of SCBs’ total assets might fail to maintain the required CRAR under the shock of a large 3 SD increase in GNPAs. PSBs were found to be severely impacted with the CRAR of 22 PSBs likely to go down below 9 per cent (Charts 2.10 and 2.11). 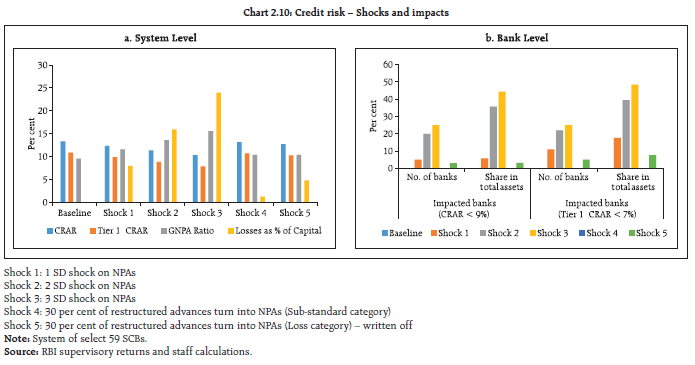  Credit concentration risk 2.13 Stress tests on banks’ credit concentration risks on their stressed advances portfolio showed that 12 banks, comprising about 12 per cent of the assets, may fail17 to maintain 9 per cent CRAR in the extreme scenario of the top 3 individual borrowers failing to repay. The impact could be 103.6 per cent of PBT under the scenario of a default by the most stressed borrower and 154.5 per cent in case the top two stressed borrowers fail. The impact on CRAR at the system level under the assumed scenarios of failure of the top one, two and three stressed borrowers will be 71, 107 and 130 basis points (Chart 2.12).  2.14 Stress tests on banks’ credit concentration risks, considering top individual borrowers according to their exposures, showed that the impact18 (under three different scenarios) was significant for two banks, comprising about 1 per cent of the aggregate assets, which may fail to maintain 9 per cent CRAR in at least one of the scenarios. The losses could be 60 per cent of PBT under the scenario of a default by the top individual borrower and 105 per cent in case the top two individual borrowers default. The impact on CRAR at the system level under the assumed scenarios of default by the top three individual borrowers will be 96 basis points (Chart 2.13). 2.15 In order to ascertain the vulnerability of individual banks to credit concentration, simulation under five different stress scenarios wherein top group borrowers of individual banks default simultaneously was carried out. The losses could be around 6.7 per cent and 12.3 per cent of the capital at the system level under the assumed scenarios of default19 by the top group borrower and the top two group borrowers of individual banks. As many as 10 banks will not be able to maintain their CRAR level at 9 per cent if top five group borrowers default (Table 2.1). 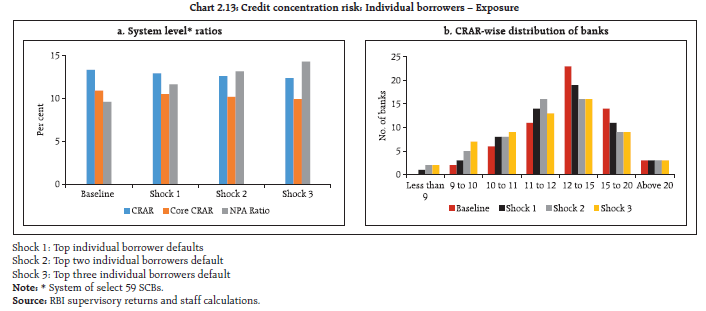
| Table 2.1: Credit concentration risk: Group borrowers – Exposure | | Shocks | System level* | Bank level | | CRAR | Core CRAR | NPA ratio | Losses as % of capital | Impacted banks (CRAR<9%) | | Baseline (Before shock) | 13.3 | 10.9 | 9.6 | --- | No. of banks | Share in total assets of SCBs (in %) | | Shock 1 | The top 1 group borrower defaults | 12.5 | 10.1 | 13.6 | 6.7 | 2 | 1.0 | | Shock 2 | The top 2 group borrowers default | 11.8 | 9.4 | 16.9 | 12.3 | 3 | 2.9 | | Shock 3 | The top 3 group borrowers default | 11.2 | 8.8 | 19.7 | 16.9 | 7 | 11.8 | | Shock 4 | The top 4 group borrowers default | 10.7 | 8.3 | 22.0 | 20.9 | 9 | 16.4 | | Shock 5 | The top 5 group borrowers default | 10.3 | 7.8 | 24.1 | 24.4 | 10 | 21.4 | Note: * System of select 58 SCBs.
Source: RBI supervisory returns and staff calculations | Sectoral credit risk 2.16 Credit risk arising from exposure to the infrastructure sector (specifically power, transport and telecommunications) was examined through a sectoral credit stress test where GNPA ratio of the sector was assumed to increase by a fixed percentage point impacting the overall GNPA ratio of the banking system. The results showed that shocks to the infrastructure segment will considerably impact the profitability of banks, with the most severe shock (15 per cent of restructured standard advances and 10 per cent of standard advances become NPAs and move to the loss category) completely wiping out the recorded profits of FY 2016-17. The most significant effect of the single factor shock appears to be on the power and transport sectors (Chart 2.14). Interest rate risk 2.17 For investments under available for sale (AFS) and held for trading (HFT) categories (direct impact), a parallel upward shift of 2.5 percentage points in the yield curve will lower the CRAR by about 109 basis points at the system level (Table 2.2). At the disaggregated level, five banks accounting for about 5.3 per cent of the total assets could be impacted adversely with their CRAR falling below 9 per cent. The total loss of capital at the system level is estimated to be about 9.2 per cent. The assumed shock of a 2.5 percentage points parallel upward shift of the yield curve on the held to maturity (HTM) portfolios of banks, if marked-to-market (MTM), will reduce the CRAR by about 279 basis points resulting in 21 banks’ CRAR falling below 9 per cent. The income impact on SCBs’ banking books20 could be about 24.9 per cent of their latest annual PBT under the assumed shock of a parallel downward shift of 2.5 percentage points in the yield curve.21 | Table 2.2: Interest rate risk – Bank groups – shocks and impacts | | (under shock of 250 basis points parallel upward shift of the INR yield curve) | | (per cent) | | | PSBs | PVBs | FBs | | AFS | HFT | AFS | HFT | AFS | HFT | | Modified duration | 4.0 | 4.9 | 2.5 | 5.2 | 1.1 | 3.8 | | Share in total investments | 37.1 | 0.2 | 34.3 | 3.3 | 86.0 | 14.0 | | Reduction in CRAR (bps) | 134 | 51 | 151 | | Source: RBI supervisory returns and staff calculations. | Equity price risk 2.18 Under the equity price risk, impact of a shock of a fall in the equity price index, by 25, 35 and 55 per cent, on bank capital was examined. The system-wide CRAR would decline by only 36 basis points from the baseline under the 55 per cent drop scenario, while the average CRAR for the banks remains well above 9 per cent (Chart 2.15). Impact of the equity price index drop is extremely limited for the overall system because the banks typically have low proportion of capital market exposures on their balance sheets, considering the regulatory limit prescribed on banks’ exposures to capital markets. Liquidity risk 2.19 The liquidity risk analysis aims to capture the impact of deposit run-offs and increased demand for the unutilised portions of credit lines which were sanctioned/committed/guaranteed. Banks in general are expected to withstand liquidity shocks with their high quality liquid assets (HQLAs)22 and statutory liquidity ratio (SLR) investments. In assumed scenarios, there will be increased withdrawals of un-insured deposits23 and simultaneously there will also be increased demand for credit resulting in withdrawal of the unutilised portions of sanctioned working capital limits as well as utilisation of credit commitments and guarantees extended by banks to their customers. 2.20 Using their HQLAs required for meeting day-to- day liquidity requirements, most banks (51 out of the 59 banks in the sample) will remain resilient in a scenario of assumed sudden and unexpected withdrawals of around 12 per cent of deposits along with the utilisation of 75 per cent of their committed credit lines (Chart 2.16). The residual SLR portfolios of SCBs offer further resilience (Chart 2.17). Bottom-up stress tests 2.21 A series of bottom-up stress tests (sensitivity analyses) were conducted for the select sample banks,24 with the reference date as on March 31, 2017. The results of the bottom-up stress tests carried out by select banks also testified to the banks’ general resilience to different kinds of shocks. While confirming the top-down stress tests results in general, the bottom-up stress tests also pointed out that most banks could withstand the impact of the shocks, though the impact was relatively more severe on some banks, especially in case of shocks imparted on NPAs, with their stressed CRAR positions falling below the regulatory minimum of 9 per cent (Chart 2.18). 2.22 The results of bottom-up stress tests for liquidity risk show the impact of liquidity shocks on select banks. Liquid assets ratios25 using various definitions reflect the liquidity position of (select) banks under different scenarios. The results show that SLR investments and cash reserve ratio (CRR) deposits would help the banks sustain themselves against the liquidity pressure from sudden and unexpected withdrawal of deposits by depositors. The banks have higher liquid asset ratios compared to the exercise last year given the increased assets allowed as HQLA26 and the general increase in liquidity following the withdrawal of specified bank notes (SBNs) in November 2016 (Chart 2.19). Stress testing the derivatives portfolio of banks 2.23 A series of bottom-up stress tests (sensitivity analyses) on derivative portfolios were conducted for select sample banks27 with the reference date as on March 31, 2017. The banks in the sample, reported the results of four separate shocks on interest and foreign exchange rates. The shocks on interest rates ranged from 100 to 250 basis points, while 20 per cent appreciation/depreciation shocks were assumed for foreign exchange rates. The stress tests were carried out for individual shocks on a stand-alone basis. 2.24 In the sample, the MTM value of the derivatives portfolio for the banks varied with PSBs and PVBs, except one, registering small MTM, while FBs had a relatively large positive as well as negative MTM. Most of the PSBs and PVBs had positive net MTM, while most of the FBs recorded negative net MTM (Chart 2.20). 2.25 The stress test results showed that the average net impact of interest rate shocks on sample banks were negligible. The foreign exchange shock scenarios showed relatively higher impact in March 2017 (Chart 2.21). Section II Scheduled urban co-operative banks Performance 2.26 At the system level,28 the CRAR of scheduled urban co-operative banks (SUCBs) increased from 13.0 per cent to 13.6 per cent between September 2016 and March 2017. However, at a disaggregated level, CRAR of five banks were below the minimum required level of 9 per cent. GNPAs of SUCBs as a percentage of gross advances declined from 8.6 per cent to 7.2 per cent and their provision coverage ratio29 increased from 47.2 per cent to 54.2 per cent during the same period. Further, RoA declined from 0.9 per cent to 0.6 per cent while the liquidity ratio30 rose from 34.7 per cent to 35.9 per cent during the same period. Resilience – Stress tests Credit risk 2.27 The impact of credit risk shocks on the CRAR of SUCBs was observed under four different scenarios.31 The results show that under a severe shock (scenario iv) of increase in GNPAs by two SD, which moves into loss category, the system level CRAR of SUCBs may come down below the minimum regulatory requirement. At individual level, a significant number of banks (35 out of 54) may not be able to maintain the minimum CRAR. Liquidity risk 2.28 A stress test on liquidity risk was carried out using two different scenarios; i) 50 per cent and ii) 100 per cent increase in cash outflows, in the 1 to 28 days’ time bucket. It was further assumed that there was no change in cash inflows under both the scenarios. The stress test results indicate that SUCBs may be significantly impacted under a stress scenario (out of 54 banks, 21 banks under Scenario i and 35 banks under Scenario ii). Section III Non-banking financial companies 2.29 As of March 2017, there were 11,517 non-banking financial companies (NBFCs) registered with the Reserve Bank, of which 179 are deposit-accepting (NBFCs-D). There were 220 Systemically Important Non-Deposit accepting NBFCs (NBFCs- ND-SI)32. All NBFC-D and NBFCs-ND-SI are subjected to prudential regulations such as capital adequacy requirements and provisioning norms along with reporting requirements. Performance 2.30 The aggregate balance sheet size of the NBFC33 sector expanded by 14.5 per cent during 2016-17 as compared to 15.5 per cent during 2015- 16. Loans and advances increased by 16.4 per cent and investments increased by 11.9 per cent in March 2017 (Table 2.3). In terms of borrowings, commercial paper outstanding rose by 70.3 per cent and debentures outstanding increased by 28.3 per cent as on March 31, 2017, while, bank borrowings declined by 3.7 per cent. 2.31 Net profit was down by 2.9 per cent during 2016-17. Net profit as a percentage of total income also came down from 18.3 per cent in 2015-16 to 14.0 per cent in 2016-17. RoA and RoE also declined during the same period (Tables 2.3 and 2.4). | Table 2.3: Consolidated balance sheet of NBFC sector: Y-o-Y growth | | (Per cent) | | | Mar-16 | Mar-17 | | 1. Share Capital | 4.8 | 15.2 | | 2. Reserves and Surplus | 14.3 | 12.2 | | 3. Total Borrowings | 15.3 | 15.0 | | 4. Current Liabilities and Provisions | 31.8 | 16.0 | | Total Liabilities / Assets | 15.5 | 14.5 | | 1. Loans & Advances | 16.6 | 16.4 | | 2. Investments | 10.8 | 11.9 | | 3. Others | 12.7 | 7.9 | | Income/Expenditure | | | | 1.Total Income | 15.8 | 8.9 | | 2. Total Expenditure | 15.8 | 9.6 | | 3. Net Profit | 15.6 | -2.9 | | Source: RBI supervisory returns. |
| Table 2.4: Select ratios of NBFC sector | | (Per cent) | | | Mar-16 | Mar-17 | | 1. Capital market exposure (CME) to total assets | 8.5 | 7.8 | | 2. Real Estate Exposure (REE) to total assets | 4.8 | 5.6 | | 3. Leverage Ratio | 2.8 | 2.8 | | 4. Net Profit to Total Income | 18.3 | 14.0 | | 5. RoA | 2.1 | 1.8 | | 6. RoE | 7.9 | 6.8 | | Source: RBI supervisory returns. | Asset quality and capital adequacy 2.32 GNPAs of the NBFC sector as a percentage of total advances declined from 4.9 per cent to 4.4 per cent between September 2016 and March 2017. NNPAs as a percentage of total advances also declined from 2.7 per cent to 2.3 per cent (Chart 2.22). 2.33 As per extant guidelines, NBFCs34 are required to maintain a minimum capital consisting of Tier-I35 and Tier-II capital, of not less than 15 per cent of their aggregate risk-weighted assets. The CRAR of NBFCs declined from 23.1 per cent to 22.0 per cent between September 2016 and March 2017 (Chart 2.22). Resilience – Stress tests System level 2.34 Stress test on credit risk for NBFC sector as a whole for the period ended March 2017 was carried out under three scenarios: (i) GNPA increasing by 0.5 SD, (ii) GNPA increasing by 1 SD and (iii) GNPA increasing by 3 SD. The results indicate that in the first scenario CRAR of sector may decline to 21.6 per cent from 22.0 per cent, in the second scenario, it may decline to 21.5 per cent and in the third scenario it may decline to 21.0 per cent but remained significantly above the regulatory minimum required level of 15 per cent under all the scenarios. Individual NBFCs 2.35 Stress test on credit risk for individual NBFCs was also conducted for the same period under the same three scenarios. The results indicate that under the first two scenarios, around 8 per cent of companies, will not be able to comply with the minimum regulatory capital requirement of 15 per cent, while 11 per cent of companies will not be able to comply with the minimum regulatory CRAR norm under the third scenario. Section IV Interconnectedness36 Interbank37 market 2.36 The size of the interbank market increased from ₹ 7.3 trillion in September 2016 to around ₹ 8 trillion in March 2017. The interbank exposures constituted nearly 6.2 per cent of the total assets of the banking system in March 2017. Fund-based segment that dominated the interbank market had a share of nearly 84 per cent in March 2017 as against 81 per cent in September 2016 (Chart 2.23). 2.37 PSBs continued to be the largest contributors in the interbank market with a share of 66 per cent followed by PVBs at 21 per cent and FBs at 13 per cent (Chart 2.24). 2.38 Composition of short-term (ST) fund based (interbank)38 exposure shows that the highest share is of short-term deposits followed by short-term loans. Similarly, composition of long-term (LT) fund based exposure shows that the highest share is of loans and advances followed by long-term debt instruments (Chart 2.25). Network structure and connectivity 2.39 The network structure39 of the banking system showed that the number of dominant banks declined from nine to three during the period from March 2012 to March 2017 (Chart 2.26). 2.40 The degree of interconnectedness in the banking system, measured by the connectivity ratio40, decreased gradually since 2012 indicating that the links/ connections between the banks have reduced over time. However, it has remained almost at the same level in the current half-year. The cluster coefficient41 which depicts local interconnectedness remained consistent during the period from March 2012 to March 2017 indicating that the clustering/ grouping within the banking network has not changed much over time (Chart 2.27). Network of the financial system 2.41 From the perspective of larger financial system, SCBs were the dominant players accounting for nearly 51 per cent of the bilateral exposure (both payables and receivables) followed by asset management companies managing mutual funds (AMC-MFs) at around 13 per cent, NBFCs at 12 per cent, all-India financial institutions (AIFIs) at 7 per cent, insurance companies and housing finance companies (HFCs)42 at around 8 per cent. UCBs and pension funds together accounted for nearly 1 per cent of the bilateral exposure in the financial system. 2.42 The AMC-MFs followed by the insurance companies were the biggest fund providers in the system, while the NBFCs followed by the SCBs and HFCs were the biggest receivers of funds. Within the SCBs, however, both the PVBs and the FBs had a net payable position vis-à-vis the entire financial sector, whereas the PSBs had a net receivable position (Chart 2.28 and Table 2.5).
| Table 2.5: Inter-sector assets and liabilities – March 2017 | | (₹ billion) | | Fin. Entity | Receivables | Payables | | PSBs | 6096.1 | 3152.1 | | PVB | 2512.7 | 6584.8 | | FB | 908.9 | 1396.4 | | AMC-MFs43 | 6942.8 | 485.5 | | Insurance companies44 | 4632.2 | 87.6 | | NBFCs45 | 377.0 | 6067.3 | | UCBs46 | 144.6 | 42.1 | | FIs (NABARD, Exim , NHB, SIDBI) | 1765.3 | 2156.9 | | PFs | 394.9 | 1.1 | | HFCs47 | 470.5 | 4271.2 | Note: The receivable and payable amounts do not include transactions among entities of the same group.
Source: RBI supervisory returns and staff calculations. | 2.43 Among the lenders (i.e. those who have net receivable position against the rest of the financial system), the funds lent by AMC-MF, insurance companies and PSBs increased in March 2017 as compared to September 2016. Among the borrowers, the funds borrowed by All India FIs (viz. NABARD, EXIM, NHB, SIDBI) decreased, whereas, those by NBFCs, PVBs, FBs increased (Chart 2.29). Interaction between SCBs, AMC-MFs and insurance companies48 2.44 At the end of March 2017, the gross receivables of AMC-MFs from the financial system was around 39 per cent of its average assets under management (AUM), while the gross receivables of the banking system was around 10.4 per cent of its total assets. 2.45 The banking sector had a gross exposure (receivable) of nearly ₹ 154 billion in March 2017 towards the insurance and mutual fund sectors taken together (as against ₹ 134 billion in September 2016). At the same time, the combined exposure (gross receivable) of AMC-MFs and insurance companies towards the banking sector was nearly ₹ 4.8 trillion (as against ₹ 4.4 trillion in September 2016), which accounted for nearly 3.7 per cent of the total liabilities of the banking system in March 2017. Exposure to NBFCs 2.46 NBFCs were the largest net receivers of funds from the financial system with SCBs accounting for 41 per cent, followed by AMC-MFs (at 35 per cent) and insurance companies (at 20 per cent). Pension funds accounted for nearly 2 per cent of the net borrowings by NBFCs from within the financial system.49 Exposure of Pension funds50 2.47 Pension funds were net lenders in the financial system with a gross exposure (receivable) of ₹ 395 billion in March 2017. Within the financial system as referred to in the analysis here, nearly 37 per cent of the exposure (gross receivables) of pension funds was to the NBFC sector followed by the banking sector (26 per cent) and HFCs (25 per cent) (Chart 2.30).51 Exposure to housing finance companies 2.48 HFCs were net receiver of funds from the financial system: SCBs (37 per cent) followed by AMC-MF (32 per cent) and insurance sector (20 per cent) (Chart 2.31). Contagion analysis52 2.49 A contagion analysis using network tools is a stress test which is carried out to estimate potential losses that could happen in the event of failure53 of one or more banks. The estimated impact under joint solvency-liquidity contagion shows that in the event of failure of trigger bank, the maximum solvency losses could be nearly 11 per cent of Tier-I capital of the banking system, while the erosion in terms of liquidity could be about 33 per cent of the total liquidity buffer of the banking system (Charts 2.32 and 2.33). Among these banks, the most connected bank may result in greater losses to the system. However, the quantum of losses due to contagion have significantly reduced for most of the banks in March 2017 as compared to September 2016 as liquidity in the system improved due to increased deposits following the withdrawal of specified bank notes (SBNs) in November 2016.
|