Signature of the Members of the Household Finance Committee Sd/-
Dr. Pawan Gopalakrishnan
Member
RBI | Sd/-
Mr. Suresh Mathur
Member
IRDAI | | | | Sd/-
Mr. Prabhas Rath
Member
SEBI | Sd/-
Dr. Alpana Vats
Member
PFRDA | Sd/-
Prof. Tarun Ramadorai
Chairman
Imperial College, London | Members of the Committee on Household Finance | Name | Organization | | | Prof. Tarun Ramadorai | Imperial College, London | Chairman | | Dr. Pawan Gopalakrishnan | Reserve Bank of India | | | Mr. Suresh Mathur | Insurance Regulatory and Development Authority | | | Mr. Prabhas Rath | Securities and Exchange Board of India | | | Dr. Alpana Vats | Pension Fund Regulatory and Development Authority | | Members of the Research Subcommittee | Prof. Tarun Ramadorai | Imperial College, London | Chairman | | Dr. Cristian Badarinza | National University of Singapore | | | Dr. Vimal Balasubramaniam | University of Oxford | | | Dr. Pawan Gopalakrishnan | Reserve Bank of India | | | Ms. Manuela Kristin Gunther | CAFRAL, ODI Fellow | | Members of the Technology Subcommittee | Prof. Tarun Ramadorai | Imperial College, London | Chairman | | Ms. Smita Aggarwal | Omidyar Network | | | Dr. Pawan Bakshi | BMGF | | | Mr. Gautam Bharadwaj | pinBox Solutions | | | Mr. Sanjay Jain | ekSTEP and iSPIRT Foundation | | | Dr. Rajiv Lall | IDFC Bank | | | Mr. Rahul Matthan | Trilegal | | | Mr. Varad Pande | Dalberg | | Members of the Pensions and Insurance Subcommittee | Mr. Suresh Mathur | Insurance Regulatory and Development Authority | Co-Chair | | Dr. Alpana Vats | Pension Fund Regulatory and Development Authority | Co-Chair | | Mr. Antony Jacob | Apollo Munich Health Insurance | | | Mr. M.R. Kumar | Life Insurance Corporation of India | | | Mr. Anand Pejawar | SBI Life Insurance Co. Ltd. | | | Ms. Neera Saxena | The New India Assurance Co. Ltd. | | | Mr. Tapan Singhel | Bajaj Allianz General Insurance | | Members of the Legal Advisory Subcommittee | Mr. Rahul Matthan | Trilegal | | Mr. Rohan Shah | Rohan Shah's Chambers | | Mr. Somasekhar Sundaresan | SS Chambers | | Mr. Anu Tiwari | AZB Partners |
ACKNOWLEDGEMENTS The Committee on Household Finance (henceforth “the committee”) was given a daunting task. The first few items in the terms of reference (ToR) direct us to compare Indian household financial markets to those in other major world markets, and to identify areas in which Indian household allocations deviate from what we might consider to be desirable allocations. The remaining items then direct us to propose solutions to these problems. The brief, therefore, is both diagnostic and surgical, both positive and normative. This is a difficult act to pull off – but we have been fortunate to have enormous help and support to attempt this ambitious exercise. The committee met on six separate occasions, and each such meeting was roughly a day long. These meetings were spent listening to evidence and engaging in debates with a range of highly knowledgeable and thoughtful individuals and firms from across the spectrum of Indian household finance. We are most grateful to these individuals and groups who gave of their time so generously to present both data and opinions to the committee, and we list them all at the end of this report.1 We would also like to thank Satish Chander, R. R. Nerurkar, Mayank Saxena, and Latha Vishwanath from the Department of Banking Regulation at the RBI for their help in coordinating these meetings. In the run up to each of these meetings of the committee, there were a number of subcommittee meetings, averaging roughly four sub-committee meetings for each meeting of the committee. During these meetings, members of the sub-committees worked tirelessly to produce the material that constitutes this report. We briefly outline their contributions below. Our research subcommittee has generated genuinely new and insightful research on household finance in India, exploiting multiple waves of nationally representative datasets (such as the All India Debt and Investment Survey in India, as well as counter-part micro-surveys from Australia, Germany, the UK, the US, Thailand, and China), as well as more specialized surveys (such as the Finscope survey, the Financial Inclusion Insights Survey, and the ICE 360 degree survey) that focus on particular aspects of financial market participation in India. They have also collated work from authoritative and informative secondary sources on these topics, and have interacted extensively with world-renowned experts in these areas to pull in relevant content. A special mention is owed to Cristian Badarinza and Vimal Balasubramaniam for serving as an informal “drafting committee” for this report. Without their efforts, this report would simply never have come to fruition. Our technology subcommittee, populated with experts in various aspects of finance, technology, and indeed, financial technology, thoroughly debated the complex issues surrounding the promise and peril of technological solutions in household finance. They have contributed to forward-thinking policy solutions to remove obstacles for the supply side to make progress in helping to address problems which simultaneously require customisation and scale. Our pensions and insurance subcommittee has provided very useful suggestions from the industry perspective which have fed into many of our new product recommendations and innovations, and our legal subcommittee, aided by talented and hardworking staff, has helped with detailed and thoughtful opinions about the feasibility of our policy recommendations. In addition to these contributions from individuals directly affiliated with the committee, or invited to present at committee meetings, we have greatly benefited from help, enlightening conversations, and detailed comments from a number of individuals that are contributors to this important area of finance. We also list these individuals at the end of this report, and are hugely grateful for their generous contributions. It is worth noting that for many, working in household finance is not merely an occupation, but rather, a vocation, and the levels of passion and enthusiasm we have witnessed have been quite extraordinary. The Chairman would like to thank Imperial College Business School and the Brevan Howard Centre and its director, Prof. Franklin Allen, for support, as well as the staff of the Centre especially Jaswinder Gill. Finally, we thank Jo Leask for excellent administrative support. Overall, we have been lucky to be able to assemble such a distinguished and thoughtful group of contributors to the report, and the quality of the final product will, we hope, do justice to their contributions.
EXECUTIVE SUMMARY In the first part of this report, we provide our responses to points i) and ii) on the ToR. We describe the results of an international benchmarking exercise, in which we document how Indian households allocate assets and take on liabilities both along the lifecycle and across the wealth distribution, and compare these patterns to those evident in micro-data on households in a range of advanced and emerging economies. We find several attributes of Indian households that are exceptional in the international context. Importantly, these distinctive features of Indian household balance sheets cannot be explained by differences in the demographic characteristics, wealth, or income of Indian households relative to their counterparts in other countries. We also find that these properties of Indian balance sheets are difficult to explain using a standard lifecycle portfolio choice model, which we calibrate using estimated data on the income dynamics of Indian households. Taken together, it appears that these patterns are likely driven by unique aspects of Indian households’ financial decision-making. The distinctive features of Indian household balance sheets are: 1. A large fraction of the wealth of Indian households is in the form of physical assets (in particular, gold and real estate). This is unusual in the international context, and especially unusual for younger households, and for households in the bottom 40% of the wealth distribution, i.e., those with the lowest amounts of gross assets. 2. Despite the high holdings of real estate, mortgage penetration is low early in life, and subsequently rises as households age. This is also at variance with Indian households’ counterparts in other countries, where debt has a characteristically hump-shaped pattern over the lifecycle. Indian households tend to borrow later in life and are more likely to reach retirement age with positive debt balances, which is a source of risk given that they are no longer earning income during these years. a) We note that 1. and 2. above are clearly connected. Social arrangements in which households bequest housing wealth to future generations and in turn receive support during retirement are an underlying determinant of these patterns. Such traditional approaches to household financial management have likely evolved over time as a rational response to prevailing economic conditions. We note, however, that these traditional structures are increasingly under pressure from shifting demographic patterns, social norms, and changing economic conditions, introducing risks to economic well-being especially as households age. 3. The Indian household finance landscape is distinctive through the near total absence of pension wealth. Pension accounts and investment-linked life insurance products exist, but they are only used frequently by households located in a small group of states, while in most other states, the contribution of pensions wealth to household wealth is negligible. 4. We document high levels of unsecured debt, and perhaps more importantly, debt taken from non-institutional sources such as moneylenders. Such debt generates high costs for Indian households, and as we document later in the report, is likely to lead to households becoming trapped in a long cycle of interest repayments. We note that this phenomenon has been well-documented over the decades, but nevertheless remains stubbornly persistent. 5. There are low levels of insurance penetration (life and non-life) despite numerous sources of risk such as rainfall (leading to income shocks in largely agrarian segments of the population), health shocks, and catastrophes such as floods or cyclones. 6. There is a strong negative correlation between participation in insurance and the incidence of non-institutional source debt, suggesting that households are dealing with risks through high-cost borrowing ex-post as opposed to insuring against such risks ex-ante. We find that this is a costly approach for households, as high interest payments on informal debt impose substantially greater costs on Indian households relative to the (counterfactual) policy of purchasing actuarially fair insurance. -
This is an important observation, since it suggests that efforts to reduce informal lending will likely fail in an environment in which households are not sufficiently well-insured against risks. -
We note that some of these risks could be mitigated through strengthening the public provision of health and social welfare services. We also observe that this finding could arise from tight constraints on household budgets which do not permit them to take on insurance ex-ante; or as a consequence of adverse selection, moral hazard, or other issues causing premiums in the insurance market to become unaffordable for households. Next, we attempt to evaluate the implications of these features of Indian household balance sheets in response to point ii) on the ToR. We also attempt to evaluate the size of any gains from counterfactual policies that households might pursue, and conclude (in this partial equilibrium exercise) that Indian households can potentially realise significant benefits from several changes to their balance sheets. In particular, we find that: -
If the current patterns of allocation are maintained, demographic projections indicate that there will be significant additional pressure on the demand for assets such as gold and real estate in the coming decades. -
Over the coming decade and a half, the elderly cohort is expected to grow by 75 percent. Only a small fraction of this cohort has saved in private pension plans. Moreover, a large segment of the population of households in all age cohorts has not actively taken steps to insure adequate financial coverage during retirement. The need to finance adequate consumption during retirement is therefore a looming issue, and when combined with the low penetration of insurance, households appear particularly vulnerable to adverse shocks later in life. -
Indian households can benefit greatly by re-allocating assets towards financial markets and away from gold. If households in the middle third of the gold holdings distribution re-allocated a quarter of their existing gold holdings to financial assets, on average, they could earn an amount equivalent to 0.8% of their annual income per year (on an ongoing flow basis). Expressed differently, the wealth gain in real present value terms accruing from this shift would be sufficient to move these households roughly 1 percentage point (pp) up the current Indian wealth distribution. For households that hold more substantial amounts of gold, i.e., those in the top third of the cross-sectional distribution, the ongoing annual income gain from re-allocating a quarter of their gold holdings to financial assets is 3.4%, which when capitalised, translates into a upwards movement of roughly 5 pp along the Indian wealth distribution. These projected gains are almost always above zero, even when we account for volatility which may lead to different realisations of returns on gold and financial assets. -
For the median Indian household, shifting from non-institutional debt to institutional debt can lead to gains equivalent to between 1.9%–4.2% of annual income on an ongoing basis, or equivalently when capitalised, to upward moves along the current Indian wealth distribution of 2.5 pp–5.5 pp. These gains are almost always above zero in the cross-section of all households, regardless of the reason that the debt was incurred (medical costs, or financing business operations), and regardless of whether the debt is secured by collateral or unsecured. We also note that these numbers are quite conservative, as we accept self-reported “friends and family” interest rates as zero, despite the fact that there is likely significant non-monetary compensation demanded for the provision of such informal credit. -
By avoiding the interest burden of emergency credit associated with medical costs, the median Indian household can gain 0.4%–1.2% of annual income on an ongoing basis, or equivalently, move up the Indian wealth distribution between 0.4 pp–1.6 pp. Households could avoid such costs if they were able to access strengthened public health services or if they were able to purchase actuarially fair insurance ex-ante that exactly covered the ex-post debt principal incurred in order to finance future emergency (such as health) expenditure. Having documented that the expected gains from these changes to Indian households’ balance sheets are high, we turn to point iii) on the ToR. Here, we uncover significant evidence for the underlying causes of the deviations between Indian household financial allocations and what might be considered to be more desirable financial allocation and behaviour. In particular, we find that the following causes are important: 1. High transactions costs and bureaucratic impediments to efficient participation create a high “nuisance factor” for households hoping to engage in formal financial markets. For example, we find from the empirical analysis of several household surveys that Indian households strongly associate formal banking institutions with large administrative burdens and complicated paperwork. 2. Trust issues that households face in their participation in formal financial markets. We find that these arise from households’ often negative perceptions of formal providers, which are exacerbated by occasional poor experiences with unscrupulous providers. These trust issues appear to correlate highly with the income level of the household, and low income households often report their belief that access to financial products is the prerogative of elite groups in society. This lack of trust in financial institutions helps to explain the tendency of households to eschew financial products and to invest in instruments such as gold instead. It also helps to explain the continuing reliance of Indian households on traditional systems of provision of financial services. 3. The use of non-institutional debt is related to the type of expenditure for which the liability is incurred, and the urgency of the financial need. This points once again to non-institutional debt serving as a high-cost, imperfect form of insurance. 4. Behavioural factors such as a lack of self-confidence in engaging with formal financial systems. For example, we find that the lack of participation in the market for life insurance products appears to be related to the self-perceived financial management skills of the household head. As in many other parts of the world, we also find that cognitive issues such as present bias are widely prevalent, and can lead to issues such as low pensions take-up. 5. The high complexity of Indian households’ financial needs: -
We note that there are significant differences across households located in different states even after controlling for households’ demographic characteristics (for example, there is a particularly high demand for gold in southern Indian states). This is further evidence that traditional and cultural factors are strong determinants of observed allocations. Effective policies in Indian household finance should attempt to complement, or at least recognise, such longstanding traditional approaches to financial management in order to be effective. -
Self-reported financial goals of households are often driven by “life events,” such as marriage, which disproportionately affect the household budgets of the poor because of the high fixed costs of such events. This highlights the importance of traditional social insurance in driving household financial decisions. Notably, such life events appear to be more important to households than goals such as financing education. -
There are the usual lifecycle and wealth considerations leading to different demands by households. As added complications in the Indian context, informal labour market arrangements are widely prevalent, and income derived from agrarian sources generates significant variation in the timing and frequency of income that households receive. Such complications can make the often rigid contractual terms in standard financial products undesirable for such households. -
Decisions concerning homeownership, savings product choice, insurance, pensions, mortgages, and emergency credit are inter-dependent and inter-related, increasing the total complexity burden on household decisions. 6. There is no unified framework or guidelines for the provision of high quality and low cost financial advice to Indian households. The diagnosis of these problems naturally leads to a set of policy responses, which we are directed to provide in points iv) and v) of the ToR. To set the context for our recommendations, we make several observations about promising solutions in Indian household finance: -
Indian households require customised financial products that account for their unique economic conditions, longstanding traditions, idiosyncratic life goals, and the complexity of their financial circumstances. -
Such customised financial products are required at low marginal costs of servicing additional households. That is, they need to be scalable. -
These products need to be relevant to households, in the sense that they should be delivered in a manner that is free from incentive problems, at a price that is fair, and dispensed alongside financial advice that is in the best interests of households. -
Complicated paperwork and bureaucratic impediments can exacerbate feelings of embarrassment and shame for low income and poorly educated households in their initial engagement with financial markets. Financial product terms and conditions should therefore be explained to households in a manner that is both intuitive and salient. -
Technological solutions hold significant promise for providing customisation and scalability simultaneously, and technological interfaces can help in depersonalising potentially embarrassing face-to-face interactions when households are making financial decisions. -
Given the cognitive/behavioural issues that we uncover, “nudge” solutions, where sensible default options are provided to households also appear appealing to improve Indian household finance outcomes. These observations lead us in turn to our recommendations, which we view as complementary to those in previous important committee reports in this space. These recommendations are listed in order of how quickly we believe they can be implemented: 1. We propose a set of sector-specific recommendations to improve the functioning of mortgage, collateralised lending, insurance, pensions, and gold markets. We believe that these “old fashioned” recommendations are potentially helpful in fixing obvious gaps in Indian household financial markets, and are an important complement to the technology-based solutions which we also propose. We also propose improvements to official survey data on Indian household finance, in an effort to spur more detailed analysis and research of these issues in the future, and to assist in the implementation of evidence-based policy. 2. At present, financial advice regulations are product-specific and vary across regulators. We make proposals about the current structure of financial advice in India. We suggest a set of standardised norms across regulators for financial advice to be implemented in a phased and unified manner, supported with a fiduciary standard for financial advisors. We propose that the provision of financial advice be clearly separated from the distribution of financial products, and provided in a manner that avoids conflicts of interest. We also discuss the promise of robo-advice, which appears to offer both scale and customisation, which, as discussed earlier, are twin imperatives for Indian household finance. 3. We propose a number of measures to streamline the delivery of and access to financial products that are relevant for Indian households, to eliminate or reduce informal transactions costs, such as filling in forms, bureaucratic impediments such as certification and verification costs, and costs arising from any uncertainty in knowing when approvals will happen. In particular, we propose that the total time and effort taken to engage in the financial market be substantially reduced through a combination of digital end-to-end distribution networks and the movement of know-your-customer (KYC) requirements into purely paperless form (i.e., eKYC). We also propose that regulators and service providers strive to enable quick, cost-effective, and seamless switching between financial service providers. 4. We suggest improvements to the electronic collateralised lending registry (CERSAI) to aid the development of this important market, as well as improvements to the RBI’s recent policies on account aggregation to help households form a comprehensive and integrated view of their financial situation. 5. We describe a minimum set of financial products which Indian households should have in order to effectively harness the benefits of formal financial markets. Many of these products already exist, and indeed, are being delivered to households via government programmes such as PMJDY. Nevertheless, we believe that it is useful to provide this list for several reasons. -
To serve as a checklist that can be used to evaluate progress on participation and use of household financial markets in India. -
Where this is not already the case, products on the list could be made readily available to households, either seeded automatically at the point of PMJDY account opening (or added later to PMJDY accounts as a default but “opt-out” option), or by automatically pre-qualifying households to access all of these products at the point of e-KYC for any single product. -
While households will have access to the essential minimum kit of assets by default, we propose requiring (either or both of) explicit opt-ins and mandatory education before households access more complex products. This is not to inhibit households from portfolio optimization, but rather, to permit an opportunity for households to reflect on whether the added complexity will appropriately serve their needs. -
We recommend additional design features which could simplify access to, or improve the use of, several of the simple products which are currently out in the market. 6. We recognise that technological solutions to household finance problems often rely on households sharing personal data with financial product providers. This raises obvious issues of privacy. While this is not the principal focus of our recommendations, we do provide thinking about a sensible framework for data privacy in Indian household finance, and suggest the adoption of a rights-based privacy framework in contrast with the more common consent-based privacy framework. 7. Finally, we stress the need for flexible regulatory processes to further encourage financial innovation that will benefit households. Towards this aim, we propose the creation of a regulatory sandbox to allow regulators to facilitate small-scale tests by financial technology firms. In such a carefully controlled environment, certain regulations may be temporarily relaxed, and households can be allowed to participate in new products. The goal is to collect empirical evidence which can ultimately lead to better policy solutions, whilst simultaneously evaluating the risk of any new product or technology. Such an institution can provide a structured avenue for regulators to engage with the financial supply-side, develop innovation-enabling regulations, and holds promise to facilitate the delivery of relevant, customised, and low-cost financial products to Indian households.
CHAPTER 1
INDIAN HOUSEHOLD FINANCE: AN INTERNATIONAL COMPARATIVE ANALYSIS The average Indian household holds 84% of its wealth in real estate and other physical goods, 11% in gold and the residual 5% in financial assets. Retirement accounts play a very limited role in household balance sheets, even at the top of the wealth distribution. Indian households continue to accumulate debt as they approach retirement age, and most debt is unsecured (56%), reflecting an unusually high reliance on non-institutional sources such moneylenders. We compare these patterns to those of households in a range of developed and developing countries, using detailed micro-level data from representative national surveys. Households in advanced economies hold substantially more financial assets than their Indian counterparts, are much more likely to finance home purchasing with a mortgage, and allocate a sizeable fraction of their wealth to retirement savings over the course of their lifetime. The variation in household demographic characteristics and wealth explains only a negligible fraction of the difference between India and the rest of the world. The remainder can be attributed to differences in household behaviour, which is partly determined by exposure to the Indian institutional context. Using a calibrated portfolio choice life cycle model, we can only rationalise the large holdings of physical assets at young ages and during retirement by creating another puzzle, which is the lack of significant secured debt take-up and collateralization of household asset holdings. The model also cannot explain the observed prominence of physical assets in middle-age, exactly when the potential for the accumulation of financial wealth would be largest, and the low mortgage loan take-up during young age, when most households expect an upwards-sloping labour income profile. The first item of the terms of reference (ToR) of the committee calls for a benchmarking exercise, where the current depth of household financial markets in India are to be compared to those in other major world markets. To conduct this first analysis, we adopt methodology from Badarinza, Campbell, and Ramadorai (2016), Campbell (2016), and Badarinza, Balasubramaniam, and Ramadorai (2017), and employ multiple waves of the nationally representative All-India Debt and Investment Survey to document the allocation of assets and liabilities of Indian households along the life cycle (i.e., the age distribution) and across the wealth distribution.1 Throughout, we compare these patterns to those of households in a range of developed and developing countries (Australia, China, Germany, Thailand, the U.K., and the U.S.) using detailed micro-data from household surveys in these countries. We find several attributes of Indian households that are distinct in the international context. Our work on the first few points on the ToR can be viewed as providing a rigorous evidence-base and foundation for our ultimate policy recommendations. 1.1 Cross-country comparison: Broad trends HIGHLIGHTS Indian household balance sheets exhibit a set of features that is unusual in the international context: -
A disproportionately high share of wealth allocated to physical (i.e. non-financial) assets, such as gold. -
Under-investment in long-term insurance and pension products. -
A disproportionally large reliance on unsecured debt, mostly from non-institutional sources (e.g. moneylenders). We begin by comparing the average allocations of household assets across different countries in Figure 1.1. In India, the average household holds 77% of its total assets in real estate (which includes residential buildings, buildings used for farm and non-farm activities, constructions such as recreational facilities, and rural and urban land), 7% in other durable goods (such as transportation vehicles, livestock and poultry, agricultural machinery and non-farm business equipment), 11% in gold and the residual 5% in financial assets (such as deposits and savings accounts, publicly traded shares, mutual funds, life insurance and retirement accounts). Taken together, non-financial assets therefore account for 95% of the household balance sheet, which is identical with the 95% for Thai households, and only slightly higher than the corresponding 91% for Chinese households. However, the average Chinese household has a relatively lower share of real estate wealth (62%), a higher share of durable assets (28%), and negligible amounts of gold (0.4%). Furthermore, household allocation choices are very different in India, Thailand and China when compared with more advanced economies. On average, holdings of real estate account for low fractions of wealth in countries such as the US (44%), and particularly Germany (37%). Households in advanced economies hold substantially more financial assets than their Indian counterparts. In addition, households in these economies allocate a sizeable fraction of their wealth to retirement savings over the course of their lifetimes, for example, retirement assets account for relatively large shares of wealth in Australia (23%), and the UK (25%). The two trends are related, in the sense that state-sponsored schemes appear to act as a substitute for private savings in retirement accounts, but potentially as a complement to private savings in non-retirement financial assets. The German case illustrates this effect particularly well. Since the German retirement system is mostly based on state-sponsored defined-benefit pensions, households in Germany only save small amounts in private retirement accounts, and invest larger amounts in financial assets such as sight deposits, government bonds, publicly traded shares, and mutual funds. The liabilities of Indian households also exhibit distinct patterns relative to other countries. Figure 1.1 reports the average allocation of liabilities across all households that carry a positive amount of debt at the date of the survey. Mirroring the dominance of real estate as the dominant component of wealth, we find that mortgage loans are households’ largest liability in China, the US, the UK, and Australia. In these countries, the average household’s mortgage holdings account for close to 60% of their total debt exposure. Germany is an exception to this rule (the share of mortgage debt is 44%), which is not surprising given the low homeownership rate and the relative preference for renting over owning in the German population. However in India, despite the prominent role of non-financial assets in the household balance sheet, mortgage loans account for only a small part of total liabilities (23%) and the role of other secured debt (such as vehicle loans and instalment credit for durable goods) is well below the levels observed in other countries, particularly Thailand. The high average level of home equity held by Indian households is important, and suggests a strong investment motivation for real estate purchases in addition to the usual consumption motivation. Of course, the consumption motivation may also be high in an environment of poor contract enforcement, and suggests that measures to improve the private rental market may have a non-negligible impact on the physical asset share. Instead of secured debt, most Indian household debt is unsecured (56%), which as we will see, also reflects an unusually high reliance of Indian households on informal, non-institutional sources of lending such as moneylenders and intra-family loans. We also document a non-negligible role for gold loans (7.6%), which are a unique feature of the Indian market, and absent from other countries, suggesting that gold plays a dual role as an investment asset as well as a store of collateral value for Indian households. These conclusions are also apparent when averages are computed by wealth-weighting across households rather than equally-weighting across households. This suggests that for India (and China) unsecured debt (including gold loans, for India) also matter in the aggregate. Quantitatively, unsecured loans account for 23% of total debt in China and 39% in India, while they play a negligible role in the financial systems of developed countries (with the exception of the US, where households rely relatively more on short-term debt for both daily expenses and for purchases of durable consumer goods). These aggregate patterns are interesting, but there is also significant variation in allocations along Indian households’ life cycles, and across the wealth distribution. We describe how these patterns make the distinct features of the aggregate allocations in India a potential cause for concern, as they suggest that Indian households may face significant constraints which impede them from participating optimally in financial asset and liability markets. 1.2 Participation in financial markets HIGHLIGHTS -
Indian households are exceptional in the international context, as there is no reduction in their holdings of physical assets as they pass retirement age - unlike in countries such as the UK, Australia, Germany, and China. -
The participation rate of Indian households in financial assets is well below the one observed in developed countries. This pattern has been recognised and there has been a sustained drive to spread banking to the unbanked. -
The important distinction between access and use needs to be considered carefully when formulating policy – simply extending access to banking services is unlikely to be sufficiently effective on its own. The overall allocations described in the previous section mask important patterns evident along the lifecycle of Indian households and across the wealth distribution. Uncovering these patterns is important for two reasons. First, India is an extraordinarily diverse country along many dimensions, and so we need to be able to coherently capture the diversity of household experiences. Moreover, different household finance problems may manifest themselves at a) different points in the wealth distribution, and b) at different ages. For an example of the former, we find that poorer households in India have significantly lower allocations to any form of retirement savings than their counterparts overseas, which further highlights the need for some mechanism to address these needs. An example of the latter is that we detect a rising pattern of indebtedness with age in both secured and unsecured loans in India, which is unusual both from the perspective of theoretical optimization as well as from the cross-country comparison. In other countries, there is a more natural hump-shaped pattern of indebtedness as households borrow presumably to smooth consumption over their lifetimes. Figure 1.2 illustrates these and other patterns across the age distribution of Indian households. Only 65% of Indian households in which the household head is younger than 35 years of age hold any financial assets. This participation rate increases to 77% for more mature households, but remains well below the rate of financial asset market participation observed in developed countries, where close to all households own at least one bank account and use formal financial products as the preferred means of savings.2 While the drive to bank the unbanked in India holds great promise, it is worth noting the massive popularity of physical assets. In both China and India, the rate of participation in land and housing assets is 78% for the lowest age cohort and increasing to roughly 95% for households that are close to retirement. However, Indian households are exceptional in the international context, as there is seemingly no reduction in their holdings of real estate as they pass retirement age, unlike in countries such as the UK, Australia, Germany, and China. This is probably the consequence of “joint family” households in which multiple-generations co-exist, in which land and residential properties constitute a significant share of bequests and inter-generational wealth transfers. The patterns in the assets of Indian households are also distinct across the wealth distribution. In terms of participation, only 55% of the poorest households hold any financial assets (see Figure 1.3). This number rises to 90% for the richest population group, but is still well below the fraction participating in developed countries. Turning to non-financial asset holdings, one particular finding stands out. At the very bottom end of the wealth distribution, 60% of Indian and Chinese households have ownership over land or buildings, while in Germany, the UK and Australia, this number is less than 1%. At least part of this observation can be attributed to the very different nature of what is considered and recorded as ownership of real estate across these countries. The average value of the main residence in the bottom quintile group of Indian households is equal to ₹ 22,000, which is significantly lower than the lowest percentile of the value of the main residence in Germany (₹ 15 lakh) or the US (₹ 3.7 lakh). In India and China, the urbanisation rate is much lower, rental markets are virtually absent, and agricultural work is widely prevalent. We explore these issues using a number of alternative datasets, as we describe later in this report. Turning to the liabilities of Indian households in Figure 1.4, mortgage indebtedness is particularly low across the age distribution in India in comparison with other countries except Thailand. Especially during peak earnings years, very few households take mortgage loans in the international comparative context throughout the lifecycle. However, surprisingly, the participation rate of older households and retirees is comparable to that in Australia and the UK. This suggests that Indian households take on relatively higher financial burdens towards the end of life, probably reflecting intergenerational transfers. This under-penetration of mortgages despite high reliance on real estate is an important issue, and we explore it in greater detail in other chapter of this report. Part of the issue is that Indian households are extremely debt-averse, but there are also frictions in mortgage markets impeding easy access to this important source of borrowing, which allows smoothing of consumption across the lifecycle. In response to point iii) in the ToR, the report will go on to investigate whether and to what extent Indian household balance sheets reflect deviations from optimal financial allocations, or indeed signal the presence of behavioural anomalies. To some extent, these patterns may also reflect underlying constraints of households, and in response to points iv) and v), we consider the extent to which specific types of financial products can improve the observed allocations of Indian households. However, we first turn to a brief description of the pattern of household assets and liabilities, conditional on participating in these markets. 1.3 Allocation of wealth HIGHLIGHTS -
The largest fraction of the wealth of young households in India is in the form of durable goods and gold. The largest share of wealth as Indian households approach retirement is held in land and housing. -
Financial assets and pensions account for a very low portion of the total balance sheet even for the rich. -
Unsecured debt accounts for two-thirds of total liabilities for the very poor, and one-third for the rich. In the previous section, we considered the extent to which Indian households participate in particular types of assets and liabilities. This is admittedly an important question, and improvements along this dimension are clearly a government priority, as can be seen from PMJDY. However, it is equally important, and perhaps even more relevant for households’ well-being that when they do participate in financial markets, that they do so efficiently. This is because the benefits of participation can quickly turn into costs if participation is inefficient (see, for example, Campbell, 2006). This is essentially the distinction between access and use of financial instruments. We find four broad patterns here. First, the exposures of Indian households to the real estate sector are higher in all population sub-groups. The difference from other countries is particularly striking for poorer cohorts. Second, we find that households continue to accumulate mortgage debt as they approach retirement age, which can potentially lead to larger inter-generational transfers of liabilities. Third, we find that retirement assets play a very limited role, even for households at the top of the wealth distribution. Fourth, the prevalence of non-institutional debt is high for poorer households, but it decreases for relatively richer segments of the population, although even wealthier households who take on debt hold high fractions of unsecured liabilities. This tendency to take on unsecured liabilities at the bottom end of the wealth distribution is primarily associated with loans for productivity/working capital purposes, but worryingly, is highly likely to be from high-cost non-institutional sources. In Figure 1.5, we can see that the patterns of participation on the assets side of the balance sheet are mirrored in the allocations conditional on participation. In contrast with the advanced economies, a large fraction of the wealth of young households in India and China is in the form of durable goods and gold, and most of their wealth as they approach retirement comprises land and housing. It is notable that financial assets and pensions account for a very low portion of the total balance sheet even for the rich (3.7%). Instead, we observe a pronounced substitution effect between durable goods, gold, and real estate. Poor households own more of the former two assets, and richer households move away from these assets and towards real estate, but in a manner that leaves the total share of assets in physical form relatively fixed. This is somewhat unusual - in the UK, and the US for example, wealthier households hold larger shares of financial assets, but this pattern is not seen in India, suggesting that there are important factors impeding financial market participation even for the wealthy. On the liabilities side, we note that India is the only country in which mortgages account for an increasing share of total liabilities as people approach retirement age, suggesting a relatively large debt exposure beyond retirement age. For households in developed countries, the share of mortgage debt relative to total liabilities follows a hump-shaped pattern along the life cycle (see Figure 1.2), which implies that the financial burden of home-ownership is shifted towards the period in the life cycle when it is easiest to bear, and in keeping with standard consumption-smoothing motivations. In addition, the overall relative share of mortgage debt in total liabilities remains lower in India than in China across all parts of the population, with the gap narrowing only at the very top. Moreover, unlike in developed countries, where secured debt backed by vehicles and consumer goods seems to be the preferred alternative to mortgage debt, in India unsecured debt accounts for close to two-thirds of total liabilities for the very poor and one-third for the rich. The picture that emerges is one in which Indian households are relatively less indebted than their foreign counterparts, but those that take on debt are more likely to have no collateral to secure it, which leaves them exposed to repayment risk even in old age. While the cross-country and cross-state statistics that we have generated suggest that there are indeed significant deviations from desirable allocation and behaviour, we attempt to more rigorously answer question iii) on the ToR. 1.4 Understanding international allocation differences HIGHLIGHTS -
Indian household demographic characteristics and wealth levels explain a negligible fraction of the differences between Indian household portfolios and those observed in the rest of the world. The remainder can be attributed to differences in Indian household financial behaviour, partly determined by exposure to the Indian institutional context. -
Demographic characteristics and wealth levels explain a large part of the differences between Indian household credit product choices and those observed in the rest of the world. This suggests that economic development will correct at least some of the imbalances noted on the liabilities side of the Indian households’ balance sheets. To understand the role of the demographic profiles and wealth levels in explaining why Indian households’ allocations differ from the international comparator countries, we decompose the observed average shares of assets and liabilities into a component that is explained by household characteristics, and the residual component, which we broadly attribute to differences in the behaviour of Indian households relative to their counterparts in other countries. We calculate counter-factual values of shares of assets and liabilities under the assumption that Indian households behave exactly like their counterparts from other countries, using a four-step procedure. We start by expressing the wealth levels of households from other countries in 2012 equivalent Indian rupees. For example, to calculate the equivalent rupee value of the wealth of a US household surveyed in 2010, we multiply the observed US dollar value with the total gross US inflation rate between 2010 and 2012, and with the average bilateral exchange rate between Indian rupees and US dollars in 2012. We then attach equal weights for all countries, but carefully preserve the population weighting structure within each country. We then construct within-country quintile categorical variables, which capture the positions of households in their own country’s distributions of ages and wealth levels, and across-country quintile categorical variables, which capture the positions of households in the world distributions of ages and wealth levels. For each asset and debt share, we run two identical analyses for India and for the ’rest of the world’, with both within- and across age and wealth quintile categorical variables as explanatory variables. To obtain counter-factual ’predicted’ values for India, we multiply the explanatory variables obtained for India with the estimated coefficients from the ’rest of the world’. The results of this decomposition, reported in Figure 1.6, show that when looking at the asset side of the balance sheet, the variation in household demographic characteristics and households’ wealth explains only a negligible fraction of the difference between India and the rest of the world. The remainder can be safely attributed to differences in behaviour, which is also determined by households’ exposure to the Indian institutional context. To the contrary, when turning to the liabilities side, we find that demographic and economic characteristics explain 50% of the difference between the mortgage share in India and the other countries in our sample, and 32.5% of the difference in the share of unsecured debt. As the Indian economy grows, and household wealth (in absolute terms) approaches that observed in other countries, the mortgage share will likely increase, and the share of unsecured debt can be expected to decrease. Nevertheless, a large part of the difference between the asset portfolio allocation and mortgage indebtedness of Indian households, relative to their counterparts from other countries, still remains unexplained. To explore whether the allocation of household wealth and liabilities can be rationalised in the context of the particular institutional framework in India, we build a life cycle model of optimal household decisions in the next section. 1.5 Theory: Optimal decisions along the life cycle HIGHLIGHTS -
Benchmark theoretical models predict high participation rates in financial assets throughout the life cycle, a relatively larger prevalence of debt for younger cohorts, and a reduction of both assets and liabilities as people approach retirement. These implications are difficult to reconcile with the observed empirical patterns of behaviour for Indian households. -
We construct a life-cycle model of household behaviour and calibrate it to Indian data. -
Rational portfolio optimization cannot explain Indian households financial allocations. While it is difficult to capture the diversity of preferences, constraints and institutional arrangements that households face in a single theoretical framework, there are some relatively universal implications delivered by all benchmark models in the field of household finance about optimal decisions along the life cycle. (i) All households should participate in financial markets, saving a strictly positive amount in risky assets such as publicly traded stocks, (ii) The portfolio exposure to risky assets should be largest in young age and drop off substantially as people approach retirement, (iii) Most debts should be incurred during the first years of activity in the labour market, (iv) Mortgages are generally the largest household liabilities, and (v) Savings of both financial and non-financial assets should substantially reduce as people age. To some degree, all of these predictions are different from the observed patterns of behaviour for Indian households. One possible reason is that the parameters that have been previously used to calibrate theoretical models do not adequately capture the institutional situation in India. Our theoretical analysis therefore begins with a calibration exercise which uses Indian data to estimate conditional survival probabilities along the life cycle, the dynamics of expected income, and the profiles of financial market risk and return (see Figure 1.7). We have constructed and calibrated a lifecycle portfolio choice model of household financial decisions, which we are using to explore whether the observed empirical patterns can be reconciled with theoretically optimal predictions. We note that the model is selected to have a useful role for durable goods, thus giving it the best possible chance of models in this class to rationalise the patterns we detect in Indian household data. The model economy is assumed to be comprised of agents that live up to a maximum of T = 100 years. For each age group, the remaining life span is uncertain, and given by the conditional probability of survival. In each period, the household head receives labour income, which is randomly shocked using draws from a probability distribution. We assume the household is exposed to two types of such labour income shocks: temporary shocks, e.g. minor health issues, or a financial bonus, have only a transitory effect on the financial situation of the household, limited to just a few months; permanent shocks, such as an accident, physical disability, a significant promotion or a shift in occupational status, have a much more pronounced long-term impact. We choose to distinguish between education groups because this type of variation is measured without noise and we need a parsimonious specification to discuss the heterogeneity of household finance decisions across the Indian population. Of course, the heterogeneity across education groups also captures variation across occupation categories, regions of residence, and employment sectors. Households are risk-averse and choose to save some of the income they receive, and to consume the rest. They derive consumption utility from pure consumption goods such as food, but also durable goods such as residential real estate, vehicles, mobile phones and gold. For their savings in the form of financial assets, households earn a risk-free return. The value of durable goods depreciates at a constant rate in each period. Households can take on unsecured debt, i.e. credit contracts simply backed by their future labour income, and also secured debt, where their stock of durable goods serves as collateral for a loan. Importantly, we assume that durable goods are also illiquid, and households pay an adjustment cost whenever purchasing or selling them. In each period, a strict collateralization constraint guarantees full repayment, i.e. we assume that agents do not default on their payments, but they can roll over any debt indefinitely. Figure 1.8 illustrates the optimal decisions of Indian households, as implied by the life cycle model. The two panels report the average levels of net financial assets (i.e. the difference between investments and debt) and physical assets (i.e. real estate, vehicles and gold), for different age groups. In the early years of household formation, the accumulation of financial assets is slow, and most households are indebted, to be able to afford investments in real estate and other durables. More wealth is accumulated towards the middle age, a large part of which continues to be in physical form. In the top panel of Figure 1.9, we calculate the allocation profiles of wealth for the average household explicitly. The profiles are similar across all education groups. First, the relative share of physical assets is larger at the beginning of life. The first ten years in the labour market, when the income profile is generally expected to be upwards-sloping, is a period in which it makes sense to invest in durable goods, and to enjoy the utility associated with them for long periods of time thereafter (e.g. an apartment, a transportation vehicle, or gold jewellery). Second, in middle age, the share of physical goods is gradually decreasing, allowing for the accumulation of financial wealth. Finally, after retirement, financial wealth is drawn down more rapidly than physical wealth, which increases the relative allocation towards physical wealth. The bottom panel reports the optimal share of the population that participates in the debt market. Consistent with the significant role of physical assets at the beginning of life, we find that this is the period when most households incur substantial liabilities. Importantly, our results suggest that later in life, and especially during retirement, it is optimal to use products that resemble a reverse mortgage arrangement. The property or physical asset is still retained in the possession of the household, but it is used as collateral for loans, to insure a steady stream of consumption utility. In retirement, uneducated households should be the primary beneficiaries of reverse mortgage-type of products, because they did not have the chance to accumulate high levels of financial wealth that can be easily liquidated. Put differently, the model uncovers that the puzzle can be shifted elsewhere. Even if Indian households rationally choose to hold high levels of physical assets, they are foregoing consumption smoothing opportunities by not collateralising those assets and extracting liquidity, especially later in life. This calls into question why the reverse mortgage market isn’t functioning at far higher rates of utilization in the country than we observe. Figure 1.9 also compares the optimal allocations described above with the actual ones, observed in survey data. We can rationalise the predominant role of physical assets below 35 years and during retirement, but the model implies a much larger exposure to financial assets during middle age. Similarly, we find that more households should hold positive amounts of debt during their first years in the labour market, compared to what we currently observe in the Indian economy. In Figure 1.10, we analyze the counter-factual case in which the return on financial assets is perceived to be very low (1% per year). This leads to a high share of physical goods for all education groups and at all ages. However, the additional implication is that virtually the entire Indian population should participate in the credit market, continuously ‘financializing’ or ‘liquidating’ at least part of the high holdings of physical wealth, to better smooth consumption along the life cycle. This is in striking contradiction to what is currently observed in the market. Overall, we are able to rationalise the large holdings of physical assets at young ages and during retirement, but only by shifting the puzzle. Households should substantially decrease their overall wealth levels after retirement, de-cumulating financial wealth and entering into credit contracts of the reverse mortgage type. Instead, what we observe in the data is that both financial assets and especially physical assets continue to be accumulated as people age. Second, it remains difficult to rationalise the observed prominence of physical assets in middle-age, exactly when the potential for the accumulation of financial wealth would be largest. Third, this part of the analysis suggests the presence of very significant market frictions that prevent mortgage loan take-up during young age, when most households expect an upwards-sloping labour income profile. Instead, most debt in India tends to be unsecured, especially during the early years of labour market activity. In the next chapter, we show that the problem is actually worse. A large part of the unsecured debt that Indian households hold is sourced from non-institutional sources, and that the motive for borrowing has a lot to do with unexpected household events such as loss of crops and livestock, medical emergencies, and the effects of natural disasters. We start by discussing the heterogeneity of these patterns across states and population sub-groups and proceed to estimate potential household gains that are associated with a re-allocation of assets and liabilities within the household portfolio. Figure 1.1
Country comparison: Allocation of household assets and liabilities As documented in Badarinza, Balasubramaniam and Ramadorai (2016b), we compare the average allocations of household assets across countries. The data sources are the All India Investment and Debt Survey (2012 wave), the Chinese Household Finance Survey (CHFS, 2012 wave), the Townsend Thai Survey (TTS, 2012), the US Survey of Consumer Finances (SCF, 2010 wave), the UK Wealth and Assets Survey (WAS, 2012 wave), the Australian Household, Income and Labour Dynamics Survey (HILDA, 2010 wave), and the Eurosystem Household Finance and Consumption Survey (HFCS). Real estate includes land, buildings and other constructions owned by the household, for residential, commercial or vacation purposes. Durable goods include vehicles and other transport equipment, valuables, works of art and carpets, livestock and poultry, agricultural machinery, and other farm and non-farm equipment. Gold includes jewellery, bullion, ornaments and coins. Financial assets include bank deposits, publicly traded shares and government securities, mutual funds, managed accounts, and loans receivable by the household. Retirement accounts include private pension accounts, provident funds, annuity certificates, and life insurance accounts. Mortgage debt includes loans using land or real estate as collateral. Other secured debt includes loans secured by a third party, and loans using crops, shares of companies, government securities, or insurance policies as collateral. Gold loans use bullion and ornaments as collateral. Unsecured debt includes all loans classified as personal security, which are not backed up by any collateral, such as unsecured loans from money lenders, loans from family and friends, credit cards, and overdraft facilities. We compute weighted population averages across households using representative population weights, as indicated in each survey. 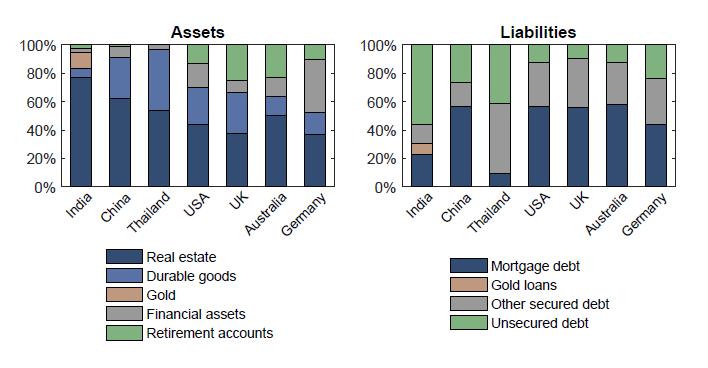 Figure 1.2
Participation in financial markets along the life cycle As documented in Badarinza, Balasubramaniam and Ramadorai (2016b), this figure reports the shares of the population that hold positive amounts of different assets and debt classes. The data sources are the All India Investment and Debt Survey (2012 wave), the Chinese Household Finance Survey (CHFS, 2012 wave), the Townsend Thai Survey (TTS, 2012), the US Survey of Consumer Finances (SCF, 2010 wave), the UK Wealth and Assets Survey (WAS, 2012 wave), the Australian Household, Income and Labour Dynamics Survey (HILDA, 2010 wave), and the Eurosystem Household Finance and Consumption Survey (HFCS). We compute weighted population averages across households using representative population weights, as indicated in each survey. Figure 1.3
Balance sheet allocation of household assets As documented in Badarinza, Balasubramaniam and Ramadorai (2016b), this figure reports the average shares of different asset classes, relative to total household wealth. The data sources are the All India Investment and Debt Survey (2012 wave), the Chinese Household Finance Survey (CHFS, 2012 wave), the Townsend Thai Survey (TTS, 2012), the US Survey of Consumer Finances (SCF, 2010 wave), the UK Wealth and Assets Survey (WAS, 2012 wave), the Australian Household, Income and Labour Dynamics Survey (HILDA, 2010 wave), and the Eurosystem Household Finance and Consumption Survey (HFCS). We compute weighted population averages across households using representative population weights, as indicated in each survey. Figure 1.4
Participation in financial markets across the wealth distribution As documented in Badarinza, Balasubramaniam and Ramadorai (2016b), this figure reports the shares of the population that hold positive amounts of different assets and debt classes. The data sources are the All India Investment and Debt Survey (2012 wave), the Chinese Household Finance Survey (CHFS, 2012 wave), the Townsend Thai Survey (TTS, 2012), the US Survey of Consumer Finances (SCF, 2010 wave), the UK Wealth and Assets Survey (WAS, 2012 wave), the Australian Household, Income and Labour Dynamics Survey (HILDA, 2010 wave), and the Eurosystem Household Finance and Consumption Survey (HFCS). We compute weighted population averages across households using representative population weights, as indicated in each survey. Figure 1.5
Balance sheet allocation of household liabilities As documented in Badarinza, Balasubramaniam and Ramadorai (2016b), this figure reports the average shares of different debt classes, relative to total household liabilities. The data sources are the All India Investment and Debt Survey (2012 wave), the Chinese Household Finance Survey (CHFS, 2012 wave), the Townsend Thai Survey (TTS, 2012), the US Survey of Consumer Finances (SCF, 2010 wave), the UK Wealth and Assets Survey (WAS, 2012 wave), the Australian Household, Income and Labour Dynamics Survey (HILDA, 2010 wave), and the Eurosystem Household Finance and Consumption Survey (HFCS). We compute weighted population averages across households using representative population weights, as indicated in each survey. Figure 1.6
Cross-country comparison: Blinder-Oaxaca decomposition This figure reports predicted values for the average shares of assets and liabilities of Indian households, under the assumption that Indian households behave like their counterparts in other countries. We first express the wealth levels of the surveyed households from China, Thailand, USA, UK, Australia and Germany in 2012 equivalent Indian Rupees, using bilateral exchange rates and inflation levels in respective countries and years. We then construct within-country quintile dummies, which capture the positions of households in their own country’s distributions of ages and wealth levels, and across-country quintile dummies, which capture the positions of households in the world distributions of ages and wealth levels. For each asset and debt share, we run two identical regressions for India and for the ’rest of the world’. We include within-country age and wealth level quintile dummies, and across-country age and wealth level quintile dummies as explanatory variables. To obtain counter-factual ’predicted’ values for India, we multiply the values of the explanatory variables for Indian households with the estimated coefficients from the ’rest of the world’. We compute weighted population averages across households using representative population weights, as indicated in each survey. 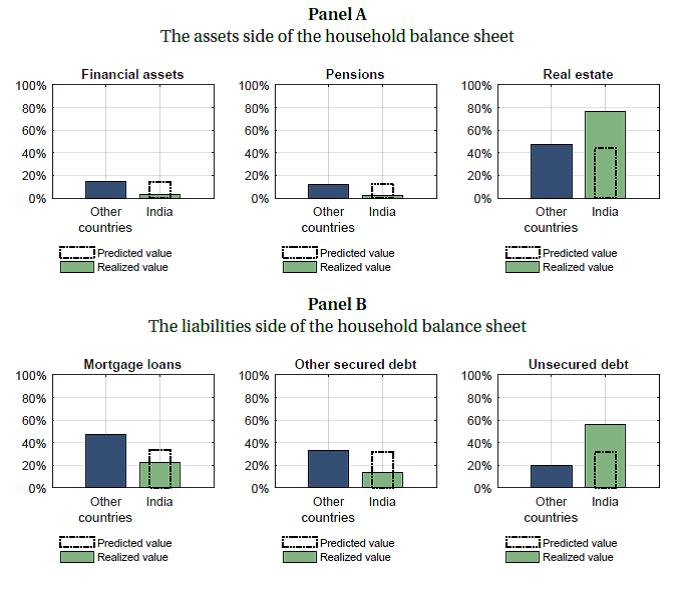 Figure 1.7
Model calibration parameters This figure reports the life cycle profiles of the parameters used to calibrate the household portfolio choice model for India. Panel A shows the evolution of survival probabilities for each age years, conditional on survival until the previous age year. Panel B shows the evolution of average family income profiles by education groups. The profiles are constructed by fitting a third-degree polynomial through the coefficients on the age dummies in a cross-sectional regression of family income on ages. Income after 70 is the median income of households whose heads are over 70. The profiles are smoothed through linear interpolation to insure continuity of the model functions. For easier interpretation, we normalize the absolute values by dividing through the average yearly income level in the population. The data comes from the second wave of the India Human Development Survey, 2015.
Figure 1.8
Model-implied life cycle profile for Indian households We construct and solve a portfolio choice life cycle model of optimal household behaviour. In each period, households receive labour income and decide optimally on how to allocate their available resources across a set of consumption goods, financial assets and durable goods, such as houses and gold. We calibrate the model with income life cycle profiles for the Indian economy, for three education groups (below primary school, primary or secondary school degree, and college degree), survival probabilities, and market parameters characterizing the constraints and market conditions that Indian households face. We simulate N=50,000 life cycle profiles. In the figure below, we report average holdings of financial assets and durable goods, for each age-education group. For easier interpretation, we normalize the absolute values by dividing through with the average yearly income level in the population. Figure 1.9
Model implications vs. observed household behaviour The top panel of this figure compares the allocations of household wealth that are implied by the portfolio choice life cycle model, with the observed allocations of Indian households. The source of the empirical data is the 2012 wave of the All India Debt and Investment Survey (AIDIS), which is representative for the entire country. In the data, the physical assets share is calculated as the sum of real estate wealth, durable goods and gold, normalized by the total household wealth level. The bottom panel reports the model-implied and the actually observed participation rate in the debt market. Both in the model and in the data, total household debt includes both secured and unsecured credit products. We compute weighted population averages across households using representative population weights, as indicated in the survey. Figure 1.10
Counter-factual scenario: Low return on financial assets The top panel of this figure compares the allocations of household wealth that are implied by the portfolio choice life cycle model with the observed allocations of Indian households. We calibrate the model assuming a counter-factual return on financial assets equal to r = 1%. The source of the empirical data is the 2012 wave of the All India Debt and Investment Survey (AIDIS), which is representative for the entire country. In the data, the physical assets share is calculated as the sum of real estate wealth, durable goods and gold, normalized by the total household wealth level. The bottom panel reports the model-implied and the actually observed participation rate in the debt market. Both in the model and in the data, total household debt includes both secured and unsecured credit products. We compute weighted population averages across households using representative population weights, as indicated in the survey.
CHAPTER 2
UNDERSTANDING INDIAN HOUSEHOLD FINANCIAL DECISIONS This chapter documents the trade-offs and frictions that affect the financial decisions of Indian households, and the ways in which they can lead households to sub-optimal behaviour. First, we observe substantial heterogeneity in the allocation patterns of assets and liabilities in balance sheets across Indian states. Second, we find that households simply shift gold holdings towards real estate, and do not increase their wealth allocation to either financial assets or retirement accounts, even as they move towards the top of the wealth distribution. Third, we document a strong link between the insufficient take-up of insurance products and the reliance on non-institutional sources of unsecured credit. Finally, we document significant financial vulnerabilities implied by an ageing population, and demonstrate the potential for financial gains from changes in household behaviour. We estimate financial gains for three scenarios: a shift of resources of 25% of gold holdings to financial assets, a full replacement of non-institutional with institutional debt, and a shift to full coverage of medical costs through health insurance. For the median household, such changes in behaviour can lead to financial gains equivalent to an upwards movement of 3.5 pp, 3.8 pp, and 0.9 pp along the wealth distribution, over a period of 10 years. 2.1 Heterogeneity across Indian states HIGHLIGHTS -
The availability of resources and the sources of debt are very different across Indian states. -
Some states (e.g., Maharashtra, Karnataka and Tamil Nadu) have high levels of life insurance participation, while in others (e.g. Madhya Pradesh and Chattisgarh) participation is very low. -
In states such as Tamil Nadu, households store a high fraction of their wealth in gold, and also have more than 40% of their total debt in the form of gold loans. India has enormous heterogeneity in a number of dimensions: geographical, linguistic, and cultural. We explore the extent to which Indian household balance sheets also vary across states of India, and find that there are significant differences across households located in different states, even after controlling for households’ demographic characteristics. In both participation and allocation, we observe substantial heterogeneity in the patterns of assets and liabilities in household balance sheets across Indian states (see Table 2.1). For example, a (relatively poor) state like Bihar has households with barely no financial assets, while cities/union territories such as Chandigarh have the highest levels of financialization of the household balance sheet. Another important example is that in Tamil Nadu, households hold relatively large amounts of gold, followed closely by Andhra Pradesh. These high gold holdings in Southern Indian states suggest that strong cultural factors may also be at play in these cross-state patterns. Large differences can also be observed in patterns of debt allocation. While poor states such as Bihar have nearly all of their loans as unsecured debt and almost all of it originated from non-institutional sources, states such as Goa have only small amounts of unsecured loans, as well as low fractions originated from non-institutional sources. Moreover, in states such as Tamil Nadu, where households store a high fraction of their wealth in gold, they also have more than 40% of their total debt in the form of gold loans – further suggesting that gold plays multiple roles in household balance sheets, and that solutions to sub-optimally high gold holdings will need to consider these different dimensions of its use. Even in the prevalence of simple bank accounts, we see wide dispersion across states. Figure 2.1 shows data from a nationally representative survey (Financial Inclusion Insights Survey, 2015), and documents substantial heterogeneity by states in terms of the participation rates in access and use of bank accounts. The correlation between access and use of bank accounts in India is 0.59, which is not particularly high, suggesting that while the drive to provide bank accounts to the unbanked is a promising policy, it needs to be supplemented with policies to promote effective use of finance amongst Indian households.1 One of the most striking observations from the previous chapter is the predominance of physical assets in the portfolio of household wealth, and a very limited role for financial assets. Of course, this pattern has been recognised by the Indian government, and there has been an important drive in India to spread banking to the unbanked. The recent policy push for universal coverage of bank accounts through the Pradhan Mantri Jan Dhan Yojna (PMJDY) has had a significant impact on households in India. Figure 2.3 presents trends in coverage and use of PMJDY accounts obtained from a submission to the committee by the largest scheduled commercial bank, the State Bank of India (SBI). The rapid decline in the fraction of accounts with non-zero balances do not necessarily mean that these accounts are being transacted in frequently. Around 33% of the PMJDY accounts were second accounts opened for individuals, and hence about 28% of these accounts lay dormant. Agarwal, Alok, Ghosh, Ghosh, Piskorski and Seru (2017) show that about 77% of the bank accounts (as of November 2016) maintain a positive balance and usage increases over time with inward and outward remittances being the most common type of transaction conducted with bank accounts. Importantly, they present evidence that is consistent with learning by individuals – lendings (and defaults on new loans) increase in regions with low ex-ante access to banking services, which suggests that supplying Indian households with bank accounts has created new demand for formal banking credit from households that were previously unbanked. In related work, Chopra, Prabhala and Tantri (2017) show that the extent of transactions using bank accounts increases as accounts age and that they converge or exceed levels in non-PMJDY accounts of similar vintage.2 The objective of universal access to banking services driven by a state-led initiative has enabled two important possibilities for households in India. It allows for households to create formal credit histories, which in turn increases their potential for future access to debt at lower rates of interest. Some evidence for such supply creating future demand for financial services has been documented in Chopra, Prabhala and Tantri (2017). Second, it allows households to learn and build experience with the formal financial system. Some evidence of this is also documented in Agarwal, Alok, Ghosh, Ghosh, Piskorski and Seru (2017). These findings suggest that some form of product push does hold promise, especially for low income households to benefit from accessing the formal financial system. However, as we will document later, there is an important distinction between access and use that needs to be considered carefully when formulating policy in this area. Figure 2.2 turns to another important financial instrument which households also use, and shows that there is substantial geographic heterogeneity in the uptake of life and non-life insurance products in India. While some states of India (e.g., Maharashtra, Karnataka and Tamil Nadu) have higher levels of life insurance participation, states such as Madhya Pradesh and Chattisgarh have very poor penetration rates for life insurance. Similarly, non-life insurance products that hedge against common shocks such as accidents and poor rainfall have literally no take-up in states where we ex ante believe that they will be most relevant – for example, despite historical levels of drought in Andhra Pradesh, non-life insurance levels are abysmally low. However, solutions are not completely straightforward. The appropriate use of financial services, in contrast with access, may be far more challenging than simply endowing every individual in the country with a suite of financial assets. 2.2 Household behaviour: a detailed analysis HIGHLIGHTS -
As they become richer, households trade off gold holdings for real estate. They do not increase their wealth allocation to either financial assets or retirement accounts. -
Formal bank loans are almost irrelevant as a means to cope with unexpected emergencies. Instead, we document a trade-off between the take-up of insurance products and the reliance on non-institutional sources of unsecured credit. -
The financing of retirement happens mostly through informal arrangements between parents and children. Thus far, we have identified a number of dimensions along which Indian household finance decisions are unusual relative to those of their counterparts in other countries. We now aim to dig a little deeper into the trade-offs and frictions that underlie these decisions. In the previous chapter, we looked into the variation of unconditional average shares of asset classes and credit products across households. We now control for household demographic characteristics. In this chapter, we add to the previous analysis by also deriving insights from a number of household surveys including the Financial Inclusion Insights Survey (2015), the Finscope Survey (2015), the 2015 wave of the NSS health survey, the 2015 UNDP population projections, and the ICE 360 national household survey. In addition, we continue to analyze household-level data from the 2012 wave of the Indian AIDIS survey, but now explain the wealth shares of households with an augmented set of categorical variables capturing wealth quintiles and education groups, as well as a set of other control variables including age quintile categorical variables, rural vs. urban residence, and the number of children. The tables and figures at the end of the chapter provide the source of the analysis for each statistic that we describe in the text. Household saving: financial assets vs. physical assets In the top panel of Figure 2.4, we first document a clear substitution effect between real estate and gold as households become richer. Conditional on age levels and other demographic characteristics, households in the top quintile of wealth have a 50% higher share of real estate and a 30% lower share of gold in their portfolio of assets. Interestingly, holdings of financial assets only play a relatively modest role, even for the wealthiest Indians. This is an important finding, and raises multiple challenges in the context of the future development of the Indian economy. We also note here that this may well be a symptom of income diversion, in addition to more standard cultural and behavioural factors.3 In particular, richer households may find it easier to place illicit earnings or engage in tax evasion by investing in real estate wealth, thereby avoiding the scrutiny associated with investments in the formal financial sector. Interestingly, the picture is very different when we turn to the role of education. Higher education is unambiguously associated with a lower share of real estate, and higher shares of both pensions and financial wealth. This finding suggests that education more generally (rather than financial education more specifically) has the potential to improve financial allocations, but may also be a proxy for the fact that higher education is correlated with employment in the formal sector - with fewer opportunities for tax evasion, and more exposure to formal financial markets. Household risk management: debt vs. insurance We now turn to understanding the source of financial uncertainty for Indian households, and the ways in which they use alternative vehicles to deal with unexpected realisations of risk. Panel A of Figure 2.5 describes the sources of major financial vulnerability for Indian households. We find that the events that have had the largest financial impact on the family during the 2 years prior to the survey date are the loss of crops or livestock due to bad weather, medical emergencies associated with hospitalisation, and damage to properties, farm equipment or other business capital, due to a natural disaster. Cumulatively, these events account for the major financial losses in more than 60% of cases. The next three sources in order of financial vulnerability concern reductions of the income-generating capacity of the household, due to job loss, an increase in the costs of agricultural inputs, or a deterioration in overall market conditions. Cumulatively, they account for the major financial losses of around 25% of households. Finally, life events such as theft/burglary, family separation, or the death of the main income earner are also important sources of financial risk, which may affect a considerable part of the population, but their overall financial impact seems to be much smaller than the other sources discussed above. How do households cope with these risks? Figure 2.5 suggests that India is still largely an informal economy. Only a quarter of households are able to deal with emergency expenses by drawing upon accumulated wealth. Instead, half of the population counts on help from family, friends and moneylenders. Most notably, loans from formal financial institutions are virtually irrelevant as a coping mechanism, which suggests that the financial system fails to achieve one of its most important goals of helping households smooth cash flows and consumption patterns. The problem seems particularly acute when we look at medical expenses. 69% of households deal with medical expenses by drawing upon informal sources of funding, 26% of which are loans from moneylenders. We note here that help from family and friends is generally perceived as benign. It may indeed be associated with low costs, but we note that payments on such loans are generally non-pecuniary and involve service delivery by family members, which often goes unreported and thus leads to an underestimate of true costs. They are also viewed as easy to renegotiate, although there may be social quid pro quo accompanying such loans. On the positive side, there is potentially less asymmetric information in such loans, they can be issued at relatively low ticket sizes, and be accompanied by non-monetary assistance. Overall, though, we caution that this type of informal lending can pose significant pressures on family structures, and likely also lead to psychological burdens that cannot be ignored (see Lee and Persson (2016)). Moreover, Figure 2.6 shows that loans from family and friends, and in particular loans from moneylenders, are much more likely to be rolled over. Panel A of Figure 2.7 shows that this is particularly problematic because the interest rates on non-institutional debt are very large. Panel B of the figure shows that also the loan amounts are comparable in size to the loan amounts corresponding to formal debt. This suggests a very significant financial burden associated with debt from non-institutional sources, which is likely to be persistent, and to lead to a chain of indebtedness that quickly exhausts the financial resources of the household. Importantly, thinking back to the sources of the source of uncertainty that leads to borrowing from non-institutional sources, we note that the main three risks that households face (i.e. the loss of crops and livestock, major medical emergencies, and damage to physical assets due to natural disasters) are all insurable. This opens up the question of why households do not choose adequate insurance products to cover these risks. Using data from the 2015 wave of the Finscope survey, Figure 2.8 shows that the most often stated reason for non-participation is affordability. 50% of the population indicates insurance products as unaffordable, and only 16% state a lack of awareness.4 The most likely reasons are high transaction costs, a lack of understanding of the details of the products, and the distribution channel. We will explore alternative explanations along these lines in chapter 3. To understand the trade-off between debt and insurance products in detail, we first focus on the prevalence of informal arrangement across states. Panel A of Figure 2.9 shows that in states where the incidence of non-institutional debt is high, insurance take-up is low, and vice-versa. A strong negative correlation between insurance participation and the incidence of non-institutional debt suggests that there are common factors that are associated with the two observed phenomena with household financial choices in India. Such common factors may include reasons that lead to the prevalence of seemingly high discount rates for Indian households, including tight budget constraints leading to an inability to finance the up-front costs of premiums, regional variation in the pricing of insurance products, or the ease of access to moneylenders as opposed to access to simple insurance products. To further uncover the overall contribution of state-level variation to household decisions, we take advantage of the micro-level data from the AIDIS survey. We use life insurance as a proxy for the general participation of insurance market. At the minimum, this captures access to the market – to the extent households could access life insurance, we believe that other insurance products are not less accessible. In Panel B of Figure 2.9 we first show that the overall substitution effect is very strong: participation in the insurance market is associated with a 20% lower likelihood of taking up a loan from a non-institutional source. State-level differences account for 3% of this effect, but a large fraction of this variation has to do with the overall level of wealth. This is consistent with the fact that people deem insurance as unaffordable. Richer households are more able to buy insurance products, and may have to rely less on non-institutional debt. Demographic characteristics like age and education play a relatively minor role, and the remainder of the effect (7%) is unexplained by observed demographic and social characteristics. This suggests that there may be room for unobserved behavioural factors at play. Before exploring these issues further in the next chapter, we refer to the last important household decision: the planning of retirement financing. Household planning for retirement Panel A of Figure 2.10 shows that 77% of Indian households either do not expect to retire, or have not actively planned for retirement, and Panel B reports the expected sources of funds in retirement. Interestingly, despite the large share of real estate in household wealth, only very few households expect to benefit from this part of accumulated wealth to finance expenses in old age. Instead, most households (more than 50% of the population) expect to rely heavily on help from their children. This suggests that Indian households actually implement a variant of a reverse mortgage contract, consistent with the implication of the optimal life cycle model described in chapter 1, promising to leave their property wealth as bequests, and benefiting from the children’s care and monetary support during old age. Of course, this can have positive externalities for society, helping to maintain strong family relationships, solidifying cultural norms and fostering social cohesion. Nevertheless, the enforcement of this informal arrangement can also put substantial pressure on the social fabric of society, creating inter-generational tensions, limiting the education and productivity potential of the young generation, and locking up a large part of the nation’s wealth in highly illiquid assets. Going forward, India faces an ageing population. Indian households seem poorly financially prepared to deal with the consequences of ageing. The lack of retirement savings and more generally the predominant reliance on the income-generating capacity of future generations generates large risks at all levels of the financial sector. We now turn to analyzing the expected changes in the Indian population over the coming decades, and the likely financial impact of these changes. 2.3 Medium-term projections HIGHLIGHTS -
If the current allocation pattern of resources is maintained, this implies additional pressure on the demand side for assets such as gold, land, and real estate. -
Over the coming decade and a half, the elderly cohort is expected to grow by 75 percent. Only a small part of this cohort is adequately covered through private pension plans, and a large part of the population did not actively take steps to insure adequate financial coverage during retirement. The financing of health expenses and consumption during retirement is expected to leave older households particularly vulnerable to adverse shocks. -
Absent significant changes in household behaviour, the problems that we have identified will continue to prevail in the Indian economy. To answer point ii) in the ToR, we now turn to documenting the likely evolution of the Indian household finance landscape, using demographic growth rate information. There are two main reasons to make such future projections. First, it can help to envision the implications of household behaviour for aggregate quantities in Indian financial markets. Second, if problems are confined to certain cohorts of the population (say, the elderly), some of the problems that we have documented above may in fact be self-correcting, and projections are a useful tool to be able to see whether this is indeed the case. To do these projections, we start by reporting the likely evolution of the Indian population during the coming decades. In Figure 2.11, we use data from Prof. Irudaya Rajan of CDS to show that the largest growth in absolute terms is expected to occur in the middle of the age distribution (around 148 million individuals by 2031). If these households maintain their current household finance allocation patterns, this demographic projection implies additional demand pressure for assets such as gold, land, and real estate. In relative terms, while the growth rate of the middle cohort is expected to reach 54 percent by 2031, the age group with the highest expected growth rates are elderly retirees, aged 65 years and above. Over the coming decade and a half, this cohort is expected to grow by 75 percent. Since only a small part of this cohort is adequately covered through private pension plans, and a large part of the population did not actively take steps to insure adequate financial coverage during retirement (see Figure 2.10), the financing of health expenses and consumption during retirement is expected to leave older households particularly vulnerable to adverse shocks. To further understand the quantitative implications of these changes in the Indian population, we implement a two-step procedure. We begin by calculating total state-level assets and liabilities, using average holdings by each household age group in each state from the 2012 AIDIS survey. We then calculate projected average holdings of financial products by 2031, based on the projected population distribution for each state, and use these counter-factual total state-level quantities to obtain projected levels and growth rates in household demand over the next 15 years, for each asset and debt category. Panel A of Figure 2.12 shows that the largest expected growth (in absolute terms) is in real estate. If the current trend continues, we expect an increase in housing demand by around 45% – in real terms. There are two conclusions that we can draw here: On one side, absent massive investment in new housing construction, this development is likely to put large pressure on house prices, potentially decreasing affordability even more, and especially in the urban centres where the young population is likely to cluster. But at the same time, even if housing supply reacts by expanding greatly, it seems inefficient for an economy to allocate such a large portion of its total wealth to a single sector. This is especially relevant because, as we report in Panel B of Figure 2.12, the average share of real estate in household wealth is likely to actually increase, while the share of financial assets is projected to remain constant. Therefore, not only will the housing market be subject to large demand pressure, but any price volatility will generate more uncertainty for the average Indian household, as it gets more and more undiversified by holding larger and larger amounts of real estate. We note that the average wealth share of real estate is projected to rise because we expect relatively higher population increases in the part of the population that is more likely to have a higher share of real estate (i.e. the middle-age and older generations). Importantly, we also project that the mortgage share is increasing: the mortgage market is expected to grow by around 41%, and the share of mortgages in the overall portfolio of household debt is likely to increase by 3 percentage points. However, on net, the overall amount of housing equity on household balance sheets looks set to increase if nothing changes. Overall, we conclude that, absent significant changes in household behaviour, the problems that we have identified above will continue to prevail in the Indian economy. We next attempt some quantification of potential financial benefits to Indian households from implementing such changes in behaviour. 2.4 Gains from re-allocation of household wealth HIGHLIGHTS -
We estimate financial gains for three scenarios: a shift of resources of 25% of gold holdings to financial assets, a replacement of non-institutional with institutional debt, and a shift to full coverage of medical costs through health insurance. -
Households can earn substantial ongoing income gains from these movements. When capitalised, the real present value gain from re-allocating to financial wealth from gold translates into average movements up the Indian wealth distribution of between 0.2 and 4.9 percentage points (pp). -
Households shifting from non-institutional to institutional debt can move between 2.5 pp and 5.5 pp up the wealth distribution. -
Households can move up between 0.4 pp and 1.6 pp by taking on insurance to avoid the burden of emergency credit associated with medical costs. In this section, we estimate the distribution of financial benefits from three alternative scenarios of changes in household behaviour, over a period of 10 years. In Figure 2.13, we express the financial gains from these changes in equivalent percentage point (pp) movements along the wealth distribution, using the observed distribution of wealth across Indian households in the AIDIS (see Appendix Section C for an illustration of the method). In the figure, the lower and upper limits of the bars indicate the 5th and 95th percentiles of the estimated simulated distributions, and the horizontal line indicates the median. We also express these gains as a percentage increase in ongoing annual income for households arising from these counterfactual moves. The first scenario considered in Panel A of the figure is a 25% shift of resources from gold to financial assets. To quantify the benefits of more efficient participation (in a partial equilibrium fashion), we simulate returns on the different assets from historically observed distributions, and evaluate household expected returns under different assumptions about the portfolio composition. We use two alternative return processes for gold and financial assets, the first capturing the experience of India over the last 15 years, and the second the experience of the United States, as the Indian stock market has performed particularly well over this period. When we assume that the stock market performance of Indian stocks continues to remain at the high levels observed during the last years, we find that, in expectation, households can gain between 0.4 pp and 8.3 pp (i.e., between ₹ 6,922 and ₹ 1.78 lakh in discounted present value terms, discounted at the current stated target interest rate of the RBI, or equivalently between 1.4% and 6% of annual income on an ongoing flow basis), depending on the amount of gold held. Instead, if stock market returns in India were more similar to those in the United States, the movement up the wealth distribution would be between 0 pp and 1.0 pp. We also note that the gains are almost always above zero. In Panel B, we consider replacing non-institutional with institutional debt in household balance sheets. We use the cross-sectional distribution of interest rates reported in Figure 2.7, to calculate the expected future value of interest saved. We distinguish between loans for medical costs and loans for business operations, including expenses for farm and non-farm equipment. For the median household, the results suggest that a shift from non-institutional to institutional debt can lead to movements up the wealth distribution of between 2.5 pp and 5.5 pp (equivalently, between 1.9% and 4.2% of annual income on an ongoing basis). We note that these estimates are conservative – in a few cases, the shift from non-institutional to institutional debt results in small losses, because some informal arrangements reportedly carry zero interest rates – as we have discussed earlier, this does not take into account non-pecuniary repayments on loans from friends and family. In Panel C, we consider the financing of health expenses exclusively with medical insurance. Under the assumption that the pricing of medical insurance is actuarially fair, there will be no first-order expected gains from the take-up of this product. However, there can be substantial cost savings due to the avoidance of interest payment on unsecured loans. We categorise households depending on their location and monthly per capita consumer expenditure (UMPCE) class, which determines the size of their medical bill (and, indirectly, also the amount of debt they may have to incur to pay for medical costs). We estimate that if households sign up for actuarially fair health insurance (i.e. the premia exactly cover the expected value of realized expenses), they can gain amounts equivalent to an upwards movement of between 0.4 pp and 1.6 pp along the wealth distribution (between 0.4% and 1.2% of annual income on an ongoing basis), simply by avoiding the interest burden accruing from emergency credit. Overall, Figure 2.13 shows that the proposed re-allocations of household wealth are likely to generate positive financial gains for all households and across a large set of of different projected realisations of financial returns, benefitting large parts of the Indian population. In the next chapter, we further explore the causes of households’ sub-optimal decisions, and then discuss qualitative principles for financial policy to help correct some of these problems. Figure 2.1
Access and use of bank accounts Panel A shows that an average of 66% of randomly selected adult household members have a bank account. Access is lowest in Assam, Bihar and Madhya Pradesh (about 50% of respondents), whereas states like Goa, Himachal Pradesh, and Tami Nadu have the highest participation rate (about 80%). However, access does not necessarily mean active use of these bank accounts. Panel B shows that among bank account holders, 64% have used their account in the past 90 days. Use of bank accounts is lowest in Chattisgarh, Jharkhand and Uttar Pradesh (less than 50%), and highest in Goa (about 90%). Use measured with a 30-day threshold is even lower. Merely 43% have used their account at least once in 30 days (not shown). As a means of comparison, per World Bank’s Global Findex, 72 percent of individuals in high-income countries use their account 2-3 times in 30 days (see Allen, Demirguc-Kunt, Klapper and Peria (2016); Demirgüç-Kunt, Klapper, Singer and Van Oudheusden (2015)). 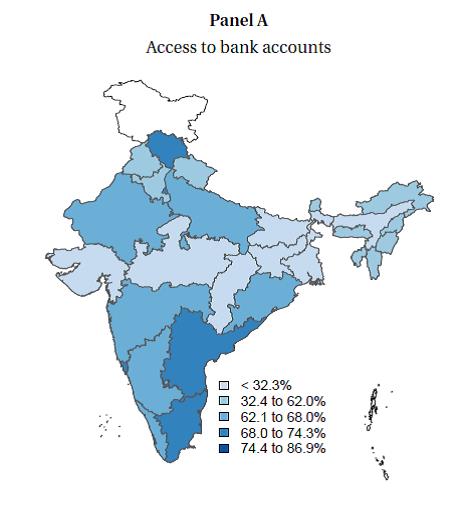
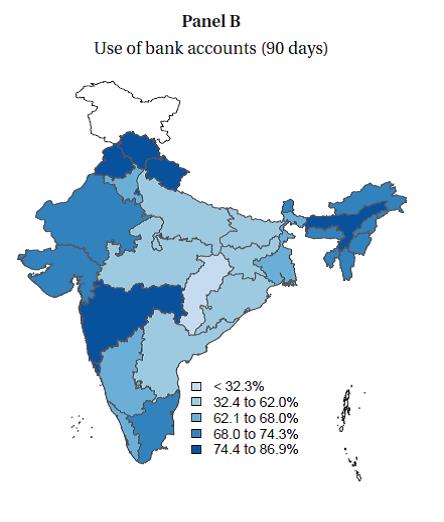 Figure 2.2
Participation rates in life and non-life insurance policies This figure reports the percentages of respondents in the Financial Inclusion Insights Survey (2015) who have life insurance (Panel A), and those who have other non-life insurance policies (Panel B). For life insurance (Panel A), Chattisgarh has the lowest (2.15%) and Karnataka and Tamilnadu have the highest participation rates (22.51% and 17.10%, respectively). For non-life insurance (agricultural, medical and accident), Panel B shows that Odisha, Tamilnadu and Kerala have the highest participation rates (22.17%, 15.28% and 14.90%, respectively), while in Jharkhand, Bihar, Himachal Pradesh and Uttar Pradesh the participation rates are less than 1%.
Figure 2.3
Access and use of PMJDY accounts The State Bank of India, in its submission to the committee, presented statistics on the uptake and non-zero balance PMJDY accounts. This figure reports the total number of accounts per month since September 2014, the share of the total with non-zero account balance and the fraction of the total that have been opened in rural areas. Table 2.1
Regional variation of household balance sheets This table presents the average share of wealth in each asset type across Indian states (in rows), listed in the increasing order of the financial assets ratio. Real estate includes all land and buildings owned by the household. Gold includes jewellery, bullion, ornaments and coins. Financial assets include bank deposits, publicly traded shares and government securities, mutual funds, managed accounts, and informal loans receivable. Retirement accounts include private pension accounts, provident funds, annuity certificates, and life insurance accounts. Mortgage debt includes loans using land or real estate as collateral. Gold loans use bullion and ornaments as collateral. Unsecured debt includes all loans classified as personal security. Non-institutional debt includes loans from family, friends, and money lenders. The data source is the 2012 wave of the All India Investment and Debt Survey. | | Portfolio allocation across asset categories | Allocation of debt across product types | | Real estate | Gold | Financial assets | Retirement accounts | Mortgage debt | Gold loans | Unsecured debt | Non-instit. debt | | Bihar | 90.5% | 2.7% | 1.0% | 0.5% | 8.2% | 0.3% | 81.9% | 82.2% | | Rajasthan | 79.4% | 9.5% | 1.4% | 1.7% | 21.3% | 1.0% | 70.2% | 68.7% | | Nagaland | 82.6% | 1.6% | 1.5% | 7.3% | 8.0% | 0.0% | 30.8% | 40.3% | | Manipur | 84.0% | 5.1% | 1.6% | 2.8% | 3.1% | 14.2% | 30.4% | 77.7% | | Uttar Pradesh | 85.4% | 5.6% | 1.8% | 1.5% | 27.3% | 1.3% | 63.0% | 59.2% | | Madhya Pradesh | 82.2% | 7.4% | 1.9% | 1.7% | 30.4% | 1.0% | 60.0% | 53.6% | | Telengana | 70.5% | 17.5% | 2.0% | 2.4% | 11.3% | 2.9% | 73.0% | 55.8% | | Orissa | 78.9% | 10.0% | 2.1% | 2.0% | 26.9% | 2.3% | 59.1% | 47.1% | | Gujarat | 72.5% | 13.7% | 2.1% | 3.5% | 38.0% | 2.8% | 38.2% | 39.9% | | Uttaranchal | 78.7% | 10.0% | 2.2% | 2.2% | 18.8% | 0.0% | 67.6% | 45.4% | | Lakshadweep | 80.4% | 11.2% | 2.5% | 3.1% | 9.7% | 9.3% | 66.7% | 24.2% | | Jharkhand | 85.6% | 4.4% | 2.5% | 1.9% | 12.9% | 0.2% | 79.7% | 62.8% | | Chhattisgarh | 81.7% | 6.8% | 2.7% | 1.1% | 14.7% | 0.2% | 65.2% | 54.3% | | Kerala | 78.9% | 13.1% | 2.8% | 1.8% | 38.3% | 17.2% | 31.6% | 20.0% | | Jammu & Kashmir | 84.2% | 4.7% | 2.9% | 3.1% | 10.1% | 0.0% | 62.2% | 56.3% | | Tripura | 76.5% | 10.0% | 3.0% | 3.8% | 3.8% | 0.2% | 72.7% | 44.7% | | Maharashtra | 76.6% | 10.4% | 3.1% | 3.6% | 47.0% | 1.4% | 36.0% | 27.9% | | Tamil Nadu | 59.4% | 28.3% | 3.1% | 3.2% | 11.3% | 41.3% | 37.9% | 42.1% | | Punjab | 81.6% | 4.9% | 3.1% | 4.5% | 25.7% | 2.1% | 57.4% | 57.7% | | Haryana | 81.1% | 5.9% | 3.4% | 3.0% | 27.8% | 0.0% | 53.2% | 48.1% | | Goa | 60.0% | 20.2% | 3.7% | 6.0% | 18.1% | 3.5% | 19.0% | 8.0% | | Andhra Pradesh | 62.8% | 21.6% | 3.8% | 3.1% | 9.5% | 9.5% | 55.3% | 48.9% | | West Bengal | 81.2% | 6.7% | 4.0% | 3.3% | 16.7% | 2.8% | 69.5% | 47.4% | | Meghalaya | 80.7% | 3.0% | 4.3% | 3.5% | 2.3% | 0.2% | 74.0% | 24.7% | | Mizoram | 79.6% | 1.2% | 5.0% | 5.7% | 40.7% | 0.0% | 34.0% | 17.2% | | Karnataka | 67.1% | 16.1% | 5.0% | 4.4% | 24.8% | 3.4% | 53.8% | 49.2% | | Assam | 76.1% | 6.6% | 5.3% | 2.6% | 15.8% | 1.2% | 62.9% | 48.0% | | Andaman & Nicobar | 42.5% | 23.5% | 6.3% | 18.1% | 6.4% | 13.1% | 66.4% | 36.2% | | Himachal Pradesh | 71.8% | 13.6% | 6.8% | 3.5% | 35.6% | 0.0% | 42.4% | 35.1% | | Pondicherry | 56.9% | 25.7% | 7.2% | 4.5% | 3.4% | 50.1% | 33.3% | 40.2% | | Arunachal Pradesh | 63.3% | 5.1% | 8.3% | 5.0% | 18.1% | 1.3% | 33.3% | 45.7% | | Chandigarh | 57.0% | 10.2% | 8.3% | 14.1% | 47.1% | 0.0% | 23.0% | 9.5% | | Delhi | 54.9% | 17.4% | 9.8% | 6.2% | 15.6% | 0.4% | 63.9% | 46.6% | | Dadra & Nagar Haveli | 62.8% | 6.5% | 10.5% | 12.4% | 52.7% | 2.4% | 34.6% | 31.3% | | Sikkim | 55.6% | 14.6% | 11.6% | 10.3% | 27.0% | 0.0% | 48.2% | 17.8% | | Daman & Diu | 48.0% | 24.4% | 11.8% | 10.8% | 5.0% | 0.0% | 69.1% | 66.9% | Figure 2.4
Heterogeneity of household decisions This figure reports estimated β coefficients from the following estimated specification: where fi,k are wealth shares of household i in state k, and Xi,k are dummy variables capturing wealth quintiles and education groups, as well as a set of other control variables including age quintile dummies, rural vs. urban residence, and number of children. In this regression, the omitted categories for the two sets of dummy variables are the first quintile of wealth, and the lowest education group, ’Below Primary School’. The reported coefficients capture marginal effects relative to these omitted categories. The data source is the 2012 wave of the All India Investment and Debt Survey. We use population weights, as indicated in the survey. The vertical bars indicate 95% confidence intervals for each estimated coefficient, based on robust standard errors, clustered at the state level. Figure 2.5
Sources of risk for Indian households Panel A of this figure reports the distribution of survey responses to the question ’Which of these events made the biggest impact on your household income in the last two years?’, conditional on having experienced a household emergency. Panel B reports the distribution of survey responses to the question ’What was the main thing done to make ends meet when (highest ranked risked from previous question) happened to you or your household?’, referring to the highest ranked risk from the previous question. The source of the data is the Financial Inclusion Insights Survey (2015). We compute weighted averages across households using population weights, as indicated in the survey.
Figure 2.6
Loan repayment behaviour This figure reports the distribution of survey responses to the question ’Which of the following statements best describes how you usually repay your loans?’, conditional on having a loan outstanding. Non-Bank formal institutions include post offices, NBFCs, microfinance institutions, and self-help groups. The source of the data is the Financial Inclusion Insights Survey (2015). We compute weighted averages across households using population weights, as indicated in the survey. Figure 2.7
Variation of loan terms across households This figure reports the distributions of loan interest rates and loan volumes across Indian households. We winsorize the distributions at the upper 99th percentile. Secured debt includes loans using land or real estate, crops, shares of companies, government securities, insurance policies, bullion or ornaments as collateral. Unsecured debt includes all loans classified as personal security, which are not backed up by any collateral, such as unsecured loans from money lenders, loans from family and friends, and bank credit card or overdraft facilities. The source of the data is the 2012 wave of the All India Debt and Investment Survey. We use population weights, as reported in the survey.
Figure 2.8
Reasons for non-participation in the insurance market This figure reports distribution of survey responses to the question ’There are different reasons for people not having [insurance] products. Why don’t you have it?’. Multiple responses are accepted. The question is only asked to those respondents who answered ’Yes’ to the question ’Have you ever heard of insurance?’. Nevertheless, we have also added the responses of not having heard of insurance in the plot below, to provide a more complete picture. The source of the data is the FinScope Survey (2015). We use population weights, as reported in the survey. Figure 2.9
Substitution effect between insurance products and non-institutional debt Panel A reports the cross-sectional relationship across Indian states between the rate of participation in life insurance and pensions and the incidence of non-institutional debt, among households with positive amounts of debt. Panel B reports the estimated coefficient from a linear regression where the dependent variable is a dummy which takes a value of 1 if the household has outstanding amounts of non-institutional debt, and the explanatory variable is a dummy variable which takes the value of 1 if the household has life insurance or pension accounts. We include additional control variables sequentially, as indicated on the horizontal axis. The demographic characteristics we consider are age groups, education, and the number of children. The vertical bars indicate 95% confidence intervals, based on robust standard errors, clustered at the state level. The source of the data is the 2012 wave of the All India Debt and Investment Survey. We use population weights, as reported in the survey. 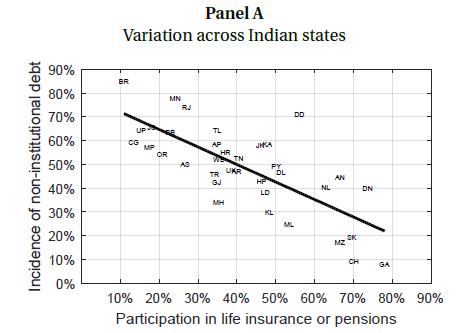
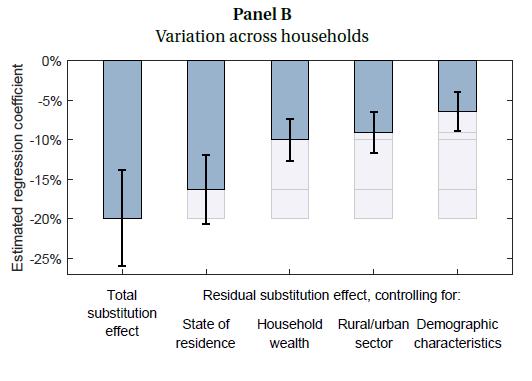 Figure 2.10
Retirement planning behaviour by Indian households Panel A of this figure reports the distribution of answers to question ’What best describes your current position regarding retirement planning?’. Panel B reports the distribution of answers to the question ’What are likely to be the primary means for you to ensure financial security in your old age?’ asked to those respondents who expected to retire. In this case, households have the possibility to choose multiple responses at the same time. The source of the data is the 2016 wave of the ICE 360 Degrees National Household Survey. We use population weights, as reported in the survey.
Figure 2.11
Predicted change in Indian population across age groups In this figure, we report predictions about the evolution of the Indian population between 2017 and 2031. We divide the population in twelve age groups, each comprising five years. Panel A reports predicted absolute changes (expressed in crore of individuals), and Panel B reports predicted relative changes (expressed in percent, relative to the respective initial population level in 2017). The source of the data is Prof. Irudaya Rajan, Centre for Development Studies, Tiruvananthapuram, India.
Figure 2.12
Projections
Figure 2.13
Estimated gains from changes in household behaviour This figure reports the distribution of estimated gains from three alternative scenarios capturing changes in household behaviour. We express the financial gains in percentage point (pp) movements across the wealth distribution for the median household, over a period of 10 years. For example, a value of 5pp implies a financial gain equivalent to moving from the 50th to the 55th percentile of the wealth distribution. In Panel A, the scenario considered is a shift of 25% of gold holdings to financial assets. We use two alternative estimated return processes for gold and financial assets, the first capturing to the experience of India over the last 15 years, and the second the experience of the United States. The lower and upper limits of the bars indicate the 5th and 95th percentiles of the estimated simulated distributions, and the horizontal line indicates the median. All financial returns and household gains are expressed in real present-value terms, assuming a risk-free interest rate of 4%. In Panel B, the scenario considered is a replacement of non-institutional with institutional debt. We use the cross-sectional distribution of interest rates reported in Figure 2.7, to calculate the expected future value of interest saved. The lower and upper limits of the bars indicate the 5th and 95th percentiles of the cross-household distribution of interest rates, based on the cross-sectional variation of interest rates. The horizontal line indicates the median. For some few cases, the shift from non-institutional to institutional debt results in small losses, because some informal arrangements carry zero interest rate. On the horizontal axis, we distinguish between loans for medical costs and loans for business operations, including expenses for farm and non-farm equipment. In Panel C, the scenario considered is the financing of health expenses exclusively with medical insurance. Under the reasonable assumption that the pricing of medical insurance is actuarially fair, there will be no first-order expected gains from the take-up of this product. However, there can be substantial cost savings due to the avoidance of interest payment on unsecured loans. The lower and upper limits of the bars indicate the 5th and 95th percentiles of the cross-household distribution of gains, based on the cross-sectional variation of interest rates. The horizontal line indicates the median. On the horizontal axis, we distinguish between different hospitalization costs, corresponding to the respective UMPCE class. The data sources are the 2012 wave of the AIDIS national survey, the FRED St. Louis database, and the 2015 wave of the NSS health survey. 
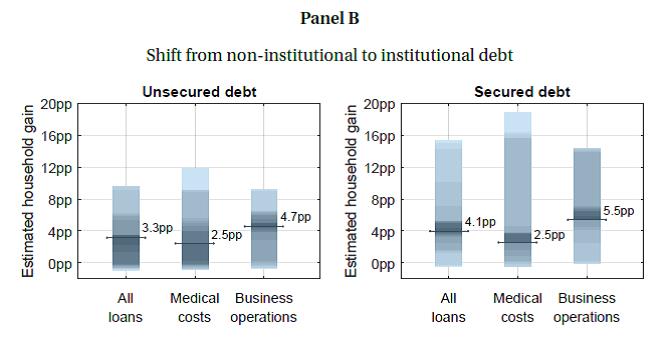
 _____________________________
CHAPTER 3
ENABLING IMPROVED HOUSEHOLD FINANCE OUTCOMES In this chapter, we continue our diagnosis of the motivation behind Indian households asset allocation and liability choices. To do so, we continue our analysis of a number of micro-level surveys that are representative for the Indian population. We then describe the complexity of Indian household financial needs. We use these insights in combination with those from the previous chapters to identify five fundamental principles that should guide financial product innovation and household financial policy: relevance, intuitiveness, customisation, scalability, and incentive-compatible pricing. 3.1 Explaining household behaviour using household surveys HIGHLIGHTS • The lack of trust in financial institutions partly explains the tendency of households to avoid financial products and invest in physical assets such as gold instead. • The role of non-institutional debt appears to be related to the type of expenditure for which the liability is incurred, and the urgency of the financial need. • Households associate formal banking institutions with large administrative burdens and complicated paperwork. • Lack of participation in the market for life insurance products is related to the self-perceived financial management skills of the household head. • “Nudge” solutions, where sensible default options are provided to households appear promising to improve Indian household finance outcomes. In the previous chapter, we have uncovered evidence that Indian household financial allocations appear to deviate from what we might consider to be optimal financial allocation and behaviour. In this chapter, we continue to uncover evidence along the same lines, and more importantly, identify a number of important underlying reasons for why this is the case. In particular we find that there are several important frictions that households face, including high transactions costs and bureaucratic impediments to efficient participation leading to a high “nuisance factor” for households; trust issues that households face in their participation in formal financial markets, which arise both from their perceptions of formal providers as well as trust issues that correlate highly with the income level of the household; the complexity of Indian households’ financial lives, which are seldom addressed by much of the current supply side solutions; and the lack of a unified framework and guidelines for the provision of high quality and low cost financial advice to households. We use qualitative survey data from a variety of sources, as well as submissions to the committee from a variety of sources to evaluate Indian households’ perceived obstacles to efficient financial market participation. Evidence from these self-reported sources can help to uncover the factors, both institutional and behavioural, which impede Indian households from making what we might think of as closer-to-optimal decisions. For example, Figure 3.1 highlights from a submission to the committee by the Financial Planning and Standards Board of India (FPSB), which conducted a survey of financial advisors. These advisors report that a number of factors such as culture, tradition, and social norms, in addition to more standard factors such as real returns, perceptions of risk, safety, and tax incentives appear to drive household decisions. Of course, the simple behavioural explanations documented here hide potentially significant effects of omitted household characteristics such as the income level, and the state of residence. We therefore describe a more comprehensive analysis of micro-level survey data below, which continues on from our analysis in the previous chapter. Gold Panel A Figure 3.2 shows that the largest determinant of gold holdings is risk aversion, i.e. the perceived role of gold as a safe asset. People avoid financial assets such as mutual funds, stating: ‘I feel it is too risky and I’ll eventually lose money,’ and appear to view gold as a relatively “safe” asset. However, we note that the move towards gold may not solely be because of the “pull” of gold, but also because of a “push” away from other products. In particular, the relationship between financial product suppliers and households appears to be contaminated by the effect of negative experiences, as well as the lack of trust in formal financial services. The figure shows that those that agree with the statement ‘I don’t trust finance companies’ are also more likely to hold gold. Consistent with this result, we also find increased gold holdings for people that have a feeling of receiving unequal treatment and experiencing feelings of alienation. We surmise that these issues are exacerbated by the use of jargon in financial product terms and conditions, rather than simple, intuitive explanations. We also note that households appear to feel less control over financial assets which impose barriers to immediate access, such as the need to maintain minimum balances and tight restrictions on number of withdrawals. This can be contrasted with the feeling of immediacy and tangibility that gold reassuringly (though ultimately illusorily) provides. We note that after controlling for the broad role of education, state of residence, and income, financial knowledge doesn’t seem to have a residual role. That said, the formal financial advice received by households, and the degree to which households can relate to the terms and conditions of financial products do seem to have an important impact on their decision to hold gold. Overall, it appears that the large reliance on gold is not necessarily driven solely by a lack of education or financial literacy, but more by perceptions of risk/return, and by feelings of mistrust in formal financial institutions. Non-institutional debt We now turn to the determinants of non-institutional debt take-up, focusing on all households that take on positive amounts of debt. This allows us to focus on the decision of choosing between formal and informal debt rather than the decision to take any debt at all. Panel B of Figure 3.2 shows that the relative prevalence of non-institutional debt is mostly associated with the fact that the loan was taken in order to pay for emergency expenses, even after controlling for household demographic characteristics. Moreover, we find that what seems to deter people from engaging in formal credit agreements with banks is not their lack of trust, but rather, their perception that bank paperwork is too complicated, coupled with their lack of understanding of terms and conditions. This suggests that in credit, onerous bureaucratic requirements play a central role in pushing Indian households towards poor choices. We also note that the additional flexibility inherent in informal arrangements seems to be an important determinant of informal loan take-up. However this is dangerous, since such flexibility can make it easier to roll over such high cost debt, thus causing households to fall into debt traps. Overall, we conclude that on the assets side, it is trust rather than access which is the main problem for households. In contrast, on the liabilities side, it is access to the relevant product, especially in case of emergencies, that is the main issue that households face. Life insurance Panel C of Figure 3.2 shows that participation in the market for life insurance is significantly influenced by the degree to which households can relate to the products they are being offered, and to the distribution channel through which it is offered. Financial advice seems to help, as does the use of technology, suggesting that such interfaces may be a preferred way to distribute such products. Online interfaces allow households to acquire information more quickly, to compare different products, understand the experiences of others, and easily make payments. Similarly, the fact that households obtain financial advice from sources outside the immediate circle of family and friends is conducive to a higher participation rate in insurance products, above and beyond the role played by demographic factors and wealth levels. Importantly, the lack of trust in financial institutions has a strong negative effect, which is not surprising. Of all financial products, life insurance arguably commands the largest amount of trust between the client and the supplier of the product. After controlling for these effects, we still note a very large role for the general attitude of the household towards dealing with emergency expenses. Beyond the role of demographic characteristics and wealth levels, we note that households that are aware of their sources of financial vulnerability and explicitly save for these emergencies are more likely to also invest in life insurance. This suggests that constraints rendering it difficult for households to pay the up front insurance premium costs cannot completely explain the debt-insurance tradeoff that we detect in the data. Financial literacy Continuing with this simple analysis, we further discuss the issue of financial literacy – which shows up when we analyze the take-up of non-institutional debt and the purchase of life insurance products. Table 3.1 shows that a large fraction of households appears to lack the skills required to understand the concept of compound insurance, and that this issue is particularly prevalent in the case of compound interest accruing on debt obligations. This may also result in households getting into debt traps, especially if they are confused about the details of their liabilities and the manner in which interest accrues on them. Panel B does show, however, that Indian households’ levels of financial literacy compare favourably with those in other low income countries, though they are still far away from their counterparts in more advanced economies. It is worth noting here that even in countries such as the United States, financial literacy can be hard to improve given that many households are unfamiliar with the basic economic concepts needed to make adequate saving and investment decisions (see Lusardi and Mitchell (2011)). Households generally tend to choose the path of least resistance, engaging in passive decision-making and accepting the status quo (see Choi, Laibson, Madrian and Metrick (2002)). Nevertheless, recent evidence points to the fact that households respond strongly to system design features that reduce the decision-making burden of taking a certain action, such as sensible default options, automatic enrolment, and simple product “nudges” (see, for example, Madrian and Shea (2001) for evidence from the United States, as well as Hedesstrom, Svedsater and Garling (2004) for Sweden, and Lippi (2014) for Italy, and Andersen, Campbell, Meisner-Nielsen, and Ramadorai (2017) for Denmark). We do consider policy solutions along these lines in our recommendations. 3.2 The complexity of Indian household financial demands HIGHLIGHTS • Self-reported financial goals of households are often driven by 'life-events', such as marriage. • Variation in the timing and frequency of income received determine how Indian households engage with financial markets. Poor access to credit markets for micro-enterprise cause household financial goals to also reflect small business goals. • Despite significant progress, both monetary and non-monetary transactions costs remain high. • Decisions concerning homeownership, savings product choice, insurance, pensions, mortgage lending and emergency credit are inter-dependent and inter-related. We have documented that the nature of household financial demand is complex and involves multiple issues including households’ cognitive and behavioural biases, issues of trust in the financial system which vary across households, differing needs and idiosyncrasies arising from wealth and education levels, geographic location, and the interaction with traditional systems of risk-sharing. In this section, we discuss the distinctive features of Indian household financial demands that need to be considered when making policy. These features generate significant complexities in implementing solutions in the Indian context, as we are dealing with one of the most diverse and unique countries in the world. Financial goals of the household Customers of Kshetriya Grameen Financial Services (KGFS) – an integrated financial service provider for Indian households in three States of India, Tamilnadu, Odisha and Uttarakhand1 – are asked to indicate their financial goals, as well as the amounts that they desire to save in order to reach those goals. Table 3.4 presents the ratios between these goals and the yearly household income for each household and reports the average ratio for five different income quintiles. This provides a snapshot into understanding the range of motives underlying savings by households. For a large section of the customer base, housing, marriage and education form the three most important goals to achieve through financial savings, whereas concerns such as medical emergencies, repaying loans, or obtaining durable goods and livestock form the least important set of goals to achieve through financial savings. However, the relative importance of different types of financial goals varies across the income distribution. For example, very low-income households wish to save nearly 65% of their annual income in an effort to repay past loans, whereas this motivation is of relatively low concern to households on the higher end of the income distribution. Savings motives for poorer households are also driven by the need for savings to invest in business enterprises that may not qualify for formal financing from banks and this is quite consistent across the income distribution. The richest income group also intends to save nearly 15% of annual income towards investing in private businesses. An important cultural issue becomes evident from the data in this table. The poorest income group appear to wish to save, on average, 117% of their annual income towards a single life-event, namely marriage. However, this ratio falls dramatically with income, reaching 15% at the top quintile of the income distribution. This pattern is also evident for all of the other goals, although the tapering off appears quickest for marriage. The key here seems to be that there are high “fixed costs” for life events such as marriage, meaning that the burden of delivering what might be perceived to be a reasonable marriage falls disproportionately on the poor. We note here that traditionally, such community celebrations have served to reinforce informal social insurance or risk-sharing arrangements which often functioned well. However, as we highlighted earlier, these traditional systems have and will increasingly come under pressure as the economic environment and social structures change over time. Box 1 shows that the National Pension Scheme – Swavalamban (NPS-S) has been relatively successful in making households save for retirement. However, nearly 50 percent of the customers studied in Sane and Thomas (2015) do not manage to contribute the required ₹1000 over a 12 month period to obtain the incentives in the scheme, although they do continue to make smaller contributions. This suggests the importance of flexibility and customisation in product design - to cater to the diversity of households’ ability to pay. Insuring against systematic risks Variation in the timing and frequency of income received (Table 3.3), alongside the considerable income volatility faced by Indian households also play important roles in determining how Indian households engage with financial markets. For example, Box 1 presents evidence from Sane and Thomas (2016) where insurance repurchase decisions are affected by rainfall conditions (a proxy for income uncertainty) and whether households have access to micro-finance loans (a proxy for binding liquidity constraints faced by the household). The problem with insurance in India is the time-inconsistency in the payoffs associated with holding insurance. The problem is exemplified by the need to explain the welfare gains of holding a health insurance to a perfectly healthy individual, which can be baffling to someone not familiar with formal financial markets, and inherently distrustful of formal institutions. This is in addition to financial constraints which may affect the payment of up-front premium costs. It is undoubtedly important, though, that households take up such products. The adjustment costs that households can face if the major income earner is no longer able to provide for the household can be enormous. Life insurance is an extreme form of inter-generational income hedging for households, and this fact is neither straightforward nor something that households think about very often. A preponderance of labour-intensive activity in the Indian economy also creates a desperate need for insurance products that consider other possible sources of income-loss such as accident insurance, and we note that the RuPay accident insurance being offered alongside PMJDY account seeding is an excellent step in the right direction. However, as we have seen, cost and distribution considerations seem important to Indian households when contemplating insurance purchase. We therefore have several recommendations in the next chapter about low cost and relevant insurance products, and about how best to rationalise distribution incentives. We do note that the market determined rate of commissions may indeed be high, given the need to expend significant effort to educate households at the point of insurance sale, but note that this is a delicate balancing act – since high commissions can create unsavoury incentives. One solution to this is to use sensible default options for low cost, “approved” products to drive product take up. Information and market access One possible way to allow for a better match between households’ needs and the products that address these needs is through the provision of relevant financial advice. However, we note that the structure of financial advice received by households is inadequate to help them through the significant challenges that they face. Table 3.2 confirms that a large fraction of individuals rely on themselves, their spouses, friends, family, and neighbours for financial advice, rather than on any formal sources. While there are some certification mechanisms for advisors in India, there is a bewildering array of designations including Registered Investment Advisors, Insurance Agents, Independent Financial Advisors, and other agents/brokers/intermediaries who sell various financial products, who are are all referred to as financial advisors. In addition, the current set of regulations is product-specific and there is no uniform regulation of financial advice. This is especially important since household decisions in one portion of their balance sheets clearly affect other portions of their balance sheets. We therefore provide several recommendations in the next chapter as to how this important sector can be revitalised and rationalised. Transaction costs The policy focus thus far has been essentially geared towards a state-driven enterprise for financial inclusion. Banking regulations have been modified to allow for basic bank accounts and a government-led initiative, PMJDY, to open basic bank accounts for every individual in India is underway. Yet, barriers to financial participation persist. Box 4 presents an audit-study on the monetary and non-monetary costs of opening bank accounts in southern India and shows that the monetary and non-monetary costs of participating in basic financial products remain large. The total costs, as presented in the study, amount to nearly one full day of daily earnings by poor households in India and an entire day’s worth of work to open a bank account – all spread out over 3 visits to the bank branch. In addition to these relatively onerous costs, in an environment where a large portion of the population does not understand simple and compound interest rates (Table 3.1), and households rely on financial advice from institutional sources (Table 3.2), we also need to account for monetary and non-monetary costs such as cognitive and psychological barriers when households access and process financial information. It is worth highlighting here that the heterogeneity of household circumstances (which is also correlated with geographical diversity, see Table 2.1) also makes for a difficult environment for financial service providers such as banks and other financial institutions. Such heterogeneity adds to costs for reaching Indian households, and the costs of setting up and maintaining distribution networks. Indian households require customised solutions that vary across the country, as well as across the age and wealth distribution. However the relatively low levels of income that Indian households have mean that it is difficult for service providers to justify reaching them unless solutions are scalable and can be implemented at very low cost. One solution that has often been proposed is to force banks to lend certain quantities to low income households, such as Priority Sector Lending (PSL) norms, although such quantity solutions carry risks of being haphazardly implemented, and price mechanisms may be preferable. The role of formal credit markets The appropriate use of formal credit markets involves both the use of secured lending products as well as accessing working capital in the form of overdrafts and allowing for smoothing systematic liquidity cycles that arise from cycles in economic activity. For example, patterns of income arising from sowing–to–harvest cycles need to be appropriately accounted for while assessing the credit demand of Indian households that are predominantly dependent on agricultural or agricultural-related labour activities. We note that the main approach to the systematic reduction of informal credit from non-formal unregulated institutional sources such as moneylenders is to expand the banking network to reach unbanked areas in India. From a meagre 7.2% of total rural credit issued by institutional sources in 1950-51, India has come a long way in raising the share of institutional credit every decade, which has reached more than half of all credit issued at the present time. This has in turn systematically decreased the share of private moneylenders from nearly 93% in the early days of independence to about a third by the turn of the millennium. However, we note that the significant reliance of Indian households on informal sources of debt is not only driven by lack of access to formal institutions. It is clearly also driven by the advantages of localised sources of credit to households. To provide just one example, households can remain ‘invisible’ to financial institutions because of difficulties in assessing their credit worthiness if they lack borrowing track records, or have irregular patterns of income. In such circumstances, moneylenders can provide a great deal of value, because of their local networks, regional and cultural knowledge, ease of immediate access, timeliness of credit provision, and near zero bureaucratic transactions costs. To effectively compete, despite the obvious cost advantages of institutional credit, formal credit providers need to step up their game along these dimensions. Clearly, technology is one effective approach to levelling the playing field along these dimensions. We also point out the strong correlation, uncovered in section 2.2, between low insurance take-up and the high prevalence of non-institutional debt. Insurance and non-institutional debt may be two sides of the same coin, meaning that tackling one without the other is likely doomed to failure. Turning to the relatively low prevalence of collateralised debt, we note that Indian households tend to bequest land and real-estate to the next generation, who also provide for the elderly during their retirement. Such informal social arrangements help to explain the poor level of financial savings for retirement, whilst simultaneously explaining why mortgage markets are stunted, and why markets for real-estate are illiquid. As these traditional social structures evolve, households will need well-functioning credit markets to attend to their financial requirements. Overall, we conclude that the financial goals of individuals are very diverse. State-driven centralised policy solutions will certainly enable some support to the very poorest, but it is clear that to cater to the vast array of diverse needs, it is important to improve households’ use of the formal financial system. More importantly, the design and implementation process of novel policies and financial products to support households requires a new set of principles to guide their development, if the goal is to achieve closer-to-optimal household finance outcomes in the coming decades. In the next section, we present a few qualitative principles to keep in mind when designing policies around products which will help households achieve their heterogeneous goals and objectives. We then move on to our more concrete recommendations. 3.3 Qualitative principles for household finance policy HIGHLIGHTS The committee has identified five principles to guide the framework for financial product innovation and household financial policy. | Relevance | Suitable financial products delivered using distribution mechanisms with appropriate incentives, and if needed, financial advice that is in the best interests of the household. | | Intuitiveness | The producer of a financial product should make the key aspects of product terms and conditions intuitive and salient at the point of sale, by leveraging natural communication patterns, behavioural heuristics, etc. | | Customisation | In response to the diversity of household needs, financial products should be customised to help achieve household-specific objectives. | | Scalability | Policy that enables and filters for suitable supply-side solutions that can be scaled up at relatively low cost is essential. | | Fair pricing | Pricing regulation needs to take into consideration the incentives and competitive structure of product suppliers, arbitrage across similar products, the options for consumers who do not have access to the product due to the regulation, and whether consumers will be worse off as a result of intervention. | I save money in a box at home which is labelled ‘sister’s wedding’. Yes, I have a bank account but who will go to the bank to handle hotchpotch. We are illiterate and happy with our way.
________________
Woman, street hawker (Omidyar Network, 2017) The Financial Sector Legislative Reforms Commission (“FSLRC”) and the Committee on Comprehensive Financial Services for Small Businesses and Low Income Households (“Mor committee”) form the basis of recent policy thinking about the future of financial services in India. While the FSLRC focuses on design principles that govern protecting financial consumers from mis-selling and inappropriate product purchase, the Mor committee laid out six vision statements that govern their policy recommendations.2 These and other reports such as the Deepak Mohanty committee on the medium-term path to financial inclusion, the Sumit Bose committee report, the Dhirendra Swarup committee report, the Raghuram Rajan committee report, and the C. Rangarajan committee report are important milestones in the evolution of policy thinking in the area of financial inclusion have laid the foundations for the vast investments made in the country towards universal access to bank accounts and payment systems in the past few years. This committee strongly believes that while such solutions will certainly make a material difference to Indian households’ financial decisions, they are the first step in a long journey. Indian households do need access to financial products and services that have simple and standard contractual designs, but also require solutions that address their unique characteristics. Solutions in Indian household finance face the rare challenge of needing to be both customised and scalable, to maximise the chances that households efficiently use these products to achieve their objectives. In the presence of the twin needs of customisation and scalability, regulators and government on their own cannot create supply that is suited to household demand. Household financial needs are dynamic and evolving, and we envisage that an ideal regulatory framework will support continuous financial product and services innovation to deliver relevant products and services to households at low costs. Below, we discuss the ingredients of relevance, intuitiveness, customisation, scalability, and incentive compatible pricing, which serve as a guide to our recommendations for building a robust system that caters to the needs of households in India, whilst containing risks. Relevance The principle of relevance enshrines the idea that households need a holistic financial solution that is welfare improving. Any suite of products and services purchased by a household should improve its welfare. In addition, ideally, no other combination or suite of products and services should be able to deliver the same welfare improvement at a lower cost (monetary or otherwise) to the household. The idea of relevance encompasses two sub-principles that are widely discussed and covered in other discussions of household finance, including previous Indian policy reports, namely, suitability and appropriate financial advice. Suitability The principle of suitability means that the right product should reach the right household. The right to suitability has been expanded upon both by the FSLRC and the Mor Committee as the cornerstone in the legislative framework for protecting retail3 financial consumers. A suitable product is one that matches a financial consumer’s situation, objectives, risk appetite, and knowledge. The importance of suitability is particularly high in an environment of rapid financial innovation and easy access to technology, as the potential for costly and widespread mistakes is great. We also note that the interaction of advice and suitability is critical: the former pillar defines who is an advisor and what constitutes advice, while the latter defines the scope of the material engagement between professional advisors and financial consumers. Suitability has become an important aspect of financial regulation in India. The RBI’s Charter of Consumer Rights4 issued in 2014 arms financial consumers with the right to suitability, where products sold to them will need to be assessed by banks as being appropriate to their needs and objectives. In 2012, IRDA issued draft guidelines5 where the regulator proposed the use of suitability metric for insurance products. In 2011, a SEBI circular6 holds investment advisors responsible for the appropriateness of products sold to consumers. Similarly, PFRDA in its draft regulations7 in 2016 incorporated the principle of suitability for retirement advisors. While the principle has been well articulated in subordinated legislation and in draft guidelines by all the regulators, we also note that there is a lack translation of these principles into practices on the ground. We note that implementing suitability requires additional work by each sectoral regulator in the form of detailed guidelines, enforcement, and regulatory audit, and urge all regulators to move in these directions. Integrated financial advice Appropriate financial advice can help households to purchase suitable financial products. However, this requires a careful codification of what constitutes advice and how any such activity is regulated. Needless to say, such a definition and proposed structure of advice needs to be consistent across different regulators and financial products. Investment advisory as a standalone enterprise is still at its nascent stage in the country, and is in many instances intertwined with the marketing and selling of financial products to Indian households. These issues have only been the subject of regulatory attention quite recently: for example, SEBI and PFRDA issued regulations on segregating advisory services from marketing and sales in 2013 and 2016 respectively, while IRDAI8 and RBI are yet to have specific advisory regulation that covers financial products such as life and non-life insurance, secured and unsecured loans such as mortgages and personal loans. However, in a good recent move, the RBI has issued directives to banks whose branches sell third-party products such as mutual funds, and insurance, and made it clearer that misselling via such “agency” services will not be tolerated. In our set of recommendations, we discuss our proposals to streamline and close gaps in the current system prevailing in India, and to enable the rise of unified financial advisory service providers with a consistent rule-book across regulators and products.9 Intuitiveness Making sensible decisions about financial products requires information that goes beyond product prices. Such decisions require considerable investment by financial consumers on the terms and conditions of any financial contract that they purchase, often in the absence of the specialized knowledge needed to take such decisions. Flipping this problem on its head, this committee believes that the producers of such financial products are best placed to identify the key aspects of the terms and conditions and factors that will determine whether or not such a product is relevant to a household. The principle of intuitiveness, therefore, places the onus on the producers of financial products to come up with ways to make the most important factors that determine the relevance of the product to a household intuitive while advertising for, and at the point of sale of, such financial products. Disclosure has been an integral part of most regulations as the first-step towards providing relevant information for consumers to take decisions. However, the principle of intuitive disclosure emphasises the need for producers of financial products to highlight salient factors to households in an easy to understand-fashion. Customisation The vast heterogeneity of Indian household financial circumstances gives rise to different types of risks and shocks that need to be hedged. The diversity of sources of income uncertainty faced by different households, differences in the timing of income receipts, levels of informal risk-sharing within families, varying levels of trust in the financial system, diverse experiences which generate differences in beliefs about and preferences for financial products, variation in the level of attention paid to financial planning, and the differences in the level of knowledge about the financial system together constitute a complex environment for households. In such an environment, it is difficult to create and distribute one-size-fits-all financial products. Any policy framework needs to recognise the need for household-level customisation to more efficiently serve households. It is very important to note here that this customisation does not necessarily imply a vast array of completely different or exotic financial products with complex features.10 What it does mean, however, is that functionally similar products need to account for the diversity of household circumstances in some customised fashion. For example, it is no use forcing all households to have the same repayment frequency on short-term debt instruments, since their income processes may exhibit very different time patterns. Box 1 Product customisation: Examples Standard policy tools such as tax breaks or employer-driven programmes do not cover a vast majority of Indian households, especially those working in the informal sector of the economy. The National Pension Scheme – Swavalamban (NPS-S) was introduced in an attempt to close this gap. Under the scheme, the Government of India contributed ₹1,000 per year to each account, for individuals that contributed themselves between ₹1,000 and ₹12,000 per annum. Using administrative data from Kshetriya Grameen Financial Services (KGFS), Sane and Thomas (2015) document the extent of enrolment into the NPS-S. Aggregate contributions into the NPS-S scheme have been growing over the 3 years since the product was launched (see graph below). Of the 300,000 KGFS customers in the sample as of March 2013, 12.5% opted in for NPS-S, most of which are lower-income households. However, when assessing the persistence of contributions to NPS-S scheme after enrolment, Sane and Thomas (2015) find that nearly 50% of the customers did not manage to contribute the required ₹1000 over a 12 month period required to obtain the contribution from the government. Many customers continue to contribute to the scheme over subsequent years, but face a loss in accruals from government benefits. In subsequent work, Sane and Thomas (2016) attribute most of the foregone insurance renewals to the presence of liquidity constraints and income uncertainty, suggesting the need for more customised products that take into account the timing of contributions, income uncertainty, and suitability of contribution frequency for daily labourers, monthly-wage earners and workers who do not have regular earning patterns. |
Box 2 Impact of pricing regulation on Mutual Funds in India The costs of distributing mutual funds have gone through many changes over the past two decades. Initially, funds could levy a maximum charge of 6% of the money collected in a new fund offer (NFO) over the next five years. Additionally, funds were also allowed to charge investors an entry and an exit load that together were capped at 7%. The actual entry loads imposed were on average about 2.25%. Exit loads varied from scheme to scheme. Funds could also charge investors a fee for managing their money – typically a graded structure with an average of 2% for equity funds. Over time, distributors (including banks) typically gained the 6% NFO charge along with the average 2.25% commission as a first year sales commission. To profit from these charges in a market with growing returns, sellers could churn investors from one scheme to another, gaining many multiples of the combined 8–9% commission several times a year. Over 73% of the inflows in mutual funds in 2005-06 coming from NFOs and the NFO charge led to a gain of ₹2,281 crores over a five-year period to the distribution industry. In 2006, SEBI banned the 6% NFO charge on open-ended funds. In 2004-05, the industry launched just 3 closed end NFOs, while it launched 51 opened ended NFOs. After the rules were changed, the manufacture and sale of closed-end funds rose to 21 in 2006-07 and then 31 in 2007-08. Open ended NFOs dropped from 51 to 18 in 2006-07, and then rose marginally to 27 in 2007-08. In January 2008, the regulator created a level-playing field between open and closed end funds by banning the NFO charges of 6% on closed-end funds which was followed by single-digit new closed-end NFOs in 2008-09. For the 22 month period that this discrepancy existed, Anagol and Kim (2012) find that inflows into the more expensive funds were much higher. The authors estimate that investors paid approximately USD 500 million in extra fees in this period. Additionally, in August 2009, SEBI banned upfront commissions. All of the investor money was to be invested in markets since August 2009 and the seller had to be compensated either by the investor paying a fee for advice or through the trail commission model, with the money coming out of the overall expense ratio. Although these rule changes dramatically changed distribution incentives, the industry continued to grow at an average annual growth in equity AUM of 10% from 2005-06 to 2016-17. This episode highlights that regulations that reduce distribution incentives don’t necessarily kill off an industry. While evaluating counterfactuals is always difficult, it does appear that one important outcome has been a reduction in the costs of mutual fund participation, which is beneficial for households. Moreover, it appears that this industry has both grown and adapted to providing financial products with low and transparent fees. Source: https://goo.gl/GZAngH | Scalability One of the goals of this committee, as with committees of the past, is to ensure that suitable financial products can be delivered to households at all points in the income distribution, i.e., at large scale. For suppliers of financial products to be incentivised to serve low income households, they must be able to achieve profitability at necessarily small transaction sizes from such households. This in turn means that the costs of enabling such transactions must be low, whilst simultaneously allowing for household-level customisation at such low price points. The committee recognises that this poses a significant challenge for producers, and later, we suggest ways in which the costs of experimentation, an essential input into the discovery of such frugal innovation, can be reduced for producers. Box 3 Impact of pricing regulation on the insurance industry It is important when formulating regulation that affects prices to consider the impact on demand for similar products, as opposed to simply considering the impacts on the product under scrutiny. An interesting example of problems that arise if this issue is ignored is offered by the case of Unit-linked insurance Plans (ULIPs), which are bundled insurance and equity investment products. In 2003-04, traditional insurance plans contributed 92% of total first year premiums in the insurance industry. However, by 2006-07, the share of ULIPs rose to 48% and then to 70% in 2007-08: 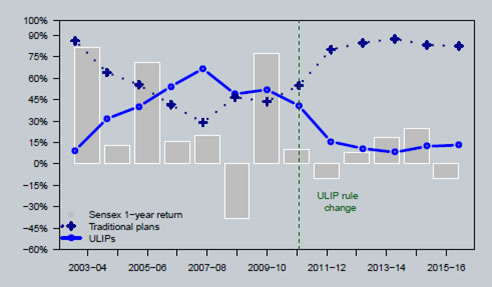 This increase in ULIPs can be linked, in addition to other factors, to distribution incentives. In particular, investors may not have been made aware that ULIPs needed to be funded every year for 10-15 years before returns would accrue, and that there was a requirement for a three-year lock-in period. Investors seem to have purchased these equity-linked ULIPs assuming instead that they were buying a three-year guaranteed product with high returns. Additionally, extant regulation allowed for firms to keep any flows into the product in the event that investors stopped funding them in the first three years. The incentive issues were exacerbated by the fact that agents received 40% of the first year’s premium in the form of commission. The booking of such 'lapsation' profits by firms is well documented.a For example, Halan, Sane, and Thomas (2014) document that investors lost more than ₹1.5 trillion on these products between 2005 and 2012. In June 2010, sensibly, IRDA forced the industry to reintroduce the product with drastic changes to the distribution incentives and rules surrounding what firms ought to do with discontinued investments from investors. However, the attempt to rationalise distribution incentives did not consider the level of incentives on alternative possible insurance products that could be sold to investors, which continued to be governed with old rules around commissions, costs, and lapsation profits. As the graph above shows, insurance sales appear to have moved from ULIPs to traditional plans. This example suggests the need for rationalisation of policy that applies across comparable financial products, as opposed to a product specific approach. Source: https://goo.gl/GZAngH
________________________________ a https://goo.gl/IAF7aa | Clearly, the same argument can be run in reverse. Scale can reduce the price point at which products are delivered to households. However important issue here is that scale must be balanced against the need for competition. This is particularly a challenge in an information business such as finance, in which there are significant economies of scale arising from data acquisition at the household level. As technological developments enable efficient processing at low cost the committee therefore recognises two important issues. First, there is a need to robustly regulate natural monopolies that may arise in this context. Second, there is a need to preserve individual privacy as data acquisition occurs at large scale in household finance. The committee also notes that the need for privacy or restricted access to certain types of data also arises because algorithmic provision of household finance services can in some instances lead to discriminatory outcomes if left unchecked. Fair pricing I am confident that the new rules strike the right balance for firms and consumers. If the price cap was any lower, then we risk not having a viable market, any higher and there would not be adequate protection for borrowers.
________________________________
Martin Wheatley, CEO Financial Conduct Authority on Payday loan price caps A regulator needs to evaluate whether the pricing of a financial product is fair. However, any such regulation also needs to recognise that distribution is expensive in India, with its myriad complexities of geography, consumers, and the lack of widespread sophistication about, and familiarity with, financial products. If prices for financial product are high, the committee is of the view that regulators need to address several questions before taking action. First, regulators need to assess the competitiveness of the market for the financial product, and ascertain whether producers are exercising monopoly power. Second, there may be implicit or explicit collusion across producers, and such circumstances call for regulation. Third, it may be that producers are exploiting highly inelastic demand for certain types of financial products that serve essential functions for consumers, such as basic credit. In such cases, there is also clearly a need for regulatory intervention.11 finally, there may simply be technological or geographical impediments to low-cost distribution, and regulators should seek to eliminate bottlenecks where possible. We note that policy on pricing requires inter-regulatory coordination to ensure that any regulations do not distort incentives across products that have similar features. For example, if insurance markets are well-regulated and unsecured debt markets are unregulated, then households may be driven towards a high cost choice if producers have incentives to push business towards less regulated areas. Such issues could contribute to “phishing equilibria” (Akerlof and Shiller, 2016), and we note that regulators must exercise caution about such coordination issues. Keeping these broad principles in mind, we move next to our detailed recommendations. Figure 3.1
Self-reported household preferences The Financial Planning Standards Board India (FPSB), in its submission to the committee, presented statistics on the stated preferences of Indian households, with respect to their savings in physical and financial assets. We collect these statistics in the figure below. The results are based on a survey of CFPCM Practitioners regarding their ranking of drivers influencing household savings. The total sample comprises 12,000 households, surveyed as of September 2016. Figure 3.2
Determinants of financial market participation To explore various explanations for non-participation and mis-allocation of household wealth and liabilities, we propose the following empirical specification:  Here, we index individual households with the subscript i . Y i is our set of dependent variables, capturing investments in different asset classes and holdings of different types of debt. In particular, we focus on the role of real estate, gold and retirement assets, as well as unsecured and non-institutional loans. The group of variables X i collects basic household characteristics: the state of residence, and a rural/urban indicator. The variables Gi allow us to distinguish between different demographic groups - by household income, and the age and education level of the household head. The variables Fi capture the behavioural determinants of household decisions, including the stated trust in financial institutions, the perceptions of risk and return, the access to information, the nature of expenses, as listed on the horizontal axis in the figure below. Except in cases where the variables are not covered by the respective survey, we include all conditioning and behavioural factors in all specifications. We report estimated marginal effects based on estimated coefficient values δ. We repeat the estimation with survey data from three different surveys, to capture different aspects of household behaviour. The sources of the data are the 2014 wave of the ICE 360 national household survey (dark blue bars), the 2015 wave of the Financial Inclusion Insights survey (green bars), and the 2015 wave of the Finscope survey (light blue bars). The vertical bars indicate 95% confidence intervals, based on robust standard errors. 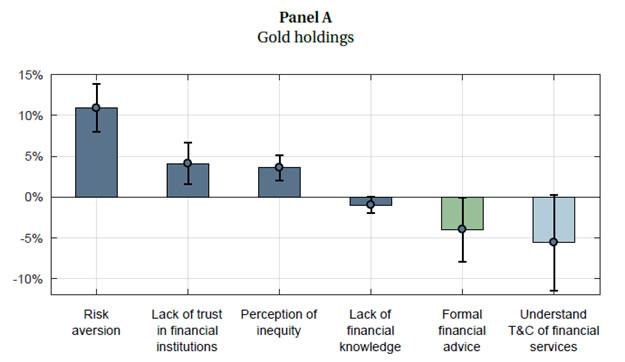 Figure 3.2
Determinants of financial market participation
Table 3.1
Financial capabilities In Panel A of this table, we report the shares of the population that give correct answers to a set of questions related to their financial literacy. The source of the data for India is the Financial Inclusion Insights Survey, Wave 3 (2015). We calculate population averages using frequency weights, as reported by the surveying institution. In Panel B, we report the same numbers for different countries, obtained from Hastings et al. (2013). The source of the data is the DHS (2010) for the Netherlands, SAVE (2009) for Germany, NFCS (2007) for Indonesia, HRS (2010) for the United States, SLPS (2010) for Japan, EPS (2012) for Chile and EERA (2010) for Mexico. Panel A
India | | Question | Correct | False | Don’t Know | | Basic Numeracy | Imagine you have 100 Rupees. Somebody gave you 20 Rupees. How much total money will you have? | 95.1% | 1.8% | 3.1% | | Imagine you have 100 Rupees and you have to divide it among 5 people. How much money will each person receive if you divide it equally? | 90.3% | 3.6% | 6.1% | | Compound Interest | | | | | | Savings | Imagine you have 100 Rupees in your savings account. Your account is earning 2% interest every year. How much money will you have on your account in 5 years if you do not withdraw anything during that period? | 69.1% | 11.3% | 19.6% | | Loans | Now, imagine you took a loan of 100 Rupees for 1 year and you have to pay an interest of 2% each month until you fully repay it. How much total money will you have to repay in 1 full year (12 months)? | 65.7% | 11.4% | 23.0% | Panel B
International comparison | Compound Interest | | Savings | | | Correct | False | Don’t Know | | India | 69% | 11% | 20% | | Netherlands | 85% | 6% | 9% | | Germany | 82% | 7% | 11% | | Indonesia | 78% | 7% | 15% | | United States | 71% | 25% | 4% | | Japan | 71% | 16% | 13% | | Chile | 45% | 41% | 14% | | Mexico | 45% | 53% | 2% | Table 3.2
Financial advice In this table, we report the shares of the population that obtain financial advice from different sources. The source of the data for India is the Financial Inclusion Insights Survey, Wave 3 (2015). We calculate population averages using frequency weights, as reported by the surveying institution. | What or who do you depend the most for a financial advice? | | Spouse | 40.5% | | Myself only | 30.4% | | Friends, family, and neighbours | 25.1% | | Bank/financial institution | 1.4% | | Informal savings/lending groups | 0.2% | | Radio | 0.1% | | TV | 0.1% | | Religious institutes | 0.1% | | Insurance company | 0.1% | | Other | 2.3% | Table 3.3
Frequency of Pay for KGFS Customers This table presents the shares of customers in the Kshetriya Grameen Financial Services (KGFS) administrative data who report their income with a daily, weekly and monthly frequency, while being advised on financial products by the firm. Nearly half of the customers in 2015 report their income on daily wage terms and at least a third of the customer base has always been households with daily wages. | Frequency of Pay for KGFS Customers | | | Daily | Weekly | Monthly | | 2012 | 29.9% | 0.3% | 69.8% | | 2013 | 38.0% | 0.5% | 61.5% | | 2014 | 48.0% | 0.7% | 51.3% | | 2015 | 49.2% | 1.0% | 49.8% | Table 3.4
Financial Goals of KGFS Customers Customers of Kshetriya Grameen Financial Services (KGFS) are asked to indicate their financial goals, as well as the amounts that they need to save in order to reach those goals. We calculate ratios between these sums and the yearly household income, for each household. In the table below, we report the average ratios, for five different income quintiles. | Income Quintiles | | | 1 | 2 | 3 | 4 | 5 | | Education | 0.76 | 0.31 | 0.24 | 0.15 | 0.07 | | Private business | 0.55 | 0.34 | 0.27 | 0.26 | 0.15 | | House purchase | 1.16 | 0.75 | 0.47 | 0.41 | 0.23 | | Marriage | 1.17 | 0.58 | 0.40 | 0.27 | 0.15 | | Other life events | 0.48 | 0.29 | 0.08 | 0.19 | 0.07 | | Loan repayment | 0.65 | 0.10 | 0.01 | 0.07 | 0.02 | ________________________________
CHAPTER 4
RECOMMENDATIONS This chapter presents the recommendations of this committee. • Sector specific recommendations: – Mortgages and credit. – Insurance. – Pensions and annuities. – Gold. – Improving household finance data. • Providing sensible, integrated financial advice. • Leveraging technology to reduce household transactions costs. – A framework for data privacy. • A suite of simple, customised, financial products with a default “opt-out” structure. • Regulatory sandbox – a safe space for regulators and firms to conduct field tests of innovative products and financial service delivery mechanisms. Point (iv) on the ToR directs the committee to evaluate the design of new systems, and the redesign of existing systems of incentives and regulations to encourage and enable better participation by Indian households in formal financial markets. Point (v) directs us to assess the role of new financial technologies in providing high-quality, suitable financial products to Indian households. In this chapter, we detail our policy recommendations in response to these items on the ToR. The promise and peril of technology Our earlier investigation and evidence in response to the other items on the ToR suggest that to enable better household finance outcomes in India, we require solutions that are simultaneously customised and scalable. This committee believes that technological solutions hold great promise to provide solutions which address these twin imperatives. We therefore suggest a number of uses of technology to address specific problems in Indian household finance. However, technological evangelism needs to be tempered with several sobering realities. To begin with, we note that the existing regulatory framework in India (and indeed in most countries) is not specifically designed to address numerous challenges that arise with the pace of technological innovation in financial services provision. Had invested in mutual funds in early 2000 in few mutual funds. Now, that the funds have done well and I wish to withdraw my money, I have to update my PAN and KYC in AMC records. But there are no service locations nearby. Also, Registrar and Transfer Agents are different for different AMCs. Wish there were “ATM” like common service points for even financial products.”
________________________________
Woman, Retired public sector employee A natural example of the pace of innovation outstripping changes in existing institutions in the household finance context is concerns arising about data privacy violations, which co-exist with the undoubted benefits of household-specific financial product customisation based on households sharing personal data with finance companies. We did consider this particular issue, and propose an enabling framework in what follows. We also briefly discuss the fact that new machine learning techniques lead can lead to producer average variable costs dropping as producers scale up by acquiring more customer data – which in turn leads to broader questions about competition and regulating natural monopolies in household finance. That having been said, the big issues surrounding the promise and peril of technology more broadly are outside our household finance mandate. While there are many aspects of this about which we must remain silent, we note that regulators and legislators would do well to think deeply about the broader questions and put in place an enabling framework that attempts to harness the great benefits of technology whilst containing the associated risks. The interaction of technology and economic incentives, and “old-fashioned” solutions A related issue is that technology is likely to be highly beneficial in economic environments in which incentives are well-aligned, but can pose risks in economic environments in which incentives are skewed. In other words, there are interaction effects between technology and the state of economic incentives which can affect the level of social welfare gains. By way of analogy, turbochargers allow internal combustion engines to deliver greater power more efficiently, thus enabling cars to travel significantly faster. However, it is sensible to check the wheel alignment of one’s car before firing up the recently fitted turbocharger, because the combination of imperfect wheel alignment and the advanced technology would greatly increase the driver’s risk, eliminating or even reversing the expected benefit of the increase in speed. We therefore begin our set of recommendations with a set of “old-fashioned” sector-specific proposals in order to address inadequacies in a number of household financial markets. In particular, our sector-specific proposals include measures towards a more efficient mortgage market, amending regulations in the annuities market and distribution fees for the national pension system (NPS), streamlining distribution incentives for insurance products, and discussing several issues with regards to the market for gold. We then conclude this subsection with a set of proposed changes to how financial advice is dispensed in India, suggesting a set of standardised norms across regulators for advice on different financial products, with a fiduciary standard for financial advisors. Transactions costs and electronic Know Your Customer (e-KYC) We then move into recommendations which attempt to harness recent developments in financial technology to solve problems in Indian household finance. As we saw earlier, one significant impediment to the take-up of financial products is that Indian households face onerous transactions costs. These transactions costs are not only monetary costs such as stamp duty and bid-ask spreads, but also include informal costs such as filling in forms, bureaucratic impediments such as certification and verification costs, costs arising from any uncertainty in knowing when approvals will happen, and psychological costs such as the opportunity costs of time. We note that such costs disproportionately affect the least well-off in society, both because income-generation time is more valuable to individuals that are close to subsistence, and because the costs of facing bureaucracy can be magnified when households are less literate or numerate, causing feelings of shame, and potentially leading to the possibility of exploitation. To reduce such transaction costs, therefore, we propose the streamlining of know-your-customer requirements into purely electronic (paperless) form, i.e., the further development of e-KYC, steps to eliminate human intermediation which will ultimately lead to digital end-to-end distribution and seamless product switching, and measures to improve recent regulatory innovations in collateralised lending and account aggregation to generate a common set of standards that will ultimately better enable the provision of financial services to households. Basic household finance “kit” Alongside these measures for e-KYC, we discuss the value of equipping Indian households with a basic minimum set of financial products which address some of the gaps we detect in the earlier chapters of this report. These products, which include a simple no-frills account, simple term life insurance, automatically triggered catastrophe insurance, a basic NPS account for pensions, and access to institutionally-provided unsecured debt could be made easily available to households, either “seeded” automatically at the point of PMJDY account opening (or added later to PMJDY accounts as a default but “opt-out” option), or made available to households at the point of e-KYC. The idea is for households to have access to a range of such simple financial products by default, but require either explicit opt-ins, or explicit education (e.g., a requirement to view a video about product features), or both, for access to more sophisticated and complex products. We also discuss the possibility of better-designed products which are not currently widely available, including automatic debiting of government benefits to maturity-linked accounts, flexible fixed deposit accounts, and revamping current reverse mortgage arrangements which have not been particularly popular. Apart from their immediate benefits to households, we also believe that households’ positive experiences with such products could improve future household perceptions about using financial markets to serve their objectives. Data privacy It is worth noting that all financial technology solutions require the use of Indian households’ personal information, a form of wealth in itself. There has been a great deal of speculation about the promise of leveraging such “data wealth” in order to achieve better financial outcomes. However there is one obvious risk, which has also been debated extensively. In most countries, even if household data are capable of being collected and processed, existing privacy and data protection regulations restrict the extent to which data are available for both transactional and research purposes. The exception to this general rule seems to be the Scandinavian countries of Denmark, Norway and Sweden where vast amounts of granular household data is readily available. An analysis of the data protection regulations in those countries does not seem to indicate the existence of a more liberal approach on matters pertaining to personal privacy. Instead, it appears that confidence in State capacity to ensure privacy protection and trust in enforcement mechanisms inherent in the existing law offers enough safeguards to ensure the availability of large volumes of useable household data. In contrast, India lacks a formal legal framework for data protection. We therefore briefly discuss a potentially valuable new lens through which to consider the data privacy issue, considering the potential of a rights-based approach, which stands in contrast to the more standard consent-based approach that is widely prevalent. Regulatory sandbox Finally, we recognise that many of the impediments to the implementation of financial technology solutions cannot be foreseen at this stage, and we also recognise the need for regulators to carefully consider their decisions about rules for this emerging sector because of the possibility of rapid take-up of new products which may have unpalatable outcomes for households. Conversely, the regulatory uncertainty faced by entrepreneurs may restrict them from contemplating new and potentially valuable investments in financial technology, which could greatly benefit Indian households. We therefore advocate the creation of a Regulatory Sandbox, which is a “safe space” for interactions for interaction between regulators and the financial technology industry. The goal is to enable the delivery of relevant, customised, and scalable financial products to Indian households, whilst containing risks to the financial system. We outline this recommendation in some detail, providing a blueprint for the establishment of such an institution. 4.1 Sector-specific recommendations HIGHLIGHTS • Mortgages and collateralised loans. – Real-time reset of floating interest rates, common quoting conventions. – Mortgage tax exemptions and deductions. – Affordable housing and indexation of PSL-conformable loan limit. – Reverse mortgages. – Creation and access to mortgage data for better product design. – CERSAI. • Pensions and annuities. – Micro-pensions scheme. – Annuities. – Management fee regulations on NPS. • Insurance – New products. – Health insurance. – Public health data. – Awareness campaigns. – Rationalising distribution incentives. – Claims and redress. • Gold – Gold savings certificates. * Certificate as collateral, including fungibility with ornament rental. * Default matrilineal transferability of certificates. – Gold exchange and gold registry. • Improving household finance data. Mortgages and collateralised loans Real-time reset of floating interest rates, common quotation conventions The Base Rate system was introduced by the RBI in July, 2010, in order to ensure that the banks do not lend below a certain benchmark. However, the Base Rate system has now been replaced by the Marginal Cost of Funds (based) Lending Rate (MCLR). The MCLR has been effective since April 1, 2016. The MCLR comprises (a) marginal cost of funds, (b) negative carry on account of CRR, (c) operating costs, and (d) tenor premium. Banks in India are allowed to determine their actual lending rates by including an incremental spread over and above the MCLR. The spread must be the result of a board-approved policy, which also requires specifying the components of spread that are charged to a customer. The marginal cost of funds component of MCLR comprises the marginal cost of borrowings and return on networth. Any change in key reference rates such as the repo rate, brings about changes in the marginal cost of funds and affects the MCLR. Furthermore, the MCLR is a tenor-based benchmark instead of a single rate, and different banks have used different tenors to specify their benchmarks for home loans (6-month MCLR, or 1- year MCLR, for example). Moreover, banks currently have the right to specify interest reset dates on their floating-rate loans with the option to offer loans with reset dates linked either to the date of first disbursement of the loan, or to the date of review of MCLR. The MCLR prevailing on the date of first disbursement (whether partial or full) remains applicable till the next reset date, irrespective of the changes in the benchmark during the interim period. However, the periodicity of the reset is 1 year or lower (i.e., the exact periodicity of the interest is contractually decided under the loan contract). For example, if the reset period is set to 1 year, and the repo rate comes down within 6 months, the loan rate would not change until the reset period is complete. This is different from the earlier Base Rate system where the floating interest rates moved in tandem with policy rates set by the RBI. These features of the market create a number of issues. First, the fact that banks have their choice of tenor for floating rate loans means that easily comparing loans across banks is rendered difficult for consumers. Second, the fact that banks can determine their reset periods and that reset periods can vary across contracts additionally complicates comparisons for customers, and may dampen the monetary transmission mechanism. Third, the fact that MCLR rates can vary across banks means that the same repo-rate shift by the RBI translates into different MCLR shifts for different borrowers depending on the bank from which they took their loan. The committee therefore recommends the following steps: • Banks should quote loans to customers using the RBI repo rate rather than based on their own MCLR rates. That is, to facilitate ease of comparison for prospective borrowers at the point of purchase, every floating-rate home loan should be quoted to prospective borrowers in the form of a market-wide standardised rate + spread as opposed to MCLR + spread. For example, RBI repo rate + spread is standardised because the repo rate does not vary across banks (in contrast with the MCLR, which does vary across banks). Moving to a standardised rate + spread quoting convention would thus provide prospective borrowers with an immediate and useful benchmark for cross-product comparison.1 • All banks should use the same reset period, which should be one month. Under the current system, in effect, floating rate loans have a fixation period of roughly one year. This may impede the monetary transmission mechanism, and not allow borrowers to immediately benefit from interest rate drops. Thus, if the bank decides to link home loans to the one-year MCLR, it should pass through any changes in the one-year MCLR rate to borrowers every month. And if the bank decides to link home loans to the six-month MCLR, it should pass through any changes in the six-month MCLR rate to borrowers every month. The committee recommends that this reset period for floating rate loans is no longer part of the “terms of the loan contract”, but instead, that it is standardised across contracts issued by all banks. • For fixed-rate loans, we also recommend that quoting conventions be changed, so that banks quote the rate for every fixation period relative to the repo rate. While the borrower still has to compare the rate for the appropriate fixation period across banks, the universal quoting convention should facilitate easy comparison both along this dimension, as well as across fixed and floating-rate loans. Mortgage tax exemptions/deductions Under the Income Tax Act, 1961 (IT Act), different deductions have been provided for loans and interest on loans. As per Section 24(b) of the IT Act, subject to the terms of the provision, income chargeable under the head “income from house property” shall be computed after deducting ₹2,00,000 (on the interest payable on such capital) in case of property acquired or constructed with borrowed capital and such acquisition or construction is completed within 5 years from the end of the financial year in which such capital was borrowed. In contrast, as per Section 80C(2)(xviii) of the IT Act, read with Section 80C(1), subject to the terms of the provision, a deduction of ₹1,50,000 in computing total income of an assessee, is allowed on a payment made towards any instalment or part payment or repayment of an amount borrowed and due in respect of the residential house property or on the payment of stamp duty, registration fee and other expenses for the purpose of transfer of such house property to assessee. Additionally, per Section 80EE of the IT Act, in computing the total income of an assessee, subject to compliance with certain provisions set out below, interest payable on loan taken by the assessee from any financial institution for the purpose of acquisition of a residential property shall be deducted (subject to a cap of ₹50,000). The deduction under Section 80EE, IT Act, is subject to a number of conditions.2 In addition, there are also certain provisions in the IT Act which provide for deductions on the capital gains made on the sale of property under certain conditions – in particular, that the proceeds should be rolled into another property or fixed investment through a corporation.3 These tax exemptions appear to a) incentivise the ownership of property for asset holdings purposes (item 1. above), and b) only provide tax deductions if the proceeds of sales of a property are rolled into another property or fixed investment. In light of our findings in the previous chapters which show that Indian household portfolios are excessively concentrated in real estate, and in view of the finding that reallocating such investments towards financial assets will likely generate financial gains, we advocate removal of the tax exemption for income from house property, i.e., elimination of the benefit in item 1. above. We also recommend that the tax exemption which provide for deductions on the capital gains made on the sale of residential property (item 2. above) not be tied specifically to re-investment in the property sector. This should allow households that wish to sell real estate and move the proceeds into financial assets greater incentives to do so. However, as there are potentially considerable benefits to home ownership, especially for first-time buyers, we propose that there be some incentives provided to first-time home buyers. In particular, we advocate; • The creation of a mortgage interest tax deduction only for first-time buyers, and up to a certain (indexed) threshold, which corresponds to loan sizes that are at or below the conforming priority sector loan (PSL) limit (which we propose below, to be indexed to house prices), and potentially higher. Indexation of PSL conformable loan limit Currently, the set of loan sizes that qualify as priority-sector lending (PSL) is set as a numerical threshold. This value is relatively infrequently reset. As a result, as house prices rise, the PSL-qualifying rupee value buys less and less in terms of a real property. As a result, lenders are forced to lend sizes far smaller than they might prefer, as the PSL norm is a quantity restriction on lending – which in turn leads to increased delinquencies for those receiving these loans at times when the rupee value of the PSL threshold has not been sufficiently adjusted and prices have been rising. This finding is well-documented in Campbell, Ramadorai, and Ranish (2015). To avoid this scenario, • The committee recommends that the PSL-conforming home loan limit be set in a fashion that is indexed to the prevailing level of house prices. To be more concrete, we propose that the PSL-conforming limit for any home loan be set as a fixed percentage of the level of the NHB Residex value closest in geographical distance to the site of the property being purchased. Creation and access to mortgage data for monitoring household welfare and financial stability The committee notes that there is a lack of readily available granular data on housing loans, such as information on demographics of borrowers, loans outstanding, delinquency behaviour, loan sizes, and product segmentation (i.e., whether loans are against property, part of a scheme, or taken for the purposes of home improvement etc.). • The committee recommends that such granular loan-level data, along with details of loan status be mandatorily provided by banks and NBFCs to the RBI in a prescribed format, so that the RBI can better monitor both household welfare and market stability. We note that banks currently report aggregated information on a quarterly basis under BSR-1. We recommend that this be expanded and made more granular to permit additional monitoring of household welfare, and to expand the remit to additionally include NBFCs. • We recommend that from these submissions by mortgage lenders, a systematic common data source on mortgage markets can be created alongside the National Housing Bank’s recent efforts at creating price indices across various cities in India. CERSAI and other issues with collateral The Insolvency and Bankruptcy Code, 2016 (“Bankruptcy Code”) has brought about significant changes to the present legal framework pertaining to insolvency laws applicable to both individuals and bodies corporate. Further to this, the Enforcement of Security Interests and Recovery of Debt Laws and Miscellaneous Provisions (Amendment) Act, 2016 (“Amendment Act”) has also been passed which brings about a number of amendments to the SARFAESI Act and the RD Act. It introduces a central registry system where security interests with respect to secured debt shall be registered, which is essentially the Central Registry of Securitisation Asset Reconstruction and Security Interest (CERSAI). In theory, this registry should help in better information dissemination with regard to creation of security over assets of borrowers. However, the committee understands that CERSAI is not functioning as well as it should. The current form is long and requires around 200 input fields. Furthermore, these forms are not standardised across different types of collateral. Currently the form is not possible to auto-fill in the case of existing securities registered on CERSAI – thus creating duplication of effort. In line with the principles that govern this committee’s thinking about simplifying procedures and enabling financialization, the committee recommends that the processes that involve non-standardised digital interfaces such as CERSAI require recalibration with a view to minimising the time and cost of regulatory compliance. One important benefit of standardisation of processes and data entry in collateralization registers is that it promotes a wider range of potential sources of collateral. This is important, since one of the reasons that households in India appear to rely on gold is precisely because it serves as a relatively universally accepted form of collateral (albeit at a high haircut of roughly 25% on average, from a submission to the committee). Moreover, the committee also notes that SARFAESI is currently not applicable to loan sizes below ₹1,00,00,000. The recovery process under the SARFAESI and RD Act is substantially shorter than the debt recovery procedure before the Tribunal. This means that access to collateral in the event of default on smaller obligations is currently very onerous. While the thinking behind this exemption may have been to provide avenues for recourse to smaller borrowers, the committee notes that the likeliest alternative state of affairs is that legitimate collateralised lenders refuse to lend to small borrowers, leading in turn to a greater reliance on non-institutional sources of debt such as moneylenders. • The committee therefore recommends that SARFAESI provisions be made applicable to smaller loan sizes in an attempt to bring “underground” collateralised lending into the mainstream. The committee also notes that in the future, other key considerations in developing collateralised lending is what aspects of legislation need to be changed in order to allow digital transfer of titles for collateral, the deepening of corporate bonds and securities markets for securitisation, and whether the presently required physical NACH form for enabling repayment can be digitised. Several related issues find mention in our discussion of the enabling role of technology below. Finally, the committee notes that the take up of reverse mortgages, which should in theory be quite high given the evidence we have seen on high holdings of real estate at older ages, is actually extremely low in India. This may very well be due to the difficulties of seizing and recording collateral. Measures to improve easy collateralization and recovery of collateral in the event of default should also translate into better outcomes for this important product. Pensions and annuities Micro-pensions scheme Implementing a robust pension system that caters to the entire Indian population and not just those in the organized sector requires fresh thinking about the use of digital solutions and innovative practices on the frequency and timing of contributions to pensions by households in India. The need for an end-to-end digital solution to reach the unorganised sector of the economy can hardly be exaggerated. Mass-scale voluntary micro pensions demands customisation and scalability and the committee believes that fintech solutions to enable such products to be sold in the market is critical to improving pension penetration in India. • To this end, the committee recommends that the PFRDA issue regulations to enable a fully digital end-to-end applications for pension products and also authorise Aadhaar-enabled enrolment for this process. • A broad-based sustained innovative campaign to illustrate the importance of pension holdings is necessary to make most of the Indian population recognise the importance and relevance of pensions and break deep-seated cultural preferences of relying on the next generation to support the elderly – which inherently is a sub-optimal arrangement both at the household level and on the aggregate for the macroeconomy. Regulating annuities The committee believes that annuitisation is a potentially useful pensions strategy, because it can serve to hedge households from longevity risk, and provide financial security in the form of a guaranteed income stream until the death of the annuity holder. However, annuity products do not account for a high proportion of the Indian insurance business. In FY 2015, a little over 17% of the total investment made by insurance companies in India was on account of annuities compared with 16% for unit-linked funds and 67% for life insurance funds. In order to encourage the annuity industry, the government in the 2016-17 budget has reduced single premium annuity scheme service taxes from 3.5% to 1.4% of the premium charged, and has exempted annuities provided to NPS holders from service tax altogether. Currently, the NPS is in part a deferred variable annuity product because of the mandatory annuitization of a portion of the investment corpus. The product has several excellent features, including the fact that the household can choose the annuity provider at the point of retirement. In contrast, in a life insurance pension plan, one needs to buy an annuity from the same life insurance company. Another issue for the annuity industry, and indeed for the insurance industry as a whole is the lack of liquidity in long-term index linked bonds and other long-term fixed income securities in the Indian capital markets. • This committee is of the view that households should be allowed the choice to shop for the best annuity plan, and we recommend segregating annuity investment from insurance investment. • As with other committees of the past, this committee also recommends measures to improve liquidity in these markets to provide an impetus to the insurance industry. We also suggest that in the short-run, until such time as these markets are better developed, there is a need to relax the investment guidelines of annuity funds so that they have more flexibility to optimise their portfolios. • The committee also believes there should be increased transparency in the Indian annuity market in terms of expenses, commissions, annual fees and surrender charges, which could reduce payouts to households. Moreover, a more focused regulatory mechanism would benefit this market. Management fee regulations on NPS As highlighted in Chapter 3, the committee believes that the correct balance should be struck between on the one hand incentivising the supply side to innovate and promote financial products, and on the other hand, preventing households from predatory pricing schemes. We believe that NPS is an excellent product offering, but that the pension fund management company is allowed to charge very low management fees in comparison to similar systems in other parts of the world. For instance, the UK’s national employment savings trust charges a one-time initial contribution charge (a distribution fee paid to an intermediary and not to the company) of 1.80% with an annual management fee of 0.30% per annum. These numbers can be compared to 0.25% and up to 0.10% per annum for the NPS system in India, respectively. This low cap on charges potentially hurts consumer welfare, since distribution incentives may not be sufficient to enable households to fully benefit from the product – this is evident from Chapters 1 and 2 of this report, in which we note that Indian households are woefully under-pensioned relative to their counterparts in other countries around the world. At such a price point, the commission understands from submissions that fund management companies can break even only with a large asset base which requires significant investments into distribution architectures which do not currently exist in India. While India’s NPS charges may indeed be the long-run equilibrium price for distribution and fund management, there may be a need to converge towards these low prices more gradually, as prescribed by the PFRDA. Similarly, additional steps for enabling NPS to reach more widely may also be considered. • The committee recommends that this issue of raising the cap on management fees be investigated, perhaps using the proposed Regulatory Sandbox as a vehicle for doing so. • The pension fund management company could be permitted to conduct functions relating to the sales and marketing of NPS, potentially relaxing the mandatory requirement that only point of presence (POP) entities can engage in sales. • Digital marketing of pension plans could also be allowed by pension fund management companies. • Mandatory research capabilities that are separate from parent financial institutions may be cost inefficient, and eventually passed through to pensioners in the form of lower returns. Firms could be allowed to perform the essential function of research in ways that are cost effective for them. Insurance New Products As we have seen, Indian households invest far less in insurance than their counterparts in other countries. Moreover, we have noted that this lack of insurance is also related to the incidence of high-cost non-institutional source debt, and through our counterfactual empirical analysis, have uncovered that Indian households are paying a high price for eschewing insurance products. We therefore provide a number of product suggestions below, which can either be implemented using “opt-out” nudges at the point of PMJDY account seeding, or available as part of a set of pre-qualified products at the point of e-KYC. These policies can be underwritten by a range of private issuers, but will be strictly regulated to ensure that claims are efficiently and fairly settled, and that premiums are fairly priced. Given that these products will be sold on platforms such as PMJDY and enabled by e-KYC, we propose that distribution and sales commissions for these products be at minimal levels. • Low-cost home and contents insurance: We propose a simplified and cost effective insurance policy for Indian households, which can cover the structure and contents of the household, at a very low monthly premium. • Suhana Safar policy: We propose a low-cost travel insurance plan for senior citizens, including a coverage of personal accident, medical treatment, baggage insurance, and transfer of mortal remains. • We propose low-cost catastrophe insurance, which should be made low cost and potentially even mandatory when purchasing properties in zones that are at high-risk of floods, cyclones, or other natural disasters. These policies will have a hassle-free claim procedure including auto triggered payouts in the event of catastrophes occurring. Health insurance An array of health insurance schemes exist in India. The PMJJBY and PMSBY are the flagship schemes of the central government, and in the past, schemes such as Aam Aadmi Bima Yojana (2007), Janashree Bima Yojana (2000) and other such initiatives have been implemented. However, the most successful intervention thus far has been the Rashtiya Swasthiya Bima Yojana (RSBY) a health insurance coverage scheme for Below Poverty Line (BPL) families. As of June 2017, 41.3 million BPL individuals have been covered under this scheme and 11.81 million hospitalisation cases have been funded under this programme. Several state-led initiatives have also been made. For example, the Chief Minister’s comprehensive health insurance scheme by the state of Tamil Nadu has also made inroads into this difficult problem. While all these schemes exist, little is known about why usage of health insurance is low overall, and why most households in India borrow to finance medical expenses. This committee proposes that a two-pronged approach be used to address this phenomenon. • We recommend that a wide range of both public and private hospitals should accept these insurance policies as cover, with an appropriate mechanism of claims to be worked out to enable easy access to high quality medical care. • The committee proposes that claims statistics be published in a granular fashion, and that any delay or administrative inefficiency in the financial disbursement to policy claims through hospitals be resolved using digital solutions that also validate the use of policies using digital methods such as Aadhaar. Public health data Designing appropriate health insurance policies requires a robust statistical system that provides timely data on the health status of Indians across all age-groups, including mortality rates by age, gender, and the underlying causes of mortality. Current designs often involve the use of data from the US (a country with robust health data infrastructure) to price insurance contracts, alongside a high risk margin to account for differences in mortality patterns between the US and India, computed using the limited data available in India. India has the necessary legal framework to collect statistics on causes of death through the civil registration system. The Registration of Births and Deaths Act, 1969 provides the necessary legislative framework and has been used subsequently to collect data on medically certified deaths. However, only a limited number of hospitals and limited geographies have been covered by this data. In 2014, as a percent of total registered deaths at the state level, only Goa and Lakshadweep have near total coverage with medical certification of the cause of death, whereas less than 2% of all registered deaths are medically certified in West Bengal, and Jharkhand. In terms of population, less than 30% of registered deaths are medically certified in states with nearly 90% of the Indian population. For instance, no medical institution in Uttar Pradesh – the most populous state in India – is covered by this data source.4 Access to timely information on the state of health in India is critical for several reasons, including the design of better insurance products. • The committee recommends that these issues of data be looked into carefully and remedied. Of course, the committee firmly believes that such data should be made available without violating individual medical privacy statutes, and as such, should be released only at an aggregated but fairly geographically granular level such as the district level at a frequency which is not susceptible to de-anonymization, such as the bi-annual or annual frequency. Awareness Campaign The committee has heard numerous submissions from firms about how Indian households are unaware of the risks inherent in not being insured. • The committee therefore proposes an awareness campaign for the importance of purchasing insurance along the lines of the “Swachh Bharat Abhiyan,” “Jahan Soch, Wahan Shauchalaya,” and other such public health campaigns. Rationalising distribution incentives The following description of the issue of lapsation is excerpted from Padmavathi (2016, CII):5 If an insurance policy has lapsed, the insurer is obliged to pay back the amount to the policyholder only when it has “paid-up value.” Permanent policies acquire paid-up value when premiums under the policy have been paid for at least three years. The paid-up value is proportional to the sum assured in the same proportion as the number of premiums is to the total number of premiums originally payable as per the contract. This paid value is payable on the maturity date or on the death of the life assured, should this take place earlier... The policyholder also has a right to surrender their policy without waiting for the maturity date, but they would receive a certain percentage of the paid-up value - the “surrender value.” If the policy lapses before 3 years have passed, the insurer is not obliged to pay back any amount to the policyholder.” This clear description highlights the importance of not only participation in insurance, but continual reminders that households need to continue to pay into their policies. This is to avoid the risk of a) losing the paid in amount of premium, and b) losing insurance coverage for risks that may ensue after lapsation. Households experiencing such outcomes could also be “turned off” insurance products for long periods, which is particularly harmful given how useful these products are for households, and the high costs that we identified earlier, of potentially having to take on high-cost short-term debt in the event of suffering a health shock whilst uninsured. The persistency ratio measures how long insurance customers actually do fund their policies. A 13th month persistency ratio of 75 means that of the 100 policies sold a year ago, 75 were funded with a second premium payment for the second year, while 25 policies lapsed or were not funded by the policyholders, meaning that they will essentially lose the premiums they paid in. On average the 13th month persistency ratio (reporting from published IRDA statistics) for the insurance industry is 60.68% in 2016, and about 58% on average in the past five years. These persistency numbers are particularly low in the fifth year, i.e., the 61st month of holding a policy. On average, only 28.74% survive at the fifth year mark, and on average 80% of the insurance products that are sold lapse by the end of five years. From a submission to the committee by the Consumer Association of India, it appears that often, households do not understand the impacts of lapsation on their future claims to benefits. Moreover, the committee notes that current distribution incentives in the industry provide for high commissions for agents for initial product sales, but subsequently far lower commissions allowed for renewals of pre-existing policies. This set of financial incentives appears misaligned in the direction of skewing household outcomes towards initial take up of policies, and subsequent lapsation.6 • The combination of these circumstances can lead to poor household outcomes, and so the committee proposes that there is a need to rationalise these incentives surrounding the distribution of insurance products, and in particular we recommend that commissions structures be levelled between initial sale and policy renewal so as to reduce lapsation rates, and to provide agents with appropriate financial incentives to urge households to renew policies so that they can continue to benefit. • The committee also suggests that there should be an effort to rationalise the discrepancy of commissions between different types of products sold, with a view towards incentivising the purchase of simple term insurance products. • The committee suggests that distribution channels should be incentivised to sell good products to those employed in the informal sector as well as in rural areas, but keeping in mind the caveat of rationalising commissions across years and product types. • The committee proposes that disclosures to customers at the point of sale be made simple, accessible, and be easily comprehensible to the consumer. • The committee also reiterates the importance of clamping down on misselling as was done during the case of the ULIP misselling episode. • The committee proposes that further investigation occur into whether low insurance take-up partially arises from tight household budget constraints that do not allow ex-ante purchase of contracts. To the extent that this is true, especially for low income households, the committee suggests that mechanisms for alleviation of these constraints be considered. Claims and Redress The committee has a number of specific suggestions on claims statistics, as well as on the mechanism via which consumers can seek redress. • The committee reiterates that claims statistics should be published by insurance firms in a machine readable (CSV) format, as per the precise layout and recommendations of the Sumit Bose Committee. • The committee proposes that detailed data on the claims performance of individual insurance products (as opposed to broad aggregates by category) should be published periodically (say annually) by insurance companies in a format that is prescribed by the regulator. • The committee proposes that claims data should be differentiated between individual insurance claims and group insurance claims, particularly in health insurance, so that the consumer has a clear sense of the potential benefits arising from the particular type of policy they might be eligible for. • Finally, from a submission to the committee by the Consumer Association of India, the committee proposes if consumers, especially in rural areas, need to seek redress for household finance product issues, that they can do so via delegated representatives rather than having to be physically present. This is currently not possible, as complaints under Section 12(1) (c) of the Indian Consumer Protection Act (CPA) can be instituted only by one or more consumers, as defined in Section 2(1)(d) of the CPA. Therefore, a group of cooperative societies, firms, association or other society cannot file such a complaint unless such society itself is a “consumer” as defined in the aforesaid provision. – We believe this is important for several reasons. First, consumers in rural areas often need to travel long distances in order to file redress claims. The second reason is that even if we were to move to a digital system for the sale and post-sale service of financial products, often consumer groups are in a better position to advocate on behalf of individuals who may face problems assessing complexity or derelictions of service delivery. – Of course, the ideal would be to have a dedicated consumer Financial Redress Agency as laid out in the FSLRC committee report, and the committee supports the creation of such an institution. Gold The committee notes that gold holdings in India appear to be high relative to those observed in other parts of the world, and notes that Indian households can achieve higher rates of return from reallocating some portion of these gold holdings towards financial assets. There are multiple reasons that households hold gold. One possibility is that the high rate of gold holdings is evidence of tax avoidance, or the hiding of illicit proceeds, and we propose steps to address this if so. (We also note here that tax incentives are an extremely strong feature of the Indian environment which appear to “nudge” investors in the direction of particular financial decisions, often in ways which cannot be explained by pure financial optimization motives.) A second possibility is that gold is an easily pledged form of collateral, and we propose solutions along this dimension as well. Third, there may be cultural and behavioural determinants of gold holdings. Finally, there may just be the desire to hold gold for pure consumption rather than investment purposes. If this is the case, the committee notes that there is nothing that can (or should) be done to alter household consumption preferences. Gold savings certificates Recent initiatives by way of issuing sovereign gold bonds are certainly an important step in the right direction in order to reduce physical holdings of gold on household balance sheets if they are holding gold as an investment. However, the widespread acceptance of financial products backed by gold as the underlying asset will require design features that address deep-seated cultural preference of households. As discussed, gold is often used to provide collateral value. We note that sovereign gold bonds are permitted to be pledged by households as collateral when seeking loans, but that this knowledge may not be widespread. • We therefore recommend an awareness campaign to highlight this particular benefit of the product. Another use of gold is that it facilitates wealth transfer across women who are otherwise socially constrained to be financially dependent in the patriarchal setting. • We therefore propose that a variant of the gold bonds currently in operation be introduced, which have default inheritance features that may be attractive for these reasons. In particular, variants of these certificates could be structured such that their inheritance is matrilineal unless the woman has no daughters in which case sons can inherit. • Gold holdings often capture a household desire for asset tangibility. We therefore also propose that a new variant on the RBI sovereign gold bonds currently in circulation be introduced that can be physically redeemed if households wish, and not just redeemed in cash upon maturity. We believe that the very presence of this option of physical redemption, which may not be taken up by households, is likely to increase demand for this product by addressing potential behavioural factors that deter such demand. We note that inflation indexed bonds are a useful instrument for households. As we have seen earlier in this report, some households do appear to hold gold as a response to inflation uncertainty. However we also note that inflation rates and inflation perceptions vary widely across the country. • We note that some of these inflation indexation issues will likely shrink upon the implementation of the GST tax throughout the country. We propose that efforts be made to improve state and municipal bond markets, and that incentives to engage households in these markets be explored, as households could use such local assets to hedge against local risk factors in currently segmented goods markets. We also propose wider publicisation of local inflation indexes in case exchange-traded products can be issued against these indices by private sector participants. • We also propose that tax incentives be offered to investors in inflation-indexed bonds, who currently have to pay income tax on interest earned on these bonds, whereas bond mutual fund investments currently pay capital gains tax after three years. Gold exchange and gold registry • The committee supports the creation of a spot gold exchange, to promote gold market liquidity so that households may more efficiently monetise their gold holdings if they so choose. The creation of the exchange will also facilitate price discovery and standardisation of gold prices, allowing households to better understand the value of their pre-existing gold holdings, and prevent them from either selling or collateralising their holdings at inaccurate or disadvantageous prices. • The committee also notes that gold is a preferred asset for tax evasion purposes. Towards this aim, the committee proposes that the PAN card requirement for gold transactions from jewellers be extended to all transactions, and not just those that are above ₹2,00,000, and supports the daily cash limits against the sale of gold. However the committee cautions that taking a holistic perspective on household balance sheets that these cash limits should be complemented with measures to ensure that unsecured credit is widely available to households at favourable rates in the event of emergencies. • To prevent the PAN requirement from driving gold transactions underground, the committee proposes that all gold transactions should be registered using an electronic registry such as a depository. • The committee also notes that measures in the gold market are unlikely to fully deter tax avoidance motivations for holding the asset. A more incisive use of income tax data may be required to detect tax avoidance, and the committee believes that the enforcement of tax avoidance should be strict. Improving household finance data The committee notes that since the first round of the NSSO surveys in 1971-72 (and the Reserve Bank of India surveys in 1951-52 and 1961-62), Indian households’ engagement with financial markets has changed considerably, coinciding with the rapid growth in the number of middle-income households over the past few decades. Households have access to more instruments, as the availability of formal sources of finance and modes of savings has significantly increased since 1971. As a result of the Indian household financial landscape evolving so rapidly, there is now a case to be made for more frequent household surveys, with the addition of modules to the All India Debt and Investment survey (AIDIS) to aid evidence-based policy making. Appendix E provides more details about our recommendations to improve data gathering on this important topic. 4.2 Providing sensible, integrated financial advice HIGHLIGHTS • Overview and Definitions. • Financial advice: Standardised norms for advice for different financial products. • Separating distribution and advisory businesses. • Fiduciary model for advice, and compensation only by the consumer for the provision of financial advice. • Certification and rating for financial advisors. • Robo-advice. Overview and Definitions The definition of financial advice we propose is as follows: Financial advice is the action of providing personal recommendations to a customer, which can either be initiated by an act of the firm, or by way of a request from a customer. Any situation that involves any of the following set of actions constitutes advice: 1. A personal recommendation, provided in exchange for a fee, is made to a customer to purchase or sell a particular financial product or a set of financial products. 2. A firm or individual consulted by a customer has deemed a product or a suite of products to be suitable to a customer, in exchange for a fee. 3. A customer initiates an action that is in line with the personal recommendation specifically sought from a firm or individual, in exchange for a fee. A financial advisor is a firm or individual who performs the actions above. Alongside defining financial advice, the committee feels that the term “distributor” should also be consistently defined. The definition of a financial distributor we propose is as follows: A Financial distributor is a firm or individual who engages in a financial transaction with a consumer, which is remunerated or compensated by the producer of the financial product by way of a commission, service fee, or any other form of non-monetary remuneration. Financial advice: Standardised norms We believe that the provision of financial advice should be regulated in a unified manner consistent with other established professions, such as medicine, law and accounting. A collaborative effort is required in this regard in which governments set expectations for the practice of financial advisory, market integrity, and consumer protection, and regulators in consultation with professional bodies determine professional norms, conduct monitoring, and impose minimum certification standards. We also note here that financial literacy efforts should supplement responsible financial advisory businesses. In the current scenario, Indian households are unable to differentiate between the titles of “Investment Advisor”, “Independent Financial Advisor”, or even “Insurance Advisor”. We propose that clear nomenclature with uniform rules should apply to all providers of financial advice regardless of their specialisation. The immediate need is to deal with regulatory arbitrage which is now a possibility given that there are differences between the regulation of financial advice depending on the regulator dealing with the underlying product. That is to say, PFRDA, IRDA, and SEBI all have differing definitions of advice, and regulations for the provision of advice. • We therefore propose that there should be uniformity in definition, the unification of consumer protection, and the application of equally stringent standards across regulators and underlying financial products. • We propose the creation of a unique “license number” for financial advisors to replace the diversity of current registrations such as the ARN, RIA, RA, and EUIN number. An SRO-driven regulatory system for financial advisors across all products will use this unified identification number. • We propose that regulation should be uniform across advisors, rather than based on the specific sectors or products that advisors sell, so as to enable advice to households about their entire balance sheets. We therefore propose common regulation of financial advisors across all products, and support the Swarup Committee suggestion of an SRO-driven regulatory system for financial advisors in the medium term. • We propose that insurance intermediaries be brought under these uniform advisory regulations, and that advisory and distribution functions should be effectively segregated. – This is also an issue in the provision of investment advice by distributors of mutual fund products, and we propose that they also be brought under the ambit of uniform advisory regulations. – In general, we oppose the use of exemptions, and propose a uniform structure under which all investment advice is brought, regardless of the specific product or function to which this advice pertains. • In order to make financial advisors, investors and other stakeholder understand the rules and regulations governing investment advisory activities and to further ease of doing business by investors, rules and regulations should be simple, self-explanatory and easy. • Information about financial advisors and their standards of professional competence should be made available online. Forms, compliance reports, and payments should be digital and easily accessible. • Regulations need to be supplemented with adequate monitoring mechanism, including inspection, reporting and analysis by regulators for taking appropriate and timely enforcement actions. We therefore propose that any investment advisor which is a body corporate or a partnership firm shall appoint a compliance officer who shall be responsible for monitoring compliance by the investment advisor, and that swift action should be taken against unregistered/ non-compliant/ errant advisors. This would add substantially to the credibility of the investment advisory business itself and help its orderly development and market growth. Separating distribution and advisory businesses • We propose that advice and sales of financial products be separated, supported by a fiduciary standard. – We note that this is not the current structure of the finance industry and propose that this transition be phased in. We propose that the first step in this direction is the convergence of advisory activities across products and regulatory jurisdictions. This is to be followed by a rationalisation in fees/commission across financial products such that sellers are indifferent between similarly placed financial products. • We propose that all transactions be made in electronic form with a pre-determined sunset clause on cash transactions. • We propose that there be transparency about compensation structures to the households receiving advice. Commissions and incentives paid to distributors (both incremental and cumulative) should be included in every statement sent to investors. RBI’s directive that banks create subsidiaries for investment advisory services and register with SEBI could be used as a yardstick in this context. • We also propose that in the short-term, every investment should have two tags, namely, a distributor code and an advisor code with uniform nomenclature which is self-explanatory across all financial products. We propose that RBI immediately (rather than after 3 years) requires banks to have a separate entity to sell products. Fiduciary model for advice • We propose that an investment advisor shall act in a fiduciary capacity towards its clients and shall disclose all conflicts of interests as and when they arise. The fiduciary duty of the investment advisor towards the client may be defined clearly in the regulations. An investment advisor shall ensure that in case of any conflict of interest of the investment advisory activities with other activities, such conflict of interest shall be disclosed to the client immediately. Certification and Rating of Advisors • We propose harmonisation of standards for the provision of advice. We propose the creation of a uniform professional qualification and certification of investment advisors that covers multiple financial products – since we take an integrated view of the household. Any additional specialisation in specific financial products sought by advisors also needs to be standardised with inputs from the respective regulator. • We also propose that continuous professional education and certification be made mandatory for financial advisors. • In order to expand the number of advisors and to ensure their professional competence, we propose replacing a minimum experience requirement with a relevant certification requirement for registration as a financial advisor. • In order to help investors take informed decisions on choosing financial advisors, information about financial advisors, including their expertise, business volume, past credentials, and quality of recommendations should be centralised and made available online. In this regard, the committee notes that FPSB has designed a Rating Model for Advisors, which takes into account parameters to assess the quality of services offered, compliance standards, and professional conduct to arrive at scientific grading. The platform on which this would be made available could help financial consumers to choose the right advisor.7 • We propose that consumers who have received advice from an advisor must be able to provide qualitative feedback for public view on the same platform, which we view as a public platform for open rating of financial advisors. We propose that this public platform be jointly managed by RBI, SEBI, PFRDA and IRDA, as a public good under the FSDC Sub-Committee funded through funds reserved for financial development. Based on publicly available information, an annual report on the quality of financial advice should be produced, and we propose that this be reviewed by the FSDC Sub-Committee. Robo-advice • The committee believes that technology can play an important role in cost effective expansion of financial advisory services. To quickly scale up the availability of advice across the country, automated advice is a good strategy subject to the right checks and balances, and the committee supports the continuing development of robo-advisory services. • The committee notes here that different regulatory agencies have not been clear about the legality of providing robo-advice, and so we currently see that the maximum number of such firms are operating in the the context of mutual funds. We therefore propose that all four regulators clarify that robo-advice is permitted, once again subject to the right checks and balances. • We propose that the legal person behind a robo-advice shall be the firm or individual who own and operate such automated advice. If particular financial advisors are responsible for advice given out in automated advice services, each transaction based on such advice must identify the particular advisor involved in each recommendation as well. • The committee also notes that the promise of the RBI’s account aggregator rules have only partially been realized. The committee understands that even though a customer may have given an account aggregator access to their own digital information, financial institutions currently have the right to choose whether or not to share the information with the aggregator. This inhibits scalability at present, since it requires a series of bilateral negotiations with individual financial firms. The committee notes that the payment services directive (PSD2) in Europe allows for a solution that better allows households to benefit from account aggregation, and we recommend that this be amended to facilitate customers having better access to their own financial information. 4.3 Leveraging technology to reduce household transactions costs HIGHLIGHTS • Reducing transaction costs. • eKYC. • Data privacy Reducing transaction costs In order to achieve customised solutions in household finance at scale, both firms and households require that transaction costs of making financial decisions are low. One way to see this how technology can facilitate this is to consider the following example. Consider a financial service provider who can effectively earn roughly 0.5% per transaction conducted by a customer. If on-boarding a customer costs ₹1000, service providers will only reach out to customers who are expected to do 2,00,000 transactions to be able to break even on their on-boarding costs, meaning that they only have incentives to pursue high-wealth or high transaction volume households. This reduces incentives for financial firms to extend the benefits of market participation to lower income or wealth households. However, if there is a change in technology that brings the on-boarding costs down to ₹100, financial firms can then serve customers who will only be expected to do one-tenth of the business, i.e., 20,000 transactions, thus providing incentives to expand participation. My wife handles all the subsidies and loan repayments. She gets messages on her mobile phone about that. I don’t mind if she manages all this on her phones.
________________________________
Man, Garland maker A similar incentive operates for households. If customers can pay lower participation costs using technologies that reduce their time and effort for participation, as well as direct costs of participation, smaller transaction volume or size customers will find it profitable to enter the market. Customisation enabled by these technologies can also help to help bring such customers into the market. So, if a customer can benefit from saving a minimum amount of ₹100 under the new technology (as opposed to ₹1000 under the old technology), household demand for savings products will expand. Box 4 Monetary and non-monetary costs with basic banking: An audit study Despite non-discretionary eligibility rules for basic banking products, financial access outcomes are highly influenced by banks in India. Nearly all banks audited by Mowl and Boudot (2016) refused to market the regulator mandated basic accounts, despite the customers being 'atypically persistent' in demanding the basic products. More than half of the bank branches audited turned customers away when they attempted to negotiate for alternative, and affordable savings products. Nearly half of the customers were also turned away where the bank refused to accept the customer’s valid identity or address proof. | | Initial enquiry
(Visit 1) | Opening account
(Visit 2) | Collecting material
(Visit 3) | All visits | | Time travelling (minutes) | 68.45 (14.63) | 72.33 (15.79) | 71.42 (10.99) | 212.2 | | Cost of travelling (₹) | 21.38 (3.78) | 20.2 (3.27) | 19.85 (3.88) | 61.43 | | Time waiting (minutes) | 7.19 (5.88) | 11.2 (12.84) | 12.92 (12.77) | 31.31 | | Time talking (minutes) | 17.55 (8.57) | 19.46 (13.7) | 22.85 (18.98) | 59.86 | | Time for collecting documents (minutes) | – | 114.67 (133.98) | – | 114.67 | | Cost of documents (₹) | – | 77.13 (15.94) | – | 77.13 | | Time filling in the form (minutes) | – | 19.66 (9.76) | – | 19.66 | | Number of visits | 1 (0.0) | 1.13 (0.35) | 1.21 (0.69) | 3.34 | | Total time (minutes) | 93.19 | 237.32 | | 437.7 | | Total cost (₹) | 21.38 | 97.33 | | 138.56 | | Number of observations | 42 | 15 | | 72 | The table above presents the stylised transaction costs for customers seeking to open a basic bank account. In the initial enquiry, customers spent nearly 1.5 hours and ₹21.38 and in the second visit to open the bank account, customers spent over 3 hours and spent ₹97.33. In the final stage where customers collected materials from the bank after opening an account, the average time spent was about 1.6 hours, with an expenditure of ₹19.85. The total cost, on average, is equivalent to one day of daily earnings for poor households in India, i.e., the product of an entire day’s worth of work. Such transaction costs are very high for the average Indian household. Such frictions add to the cognitive and psychological costs of participating in the formal financial system. Some of these issues may most easily be addressed through technological solutions. | The committee notes that the JAM (Jan Dhan, Aadhaar, and Mobile phone) trinity, as highlighted in the Economic Survey 2015-16, holds promise to reduce the costs of household participation in financial markets, especially since the prevalence of smart phones is rapidly increasing. The committee also notes that there is significant promise in “India Stack” (a set of APIs), in the sense that it could allow governments, businesses, startups and developers to utilise this digital infrastructure to enable better outcomes in Indian household finance. In particular, the possibility that these technologies provide is that a) the costs of on-boarding will be lower, and the creation of new products with widespread reach to Indian households will be made easier, b) customers can digitally and securely access financial services on their mobile phones, reducing their transactions costs, as well as the provider cost of serving customers, c) this enables the creation of assisted technologies, thus not excluding customers who do not have a mobile phone, or are unable to use it to their advantage – it is easy to envision the use of the same technologies to serve customers via banking correspondents or payments banks (as in the Mor committee), with the continued advantages of greater scalability, and lower cost than physically visiting bank branches, and d) the possibility of increased trust as outcomes can more easily be audited on account of digital trails, and the ease of competition associated with lower switching costs. We consider a few specific technological solutions below, beginning with e-KYC. electronic Know Your Customer (e-KYC) • The committee recommends that Aadhaar-enabled eKYC (which is a paperless Know Your Customer (KYC) process, where the subscriber can authorise the UIDAI (electronically, through Aadhaar authentication) to provide a digital identity document to the requesting entity) be firmly established as the acceptable KYC standard. Currently, this process is sufficient to complete KYC norms for most basic financial accounts, and telecom SIM issuance (amongst others). • The committee notes that a major impediment to the widespread adoption of eKYC (from numerous submissions to the committee from financial technology firms) is that there is often significant uncertainty in firms’ interpretation of regulatory standards about electronic verification and settlement, which is partly due to a relatively opaque communications process between firms and regulators. There is such a diversity of opinion across firms that internal regulatory standards vary across firms, in an effort to maintain strict compliance in case the regulator comes calling. – This means that even in cases in which wet signatures are strictly not required, firms enforce this on their customers, leading to onerous costs of compliance faced by households despite the availability of a paperless process. – For example, in the case of micro pensions, i.e., APY, the process is not completely paperless, requiring that registration is a combination of a physical and a digital process (see submission from pinBox Solutions in Appendix Section D). – We therefore propose that the existing set of rules be modified accordingly to enable the paperless process to function seamlessly, and that there be clear guidelines that are well-publicised in order that firms do not feel the need to impose onerous processes on households. • The committee also notes the recent development of the DigiLocker, which is a platform for issuance and verification of documents and certificates in a digital way, thus eliminating the use of physical documents. Indians who sign up for a DigiLocker account get a dedicated cloud storage space that is linked to their Aadhaar (UIDAI) number. Organisations that are registered with DigiLocker can push electronic copies of documents and certificates (e.g. driving license, Voter ID, School certificates) directly into individual lockers. Users can then provide permission, and share these documents with relying institutions. Paperless service delivery is enabled by allowing transactions to be enabled without exchanging paper documents. These are now done through digital documents, which can be executed through digital signatures, and exchanged in an authorised manner through the digital locker. • The committee proposes that the government’s DigiLocker service be extended to nationalised banks, brokers, and insurance companies to be able to issue policies, share certificates, or fixed deposit receipts directly to customers in this fashion, such that they will be able to use these documents to easily obtain credit verification. We also suggest that the process of electronic collateralization will become far easier once the DigiLocker can be used by households to provide evidence of ownership of assets. • The committee also notes that transactions conducted on these platforms leave digital trails, which can be further used to enable additional services to users, and suggests periodic audits of financial transactions conducted digitally to ensure good behavior amongst the service providers. • The committee recommends that the process of switching between financial service providers be made seamless and straightforward for households, and recognises eKYC and portability of KYC as key steps towards such an outcome. Data Privacy While technological solutions to household finance problems hold great promise, the committee notes that there are also potential drawbacks unless information is used responsibly. A major concern in this setting is the privacy protection afforded to households benefiting from access to digital modes of transacting. The worrying fact is that India lacks a formal legal framework for data protection.8 Privacy regulations, to the extent that they exist, remain rudimentary and diffused. There is no formal privacy statute and the closest thing to a formal privacy law is in the rules enacted under Section 43A of the Information Technology Act, 2000 that spell out, in general terms, privacy obligations that apply to anyone who collects and processes sensitive personal data and information. In addition specific provisions exist in various Indian statutes such as the Credit Information Companies (Regulation) Act, 2005 and the Credit Information Companies Regulations 2006, the Indian Telegraph Act, 1885 and The Right to Information Act, 2005, among others. These regulations are, for the most part, minimal, lack formal regulatory and enforcement frameworks and are largely unresponsive to changes in technologies. As the committee recommends pursuing technology-based solutions to household finance problems, we also note that the continued lack of clear privacy regulations presents an ever-increasing risk to personal privacy. Box 5 The case of Atal Pension Yojana Digital solutions to existing schemes can reduce transaction costs and efficiently deliver financial services to households in India. Such process simplification is already occurring, and could be expedited further. As an example, we discuss the onboarding process for the Atal Pension Yojana (APY), and how this has been greatly improved by the use of technology. A stylised illustration of this process simplification is discussed below. Historical process: A client visits her bank Customer Service Provider (CSP), the bank CSP enters customer data and details on a Point of Sale (POS) terminal and collects a physical form. The CSP then visits the link bank branch to submit the form. These forms are vetted and signature verified at the bank branch. The bank debits the first contribution and issues a Permanent Retirement Account Number (PRAN) from a pre-issued set of numbers provided by the Central Record-keeping Agency (CRA). Additionally, the bank registers the Systematic Investment (SI). The branch then couriers the physical application form to the CRA. The customer visits a Business Correspondent (BC) or bank branch to obtain the PRAN. This process is illustrated in Appendix Section D. This process has been considerably simplified, as steps to improve it are continuously implemented. At present, some of the BCs are using hand-held devices for APY registration. New services such as the recently launched eNPS system (https://enps.nsdl.com/eNPS/NationalPensionSystem.html) are also important steps in the direction of digitising the enrolment and contribution process, and the APY service providers have been asked by the regulator to develop APY@eNPS channel features, to make the tool a mainstay in their enrolment procedures. With the necessary digital ecosystem in place, a process that fully minimises the costs of enrolment can be envisioned, as follows: A client provides bank account and Aadhaar number to a Aadhaar enabled Point of Sale (AePOS) CSP. The CSP uses biometrics to authenticate customer ID. A BC platform uses secure API to pull customer data from a bank’s core banking system (CBS) to populate the APY form on AePOS. CSP uses AePOS to debit first APY contribution and the BC uploads a digital form to bank server. The Bank registers an systematic investment on CBS. Bank uses secure APIs provided by CRA to upload digital APY form with SI details and the CRA instantly issues PRAN. AePOS-CSP hands over printout to customer. The CRA sends SMS to customer with PRAN and contribution information. This provides an example of how continuous process simplification could work, creating zero overhead for bank branches, with the CSP eligible for the commission instantly. While online digital solutions already do and will continue to reach a large part of middle-class India, a completely digitised process can help reduce overheads and achieve coverage of the “last mile'. This is illustrated in Appendix Section D. | • Consent is the cornerstone of privacy laws around the world and the use, transfer or processing of personal data is impossible without prior permission. This assumes that the data subject can evaluate whether or not the use, by the data controller, of her personal data is likely to detrimentally affect her privacy. Once consent has been provided, the data controller is free to use the data as it chooses towards the stated purpose. Even if such use results in a breach of personal privacy, the data controller cannot be held liable as it is presumed that the data subject weighed all possible harms and concluded that the benefits outweigh the risks. • Keeping these issues in mind, the committee examined whether the use of consent as the primary line of defence against privacy violation will actually ensure the protection of personal data in the context of modern technologies. We note that technological advances such as machine learning and big data have changed the ways in which we process data and as a result, have made consent a less than effective tool to protect personal privacy. • The committee therefore believes that it is imperative that an alternate system be deployed to ensure that personal privacy is protected. Our current belief is that rather than consent, a robust privacy framework in the modern world may call for a rights-based approach. • Such a rights based system would confer on households (i.e., data subjects, in this context) a set of rights in relation to their personal data. Data controllers (i.e., financial firms, in this context) will be obliged to ensure that whenever they process or otherwise deal with the data pertaining to the data subject they do so without violating the rights of any data subjects. • Data controllers will also be responsible for ensuring accountability, transparency, non-discrimination and data security while processing data. • Data controllers will be held liable for any harm caused to the data subject as a consequence of the breach of their data rights. Where possible, the data controller should be required to either reset the record or to compensate the data subject to the full extent of any loss caused as a result of the breach of a data right. • In order to evaluate whether or not the processing of data by the data controller could result in a breach of data rights, we propose that the law will create a class of technically skilled, learned intermediaries, who, on behalf of data subjects, are authorised to review the algorithms that process personal data to evaluate whether the data is being processed in a privacy neutral manner. • The new privacy framework should contemplate the creation of a Data Commissioner who shall be responsible for redress of grievances as well as for establishment of standards of accountability and transparency. The Commissioner should be responsible for ensuring that these standards are responsive to changes in technology. In addition, the Commissioner should publish annual reports as to the status of privacy compliance in the country. • In Appendix F, we provide further details about our thinking on this new approach to a privacy framework for financial information. 4.4 A suite of simple, customised, financial products HIGHLIGHTS • Simple financial products which constitute an essential minimum kit for households. – Assets: * No-frills savings account with digital access. * Simple target-date fund products for risky asset investment. * Flexible fixed deposit accounts. * Micro-pensions with flexible dates of pay. – Insurance * Simple term life insurance. * Basic health insurance. * Automatically triggered catastrophe insurance in catastrophe-prone areas. – Liabilities * Micro, unsecured credit that offers better terms than moneylenders. * Simple collateralised loans including small home loans. • More sophisticated products that may be useful to households. – Savings: * Small overdraft and savings accounts based on the digital financial footprint of individuals. * Micro-savings products with reminders. * Prize-linked savings mechanisms. – Easily annuitizing land and homes. • Tax-exempt savings vehicle. “Essential kit” financial products In this section, we describe a minimum set of financial products which Indian households should have in order to effectively harness the benefits of formal financial markets. While these products are not an antidote to the problems with Indian households’ financial allocations that we detect in the earlier chapters of this report, they serve as a good working default from which households can subsequently adjust as they grow in experience and financial sophistication. Many of these products already exist, and indeed, are being pushed to households via government programmes such as PMJDY. Nevertheless, we believe that it is useful to provide this list for the following reasons: • It serves as a “checklist” that can be used to evaluate progress on participation and use of household financial markets in India. • Where this is not already the case, the products on this list could be made readily available to households, either “seeded” automatically at the point of PMJDY account opening (or added later to PMJDY accounts as a default but “opt-out” option), or automatically pre-qualifying households to be able to access all of them at the point of e-KYC for any one of them. • While households will have access to the essential minimum “kit” of assets by default, we should require either or both of explicit opt-ins and mandatory education (e.g., a requirement to view a short video describing product features and risks, which is the equivalent of a health warning), of all households before they access more complex products. That is to say, products not on this list could have “speed breakers” associated with their take-up and widespread distribution. This is not to inhibit households from portfolio optimization, but rather, to permit an opportunity for households to reflect before taking decisions to participate and use more complex products. • In some cases, guided by the principles for household finance policy that we outline in the previous chapter, we recommend additional design features that could simplify access or improve use of the current versions of these products which are out in the market. We also discuss the possibility of better-designed products which are not currently widely available, including automatic debiting of government benefits to maturity-linked accounts, flexible fixed deposit accounts, and revamping current reverse mortgage arrangements which have not been particularly popular. Apart from their immediate benefits to households, we also believe that households’ positive experiences with such products could improve future household perceptions about using financial markets to serve their objectives.9 Assets No frills bank account This is already being pushed to households via the PMJDY programme, and has many attractive features including the RuPay debit card, and associated accident insurance. We also support the priority to improve incentives for women to hold such accounts to further the goal of their financial inclusion, and moves to directly transfer government benefits into these accounts. We also suggest that these accounts can be linked to longer maturity accounts such as target date funds or micro-pensions (see below). Simple target date funds Target-date funds are essentially combinations of bond and stock index funds which automatically shift the asset allocation of equities, debt, and cash over the lifetime of the fund as selected by investors. They help to solve the lifecycle asset allocation problem of investors, by being allocated more heavily towards equities early in the life of the fund, and becoming more conservative, shifting these allocations towards bonds and cash as the investor ages towards retirement. Such funds will help to improve retirement outcomes, and provide Indian households with the experience of sensible stock market participation, which is useful for knowledge creation purposes. We recommend that these products have several features including, but not limited to, low fees and costs; no front-end loads; strict indexation to benchmark equity and bond indexes for each component of the fund; the possibility of scaling back the equity component to match the risk appetite of the household; the ability to invest small ticket sizes into the product in a “batched” fashion across households that are investing in order to minimise individual transactions costs of additional investment; and finally penalties for quick liquidation of the funds invested in order to prevent inefficient trading. Micro-pensions Both the Atal Pension Yojana (APY) and National Pension System (NPS) account serve well for this purpose, though we prefer the defined contribution NPS scheme, on balance. As mentioned earlier in Box 5, we recommend radical simplification in the process to enrol in such pensions schemes, and we also recommend that the household be able to access their pension account using a common interface with the other products on this list. Insurance Simple term life insurance A simple term life insurance product that provides a lump-sum in the event of death of a policy holder with no benefit payable should the policy holder be alive at the end of the term. Currently the PMJDY provides a basic form of this insurance at the point of account seeding, with a benefit of ₹30,000. We propose that this be extended in the case in which households wish to contribute more towards such cover via direct debit, with a corresponding (actuarially fair) increase in the benefit. We also propose that the claims procedure be simplified – in many major insurance companies, this is still a “paper” process, and we recommend digitisation and substantial simplification of this process. Basic health insurance The RuPay cards with PMJDY currently have personal accident insurance attached, with a claim limit of ₹1,00,000-₹2,00,000 depending on the type of card. We propose that health insurance in the event of ill-health also be provided using a similar mechanism, with a small sum debited by default from the PMJDY balance as an “opt-out” scheme. The health insurance should be available in terms of cashless treatment in a set of qualifying hospitals up to a pre-prescribed limit in the event of illness, alongside a reasonable level of cover. The scheme should be easy to subscribe, renew, and claim. Automatically triggered catastrophe risk insurance We propose low-cost catastrophe insurance, which we recommend may be mandatorily required when purchasing properties in zones that are at high-risk of floods, cyclones, or other natural disasters. Being uninsured in catastrophe-prone zones imposes negative externalities as the cost of public bail-outs increase in such circumstances. These policies should have a hassle- free claim procedure including auto triggered payouts in the event of catastrophes occurring, such as the cloud burst in Uttarakhand, or floods in Chennai.10 Liabilities Micro unsecured loans We recommend that unsecured loans be provided to qualifying households, in amounts under ₹30,000. Currently PMJDY provides access to an overdraft facility of ₹5,000, but the median size of unsecured loans from non-institutional sources in the AIDIS data is ₹38,800, meaning that households have a need to borrow substantially more than the overdraft limit. We propose that repayment of the amount through EMIs for a maximum of 2 years is allowed, and that a condition of borrowing be that households take on insurance at the time of taking on the loan (if the household already has insurance, the loan interest rate could be slightly discounted as an incentive). Rates of interest should be well below annualised rates of interest charged by non-formal sources such as moneylenders, and regulators should look carefully at price-caps on high cost loans currently available in the market. However we caution that repayment enforcement should be clearly stated up front, made non-renegotiable and strictly enforced in the event of default, so as to prevent moral hazard. Simple collateralised loans Our recommendations on making sure that CERSAI is streamlined are important for collateralization purposes. Moreover, we believe that there is a need to allow quick collateralised loans for small sums of money at reasonable rates of interest without onerous bureaucratic requirements. This is already being extended in the form of gold loans from private NBFCs such as Muthoot and Manappuram, but rates of interest need to be carefully assessed, and price caps may well be warranted. We note that households greatly value ease of fund access and short processing times, as such facilities are often used at times when households realise unanticipated risks. The use of the DigiLocker may permit easier access to relatively low-cost institutional-source lending in this space, as there is a need (see Figure 2.13 Panel B) to replace high-cost non-institutional-source credit with formal credit. We also note that the committee supports the continued development of micro-housing loans (e.g., Micro Housing Finance Corporation Ltd.). More sophisticated products In this section, we list a set of products that show promise to enable better outcomes in Indian household finance, and should be considered and evaluated carefully. We discuss the regulatory sandbox in the next section, and believe that this mechanism could easily be used to set appropriate limits for transactions through these innovative products. Savings Small savings account, digital footprint Institutions such as moneybox.com are now using households’ digital footprints to enable “invisible” savings by linking payment applications with savings applications. Such products allow the household to “round up” small transactions and engage in small savings into a set of equity-linked instruments. We believe that this is a promising development. Micro-savings products with reminders Inducing households to save for future expenses results in better welfare outcomes. In three separate field experiments in Bolivia, Peru, and the Philippines, Karlan, McConnell, Mullainathan and Zinman (2010) show that reminders about the need to save had important impacts on improved savings. In particular, reminders that highlighted the customer’s particular goal (reminders that made a particular future expenditure opportunity, like school fees more salient) were twice as effective than reminders that did not mention the goal. Given the evidence we have seen about the goal-orientation of Indian households, this seems like an especially promising area of investigation. So far, the potential for behavioural improvements with small changes in communication strategy seems large. A notable example is that of Juntos, which submitted information to the committee on the success it has had with its SMS-based service to help low-income bank customers in Latin America improve their use of banking services. While this type of innovation is typically not directly and formally pushed forward by regulators, we believe that large-scale tests of products of this kind need to be a regular feature of the institutional environment in emerging economies with unique household demand characteristics. Prize-linked savings mechanisms In addition to micro-savings products with reminders, Kearney, Tufano, Guryan and Hurst (2010) show that prize-linked savings products – products that offer savers an additional return to the fixed interest return in the form of the chance to earn large prizes – generate more excitement and interest due to the lottery-like feature that augments such savings products. Guillen and Tschoegl (2002) survey the availability of lottery linked returns on bank deposits, and show that these products have been successful in incentivising borrowers to save. As we can see in Anagol, Balasubramaniam and Ramadorai (2015), Indian households do respond in terms of financial outcomes relatively strongly to winning lotteries, and this may be a good way to address the “lack of excitement” in saving for the future that may drive household financial decisions. We therefore recommend that such products be investigated in more detail, especially in light of the current prohibition arising from the Prize Chits and Money Circulation Scheme (Banning) Act, 1978. Annuitizing land and homes As previous chapters of this report highlight, a large fraction of household assets is invested in (illiquid) real estate. Providing mechanisms for households nearing retirement to convert some of their physical asset holdings into financial assets or annuitized payments can, we believe, potentially lead to large welfare improvements. We can get a sense of this from Figure 2.13 A, which shows counterfactual household gains from moving assets from gold into financial assets. The RBI, in its 2011 guidelines, laid out regulations for reverse mortgages in India. However, we note with concern that this market has hardly taken off. We believe this is partly owing to cultural preferences for the inter-generational transfer of real-estate, as well as institutional impediments such as a lack of clarity on ownership titles, as well as the difficulty of asset recovery in the country (as we discussed in an earlier section of this chapter). We therefore propose a detailed study that considers the institutional features needed to generate greater take-up and delivery of reverse mortgages. We believe that this will be an important way to improve liquidity in Indian household balance sheets. Tax-exempt savings vehicle The committee notes that at present PPF, EPF and ELSS are the tax-saving products/ wrappers available to households in India. However, there is little flexibility in the choice of financial products in which households can obtain tax benefits, and these benefits are restricted to sets of qualified products offered by financial firms. As we have seen, taxes are a feature of the environment which households in India seem to respond to in a relatively strong fashion. We therefore recommend the creation of a tax-exempt savings vehicle that is agnostic to the choice of financial products in which households choose to invest, with an annual limit of contributions beyond which taxes shall apply. Examples of such vehicles include the Individual Savings Account (ISA) in the United Kingdom, and the 401K plan in the United States. Looking forward, we believe that it is important to assess the value-addition that new products can generate before recommending their introduction, because there may also be risks embedded in these products. We therefore turn to outlining our proposal for the establishment of a Regulatory Sandbox to allow regulators and firms to jointly evaluate innovative product offerings that take into account Indian households’ cognitive, cultural, and behavioural biases. Ideally, the establishment of such an institution will help to reduce potential regulatory uncertainty in getting good financial products to Indian households. 4.5 Regulatory sandbox HIGHLIGHTS • Firms that develop new and innovative products often need to comply with legacy regulations that can increase costs and impede scaling up. • In turn, regulators may be wary about allowing untested and unproven products into the field for fear that they will pose risks to household welfare or financial stability. • A regulatory sandbox is a safe space which allows the regulator to conduct field tests to collect evidence on new financial innovations, while carefully monitoring their risks. It can provide a structured avenue for the regulator to engage with the ecosystem, and to develop innovation-enabling regulations, delivering relevant, low-cost financial products to Indian households. • The committee has developed a tailored design blueprint for a regulatory sandbox, based on extensive dialogue with the industry, including incumbents, start-ups, sector experts, and regulators. Challenges to the Implementation of Technology Solutions Many of the recommendations made by the committee are based on what regulators can do to improve household financial decisions. However, the committee recognises that many demand-side considerations cannot be solved through regulation and can only be addressed by a supply-side environment that dynamically innovates to address demand characteristics observed amongst Indian households. We have documented some of the considerations that result from such behavioural factors as well as supply-side frictions in the first three chapters of this report. We note that the current supply of financial products does not seem to fully account for the complexity of Indian household financial decision making. This seems to be changing, and we are already beginning to see the positive manifestations of technology driven disruption (often aided by positive regulatory support). That having been said, following the committee and technology sub-committee’s extensive consultations with more than 50 fintech players in India, it appears that key regulatory barriers remain that limit innovation. We list four broad challenges: 1. Compliance with legacy regulations: While the fintech sector continues to grow and develop new and innovative products and business models, firms often need to comply with legacy regulations that can increase costs and impede scaling up. For example, a robo-advisory company can collect KYC documents through Electronic In-person (EIP) methods such as video calls. However, they are also required to collect these documents in person, i.e., generating manual processes which are both time-consuming and expensive. Hence, there is a need to revamp some of these onerous regulations in order to reduce the administrative burden on startup businesses. 2. Cumbersome consultation processes: Regulators usually issue draft guidelines and follow elaborate consultation processes before finalising regulations. However, these processes can be lengthy, time consuming, and sometimes ambiguous in terms of the data being considered and the timeframe for decision-making. For example, for P2P lending, the RBI released the consultation paper in early 2016, however the consultations are still on-going. In the interim, over 20 P2P lending players have launched in the market, providing access to credit to consumers who might otherwise not get it, but simultaneously exposing these consumers to products and services which are not fully regulated, with the attendant risks. There is thus a need to expedite the consultation process, but to do so in a fashion that robustly provides regulators with empirical evidence on which to base regulations. 3. Ambiguity in interpretation of some regulations, especially for products that fall under multiple regulatory jurisdictions: With a rapid surge in financial innovation, and limited regulatory capacity, new financial products can face periods of regulatory ambiguity. For example, there are many hybrid products which technically fall under the jurisdiction of multiple regulators, and entrepreneurs can find it difficult to identify what regulations they need to comply with, and consequently what these regulations mean for their businesses. Hence, there is a need to provide an avenue for both the regulator and the industry to engage with each other through a structured process, and to clear any regulatory ambiguity. 4. Regulatory compliance “at scale”: Smaller fintech firms are generally concerned that while they can “fly under the regulatory radar” when small, as they scale and grow, regulators may at some point impose regulations on them which could adversely affect their businesses. Fear of this issue, according to many of these firms, can provide internal incentives to stay small, and can also limit access to external capital if investors are spooked by these concerns. The above discussion suggests that the current regulatory framework needs to be augmented with a mechanism to alleviate such bottlenecks. Box 6 Regulations as a bottleneck to driving product innovation and deploying innovative products at scale – Interview excerpts The committee sought inputs from a number of players active in the fintech ecosystem in India to understand the regulatory barriers that limit innovation in product development as well as deployment. We reproduce a selection of excerpts of these conversations below: • “Regulator does need to be perceived as an enabler; currently there is an inherent fear to take the product to the regulator. Sandbox would help reduce this fear but broader changes to attitude are required' – Think tank • “The consent architecture (for data) has to keep developing [and] it has to be iterative. We have to keep going back to people, and ask them what they felt, and then keep developing the consent architecture. Such iterative approach is only possible in a testing environment' – Ex-regulator • “Right now most of these start-ups are testing at a small scale without falling into trouble; the main problem is what happens when they hit scale, when they come under the regulator’s notice. That is what they are worried about.' – Accelerator • “The biggest problem is that the regulations are unclear – they are vague. People take a conservative approach at the cost of innovation' – Digital lending start-up. • “We could engineer a product, which uses PoS data for merchants and as an incentive provide a starter loan to merchants, and increase that loan with uptake of digital payments by merchant. The regulation ceiling is hit quickly: can’t do more than INR 60,000 on OTP KYC loan per person' –Digital lending start-up • “Existing rules are only applicable to one type of model, some of these are a redundant legacy of British rule. These rules do not fit perfectly with the new fintech models. For example, most commission structures are based on a percentage of the investment/premium. However, this cannot provide enough incentive to our distributors who will need to sell INR 30 on-the-go-insurance' – Micro-insurance start-up • “The regulator came out with draft guidelines/white paper on equity crowdfunding about 2 years ago. Then about 6 months ago they a issued a notice to start-ups in this space to shut down their operations. Some companies continue to be in operation. There is so much confusion' – Digital lending start-up • “Draft guidelines were issued on P2P lending by the regulator, comments from the industry were sought about 6 months ago, and after that there has been no news. As per the current guidelines/ regulations, the RBI considers P2P lending as NBFCs which they aren’t.' – Digital lending start-up • “Same consumer but there are so many multiple regulators for different investment products - NPS, ELSS, ULIPS, FD. Sandbox will create that single window to reach everyone' – Robo-advisory startup • “We had a product that falls under three different regulators, including the telecom regulator. No one wants to be the first to go-ahead. We did not know who to approach. No way for regulator to say you must proceed, test, and check with us again after 6 months. Sandbox would have given the clarity we needed.' –Micro-insurance start-up | The Need for a Regulatory Sandbox The committee believes that an important component of an enhanced regulatory framework is a regulatory sandbox, a safe space which can allow regulators to facilitate small-scale tests by temporarily relaxing certain regulations to collect empirical evidence, and evaluate potential risks of new financial technologies. Such an environment can provide a structured avenue for regulators to engage with producers of new financial products, and to help in the development of innovation-enabling regulations, with the ultimate goal of delivering relevant, low-cost financial products to Indian households. Such small-scale tests can provide much-needed and objective evidence to the process of regulatory decision-making in a time-bound manner. The committee notes that in the field of medicine, and increasingly in economics, that well-crafted small sample tests can provide very useful evidence to support policy-making. In both of these fields, double-blind trials, and randomised control trials are rapidly becoming mainstream. The regulatory sandbox approach applies the same concept to financial products and services. Such an institution could facilitate a test-learn-regulate approach to regulation (i.e., evidence-based policy making in action). This is particularly important in an environment of technology driven financial services innovation, allowing regulators to see innovations in action early, allowing regulations to respond quickly to changing realities. The report by the Ratan P. Watal committee on Digital Payments (2016) also highlights the benefits of a regulatory sandbox, stating that “a regulatory sandbox environment, will enable new businesses and the regulators to collaborate and encourage innovation, while at the same time limiting the risks faced by customers and the financial system.” This committee supports the recommendation, adding that such an institution could be geared towards improving outcomes in Indian household finance.11 Benefits of the Regulatory Sandbox: The sandbox can lead to benefits for three key stakeholders in the economy: 1. Households: Households will have access to more relevant and customised financial products, as regulatory barriers to the development of relevant and innovative products are relaxed following evidence of positive household outcomes from the introduction of these products. 2. Regulators: A sandbox can generate important benefits for the regulator: a) Create robust empirical evidence: A sandbox can allow regulators to rigorously test and optimise current policies and regulations, as well as to create new policies and regulations for emerging technologies. It can provide a “safe space” for gathering empirical evidence on the benefits and risks of proposed regulatory changes, allowing for better informed decisions. b) Respond quickly to changes in technology: A sandbox can provide an avenue for the regulator to constantly engage with industry, and stay informed about innovations in financial services and fintech. This will enable the regulator to have a better and more current understanding of the risks and benefits of new innovations, and allow for the pro-active development of regulations. c) Enhance regulatory capacity: The sandbox can be designed to speed decision making by regulators, by producing objective evidence to support regulatory decision-making in a structured fashion. In many cases, it can substitute for ad-hoc individual industry consultations, which can be time consuming, cumbersome, and lead to perceptions of a non-level playing field, and take up a large share of regulators’ time. 3. Businesses: a) Reduced time to market for financial products and services: A sandbox can provide private sector players with an environment of regulatory flexibility and a testing environment in which to refine products and services. This can also allow them to develop products which are suited to user needs. b) Evidence driven regulatory environment: A sandbox can provide the private sector an avenue to clear ambiguity around regulations, and provide a robust, evidence-driven regulatory environment. This can help to reduce regulatory uncertainty faced by fintech players, allowing them to focus on developing their product with a clear understanding of regulatory boundaries. c) Reduced barriers to entry: A sandbox can help provide a more level playing field to small and early-stage start-ups, by allowing them to test their products, even if they do not meet all the necessary regulatory requirements upfront. This allows them to have a tested product when they launch, and enable them to compete with incumbents, in addition to providing a useful certification function for untested technologies. Below, we provide some use cases for a regulatory sandbox, in order to permit a more concrete understanding of the role of such an institution. Box 7 How a regulatory sandbox can help drive product innovation and speed up go-to-market: An illustrative Case Study Firm ABCPensions (a fictitious company), a notable micro-insurance company which operates in many African countries wants to launch their products in India. The products included insurance delivered through mobile airtime, and pay-as-you-go insurance products. The company collaborates with telecom operators to offer their products paid through airtime through their distribution network, and with insurance providers who underwrite the risk. It hires, trains and manages a network of sales agents who are spread across the country. They also have a claims team that deliver a fair, transparent and fast process for customers through claim hotlines and an agent network. A large fraction of their potential consumer base lives on less than USD 10 a day, and is likely to access insurance for the first time. Thus, such a product can drive both social impact by providing an innovative product to the under-served, and deepen the range of offerings in the Indian insurance sector. Though the company has a proven business model in African markets, launching operations in a new geography requires substantial effort and resources to identify the right telecom and insurance partners, and hire, train and deploy a sales force. Before it makes this investment in India, it requires regulatory clarity to convince its shareholders. Hence, the company reaches out the relevant regulators (e.g., RBI, IRDA, TRAI) to seek clarity before proceeding with a launch in India, as such a product is not recognised explicitly by any regulations. Although the regulators seem positively inclined, they are hesitant to provide regulatory clarity because they are unable to assess the risks associated with such a new product. As a result, ABCPensions does not get the required clarity and is unable to launch the product in India. If there was a regulatory sandbox, the regulators could have channelled the company’s request for testing in it. The company would have sought approval from the regulatory sandbox to launch the products in a limited geography with a select set of consumers, generating evidence to evaluate the benefits and probable risks associated with this new product. This would have allowed the regulators to take an informed data-driven decision on whether to permit this product, and how best to regulate it. In this way, a regulatory sandbox can provide an avenue for testing and eventually launching new products and services approved and monitored by the regulators. | Use Cases for the Regulatory Sandbox: Tests in the sandbox could be conducted in three situations: 1. Seek temporary relaxation from licensing norms to test business models: Fintech businesses and other startup finance businesses often face high costs of compliance even before understanding the longer-term viability of their business models. Indeed, these costs can also contribute to such businesses not being viable in the first place. The sandbox can perform the function of providing temporary flexibility to such businesses to test their models. Clearly, upon successful experimentation and exit, such businesses must subsequently comply with the relevant legal and regulatory requirements. To provide an example, alternate data-based credit allocation (which can help borrowers with no previous track records or irregular income patterns) is currently impeded by the fact that such firms who wish to co-invest with NBFCs currently need to apply for NBFC licenses themselves. However, such alternate credit models are currently untested at scale. Thus, many firms are deterred from registering as NBFCs, and thus from starting such businesses, as they may not have the resources to comply with the licensing norm. This in turn means that these services are not available to households, even though there may be a strong demand for them. 2. Assess the pros and cons of a regulatory amendment proposed by an industry participant: Fintech businesses often have to comply with regulations which are developed for legacy technologies, or might be irrelevant in today’s financial services ecosystem. For example, mutual funds are subject to KYC requirements, which increase the cost of consumer acquisition, and deter adoption by first time consumers, especially when compared to purchasing gold that requires no KYC. A large number of users (20% by some estimates) find the current process very cumbersome, or simply do not have the requisite documents. In this situation, the sandbox could test benefits and risks for waiving KYC requirements for small ticket mutual funds (say up to INR 10,000). Modifying the regulation temporarily could provide evidence on the benefits to consumers and as well as the risks arising from such rule modification. The evidence generated can help the regulator modify regulations accordingly after such testing (see Box 5 for an illustrative example). 3. Test draft regulations for innovative, but unproven products and services: With a rapid surge in fintech innovation, there are many new products that are unaddressed by existing regulations or upcoming hybrid products which fall under the aegis of multiple regulators. For example, peer-to peer (P2P) lending is a new online model in which companies serve as marketplaces that bring individual borrowers and lenders together for loan transactions, often without a formal institution intermediating between them. This nascent business model is currently unregulated. The sandbox could test P2P models such as loan recovery practices and consumer’s risk exposure to data privacy, unreasonable interest rates, etc. These experiments will help the regulator draft evidence backed regulations that promote the market, but also protect consumers and the market adequately . The scope of testing (as outlined in the three situations above) within the sandbox reflects the needs of the Indian fintech industry as well as the regulators. While the first situation is common in sandboxes globally, the second and third situations will be equally, and if not more, relevant in the Indian context. This is due to the existence of multiple regulations that can limit innovation, and the emergence of a slew of transformative products, which are currently unregulated and could help to address the twin challenges of customisation and scale. It is worth noting that what the committee proposes is a sandbox that will be a limited facility for contained testing based on regulatory modifications. It will not take on any functions of any regulatory department, and it will not be in the business of providing regulatory advice, incubation, virtual testing services, or serve as an industry forum. Specifically, we envision that the sandbox will not provide additional services such as: 1. Advisory: The sandbox will not provide explicit clarifications around regulations or guidance on regulatory compliance. Further, the sandbox will not provide guidance on applicants’ business models. 2. Incubator and accelerator services: The sandbox will not be a platform for fintech start-ups where start-ups receive mentorship, capital, marketing and/or operational support to develop their business model. 3. Virtual testing: The sandbox will only be limited to testing with consumers and will not provide a simulated environment for testing. 4. Industry forum: The sandbox will not be an industry forum where firms can lobby for regulatory amendments, or a forum for firms to establish contact with regulators. This committee notes that a regulatory sandbox is just one component of an enhanced regulatory framework for India, in addition to our other proposals in this chapter. Nevertheless, the committee believes that the general approach to push towards evidence driven regulatory decision-making is a good one, and that a regulatory sandbox is a good way to further this broader ambition. We also note that the regulatory sandbox concept has found strong resonance with regulators internationally. The first such sandbox was set-up by the Financial Conduct Authority in the UK in 2015. Over the past two years, at least eight sandboxes have been launched globally. While the core emphasis on generating empirical evidence through field-testing and experimentation remains, countries have contextualised the sandbox concept according to their market needs and regulatory architecture. The committee believes that the Indian sandbox should thus be tailored for Indian household financial needs given the imperatives in this space. In particular, this committee believes that a sandbox can help to realise the promise of technology to address long-standing problems in the area of household financial allocations, and hence eventually to help enable better outcomes in Indian household finance. To expedite the implementation of this recommendation, we provide a detailed engagement process for the operations of the proposed sandbox, as well as a proposed set of institutional details such as governance structure and legal mandate in Appendix G to this report. Box 8 Reviewing Know Your Customer (KYC) requirements for mutual funds under INR 10,000: An illustrative case FundingFirst (A fictitious company), a private sector online aggregator of mutual funds, requests the regulator for permission to sell small-value mutual funds to first time buyers, without completing KYC documentation. This is prohibited under existing regulations. The firm believes that this modification can promote households to invest in formal financial assets, by removing a key barrier in the customer on-boarding process. The current KYC requirements are perceived to be cumbersome- many find it difficult to fulfil, which leads to drop-offs in the number of people who finally invest. As is well documented, Indian households tend to over-invest in physical assets such as gold, and shifting household investments towards formal financial assets will be beneficial for the economy (Badarinza, Balasubramaniam and Ramadorai, 2016b). If the regulation is modified, there can be multiple benefits for the financial services sector, consumers, and the economy at large. The financial services sector will be incentivised to develop innovative products for low-income households, as the cost of acquiring new customers will come down. This will increase access to mutual funds for consumers, allowing a larger section of Indian households to invest in formal financial products. Eventually, as more funds flow in to the financial assets, this creates more investable capital and deepens the capital markets. However, while the regulator realises the value in modifying this regulation, it is also concerned about the market risks that may arise by exempting mutual fund investments from KYC requirements. The regulator feels that this may open another avenue for money laundering, where investments can be purchased with illegal proceeds. In addition, it is worried about distorting market competition, since mutual funds may be prioritised over other investment products which will continue to require KYC documentation (such as insurance linked investment products). After considerable deliberation of the pros and cons of the suggested change in the regulation, the regulator agrees to “sandbox' the proposal, i.e. temporarily amend the regulation in a controlled environment for a specified duration, where the risks of the experiment can be contained and monitored closely. The regulator provides a temporary modification to the regulation, and allows FundingFirst to distribute mutual funds up to INR 10,000 without a KYC requirement. The experiment will be limited to 10,000 customers for a six-month duration, i.e., the KYC waiver will automatically become ineffective when FundingFirst reaches 10,000 customers. The regulator asks FundingFirst to incorporate safeguards against potential risks such as money laundering before commencing the experiment. FundingFirst commits to the regulator that all monetary transactions will be routed through digital means (money transfers from bank accounts) which can provide a digital trail, which is auditable. The company will maintain a digital asset side registry, linked to their Aadhaar number, to ensure no one invests more than INR 10,000, without submitting KYC documents. Furthermore, the company will conduct random dip-stick surveys to validate identity of 5% of customers through traditional KYC documentation. The regulator, on its end, will monitor the experiment through weekly reports provided by FundingFirst and random audits of FundingFirst accounts. In addition, the regulator reserves the right to close down the experiment anytime if it feels customers and/or the market is at risk. At the end of the experiment, FundingFirst expects an increase of 20% in number of first time buyers of mutual funds and no instances of money laundering. The regulator will not only assess if the benefits outweigh the costs within the sandbox, but also evaluate if the safeguards will continue to contain risks when deployed at scale. Post the experiment, the sandbox can make evidence-based recommendations to the regulator whether the current regulation should remain unchanged or be modified. | 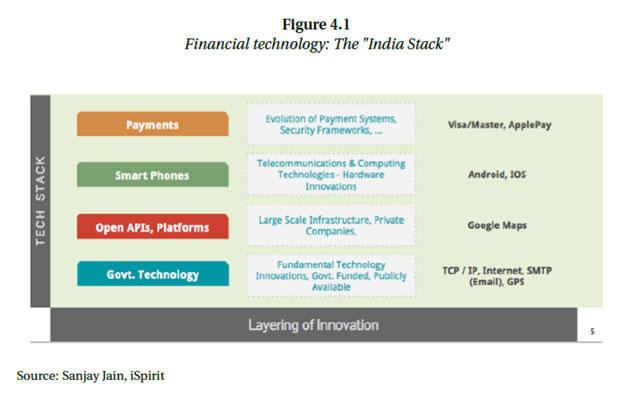 Table 4.1
Sandboxes around the world | No. | Country | Sandbox | Authority | Stage | | 1 | United Kingdom | Regulatory Sandbox | Financial Conduct Authority | Launched in 2016; Currently admitting second round of applicants | | 2 | Singapore | Fintech Regulatory Sandbox | Monetary Authority of Singapore | Launched in 2016; Currently admitting applicants | | 3 | Australia | Regulatory Sandbox | Australian Securities and Investments Commission | Finalised the guidelines in Dec 2016 | | 4 | Abu Dhabi | Financial Services Regulatory Authority | Abu Dhabi Global Market | Launched in November 2016 | | 5 | Indonesia | Regulatory Sandbox | Bank of Indonesia | Launched in November 2016 | | 6 | Hong Kong | Fintech Supervisory Sandbox | Hong Kong Monetary Authority | Launched in September 2016 | | 7 | Malaysia | Financial Technology Regulatory Sandbox | Bank Negara Malaysia (BNM) | Framework published in October 2016 | | 8 | Thailand | Regulatory Sandbox | Bank of Thailand | To be launched in first quarter of 2017 with commercial banks | | 9 | Canada | OSC Launchpad | Ontario Securities Commission (OSC) | Launched in October 2016 |
________________________________
CHAPTER 5
CONCLUSION Numerous committees, including the Raghuram Rajan Committee, the Sumit Bose Committee, the Dhirendra Swarup Committee, the Nachiket Mor Committee, the Rattan Watal Committee, the Deepak Mohanty Committee, and the FSLRC, have done immensely important work in the areas of financial inclusion and household finance. They have identified several objectives that need to be achieved in order to improve retail participation in financial markets, and have proposed measures to ensure customer protection following financial inclusion. Among other things, these committees have made recommendations which have led to improved access to retail financial services, the universalisation of basic banking, access to simple insurance and pensions products, and improved standards for consumer protection and redress. These recommendations have primarily focused on supply-side considerations, and have emphasised the removal of conflicts of interest to solve underlying problems in Indian consumer financial markets. Their recommendations are even more relevant in the current environment, in which financial technology generates rapid growth in financial market participation. This committee recognises and appreciates the contributions made by our predecessors in this space. To continue and develop this important work, our committee recognises that demand-side considerations are equally relevant, and that policy solutions must take into account the vast heterogeneity in household requirements for financial products – for example, a young, low-income household in Patna may face a very different set of risks, and have different demands for financial services than an older, high-income household in Pudukottai. The key focus of this report has therefore been to characterize the demand-side of Indian household finance, and to recommend policy that will enable financial innovation to cater to the twin imperatives of customisation and scalability in this critical segment of the economy. In pursuing this focus, our report brings three new contributions to policy thinking in Indian household finance. First, we provide extensive empirical evidence, as well as simple analytical foundations to document and assess Indian household balance sheets. This evidence base attempts to characterise the state of household finance in India, covering both participation (financial inclusion), as well as allocation conditional on participation (i.e., use, in addition to access) in both assets and liabilities. We then attempt to explain features of these balance sheets by utilising international comparisons, a theoretical model, and features of the Indian institutional environment, providing a base of evidence on which our policy recommendations rest. We believe that this marshalling and analysis of data will be useful more generally. For one, we hope that these data will serve as a benchmark to assess progress on the recommendations of previous and future committees in this space, as well as our own recommendations, in years to come. Our second contribution is to drill deeper into household demands for financial services. We find that households in India suffer as a result of having to incur significantly high transaction costs in achieving their optimal portfolio allocations, and also exhibit cultural and behavioural predispositions which generate an overall reluctance to engage in formal financial markets. This can partly be explained by reliance on traditional systems of insurance and asset allocation that have historically served households well. However, in a rapidly changing economic and social environment, these systems have come under pressure. Indian households’ decision making overall appears distinctive from the perspective of international comparisons, and it is difficult to rationalise Indian household finance choices using standard models of optimal lifecycle portfolio choice calibrated to Indian data. The work we have done on this front highlights the degree to which the widespread provision of customised financial products can improve the welfare of Indian households across the wealth and age spectrum, and given the degree of geographical and cultural diversity in the country. A particularly important part of this analysis enables us to document the gains from counterfactual changes to household balance sheets. We find considerable potential gains accruing from a few changes, and we map these gains into qualitative principles to guide the development of policy to make finance work better for Indian households. Our final contribution is to provide a set of policy recommendations. We propose a set of traditional policy remedies motivated by the evidence that we harness in the first part of this report, but also make the case that to enable better outcomes in Indian household finance, in addition to state-driven solutions, we will need innovation in the finance industry, with a particular emphasis on the use of financial technology. We therefore propose measures to harness financial innovation to reduce transaction costs imposed by physical, psychological, bureaucratic, and monetary barriers, and to address the reluctance of Indian households to hold and to transact in products that can improve their financial well-being. Although financial technology firms are already a rapidly developing reality in Indian financial markets, so far the focus has been on developing cost-effective ways to deliver traditional financial products such as mutual funds and life insurance policies. These traditional products are primarily targeted towards upper-middle income and rich households in India, and do not currently cater to the vast majority of Indian households who have very different needs. Financial technology holds promise to surmount some of these historical obstacles to customised delivery of financial products in a fashion that scales well even at low ticket sizes to households across the wealth distribution in India. In our interactions with firms operating in the financial technology sector, the potential for creative solutions in Indian household finance was clearly evident. However, we also learned that an important barrier to the introduction of new financial products that leverage technology is regulatory uncertainty. Firms in this space keenly feel the lack of a governing framework for introducing new financial technology and relevant financial products, are wary of falling foul of regulatory requirements, and sometimes face impediments arising from pre-existing regulatory standards that were put in place in a previous environment in which technology was not able to support effective monitoring. Justifiably, regulators have also been cautious in making amendments to the existing space of regulations, as these may have long-lasting and wide-ranging impacts on household welfare, and we operate “in the dark” as regards the micro- and macro-prudential consequences of current actions. As a result, one of the important recommendations of this committee is to set up a regulatory sandbox, which is an institution to test and verify the impacts of product innovations and selectively experiment with the relaxation of preexisting regulatory standards or establish more relevant regulatory standards for financial innovation. The goal of this new institution should be to enable better outcomes in Indian household finance. We are hopeful that more broadly, in combination with sound thinking about the underlying economic determinants of financial decisions, the promise of technology to help address long-standing problems in household finance will be realized.
APPENDIX A Data description All India Debt and Investment Survey Our main data source for this study is the National Sample Survey (NSS) Organisation’s All India Debt and Investment Survey (AIDIS) that records asset holdings as at June 2012 for households in India.1 AIDIS is a decennial survey conducted by the NSSO since 1971, with a roughly 0.01% sample of the Indian population, through a multi-stage design that is adopted in all NSS data collection exercises.2 We observe demographic information such as the gender of the head of the household, age, education level, the number of children, the household sector (rural/urban), and the location of residence (state-region-district). To exclude the possibility that outliers drive our results, we drop observations for which the household head is younger than 24 years of age. Over and above demographic and household characteristics, on the asset side of the household balance sheet, this survey records information on land holdings, buildings, and other constructions owned, livestock and poultry, transport equipments, farm equipments, non-farm business equipments, financial assets such as shares and debentures, bank deposits, insurance, pensions and other financial assets, amounts receivable for services rendered, and gold holdings. While other surveys such as the India Human Development Survey (IHDS) contain information about participation or ownership of different asset types, to the best of our knowledge, AIDIS is the only data source that provides explicit valuation of all assets held by households in great detail. Some of the assets in AIDIS are valued not merely by asking respondents what the value of the asset is, but by the government records of these assets. For instance, to assess the value of land, AIDIS records land acquired prior to the survey year on a guideline basis: These are valuations obtained from Patwaris (village accountants) for rural areas and the registrar’s office (where land transactions are registered) in the urban areas. It is important to note that these valuations are in general the lower-bound of the value of these asset holdings, as the market prices of land are almost always higher, and the registered prices of land transactions are often understated to avoid paying stamp duty and state government taxes. For buildings, a similar approach is adopted and floor area prices are computed using government registration records. Residential buildings exclude the value of the land on which the building is constructed and is thus not inclusive of the value of land recorded separately. For all other asset valuations, the value as stated by the respondent for the household is recorded. For our purpose, we classify financial assets to include shares and debentures, all types of deposits, saving schemes, annuity schemes, provident fund, pension fund, NPS, other contributory funds, and payments receivable by the household. Likewise, non-financial assets include real estate assets (including land and buildings), durable assets and equipment (including livestock and poultry, transport equipment, agricultural machinery, non-farm business equipment3), and finally holdings of gold/bullion.4 The survey also provides the sampling weight of each observation. The empirical measure of interest is the non-financial ratio and its sub-components, i.e., the fraction of total assets that are held in non-financial, physical form and in categories such as real estate and gold. Although this is the best source of data on the asset composition of households in India, there are some important limitations to keep in mind while interpreting the data. For example, the valuations of real estate and buildings are likely to be understated by official sources across the distribution, and not just for one or the other household.5 As reiterated in Jayadev, Motiram and Vakulabharanam (2007) and Brandolini, Cannari, D’Alessio and Faiella (2004), unless conscious efforts are made to oversample the wealthy, the extent of financialization of wealth will be misrepresented6. Turning to liabilities, all types of personal liabilities are captured as amounts outstanding in June 2012. There are two broad categories of loans: secured and unsecured. Secured loans cover the following collateral types: surety security or guarantees by third party, crops, immovable property, gold/bullion/ornaments, shares of companies, government securities, insurance policies, and agricultural commodities. For each loan, we also know the type of the originating agency, which allows us to classify debt holdings as institutional (originated by government agencies, co-operative societies, banks, insurance companies, bank-linked self-help groups, non-bank financial companies) and non-institutional (originated by landlords, agricultural and professional moneylenders, input suppliers, relatives and friends, doctors, lawyers and other professionals). International Micro Data We construct analogous measures for other countries for international comparison. We use the Chinese Household Finance Survey (CHFS, 2012), the Townsend Thai Survey (TTS, 2012), the Household, Income and Labour Dynamics in Australia Survey (HILDA, 2010), the UK Wealth and Assets Survey (WAS, 2012), European Household Finance Survey (2010) for Germany, and the US Survey of Consumer Finances (SCF, 2010).7 It is important to note that different surveys cover different asset categories, and with different degrees of precision. To ensure comparability across countries and consistency with the structure of the Indian dataset, we pool asset categories with similar features. One notable difference between India, Thailand, China, and the remaining countries concerns holdings of private retirement savings in defined-contribution accounts. In the US, UK, Australia, and Germany, such products have been robust fixtures of financial markets for decades. Most of the population relies at least partially on such private products to finance consumption in retirement and respective household surveys adequately account for this observation. On the contrary, defined-contribution savings accounts are only held by a small part of the population in developing countries. Financial Inclusion Insights Survey The Financial Inclusion Insights (FII) Surveys are conducted by InterMedia, a private company focusing on mobile money, and is supported by the Bill and Melinda Gates Foundations. It is important to note that the surveys are not a panel and are repeated cross-sections representative of the Indian population. The FII surveys follow a three-staged stratified random sampling process. First, it stratifies by rural and urban areas, following the definition and proportions defined in the Indian Census 2011. The states of Bihar and Uttar Pradesh diverge from this method of sampling. Both states are predominantly rural in their population breakdowns – close to 80:20 (rural/urban) in Uttar Pradesh and 90:10 (rural/urban) in Bihar. Oversampling of urban areas in these provinces was done and the sample allocation to rural/urban was adjusted to 70:30 in these states to more closely mirror the national rural/urban composition and ensure larger urban subsamples for state-level analysis. It was then weighted back to census-based urban/rural breakdowns in the state. As a second stage, the survey was stratified geographically by state. The sample is distributed among India’s 29 states and 7 union territories proportionally to the size of the target population (aged 15 years and over) in each state. The survey excludes the state of Jammu & Kashmir and two union territories (Andaman-Nicobar islands and Lakshadweep islands). The state of Telengana is not treated separately from Andhra Pradesh, as this was the case in the 2011 census. The remaining five union territories are each treated as part of the closest neighbouring states. Six states of north-eastern India are treated as one state (North-East), but the seventh North-Eastern state, Assam, is treated as an independent state. As a result, the sample comprises 28 states (22 states plus 1 combined state-category) across all the regions of the country. Lastly, the sample was stratified by town/village class representation. The towns and villages in each state were divided into 5 town and 3 village categories based on the population. The sample per town and village class was fixed and the towns/villages were selected by random sampling. Using a skipping methodology, households were selected in each village/town. The respondent within the household was selected using a Kish Grid methodology. Targeting a sample of 45,000 individuals in each year, the total pooled sample amounts to 135,147 individuals (aged 15 years and over). The survey also provides the sampling weight of each observation. The FII surveys observe demographic information such as the gender of the respondent, age, education level of the respondent and education of the head of household, the household size, the household sector (rural/urban), and the location of residence (state-region-district). The survey further observes participation rates of physical household assets and financial services. The most recent survey wave provides the most details on the household level. FinScope Survey India’s first FinScope survey was implemented by the Small Industries Development Bank of India (SIDBI) and supported by the UK’s Department for International Development (DFID) under the Poorest States Inclusive Growth Programme. Using stratified three-stage systematic sampling, the survey was conducted in July 2015 in Bihar, Odisha, Uttar Pradesh and Madhya Pradesh, sampling 16,000 households from which one person from each household was selected. First, the sample of the target population (18 years and over) in each states was allocated in a disproportional manner to all states in India. States were stratified by rural and urban areas. Secondly, villages and wards were also stratified by location and selected in each state based on recent enumerations from the Census 2011, and clustered in Enumeration Areas using Probability to Size systematic sampling. Thirdly, Individuals within each household were selected using the Kish Grid methodology. The survey provides the sampling weight for households and individual respondents within the household. The FinScope survey reports demographic variables such as the gender of the head of the household, age, education level, and the number of children, the household sector (rural/urban), and the location of habitat (state-region-district). Furthermore, it reports participation rates for physical household assets and financial services and products. All surveys sample approximately the same proportion of females as represented in the Indian Census (48.4%). The samples further appear similar regarding the median age, education, and household size. Some differences exist with view to marital status, as the FS sample contains a higher share of married respondents. The FII sample comes very close to the proportions of the rural population observed in 2011 India Census. The FS survey, on the other hand, samples more households in rural areas proportionate to the lager rural state-distribution in the FS states. India Human Development Survey The India Human Development Survey 2005 (IHDS) was organized by researchers from the University of Maryland and the National Council of Applied Economic Research, New Delhi, and funded by two grants from the National Institutes of Health. The IHDS is a nationally representative household survey of 41,554 urban and rural households. It covers all states and union territories of India, with the exception of Andaman-Nicobar and Lakshadweep which contain less than one per cent of the Indian population. These households are spread across 33 states and union territories, 384 districts, 1503 villages and 971 urban blocks. The sample was selected using a clustered sampling procedure designed to provide a nationally representative sample of India. The survey instruments were administered in 13 languages and used interviewers fluent in the local language and well-versed in the culture. A team of female and male interviewers visited these households and collected data in face-to-face interviews from one respondent knowledgeable about household income and employment, usually the male head of the household, and one ever-married woman aged 15–49 (if any). Women were interviewed by female interviewers. IHDS is a multi-topic survey with information on income, employment, education and health. Household information was conducted through structured interviews using two questionnaires. The first was administered to a key informant, usually the male household head, and collected detailed information about the household: demographic characteristics of household members, economic condition of the household (level of income, consumption patterns and asset ownership), education level and morbidity and mortality patterns of household members. ICE 360°Survey The ’Household Survey on India’s Citizen Environment and Consumer Economy Survey’ (ICE 360°) is a nationally representative survey of 60,360 households. The data is collected and disseminated by the People Research on India’s Consumer Economy (PRICE). Geographically, the sample covers 216 districts, 1217 villages and 487 towns spread across 25 states. The survey captures participation rates in financial products and physical assets, income levels, a wide range of social and economic characteristics, as well as attitudes of households towards the financial products they use. The data comprises the following modules: (a) Household characteristics, (b) Social and political inclusion, (c) Access to welfare, (d) Income and consumption, (e) Debt situation of households, (f ) Financial optimism, (g) Saving and investment behaviour, (h) Labour market participation, (i) Financial inclusion, (j) Digital connectivity, (k) Access to public infrastructure, (l) Opinions about public policy, (m) Demographic profile. Kshetriya Grameen Financial Services Kshetriya Gramin Financial Services (KGFS), is a rural financial services delivery model designed and owned by IFMR Rural Finance and promoted by IFMR Trust. KGFS extends its coverage beyond the traditional banking system or microfinance institutions by building trust and relationship with the local households. Each KGFS is a region specific unit or a local financial institution referred as “Strategic Business Unit (SBU)' with largely locally hired staff meant to understand the needs of the community, and speak the local dialect. We have access to a customer database covering 4 lakh of low-income households in Tamilnadu, Orissa and Uttarakhand, for the period between September 2008 and August 2015. All demographic and socioeconomic variables recorded in the database were captured during in-person interviews with customers or potential customers. The interviews were conducted by KGFS’ trained frontline staff. The data comprises the following modules: (a) Household characteristics, (b) Ownership status of physical assets and financial products, (c) Labour market participation, (d) Household expenses, and (e) Self-reported financial goals of the household. All underlying data for figures and tables in the report are generated by the research sub-committee and are available upon request from the Chairman. B Life-cycle portfolio choice model with durable goods Calibration Solving the model C Distribution of household wealth Figure C.1
Equivalent percentage gains from re-allocation of household wealth In this figure, we report the distribution of household wealth across the Indian population, including real estate (land and buildings owned by the household), gold (jewellery, bullion, ornaments and coins), financial assets (bank deposits, publicly traded shares, government securities, mutual funds, managed accounts, and informal loans receivable), retirement accounts (private pension accounts, provident funds, and annuity certificates), and life insurance accounts. The data source is the 2012 wave of the All India Investment and Debt Survey. The two arrows illustrate the calculation of equivalent percentage points (pp) gains. For example, a financial gain of |5.6 lakh for the median household implies an equivalent upwards movement of 20pp along the wealth distribution. D Example of digital simplification E Biennial State of Indian Household Finance Survey The objective of the All India Debt and Investment Survey (designed and conducted by the National Sample Survey Organisation (NSSO)) is to obtain quantitative information on household assets and liabilities to design better policies for credit disbursement through formal financial institutions. The sample survey is ambitious, covering over 1,800 villages and roughly 100,000 households across India. The statistical methods used for the National Sample Surveys since inception are cutting-edge, and continue to remain of a very high standard, comparing favourably with the design of household surveys around the world. Since the first round of the NSSO surveys in 1971-72 (and the Reserve Bank of India in 1951-52 and 1961-62), Indian households’ engagement with financial markets has changed considerably, coinciding with the rapid growth in the number of middle-income households over the past few decades. Households have access to more instruments, as the availability of formal sources of finance and modes of savings has significantly increased since 1971. As a result of the Indian household financial landscape evolving so rapidly, there is now a case to be made for more frequent household surveys, with the addition of modules to aid evidence-based policy making in India. We believe that this new biennial survey must also be flexible, to aid aggregation from the household level to the macroeconomic level. This is in keeping with the trend in economics of a movement towards capturing the rich heterogeneity of household financial and demographic circumstances, and the desire for a better understanding of how such heterogeneity can impact monetary or fiscal policy transmission. This is an increasingly important function of such surveys, in addition to the ability to calculate the distributional consequences of policy changes. Such exercises require appropriate representation of both poor and wealthy Indian households. At present, while poor households are well captured, rich households are under-represented in NSS surveys.8 These issues can be addressed by small changes to the AIDIS sampling approach, including dual-frame design, and the use and efficient employment of suitably anonymised administrative data, for example from tax filings. Currently, AIDIS primarily focuses on assessing the stock of households’ financial and non-financial assets and liabilities, from both formal and informal sources, in great detail. The committee recommends that this survey instrument could be augmented to cover additional ground. Such expansion could include (but not necessarily be limited to) questions that ascertain households’ credit attitudes; the patterns of both asset and debt inheritance; the intra-household asset ownership structure; the usage of collateral; the incidence and impact of health shocks; greater details about insurance purchase and use; the sources, magnitude, and frequency of households’ income flows; households’ expectations about their future cash flows (future income, as well as expected expenditures arising from health and mortality); households’ risk and time preferences; household experiences with taxation; their use of government financial schemes; questions about their trust in financial institutions, advisors and distributors; their self-reported financial literacy; and their familiarity and use of digital services. F Rights-based data protection framework for financial information HIGHLIGHTS • Any meaningful engagement to improve household financial outcomes calls for the processing of large volumes of personal and potentially sensitive data. Given privacy concerns, in most countries access to data is limited by existing legal frameworks. • The exception to this is the Nordic countries where, due to robust laws and confidence in the capacity of the State to safeguard personal privacy, detailed and granular data about household finances is easily available. In India, given the absence of any significant privacy legislation there are legitimate concerns that any household data that is collected or processed could give rise to privacy concerns. • Existing legal frameworks for data protection around the world use consent as their primary mechanism to ensure data protection. • We consider a rights-based approach as an alternative. Data Volumes, Consent Fatigue, and Diminished Consent When consent was first used in the 1980s to ensure privacy protection, data controllers had limited reasons to collect data and even fewer alternate uses to which it could be put. Once collected, data was static and rarely transferred out of the organisation. In this context, using consent as the basis for privacy protection seemed appropriate and resonated with the fact that privacy was being viewed as an essential human right. Today, data is collected, processed, transferred and consumed in too many ways to comprehensively enumerate. Our online activity is logged, shopping preferences are recorded, recruiters know our past employment histories as well as our activity on social media. Every financial transaction that we undertake, is tracked and correlated against location, age and time of day offering insights into our personality that even we are unaware of. We are surrounded by smart devices equipped with sensors and cloud intelligence, that track our parameters and log what we do and how we do it.9 As the volumes of data have grown, consent, as a practical matter, is collected using standard form contracts executed at the time that data subjects signs up for a service. The privacy policies are dense and complex making it difficult to effectively assess the implications of agreeing to its terms.10 Given the large volume of services we consume, consent fatigue sets in as a result of which most people agree to privacy terms without fully understanding what they have signed up to. This is more so the case with social media platforms that have been elevated to the level of a social necessity. Our interactions with friends and business colleagues have become so dependant on our continued availability on these platforms that our social anxiety at being left out of these networks further impairs our ability to neutrally assess the terms of these privacy policies. Any consent provided in this context therefore has diminished value. Interconnected Databases Modern databases are designed to be interoperable through APIs that provide easy access to their datasets. This ability to interconnect has allowed us to unlock value in the data generated by wearable devices by layering multiple sets of data in ways that give us powerful insights that can be used to inform our decision-making. Privacy policies have been modified to include our consent to such interchanges of personal data. It is hard enough to assess the impact of a privacy policy in the context of the data that they collect directly. Evaluating the impact of interconnected datasets is virtually impossible. To the contrary, it is precisely because the insights gleaned from interconnected datasets are so completely unpredictable that we are enamoured by the power of these inter-connected databases. Data Transformation We are constantly generating data through our smart devices, our interactions with service providers and our participation on the internet. By itself, each discrete element of data is innocuous and irrelevant from a privacy standpoint. However, when connected with other similarly innocuous data elements, they can be transformed into sensitive personal information. Human beings are incapable of seeing these “connections” but machine learning algorithms can spot patterns and build profiles that would have otherwise been impossible to discern. There is no legal requirement for prior consent when collecting non-personal data. However, when combined to build personal profiles, the potential harm that this could inflict on personal privacy is apparent. If consent is our only safeguard against privacy violation and consent is not required to collect non-personal data, we will be unable to safeguard against privacy harms that result from the use of deep learning algorithms.11 While consent has served us well over the years, with the advent of machine learning and other cognitive technologies, it is quite clear that it is no longer useful as the principal line of defence against privacy violation. At present the only purpose that consent serves is to allow the data controller the ability to limit its liability in the event of a data breach. In order to put into practice many of the recommendations suggested in this report, large volumes of granular household data will be generated, stored and processed. At present, India lacks a formal legal framework for data protection.12 Privacy regulations, to the extent that they exist, remain rudimentary and diffused. There is no formal privacy statute and the closest we have to a formal privacy law is in the rules enacted under Section 43A of the Information Technology Act, 2000 that spell out, in general terms, privacy obligations that apply to anyone who collects and processes sensitive personal data and information. In addition specific provisions exist in various Indian statutes such as the Credit Information Companies (Regulation) Act, 2005 and the Credit Information Companies Regulations 2006, the Indian Telegraph Act, 1885 and The Right to Information Act, 2005, among others. These regulations are, for the most part, minimal, lack formal regulatory and enforcement frameworks and are largely unresponsive to changes in technologies. As a result, as we propose to grow databases to enable households to better participate in financial markets, the continued lack of clear privacy regulations presents an ever-increasing risk to personal privacy. It is appropriate to examine the work that has already been done in India regarding the formulation of a privacy law. Over the course of the last decade, there have been several efforts to enact a privacy statute in India. A committee was constituted under Justice A. P. Shah13 that recommended a set of over-arching national privacy principles that should find their way into a statute. In the recent past, two research organisations – NIPFP14 and Vidhi15 – have separately authored detailed papers articulating their suggestions for a privacy legislation. In addition, many civil society organisations, including CIS, have generated several articles and published recommendations as to the shape that this legislation should take.16 Broadly speaking all these recommendations have drawn on global best practices and on the core data protection principles articulated by the Organisation for Economic Cooperation and Development (OECD) in 198017 to suggest a framework generally aligned with the way countries around the world think about privacy. They suggest that personal data belongs to the data subject and any use of this personal data by any other person can only be done with the consent of the data subject. In the consent model that underlies the right to data privacy outlined in the previous chapter, data subjects are vested with the power to determine whether their personal data can be collected, processed and/or shared. The model assumes that the data subject is best placed to evaluate for himself whether the proposed collection and use of his personal data by the data controller is acceptable. It contemplates the creation of a contractual relationship between data subject and data controller under the terms of which consent is provided by the data subject and the data controller proceeds to process the data based on that consent. However, as we have seen above, it is increasingly difficult for the data subject to make this determination effectively. No matter how much information he is provided, it is impossible for him to truly understand how databases will interoperate and whether, if his data is passed through a machine learning algorithm, that sort of processing will negatively impact his privacy. Equally, given the volume of data being collected and the ubiquity of collection devices, it is virtually impossible to enter into a contract with everyone who or everything that collects data. A contract based consent model is therefore ineffectual. Instead we propose the establishment of a new rights based privacy framework that guarantees to all data subjects, a set of inalienable statutory rights regarding data that pertains to them. Data controllers shall be obliged to ensure that, in processing this data, they do not do anything that would result in a violation of any of these privacy rights. The broad features of this new model have been described below. Data Rights All data subjects shall have a set of statutory rights regarding their personal data. These rights shall be exercisable by the data subjects against any person who holds or controls any data that pertains to them. The data rights exist in relation to all data that pertains to the data subject without reference to whether such data is personal or sensitive. Data controllers shall not be required to obtain prior consent before collecting or processing data but shall be obliged to ensure that while collecting and/or processing any data pertaining to the data subjects they shall be responsible for ensuring that no data rights of the data subject are violated because of the way the data is collected or processed. The data rights shall include the following: 1. The Right to Fair Treatment. The data subject has the right to be treated fairly and without bias when a data controller makes a determination about the data subject by processing any data. 2. The Right to Information. The data subject has the right to information about all data pertaining to that data subject that is possessed by or under the control of a data controller. The data subject shall have the right to know what use any such data has been put to as well as the persons with whom such data has been shared or to whom access to such data has been provided. The data subject has the right to require the data controller to correct any errors or omissions in the data that is within the control of the data controller if such errors or omissions are verifiably true; 3. The Right to Data Security. The data subject shall have the right to be assured of the security of his data at all times. Any data pertaining to the data subject that is in the possession or under the control of the data controller shall be maintained in a secure environment and processed, used or transferred only using secure practices and procedures. 4. The Right Against Processing. Any data subject who does not want his data to be processed by the data controller should have the right to require the data controller to stop processing his data forthwith. This right could be exercised in a granular fashion if the data controller presents to the data subject details of the manner in which his data is being processed by the data controller. The rights based privacy model does not require the data subject to formally consent each time that data is collected. The data controller must, nevertheless, ensure that when it processes or otherwise deals with the data pertaining to the data subject it does so without violating the rights of any data subjects. The model presumes that the data controller, is more likely than the data subject to be aware of the purposes to which the personal data will be put, whether it is likely to be fed into a machine learning algorithm and if so what parameters the information will be processed against. Types of Harm The data controller must be held accountable for all consequences suffered as a result of the violation any of the data rights of the data subject. In order to do so, it is important to establish what, in the context of this new paradigm, constitutes harm. In this context, the following types of harm could be considered: 1. Financial harm. This type of harm is caused when, as a consequence of processing of data, its transfer or due to a security breach, any data of the data subject is used in such a manner as to cause the data subject direct or indirect financial harm. Indirect financial harm is defined as any harm that could be quantified in financial terms even if it does not directly result in financial loss. 2. Reputational harm. This type of harm is caused when as a consequence of processing of data, its transfer or due to a security breach, any data of the data subject is used to impair the reputation of the data subject that results in intangible harm being caused to the reputation and social standing of the data subject. As a consequence of such harm, the data subject may find it hard to get a job, may be persecuted for criminal acts perpetrated in his name or otherwise shunned in society. 3. Harm due to Manipulation of Choice. This type of harm is caused when data about a data subject is used in order to limit the choice available to the data subject whether in terms of the information that the data subject has access to or any products or services that it is able to avail of. In the context of this harm, the data right to fair treatment must be applied so that the data processor strikes a balance between presenting the data subject with recommendations for his consideration and completely denying the data subject access to information, products and services outside of these suggested recommendations. 4. Harm due to Discrimination. This type of harm is caused when data is processed in such a manner as to unfairly discriminate against a data subject in terms of the products or services that such data subject is entitled to. In the context of this harm, the data right to fair treatment must ensure that discrimination should not be caused due to the processing data that bears no demonstrable relationship to the purpose for which the processing takes place. Types of Harm In all instances in which harm has been caused, the data controller who is responsible must, in the first instance, remediate the harm caused. If such remediation is not possible the data controller must be made liable to compensate for the harm caused. In the event of a data breach, the data controller must issue a data breach notification (including with respect to suspected data breaches) within 24 hours of discovering that it has occurred. In the event of harm caused as a result of improper processing, the data controller must be obliged immediately rectify the algorithm or other process that was the cause for the improper procession and shall notify all data subjects who might have been affected as a result. The data controller should, additionally, be required to take appropriate steps necessary to reset the record so that the data subject can be returned to the position that existed prior to the occurrence of the reputation loss. Since modern databases are inter-connected with each other, it is possible that even without consciously transferring data, numerous data controllers have access to a given data set and therefore might have contributed to the harm caused to the data subject. In such event, where it is not possible to conclusively determine that the harm caused to the data subject is on account of a single data controller, all the data controllers who may have been responsible shall be made jointly and severally liable for the consequences. In order for an accountability based data protection framework to be effective, it is important that the data controller is aware that the consequence for failing to meet its fiduciary obligations is severe. The European GDPR stipulates penalties for a failure to comply with data protection obligations in the order of 5% of the global turnover of the organisation. In order to make an accountability based law truly effective, penalties of a similar magnitude must be included. In an accountability based privacy framework, it is critical that the consequences of a failure to comply with fiduciary obligations should be sufficiently stringent to ensure that data controllers take their fiduciary responsibilities seriously. Learned Intermediary While the new privacy framework imposes on the data controller, a fiduciary obligation to protect the privacy of the data subject, that, of itself, may not be a sufficient to ensure compliance. Since harm to the data subject could take place over an extended period of time, there is a risk that it could remain undiscovered unless the actions of the data controller are actively monitored. Harms caused by machine learning algorithms are often the result of bias inherent in the algorithm. This bias is often so hard to detect as to put the very process of determining whether or not there has been a breach of the fiduciary obligations beyond the technical capabilities of most people to assess. In order to address this concern, it is proposed that a class of learned intermediaries be created who are technically capable of evaluating the output of machine learning algorithms and detecting bias on the margin. These learned intermediaries will be tasked with approaching their responsibilities from an assurance rather than a control perspective looking to review the algorithms with the fundamental objective of making them stronger and more privacy preserving rather than approaching simply pointing out problems in its functioning. It is proposed that the learned intermediaries will adopt the following staged approach to the review of the operations of the data controller. 1. Queries to Databases. Data controllers can be required to publish the queries that they make on the databases within which the data that they hold on the data subjects reside. Disclosure of this information will not detrimentally affect their proprietary rights over their algorithms but this sort of a review will be able to detect bad actors who are querying the database for information that has no bearing on the purpose for which the data processing is being carried out. 2. Black box audit. Data controllers could be required to make themselves and their algorithms accessible to the learned intermediaries, for a black box audit where the actual algorithms of the data controllers will not be reviewed, but instead the input data will be analysed against the output of the algorithms in order to verify whether in actual fact the algorithm is performing in a privacy preserving manner. This mechanism is designed to strike the balance between the auditability of the algorithm the one hand and the need to preserve the proprietary advantage of the data controller on the other. 3. Access to Algorithms. In the event that it appears that the algorithms of the data controller could be operating in a manner that affects the data rights of the data subject, the data controller could be required to provide the learned intermediary with access to its algorithms. Where possible such access could be provided by using open source algorithms that are designed to make their workings visible for inspection while at the same time preserving the proprietary details of the algorithms in the interests of the data controller. It is anticipated that in time, data subjects will flock to those data controllers whose algorithms are consistently certified by learned intermediaries as being privacy neutral creating an appropriate incentive for the data controller that is aligned with the principle of accountability. Security One of the principal obligations of the data controller under this new accountability based privacy framework is to ensure that data subject’s right to data security is preserved. Data security should be addressed in terms of both physical security as well as technical and operational security. Sufficient work has been done around the world to articulate these standards and it would be appropriate to include reference to those provisions within the new framework. The framework should also have appropriate mechanisms to ensure that security standards as articulated are responsive to changing technology. To this end, the new framework must contemplate the creation of an advisory board that comprises persons skilled in their understanding of data security measures who will be able to consistently contribute to the evolution of these standards. Compliance with these standards must be the subject of regular audit that should fall within the remit of the learned intermediaries. Redress It is important that the new privacy framework have an effective system of redress in order to ensure that data controllers who breach the data rights of a data subject are in fact held liable for harms they cause. In the first instance, it is important to establish a regulator (or Data Commissioner), vested with the broad responsibility of developing and implementing appropriate standards of accountability and transparency and enforcing them among data controllers. In this regard, the Data Commissioner would be expected to update the standards of accountability regularly (in no event less frequently than annually) to take into account advances in technology. In addition to this, primary administrative responsibility the Data Commissioner will also serve as the principal adjudicative functionary in the new privacy framework. In the event the report of a learned intermediary indicates that a data controller is processing data in a manner that causes harm to the data subject, or if a data subject complains about harm caused to him as a result of improper processing, the Data Commissioner will be empowered to investigate the matter and make a determination as to whether or not such harm was caused. The Data Commissioner will have the power to pass appropriate orders to ensure that the harm is reversed or compensated for as the case may be. In this regard, the damages awarded by the Data Commissioner can, under no circumstances, exceed 5% of the global turnover of the entity in question. The new privacy framework should establish technology enabled protocols for processing complaints and data subjects should be encouraged to use these online mechanisms to obtain redress. Since the protection of privacy will largely be secured through digital means the Data Commissioner should operate in a manner that allow greater flexibility and ensures the removal of bureaucracy. More thinking will be required in relation to the design of the regulator, the nature of its accountability, governance framework within which the regulator will operate, and the process through which the regulator may make further regulations. Applicability to the State The new privacy framework should apply equally to the government and agencies and instrumentalities of the state as it does to private entities. To that extent, the term data controller would apply to any entity whether in the public sector or the private sector, that collects information from a data subject. Most data protection statutes around the world have exceptions built into the statute to allow law enforcement to access personal information in furtherance of a criminal investigation and for security agencies to access this information in the interests of national security. These typically operate as exceptions to the principle of consent. Under the proposed model, there is no requirement to procure consent before accessing data about a data subject and to that extent there is no need to expressly articulate this exception. In this connection, the new data protection frameworks should stipulate that the government is obliged to ensure that whenever they access personal information in the interests of national security or in the course of their investigation of a crime, they should be obliged to ensure that they do not cause any harm or otherwise violate the data rights of the individuals associated with the investigation. For instance, care should the taken to ensure that investigations do not end up as fishing expeditions that violate the personal privacy of a wide swathe of persons only tenuously connected with the investigation. However, it is possible that the State may seek exceptions to breach the data rights of data subjects in certain special circumstances such as in relation to national security and in pursuance of the investigation of a crime. In order to ensure that even under these circumstances the government protects the data rights of its residents, it might be useful to consider the establishment of a special court (along the lines of the FISA court in the USA) that will grant prior approval for the conduct of broad investigations that would affect the privacy. This court’s primary job will be to judicially assess whether the decision of the investigative agency to pursue a line of investigation that could potentially affect the data rights of a wide swathe of data subjects is justified or not. In arriving at that conclusion the special court will evaluate whether the data sought to be collected suits the purpose and whether collection is limited to what is necessary to fulfil that purpose. The court could also satisfy itself about which agencies and third parties the data will be transferred to. The Data Commissioner could be an ex officio part of this court. G Blueprint for a regulatory sandbox The committee and technology subcommittee have developed a tailored design blueprint for India’s sandbox, based on extensive dialogue with the industry, including incumbents, start-ups, sector experts, and regulators. Approach We have taken a bottom-up and top-down approach to design the blueprint of the Regulatory Sandbox. Bottom-up, we have consulted with 50+ sector experts, industry players, investors, legal experts, and regulators. These consultations aimed to gather answers to the following questions: 1. Supply side: How can an enabling regulatory framework be achieved through the proposed sandbox? 2. Demand side: Does the sector face regulatory barriers and can the sandbox help overcome those barriers? Members of the technology subcommittee studied the global regulatory sandboxes through in-person immersion visit(s) to FCA sandbox in U.K., and consultations with the Singaporean, Malaysian, and Indonesian sandboxes. Secondary research was conducted for the other four sandboxes. The main goal was to understand: 1. What are the services these sandboxes offer? 2. How are risks to consumers and markets contained? 3. Are there any lessons from these sandboxes, in terms of staffing, governance, roadmap, etc. that the Indian sandbox could learn from? Vision, Mission, and Guiding Principles Vision: A fit-for-purpose regulatory framework that enables fintech innovation leading to the accelerated development of financial products and services customised to the unique needs of Indian households. The vision has two key components: 1. A regulatory framework that enables fin-tech innovation: The role of the regulator is to play the “enabler” by promoting innovation in the financial services while simultaneously safeguarding against risks to market and consumers. 2. Customised to the unique needs of Indians households: The framework should promote development of products and services which suit the unique needs of Indian households and are easily accessible to them. Mission: The sandbox will be a platform for contained experimentation to generate empirical evidence for regulatory decisions for financial products and services currently facing regulatory uncertainty The mission has three key components: 1. Platform for contained experimentation: The sandbox will be a platform for entrepreneurs, fintech start-ups, financial service providers and regulators to test products and services with limited number of live consumers in a contained environment. 2. Empirical evidence for regulatory decisions: Experiments conducted in the sandbox will equip the regulator with empirical evidence on potential risks and benefits to consumers and market from the intended financial product or service. 3. Regulatory uncertainty: The sandbox will focus on products or services for which there exists a regulatory barrier to deployment in the market. It will also focus on products or services which are unaddressed by existing regulations leading to regulatory uncertainty. Guiding principles In addition to the vision and mission, the blueprint of the sandbox will be based on the following guiding principles: 1. Consumer-centric. The sandbox will work on projects which lead to better financial services for Indian households through customised financial products and services. It will allow products, such as payments, pension funds, mutual funds, loans, etc., for experimentation. 2. Regulator backed but independent. The sandbox will be aligned with the regulators’ mandate but will operate as an independent unit. This will ensure the sandbox functions as a nimble yet embedded unit. 3. Metrics driven. The sandbox will provide recommendations based on pre-defined metrics to measure the success of the individual experiments. The metrics will reduce subjectivity in recommendations and use the learnings to influence the path forward. Defined metrics will also be used to assess overall performance of the sandbox and the results will be used to modify agenda and operations as required. 4. Agile. The focus of the sandbox should be adapted to reflect the the needs of the regulator, based on the assessment of the current state of the financial services industry. 5. Plan big, start small. The sandbox should be set-up with an ambitious long-term vision but should start small with a narrow focus, i.e., household finance, to avoid goal dilution in the early years. The sandbox facility will allow contained testing with consumers in cases where there is a pertinent regulatory uncertainty or hurdle that is preventing innovation to improve the financial lives of the underserved household. We believe such a Sandbox meets the two central tests for setting up a new entity: Relevance: Testing in the sandbox will be relevant for the regulator since it generates data to support regulatory decision-making process. Further, the experimentation feature will also be relevant for industry players as our research and consultations with the financial services industry shows that there is a rich canvas of innovative use cases that could be catalysed through testing. Additionality: A sandbox established by regulators will be able to provide regulatory flexibility for experimentation. A regulator-backed sandbox cannot be substituted by any existing or future platform since temporary regulatory flexibility can only be granted by the relevant regulator. The Sandbox will engage periodically with all types of firms, industry players, and individuals who provide relevant financial products and services. The outcome of the Sandbox is to generate evidence for new technologies or processes. This is inherently agnostic to the type of entities proposing the new technology or process. Hence, the participant’s admission to the Sandbox will be determined by alignment with eligibility criteria of the Sandbox rather than the type of entity. Participants will be engaged periodically in cohorts to ensure efficiency and effectiveness of the Sandbox’s operational and marketing efforts. The engagement process will span five stages listed below with their objective(s): 1. Preliminary screening: To eliminate non-serious applications that do not meet the basic eligibility criteria of the Sandbox. 2. Test design: To ensure that (1) sufficient consumer and market safeguards are in place to mitigate test risks and (2) ensuring that the test is “set up for success'. 3. Application assessment: To shortlist participants for testing and request the regulator(s) for necessary regulatory modifications for testing 4. Testing: To generate empirical evidence for assessing the test 5. Post-testing: To provide recommendations to the relevant regulator(s) based on the outcome of the test Across these stages, the participants will constantly engage with case officers of the Sandbox. Case officers are part of the management team who will be single point of contact for the participants throughout the sandbox application and test process. The case officers will liaise with the sandbox’s Governing Council, comprising senior members from regulators, and Executive Committee, comprising the CEO and four regulatory nodal officers (see the section on Governance for further details). Consumer protection is paramount and existing consumer protection norms will prevail during testing in the Sandbox. In case the regulatory modification affects existing rights of the consumer, additional safeguards will be identified during the test design process. Additionally, the participant will have a fiduciary responsibility to upheld consumer rights, and the Sandbox will monitor this closely. Stage 1: Preliminary screening In stage 1, the executive committee and case officers will shortlist applications, as per the eligibility criteria. The eligibility criteria ensures that only those applications are processed that could potentially further the mission of the Sandbox. In this stage, the Sandbox will use four basic eligibility criteria for shortlisting applications: 1. Alignment with the focus of the Sandbox: The application should provide an overview of the test stating how the proposed test is in alignment with the stated focus of the Sandbox. 2. Potential for impact: The application should highlight the existing gap in the ecosystem along with nature of direct benefit for consumers or the market. 3. Additionality of the Sandbox: The application should be able to justify that there is regulatory uncertainty that is preventing the applicant from deploying the product or service offering at scale. This could arise in two situations: a) If the applicant believes that there is a pertinent regulatory barrier that prevents deployment of the product or service at scale. b) If the applicant is offering a genuinely innovative product or service which is currently outside the purview of the regulation but will be systemically important for the regulator(s) soon. 4. Stage of the product or service: The application should state if the product or service is ready for deployment in the market. If not, then the application should state convincingly, if the product or service will be ready by the time the test is expected to commence. In addition to the application, the applicant will be required to pay a nominal fee. This will ensure that non-serious applicants are weeded out. Based on the evaluation of the application, three pathways can emerge. First, if the Sandbox feels that the test could provide evidence for modifying or drafting regulations, it will ask the applicant to submit a detailed proposal for the second round of assessment. Second, for those applications, where the Sandbox feels that there is some regulatory ambiguity but no need for testing, it will provide non-binding regulatory clarification. Lastly, the Sandbox may outright reject the application if it does not meet the eligibility criteria. We expect this stage to last 4-6 weeks where the applicant will submit the application and the Sandbox will evaluate the applications for the next stage. Stage 2: Test design In this stage, the Sandbox and applicant will collaborate to finalise the test design for assessment. The case officer and applicant will finalise the following parameters: 1. Test design: The case officer and applicant will deliberate on the objective of the test and the process that will be followed during the test duration. Key parameters of the test design are as follows: • Consumer selection. Targeted consumer segments (across key demographic variables such as age, gender, geographic location etc.) and acquisition strategy. • Benefits and risks to consumers or market. Expected benefits and risks to consumers and markets, quantum of impact and exposure, and relevant safeguards for identified risks. • Boundary conditions. Limits of the test designed to safeguard the identified risks, such as maximum number of consumers, transaction value per consumer, duration of testing, geographic focus etc. The boundary conditions should be significant to achieve the outcome but conservative enough to control risks. • Capability to execute. Applicant’s technical, operational, and financial capability to carry out the test along with supporting financial and incorporation documents. • Exit strategy. A plan of action once the test ends, which includes a transition plan if the regulation is modified or drafted, and if the regulation status remains unchanged. 2. Results. The case officer and applicant will decide on monitoring plan for the test for outcomes and risks. • Monitoring plan for outcomes. The application should state the metrics, threshold of success and reporting requirements for success outcomes identified. • Monitoring plan for risks. The application should state the metrics, threshold of success and reporting requirements for identified risks to consumers, market, and the test. 3. Communication. The case officer and applicant will finalise a communication plan after the test has been concluded. • Knowledge Dissemination Strategy. The application should state the plan for sharing of findings with the broader ecosystem. The case officer will engage closely with the applicant through extensive dialogue to understand the test in detail. The case officer should be convinced that there is sufficient value, i.e. potential for impact, in allowing the test and all risks associated with the test have been identified, and guarded against. The onus is on the case officer to leverage the regulatory expertise not only within the Sandbox but also within the regulators, to determine the strength of the applicant’s claims and identify the relevant risks and safeguards. Depending upon the number of iterations between case officer and applicant, we expect this stage to last a maximum of 3-4 weeks. The time to finalise the application may vary based on scale of test, nature of existing regulation and experience of applicants. Stage 3: Application assessment The assigned case officer will present the application to the executive committee and the governing council. In this stage, the case officer will vouch for the applicant in contrast to the previous stage where the case officer represents the Sandbox’s interests. This forms an adversarial system of assessment, which is key to ascertain the quality of testing. The executive committee will assess the application and the CEO will present the applications to the governing council. After the governing council provides the final sign-off on participants, it will request the relevant regulator to modify the relevant regulation, which is a pre-requisite to initiate testing. We expect the stage to last for 4-6 weeks contingent on regulatory modification for the test. To assess applications, the Sandbox will use the following five criteria (in addition to the four screening criteria identified earlier): 1. Risks to consumers or market. The test design has identified potential risks in sufficient detail, including not only those arising from the product or service being tested but also from the process of testing. 2. Boundary conditions and safeguards. Identified risks have been mitigated by setting in place test limitations such as transaction size, aggregate capital deployed, number of consumers etc. and other necessary safeguards. 3. Capability to execute. The applicant has the necessary technical and financial capability to execute the test. 4. Exit strategy. The potential participant has identified a time bound exit plan for the consumers in case the suggested regulatory objective is not met, and a deployment plan for the product or service in the Indian market. 5. Results. Appropriate and quantifiable indicators have been identified for benefits and risks. Stage 4: Testing In this stage, the case officer will intimate the Sandbox’s decision to the participant and subsequently the participant will begin to incorporate the relevant safeguards against consumer and market risks, as identified in the test design. The case officer will provide a final go-ahead for the participant if the Sandbox feels the test is ready to commence. During testing, the participant will be required to submit interim progress reports per an agreed schedule. The case officer will regularly monitor the developments to assess outcomes achieved, risk mitigation and conformity to test design. Additionally, if the Sandbox suspects there is something amiss, the officer may carry out appropriate random checks and ask the participant for clarification. Based on the assessment, the officer can suggest modifications for the next round of testing, if required. The Sandbox has the right to discontinue the test if it feels the test falls under any of the discontinuation requirements. After expiry of the test period, the test will stop automatically unless the Sandbox decides to extend the testing period for the test. The participant will be expected to comply with the exit parameters agreed in stage 2. The testing process is expected to last up to a maximum 24 weeks unless the Sandbox and participant agree on extension of the testing period. Stage 5: Post-testing The applicant will submit a final report to the Sandbox within 3 weeks of completion of the test containing overall findings and details of the test. The case officer will invite the applicant for a final discussion on the test and implementation of the exit strategy. The Sandbox will review the outcome of the test and provide a recommendation report to the regulator. The Sandbox can make three categories of recommendations: 1. Recommendation for change: If the Sandbox is satisfied that the test was successful, i.e. all measures of success were achieved, it can make a recommendation to the regulator for appropriate regulatory change. The regulator will then need to decide if it will approve the suggested changes, within a pre-specified period (suggested time is 6 months). 2. Recommendation for no change: If the Sandbox assesses that the test is unsuccessful, i.e., the measures of success have not been met, the test will be terminated and no positive recommendation will be made to the regulator. 3. Recommendation for further testing: If the Sandbox is not convinced that there is enough evidence to prove the need for regulatory change, it requests the regulator to extend testing for a longer duration. The Sandbox will share findings from the test with the financial services industry and regulators, while ensuring that no confidential information such as consumer data or proprietary information is disclosed. These findings will provide details on overview of the test, results and recommendation on regulatory change. The post-testing stage is expected to last for 6-8 weeks. Governance We recommend that an integrated inter-regulatory Sandbox be established that serves all financial regulators. We recommend this (as opposed to separate regulatory sandboxes for each regulator) for the following reasons. First, households do not view financial products and services in regulatory silos. An inter-regulatory Sandbox would thus be equipped to take a consumer-centric view of the benefits and risks of new products and services, injecting the much needed ‘voice of the consumer’ in regulatory decision-making. Second, many new products in the financial services domain are not restricted to these silos. We expect that there will be a number of products in the future, which cut across regulatory borders. Thus, the Sandbox approach marks a fundamental shift from the current ‘product-based regulation’ to ‘function-based-regulation’, in line with how the demand as well as the supply side is evolving. Governance structure We propose a three-tiered governance structure for the Sandbox. 1. Governing Council: • Composition: Chaired by the CEO of the Sandbox, with senior members from different regulators, i.e., RBI Deputy Governor, SEBI whole time member, IRDA whole time member, and PFRDA whole time member. • Function: Developing the strategy of the Sandbox, providing oversight and final approvals, and acting as a bridge between the Sandbox as well as each of the regulators • Capacity: Part time, expected to meet at least three times an year The governing council of the Sandbox could also be determined by the FSDC, or indeed governed by the FSDC itself. 2. Executive committee: • Composition: The CEO of the Sandbox, and 4 regulatory officials (Executive Director-equivalent from RBI, SEBI, IRDA and PFRDA) appointed as nodal officers to the Sandbox • Function: Providing regulatory expertise and professional management skills to operationalise the strategy of the Sandbox • Capacity: The CEO will be full time, and the nodal officers will be required to commit 4 days a month 3. Management team: • Composition: The Sandbox should identify the final strength of the team, once it has conducted marketing and outreach activities and has a sense of the potential interest in the Sandbox. This is a critical as requisite human resource capability will be required to process the large number of applications that the Sandbox is expected to receive. We expect the strength to be 3-6 case officers, along with one administrative assistant, from the experience in FCA, UK and MAS, Singapore • Function: Executing and overseeing the testing process and engagement with the industry • Capacity: Full time In addition, the Sandbox should have an Advisory Board whose composition is as follows: • Composition: The advisory board will be empanelled by the regulators in consultation with the governing council, and will include the following: – Sector experts, including eminent technocrats, senior finance practitioners, and technology experts. – Eminent academic experts in finance, economics, and related fields. – Senior government officials, including the Secretary of Department of Economic Affairs, Ministry of Finance (Government of India), CEO of National Payments Corporation of India, Chairman of Telecom Regulatory Authority of India, CEO of Unique Identification Authority of India, etc. • Function: Providing inputs on agenda setting, and facilitating linkages with other stakeholders • Capacity: Part time for a 2-year tenure. At any point in time, the Sandbox will tentatively have 5-7 full time staff, and will tap into a resource pool of 15-20 experts. We believe that the laid out engagement process and the three-tier inter regulator Sandbox will remain an agile and nimble institution (which is an important need expressed by the fintech community) for the following reasons: • Single point of contact: The participants will have a single point of contact with the sandbox, which will be the case officers, who will be professionals with 3-6 years of experience, working in, or closely with the fintech industry. • Time bound stages: Each stage of the application will have a time limit within which all activities pertaining to that stage will need to be executed. Similarly, it is suggested that the regulators take time bound action on the recommendations of the Sandbox. • Inclusive and transparent process: The Sandbox will ensure objectivity in decision making by relying on metrics and objective criteria. Further, the Sandbox will work closely with the participants at all stages and will provide rationales and clarifications at decision points. • Hierarchy of decision-making: Each governance tier has distinct roles and responsibilities, ensuring that only the strategic questions or decisions require the attention of the governing council and all operational activities or decisions remain in the purview of the management team. • Efficient decision rights: Using the RACI framework18 of decision rights, when the matter pertains to only one regulator, the concerned regulator has the approval rights, while the other regulators have consult rights. For example, if an applicant wishes to test optimal transaction size limits for one factor vs two factor authentication, the primary authority will lie with the nodal officers from RBI in the executive committee and the RBI representative in the governing council. Representatives from SEBI, IRDA and PFRDA will also be consulted regarding the findings of the test to establish a common view across all the regulators. However, the final authority of suggesting recommendations in this particular jurisdiction will rest with the institution responsible for the regulatory area in question. In contrast, if a test has implications that crosscut regulatory regimes (for example, establishing common OTP based KYC norms for all financial products and services), the governing council will need to come to a consensus regarding the final recommendations. Legal form and mandate The institutional and legal set up of the Sandbox entity should ensure an organic link to the regulators; a mandate and culture of innovation; find capacity to hire professional management (i.e. it should enjoy an arms length distance from all regulators to ensure objectivity in decision-making and operations, including the pay-scales that it may offer among other factors). We looked at a range of potential legal forms (Section 8 Company, Trust, Subcommittee of the FSDC, Statutory body) and recommend setting up the Sandbox as a company under section 8 of the Companies Act, 2013.19 All the four regulators may hold shares in equal proportion in this company. This is ideal because: 1. It allows the Sandbox to be set up independently as a service provider, which can be employed by all the regulators for its services. 2. It allows flexibility in recruiting relevant professionals, including offering market linked salaries. 3. It is the simplest and fastest to execute. Legal mandate The suggested legal form of the Sandbox, i.e. a section 8 company, does not provide it with the ability to amend or modify any regulations. Providing the temporary waiver will always remain the mandate of the relevant regulator. Hence, it is important to ensure that the legislation constituting the regulator should provide them with the authority to grant relaxations in the form of amendments, waivers, or additions to the rules or regulations issued by them for the purpose of conducting pilots. We recommend that the legal mandate be established by identifying the relevant enabling provisions within the current powers. For instance, as per Section 11 of the Securities and Exchange Board of India Act, 1992, SEBI has the power to protect the interests of investors in securities and to promote the development of, and to regulate the securities market, by such measures as it thinks fit. Similarly, under Sections 1820, and 10 (2)21 of the Payment and Settlement Systems Act, 2007 (PSSA) grants the mandate to RBI for tests related to payment systems. Section 18 of the PSSA has been invoked by the RBI in relation to issuing directives for the regulation of merchant discount rates22, opening and operation of accounts and settlement of payments for electronic payment transactions involving intermediaries23, migration by banks from magnetic stripe cards to issuance of EMV chip and PIN based cards for ATM infrastructure24, etc. Similar enabling provisions in the governing legislations of IRDAI and PFRDA, and other relevant acts of the RBI will need to be identified or included. Alternately, the legislation that constituted these four regulators could be amended to include the relevant clauses to allow the regulators to be able to temporarily relax regulatory norms. Launch plan To mobilise the Sandbox effectively, we recommend the regulators focus on a few high-priority activities. These will be essential in ensuring that the Sandbox is launched smoothly and on time. These activities should be led by a regulatory representative designated by the FSDC, until the CEO of the Sandbox is hired. These include: 1. Establish the legal entity: The regulators should establish the Sandbox so that the entity is up and running, and has the required legal mandate to discharge its functions. 2. Identify appropriate housing, and provide budgetary approvals: Once the legal entity is set up, the regulators should identify the required physical space, where the Sandbox will be housed, and provide necessary budgetary approvals to release funding. 3. Appoint Governing Council and hire top staff: The regulators should identify and appoint members to the governing council, as well as the CEO of the Sandbox. Making these appointments early will ensure that Sandbox team has enough time to focus on strategic priorities of the Sandbox. 4. Identify the agenda for year 1: Within the first month of mobilising the team, the Sandbox should identify the agenda and focus year for the first cohort. This should be effectively communicated to the fin-tech community to ensure that start-ups have enough time to prepare their applications, and are ready for the first cohort. 5. Launch marketing and outreach campaign: Once the entity is set-up, there should be a concerted effort at promoting the Sandbox, and carrying out extensive outreach activities. This will be crucial in spreading awareness about the functions of the Sandbox, as well as garnering interesting in the ecosystem. 6. Mobilise the team: Gauge interest in the Sandbox to estimate the number of potential applicants, and initiate recruitment of case officers. H List of Committee meetings Below, we list the external attendees at each of the committee meetings held at the Reserve Bank of India, Mumbai: | First Meeting | | Shri R.R. Nerurkar | Reserve Bank of India (RBI) | | Ms. Latha Vishwanath | Reserve Bank of India (RBI) | | Ms. Shyni Sunil, Manager | Securities and Exchange Board of India (SEBI) | | Shri. Ranjan Kumar Mishra, CGM(PB) | State Bank of India | | Shri V. S. Rangan, ED | HDFC Ltd. | | Ms. Deepti George | IFMR Trust | | Dr. Renuka Sane | ISI Delhi | | Shri P. R. Somasundaram, Managing Director | World Gold Council | | Ms. Rakhi Khanna, Director | World Gold Council | | Shri K.R. Bijimon, CGM | Muthoot Finance | | Shri Eapen Alexander, Director | Muthoot Finance | | Shri Ranjeet Mudholkar, CEO | Financial Planning and Standard Board of India (FPSB) | | Mr. Pushkar Chugh, CFP - Sr.VP, Knowledge Management | Financial Planning and Standard Board of India (FPSB) | | Mr. Alok Kumar, CFP - Sr.VP, Knowledge Management | Financial Planning and Standard Board of India (FPSB) | | Ms. Janaki Krishnan, Asst. Editor, Financial Planning Journal | Financial Planning and Standard Board of India (FPSB) | | Ms. Sucheta Dalal, Trustee | Money Life Smart Savers Network Pvt. Ltd. | | Shri Debashis Basu, Founder | Money Life Smart Savers Network Pvt. Ltd. | | Second Meeting | | Shri R.R. Nerurkar | Reserve Bank of India (RBI) | | Ms. Latha Vishwanath | Reserve Bank of India (RBI) | | Ms. Shyni Sunil, Manager | Securities and Exchange Board of India (SEBI) | | Shri Vimal Balasubramaniam | Oxford University | | Shri Varad Pande | Dalberg | | Shri. Vineet Bhandari | Dalberg | | Shri Alok Kshirsagar | McKinsey and Company | | Shri Prasad Lad | McKinsey and Company | | Ms. Smita Aggarwal | Omidyar Networks | | Third Meeting | | Shri R.R. Nerurkar | Reserve Bank of India (RBI) | | Ms. Latha Vishwanath | Reserve Bank of India (RBI) | | Ms. Shyni Sunil, Manager | Securities and Exchange Board of India (SEBI) | | Shri Sanjay Jain | iSPIRIT | | Shri Praveen Hari, Director - Alliances & Partnerships | iSPIRIT | | Shri Aniruddha Dange | IIFL | | Shri Subramanya S.V. | Fisdom | | Shri Adhil Shetty | Bank Bazaar | | Shri V. R. Govindarajan | Perfios | | Shri Kunal Verma | Money Trap | | Shri Abhishek Garg | Finomena | | Shri Apul Nayyar | Capital First | | Shri Gautam Bhardwaj | Pin Box Solutions | | Shri Naveen Khukreja | Policy Bazaar/ Paisa Bazaar | | Fourth Meeting | | Shri R.R. Nerurkar | Reserve Bank of India (RBI) | | Ms. Latha Vishwanath | Reserve Bank of India (RBI) | | Smt. Monika Halan | Livemint | | Dr. Cristian Badarinza | National University of Singapore | | Shri M. R. Kumar | Life Insurance Corporation of India | | Shri Antony Jacob | Apollo Munich Health Insurance | | Shri Tapan Singhel | Bajaj Allianz General Insurance | | Ms. Neera Saxena | The New India Assurance Co. Ltd. | | Shri Anand Pejawar | SBI Life Insurance Co. Ltd. | | Shri Varad Pande | Dalberg | | Shri Vineet Bhandari | Dalberg | | Fifth Meeting | | Shri R.R. Nerurkar | Reserve Bank of India (RBI) | | Ms. Latha Vishwanath | Reserve Bank of India (RBI) | | Shri Sanjiv Singhal | Scripbox | | Shri Sanjay Bhargava | Bharosa Technoserve Pvt. Ltd. | | Shri M. R. Krishnan | Consumer Association of India | | Sixth Meeting | | Internal meeting of the committee | |
Additionally, we thank Reuben Abraham, Viral Acharya, Montek Singh Ahluwalia, Rahul Ahluwalia, Franklin Allen, Santosh Anagol, Bindu Ananth, Vineet Bhatnagar, Barry Bosworth, John Campbell, Amit Chandra, Shawn Cole, Nehal Garg, Luigi Guiso, Stefan Hunt, Ahmed Nadeem Khan, Ben Knelman, Raghu Kolli, Uday Kotak, Hemendra Kothari, K.P. Krishnan, Nirupama Kulkarni, Ashok Lahiri, Vikram Limaye, Rebecca Mann, Rajnish Mehra, Prachi Mishra, Zia Modi, Nachiket Mor, Karthik Muralidharan, Sashank Narasimhadevara, Nandan Nilekani, Deepak Parekh, Nagapurnand Prabhala, Tushar Prabhu, Leo Puri, Manju Puri, Daniel Radcliffe, Raghuram Rajan, Ramesh Ramanathan, Manu Rikhye, Sanjeev Sanyal, Sudarshan Sen, Ajay Shah, Shekhar Shah, Tharman Shanmugarathnam, Robin Sherbourne, Nirvikar Singh, U.K. Sinha, T V Somanathan, Arvind Subramaniam, Susan Thomas, Usha Thorat, Kartik Verma, R.V. Verma, N.S. Vishwanathan, Anna Wallace, participants at the India Policy Forum 2016, the 18th Annual Neemrana Conference, and the IGIDR Workshop on Household Finance. We thank Rama Bijapurkar and Rajesh Shukla for access to the ICE 360 data. We also thank Hoang Minh Duy for excellent research assistance to the research sub-committee. The Chairman would like to convey his special thanks to Prof. Raghuram Rajan for setting up the committee. ________________________
BIBLIOGRAPHY Agarwal, Sumit, Shashwat Alok, Pulak Ghosh, Soumya Ghosh, Tomasz Piskorski, and Amit Seru, “Banking the Unbanked: What Do 255 Million New Bank Accounts Reveal about Financial Access?,” 2017. Akerlof, George A and Robert J Shiller, Phishing for phools: The economics of manipulation and deception, Princeton University Press, 2015. Allen, Franklin, Asli Demirguc-Kunt, Leora Klapper, and Maria Soledad Martinez Peria, “The foundations of financial inclusion: Understanding ownership and use of formal accounts,” Journal of Financial Intermediation, 2016, 27, 1–30. Anagol, Santosh and Hugh Hoikwang Kim, “The impact of shrouded fees: Evidence from a natural experiment in the Indian mutual funds market,” The American Economic Review, 2012, 102 (1), 576–593. –, Vimal Balasubramaniam, and Tarun Ramadorai, “The Effects of Experience on Investor Behavior: Evidence from India’s IPO Lotteries,” Available at SSRN 2568748, 2015. – ,– , and – , “Endowment Effects in the Field: Evidence from India’s IPO Lotteries,” Available at SSRN, 2016. Badarinza, Cristian, John Y Campbell, and Tarun Ramadorai, “International Comparative Household Finance,” Annual Review of Economics, 2016, 8 (1), 111–144. –, Vimal Balasubramaniam, and Tarun Ramadorai, “The Indian Household Finance Landscape,” 2016. Banerjee, Abhijit, Esther Duflo, Rachel Glennerster, and Cynthia Kinnan, “The miracle of microfinance? Evidence from a randomized evaluation,” American Economic Journal: Applied Economics, 2015, 7 (1), 22–53. Beshears, John, James J Choi, David Laibson, Brigitte C Madrian, and Katherine L Milkman, “The effect of providing peer information on retirement savings decisions,” The Journal of finance, 2015, 70 (3), 1161–1201. Bhattacharya, Utpal, Andreas Hackethal, Simon Kaesler, Benjamin Loos, and Steffen Meyer, “Is unbiased financial advice to retail investors sufficient? Answers from a large field study,” Review of financial studies, 2012, p. hhr127. Bose, Sumit, “Committee on Curbing Mis-selling and Rationalising Distribution Incentives in Financial Products,” 2015. Brandolini, Andrea, Luigi Cannari, Giovanni D’Alessio, and Ivan Faiella, “Household Wealth Distribution in Italy in the 1990s, Temi di discussione (Economic working papers) 530, Bank of Italy,” Economic Research Department, 2004. Burgess, Robin, Rohini Pande, and Grace Wong, “Banking for the poor: Evidence from India,” Journal of the European Economic Association, 2005, 3 (2-3), 268–278. Caballero, Ricardo J. and Arvind Krishnamurthy, “Global Imbalances and Financial Fragility,” American Economic Review, May 2009, 99 (2), 584–88. Campbell, John Y, “Does Saving Anticipate Declining Labor Income? An Alternative Test of the Permanent Income Hypothesis,” Econometrica: Journal of the Econometric Society, 1987, pp. 1249–1273. –, “Household finance,” The Journal of Finance, 2006, 61 (4), 1553–1604. –, “Richard T. Ely Lecture Restoring Rational Choice: The Challenge of Consumer Financial Regulation,” The American Economic Review, 2016, 106 (5), 1–30. –, João F Cocco et al., “Household Risk Management and Optimal Mortgage Choice,” The Quarterly Journal of Economics, 2003, 118 (4), 1449–1494. –, Tarun Ramadorai, and Benjamin Ranish, “Getting better or feeling better? How equity investors respond to investment experience,” Technical Report, National Bureau of Economic Research 2014. Célérier, Claire and Boris Vallée, “What drives financial complexity? A look into the retail market for structured products,” 2013. Chamon, Marcos D and Eswar S Prasad, “Why are saving rates of urban households in China rising?,” American Economic Journal: Macroeconomics, 2010, pp. 93–130. Choi, James J, David Laibson, Brigitte C Madrian, and Andrew Metrick, “Defined contribution pensions: Plan rules, participant choices, and the path of least resistance,” Tax policy and the economy, 2002, 16, 67–113. – , – , – , and – , “Optimal defaults,” The American Economic Review, 2003, 93 (2), 180–185. Chopra, Yakshup, Nagpurnanand Prabhala, and Prasanna L Tantri, “Bank Accounts for the Unbanked: Evidence from a Big Bang Experiment,” 2017. Cole, Shawn, Xavier Giné, Jeremy Tobacman, Petia Topalova, Robert Townsend, and James Vickery, “Barriers to household risk management: Evidence from India,” American Economic Journal: Applied Economics, 2013, 5 (1), 104–135. Deaton, Angus, “Saving in developing countries: Theory and review,” The World Bank Economic Review, 1989, 3 (suppl 1), 61–96. –, “Saving and Growth,” in “The Economics of Saving and Growth: theory, evidence, and implications for policy” Cambridge University Press 1999. –, “Franco Modigliani and the life-cycle theory of consumption,” PSL Quarterly Review, 2012. Demirgüç-Kunt, Asli, Leora F Klapper, Dorothe Singer, and Peter Van Oudheusden, “The global findex database 2014: Measuring financial inclusion around the world,” 2015. Divatia, VV, “Inequalities in Asset Distribution of Rural Households,” Reserve Bank of India Staff Occasional Papers, 1976, 1 (1). Domar, Evsey D, “Capital expansion, rate of growth, and employment,” Econometrica, Journal of the Econometric Society, 1946, pp. 137–147. Erb, Claude B and Campbell R Harvey, “The golden dilemma,” Financial Analysts Journal, 2013, 69 (4), 10–42. Feldstein, Martin, “Is Gold a Good Hedge?,” Project Syndicate, 2016. – and Charles Horioka, “Domestic Savings and International Capital Flows,” The Economic Journal, 1980. Friedman, Milton, “The permanent income hypothesis,” in “A theory of the consumption function,” Princeton University Press, 1957, pp. 20–37. Gan, Li, Zhichao Yin, Nan Jia, Shu Xu, Shuang Ma, and Lu Zheng, Data you need to know about China: Research Report of China Household Finance Survey, Springer Science & Business Media, 2012. Gaurav, Sarthak, Shawn Cole, and Jeremy Tobacman, “Marketing complex financial products in emerging markets: Evidence from rainfall insurance in India,” Journal of marketing research, 2011, 48 (SPL), S150–S162. Guillén, Mauro F and Adrian E Tschoegl, “Banking on gambling: Banks and lottery-linked deposit accounts,” Journal of Financial Services Research, 2002, 21 (3), 219–231. Halan, Monika, Renuka Sane, and Susan Thomas, “The case of the missing billions: estimating losses to customers due to mis-sold life insurance policies,” Journal of Economic Policy Reform, 2014, 17 (4), 285–302. –, – et al., “Misled and Mis-sold: Financial misbehaviour in retail banks?,” Technical Report 2016. Hall, Robert E, “Stochastic Implications of the Life Cycle-Permanent Income Hypothesis: Theory and Evidence,” Journal of Political Economy, 1978, 86 (6), 971–987. Harrod, Roy F, “An essay in dynamic theory,” The Economic Journal, 1939, 49 (193), 14–33. Hedesstrom, Ted Martin, Henrik Svedsater, and Tommy Garling, “Identifying heuristic choice rules in the Swedish premium pension scheme,” The Journal of Behavioral Finance, 2004, 5 (1), 32–42. Honohan, Patrick, “Household financial assets in the process of development,” World Bank policy research Working paper, 2006, (3965). Jayadev, Arjun, Sripad Motiram, and Vamsi Vakulabharanam, “Patterns of wealth disparities in India during the liberalisation era,” Economic and Political Weekly, 2007, pp. 3853–3863. Karlan, Dean, Jake Kendall, Rebecca Mann, Rohini Pande, Tavneet Suri, and Jonathan Zinman, “Research and Impacts of Digital Financial Services,” Technical Report, National Bureau of Economic Research 2016. –, Margaret McConnell, Sendhil Mullainathan, and Jonathan Zinman, “Getting to the top of mind: How reminders increase saving,” Technical Report, National Bureau of Economic Research 2010. Kaur, Balbir, “Report of Sub-Committee on Household Sector Savings,” Planning Commission, 2011. Kearney, Melissa Schettini, Peter Tufano, Jonathan Guryan, and Erik Hurst, “Making savers winners: An overview of prize-linked savings products,” Technical Report, National Bureau of Economic Research 2010. Kochar, Anjini, “An empirical investigation of rationing constraints in rural credit markets in India,” Journal of Development Economics, 1997, 53 (2), 339–371. Laibson, David I, Andrea Repetto, Jeremy Tobacman, Robert E Hall, William G Gale, and George A Akerlof, “Self-control and saving for retirement,” Brookings papers on economic activity, 1998, 1998 (1), 91–196. Lee, Samuel and Petra Persson, “Financing from family and friends,” Review of Financial Studies, 2016, 29 (9), 2341–2386. Levine, Ross, “Finance and growth: theory and evidence,” Handbook of economic growth, 2005, 1, 865–934. Lippi, Andrea, “Does menu design influence retirement investment choices? Evidence from Italian occupational pension funds,” Judgement and Decision Making, 2014, 9, 77–82. Lucas, Robert E, “On the mechanics of economic development,” Journal of monetary economics, 1988, 22 (1), 3–42. Lusardi, Annamaria and Olivia Mitchell, “Financial literacy and retirement planning in the United States,” Journal of Pension Economics and Finance, 2011, 10 (04), 509–525. – and Olivia S Mitchell, “How ordinary consumers make complex economic decisions: Financial literacy and retirement readiness,” Technical Report, National Bureau of Economic Research 2009. Madrian, Brigitte C and Dennis F Shea, “The power of suggestion: Inertia in 401 (k) participation and savings behavior,” The Quarterly Journal of Economics, 2001, 116 (4), 1149–1187. Malmendier, Ulrike and Stefan Nagel, “Depression Babies: Do Macro Economic Experiences Affect Risk Taking?,” Quarterly Journal of Economics, 2011, 126, 373–416. Mankiw, Gregory N, David Romer, and David N Weil, “A contribution to the empirics of economic growth,” Quarterly Journal of Economics, 1992, 107 (2), 407–437. Mobarak, Ahmed Mushfiq and Mark R Rosenzweig, “Informal risk sharing, index insurance, and risk taking in developing countries,” The American Economic Review, 2013, 103 (3), 375–380. Modigliani, Franco, “Life cycle, individual thrift, and the wealth of nations,” The American Economic Review, 1986, 76 (3), 297–313. Mohan, Rakesh and Muneesh Kapur, “Pressing the Indian Growth Accelerator: Policy Imperatives,” 2015. Mohanty, Deepak, “Report of the Committee on Medium-term Path on Financial Inclusion,” Reserve Bank of India, 2015. Mor, Nachiket, “Committee on Comprehensive Financial Services for Small Businesses and Low Income Households Report,” 2014. Mowl, Amy Jensen and Camille Boudot, “Barriers to Basic Banking: Results from an Audit Study in South India,” 2016. Philippon, Thomas, “The FinTech Opportunity,” Technical Report, National Bureau of Economic Research 2016. Pradhan, Narayan Chandra, “Persistence of informal credit in rural India: Evidence from all-India debt and investment survey and beyond,” WPS (DEPR), 2013, 5, 2013. Prasad, Eswar S, Raghuram G Rajan, and Arvind Subramanian, “Foreign capital and economic growth,” Technical Report, National Bureau of Economic Research 2007. Rajan, Raghuram G, “A hundred small steps: Report of the committee on financial sector reforms,” 2009. Rampini, Adriano A and S Viswanathan, “Household risk management,” Technical Report, National Bureau of Economic Research 2016. Rangarajan, C, “Report of the High Level Committee on Savings and Investment,” Ministry of Finance, Government of India, 2009. Ravallion, Martin, “Measuring aggregate welfare in developing countries: How well do national accounts and surveys agree?,” Review of Economics and Statistics, 2003, 85 (3), 645–652. Rodrik, Dani and Mark Rosenzweig, “Access to Finance Chapter 2, Handbook of Development Economics, Volume 5,” 2009. Romer, Paul M, “Increasing returns and long-run growth,” The journal of political economy, 1986, pp. 1002–1037. –, “Human Capital And Growth: Theory and Evidence,” NBER Working Paper Series, 1989, p. 3173. Sane, Renuka and Susan Thomas, “In search of inclusion: informal sector participation in a voluntary, defined contribution pension system,” The Journal of Development Studies, 2015, 51 (10), 1409–1424. – and – , “From participation to repurchase: Low income households and micro-insurance,” Technical Report, Indira Gandhi Institute of Development Research, Mumbai, India 2016. Sen, Abhijit, “Estimates of consumer expenditure and its distribution: Statistical priorities after NSS 55th round,” Economic and Political weekly, 2000, pp. 4499–4518. Shah, Ajay, “Indian pension reform: A sustainable and scalable approach,” Managing globalization: Lessons from China and India. New York, NY, World Scientific, 2006. Srikrishna, B.N., “Financial Sector Legislative Reforms Commission,” 2016. Srinivasan, TN, “Growth, poverty reduction and inequality,” in “European Annual World Bank Conference on Development Economics” 2000. Subramanian, S and D Jayaraj, The distribution of household wealth in India number 2006/116, Research Paper, UNU-WIDER, United Nations University (UNU), 2006. – and – , “The evolution of consumption and wealth inequality in India: a quantitative assessment,” Journal of Globalization and Development, 2013, 4 (2), 253–281. Sundaram, K and Suresh D Tendulkar, “Recent debates on data base for measurement of poverty in India: some fresh evidence,” in “Workshop on Poverty organised by the Indian Planning Commission and the World Bank (January 11-12)” Citeseer 2001. Sunden, Annika E and Brian J Surette, “Gender differences in the allocation of assets in retirement savings plans,” The American Economic Review, 1998, 88 (2), 207–211. Swarup, Dhirendra, “Committee on Investor Awareness and Protection,” 2010. Thaler, Richard H and Cass R Sunstein, “Nudge: Improving Decisions About Health, Wealth, and Happiness.” Vaidyanathan, A, “Asset Holdings and Consumption of Rural Households in India: A Study of Spatial and Temporal Variations,” Agricultural Development Policy: Adjustments and Reorientation, 1993. Virmani, Arvind and Surabhi Mittal, “Domestic Market Integration,” Indian Council for Research on International Economic Relations, New Delhi Working Papers 183, Indian Council for Research on International Economic Relations, New Delhi, India July 2006. Watal, Ratan P, “Committee on Digital Payments,” 2016. |