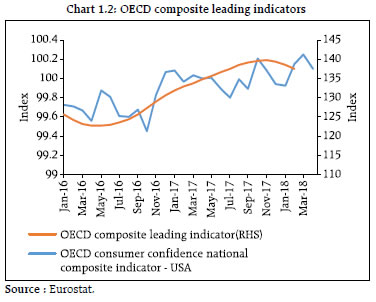
Global growth outlook for 2018 remains positive despite some recent softness. However, spillover risk from advanced financial markets to emerging markets has increased. Tightening of liquidity conditions in the developed markets alongside expansionary US fiscal policy and a strong US dollar have started to adversely impact emerging market currencies, bonds and capital flows. Firming commodity prices and geopolitical developments pose added risks. On the domestic front, while economic growth is firming up, conditions that buttressed fiscal consolidation, inflation moderation and a benign current account deficit over the last few years are changing, thereby increasing the downside risks. In the domestic financial markets, structural shifts are altering the pattern of credit intermediation and impacting market interest rates. These developments call for greater vigilance on the domestic macroeconomic front to reinforce financial stability. Global economy and the risks of spillover 1.1 The International Monetary Fund (IMF) projects global economic growth to be robust during 2018. Growth is expected to be broad-based with the advanced economies (AEs) growing above their potential and emerging markets and developing economies (EMDEs) also posting higher growth. Latest indicators such as Purchasing Managers’ Index (PMI) and Organisation for Economic Co-operation and Development (OECD) Composite leading indicators suggest some moderation in the underlying drivers of economic growth (Charts 1.1 and 1.2). On balance, however, the global economic growth outlook remains positive. Consequently, financial conditions in advanced economies have tightened (Chart 1.3). A stronger US dollar is rattling emerging market currencies. At the same time, crude oil prices, partly reflecting geopolitical risks, have firmed up. Thus, the underlying global macro-financial conditions coupled with geopolitical uncertainty have potentially increased spillover risk to EMDEs. 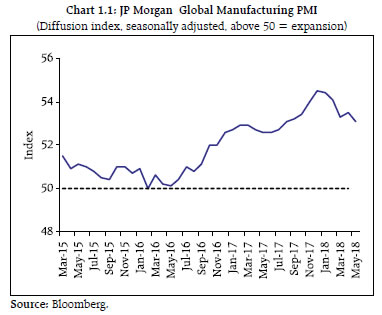
 1.2 The spillover risks may stem from four related developments : -
Supply of safe assets, -
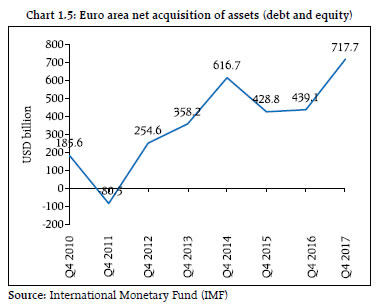
Protectionist trade policies, -
Commodity market behaviour, and -
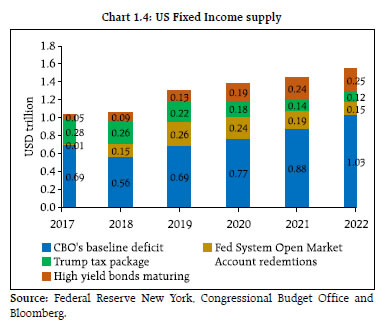
Direction of capital flows. i. Supply of safe assets 1.3 According to the US Congressional Budget Office (CBO), the recently announced reduction in the corporate tax rate in the US is expected to add US dollar 1.5 trillion to the US budget deficit over 10 years (Chart 1.4). This coupled with a shrinking balance sheet of the US Federal Reserve (FED) could be a significant near term risk to the market. While with the base line CBO projections, the aggregate US fixed income supply (excluding investment grade maturing bonds) moderately increase to US dollar 1.3 trillion by 2019, there are some expectations that it would be even higher at US dollar 1.5 trillion and US dollar 2 trillion in 2018 and 2019 respectively (including investment grade maturing bonds). Irrespective of the actual quantum of this issuance, the quantitative easing (QE) activities of the European Central Bank (ECB) and the Bank of Japan (BoJ) have significantly kept the US dollar risk-free interest rates and corporate spreads low so far, though the ECB’s intention to withdraw its QE by December 2018 is expected to have implications for global liquidity pool as there has been significant US dollar asset acquisition by European asset managers since 2010 (Chart 1.5). With a gradual normalisation of the global monetary policy, the impact of a substantial increase in supply of US dollar safe assets concurrent with a robust US fixed income issuance across high yield and investment grades poses risks of pushing treasury rates higher and corporate spreads wider while making prospects for the US dollar uncertain. 1.4 In the wake of these concerns, the US dollar liquidity of non-US borrowers requires specific attention. The latest Global Financial Stability Report (GFSR) highlighted a few emerging aspects of US dollar liquidity among non-US financial intermediaries. Some of these issues as well as emerging trends from market instruments are discussed in Box 1.1. 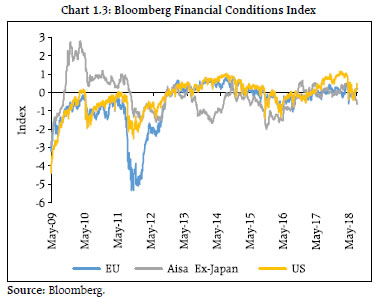
 Box 1.1: USD liquidity for non-US borrowers While the quantitative easing (QE) in ECB and BoJ has significantly helped in keeping US interest rates and credit spreads low, according to the latest Global Financial Stability Report (GFSR) there have been additional channels of demand for US dollar denominated assets for banks (both US and non-US) through commodities, energy, trade credit and corporate borrowers (especially in emerging market economies). The profile of US dollar liabilities for non-US non-financial entities shows that in Q4:2017 approximately one-third of non-US borrowers came from emerging markets (Chart 1). GFSR outlines the dominant role of non-US banks in the provision of US dollar credit and points to their dependence on short-term or wholesale dollar funding which makes their international US dollar denominated balance sheets structurally vulnerable to liquidity risks. According to the GFSR, US dollar liquidity ratios of non-US banks have improved since the global financial crisis (GFC) driven by US dollar high quality liquid assets (HQLA). However, the stable funding ratio as defined by GFSR remained largely unchanged during 2006-17. 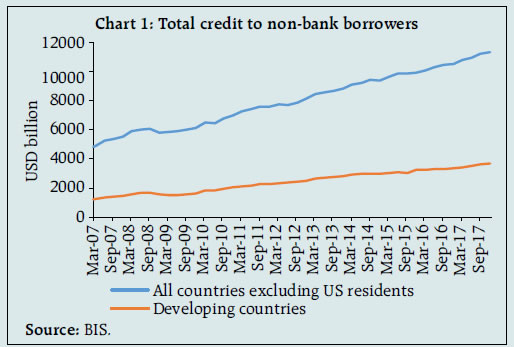
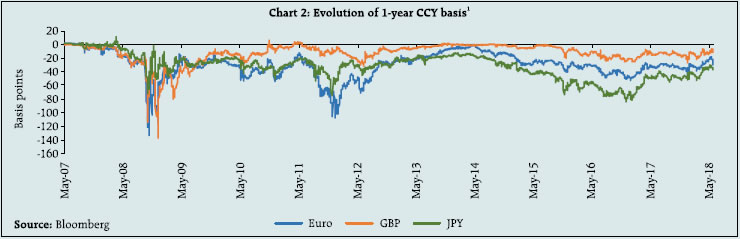
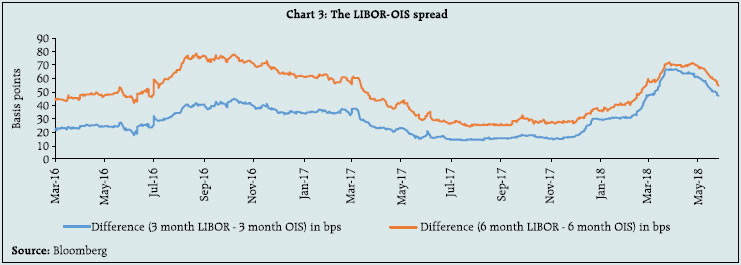
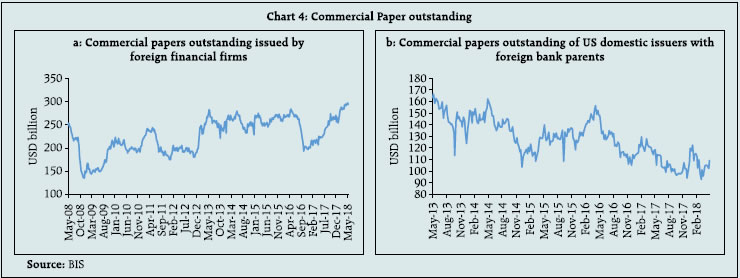 Cross-currency (CCY) basis swaps remained a major tool in hedging the funding mix or a significant source of US dollar funding for non-US borrowers. Hence, the basis in such swaps is a good indicator of the underlying stress in US dollar funding markets, specifically since with the implementation of reforms following GFC most such swaps are being centrally cleared and thus movement in basis is unrelated to the credit standing of the concerned banks. The movement in cross-currency basis swaps (1-year tenure) points to underlying demand for US dollar liabilities but the direction as yet points to lack of stress in rolling over such positions. In the wake of the financial crisis, US money market reforms enable asset managers to impose liquidity fees as well as to suspend redemptions during financial crises for funds holding less than 99.5 per cent of their assets in government securities. Implementation of these reforms from October 2016 resulted in the prime fund corpus reducing by US dollar 800 billion approximately from their January 2016 level, with commensurate increase in government funds, while tax-exempt funds’ corpus remaining mostly flat over the period. Such flows to treasury funds during end-2016 did impact the basis (Chart 2) as also the commercial paper (CP) issuance of foreign financial firms and that of US domestic issuers with foreign bank parents (Charts 4a & 4b). Interestingly, the introduction of US taxation reforms around December 2017 - which clearly had an impact on offshore US dollar liquidity - largely left the CCY basis un-affected and the LIBOR-OIS (Chart 3) basis wider. Nevertheless, the US dollar CP issuance programme of foreign financial firms has been strong so far (Chart 4a) and that of US domestic issuers with foreign bank parents have been recovering from the year end lows (Chart 4b). However, given the ongoing churning in currency markets and a febrile geopolitical atmosphere, the access for emerging market financial institutions to the US dollar liquidity pool may be fraught with challenges. References: 1. BIS, Global Liquidity Indicators, (April 30, 2018 update) 2. IMF (April 2018), The Global Financial Stability Report. | 1.5 A synchronised normalisation of global monetary policy with the US Fed leading the way is being reflected in global money market rates. ECB’s decision to wrap-up its QE policy by December 2018 is also expected to impact the available global liquidity pool. The current US Federal fund futures are pricing in 2-3 interest rate hikes for 2018 after the rate action in June 2018. Concurrently, the 3-month USD-OIS (Overnight Indexed Swap) which was at 1.2 per cent in September 2017 is currently being quoted at 1.93 per cent (as on June 13, 2018). The front end of the unsecured US dollar inter-bank funding curve has also widened as compared to their 2017 year–end levels relative to ‘risk free’ OIS curve of equivalent tenor (Chart 1.6). Normally such a widening implies elevated credit risk in the banking sector but in the absence of any specific credit related catalyst, this can be attributed to overseas cash repatriation by US corporations as financial markets are losing one of the biggest providers of funding at the front end. While the widening is showing some signs of reversion recently, developments on the unsecured funding curve have implications for US dollar funding costs for emerging market (EM) corporates and banks. ii. Protectionist trade policies 1.6 Driven by an investment-led recovery in AEs, global trade growth rebounded in 2017 after two years of weakening. However, notwithstanding talks of inward looking policies, trade intensity of global growth2 rose above 1 in 2017 (Chart 1.7a). The IMF Direction of Trade Statistics indicates that the decline in exports to AEs which was evident till January 2016 has been arrested (Chart 1.8). On the other hand, in the backdrop of growing trade tensions with the US, China posted a trade deficit in March which has, however, since been reversed (Chart 1.7b). Going forward changing protectionist rhetoric into reality could pose a significant risk to global growth.
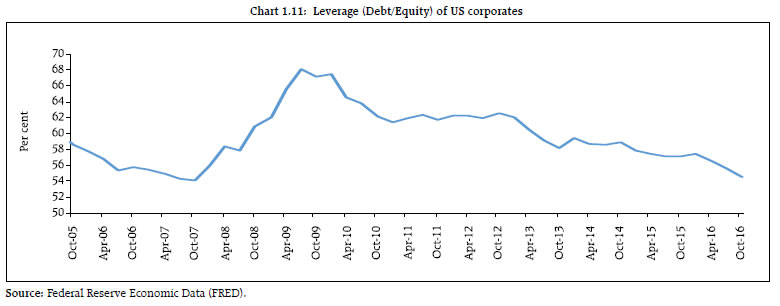
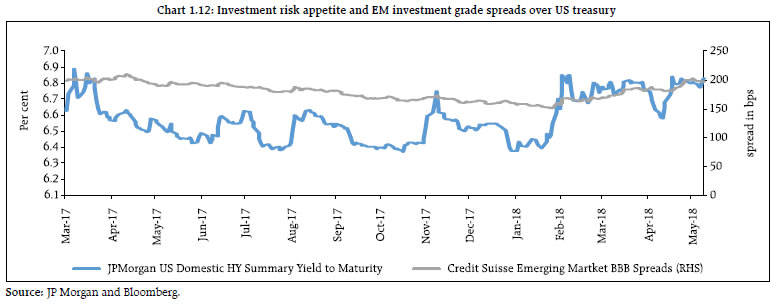
iii. Commodity market behaviour 1.7 Developments in global demand expectations over recent months coupled with emerging supply constraints, for instance reduced supply from Venezuela and Iran, have led to an escalation in crude oil prices. With regard to financial flows to commodities markets, while energy futures continue to receive a bulk of the cumulative flows, even agriculture commodities are seeing increasing investor interest of late although the price recovery in the agricultural sector appears to be muted at present. In the metals space, the recently announced sanctions by the US on certain Russian intermediaries appear to have led to short-term underpricing pressures in aluminum. Copper and nickel in particular seem to have reversed the declining trend in prices recently possibly owing to demand originating from electric car manufacturers (Charts 1.9 a and b). iv. Direction of capital flows 1.8 The re-pricing of risks after the recent spurt in global financial market volatility has materially affected risky credits (Chart 1.10). However, despite the partial retracement in the Volatility Index (VIX), this re-pricing in the high yield (HY) sector is particularly relevant notwithstanding the general reduction in leverage of the US corporate balance sheet (Chart 1.11). Further, EM investment grade credit has also undergone a re-rating (Chart 1.12). This may have implications for pricing of credit for EM corporates and overall capital flows to emerging markets. 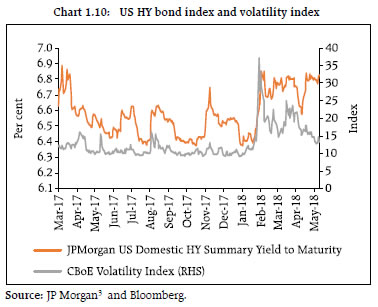
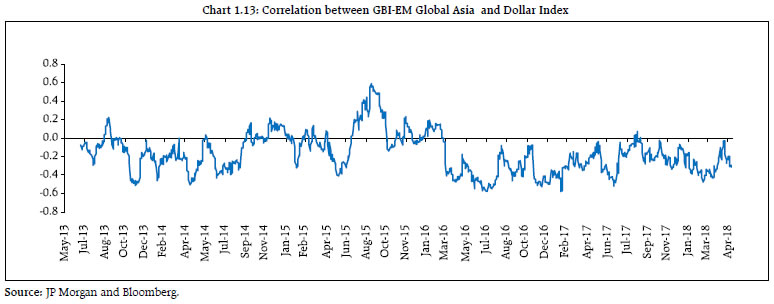 1.9 The 30-day rolling correlation between the returns on the JP Morgan Global Bond Index - Emerging Markets for Global Asia (GBI-EM, Asia, Traded Total Return Index) and the US dollar Index (Chart 1.13) show currency effects dominating portfolio returns. However, the correlation levels are far from their early 2017 lows (negative). The relative evolution of EM currencies vis-à-vis US dollar index (Chart 1.14) shows symmetric devaluation of both the indices recently. Recent trend shows ebbing of outflows from local currency EM bond funds. Nevertheless, incremental EM flows, remain an area of concern. Domestic macro-financial developments A. Growth 1.10 India’s gross domestic product (GDP) growth at 7.7 per cent in Q4: 2017-18 shows that the Indian economy is well on the recovery track (Chart 1.15a) on the back of a sharp pick-up in gross fixed capital formation (Chart 1.15b). Further, there has been an uptick in capacity utilisation (Chart 1.16) with some industries such as steel closing the gap. The aggregate demand composition indicates a broad-based growth with revival of investment.
B. Fiscal balance 1.11 The Government has shown a significant commitment to fiscal consolidation. Gross fiscal deficit of the Central Government was brought down from 4.1 percent of GDP in 2014-15 to 3.9 per cent in 2015-16 and further to 3.5 per cent in 2016-17, and remained at 3.5 per cent in 2017-18 (Chart 1.17). It is budgeted to decline to 3.3 per cent of GDP in 2018-19. There could, however, be challenges on the fiscal front unless there is a buoyancy in tax receipts and/or a restraint on expenditure. C. External balance i. Current account 1.12 The current account deficit widened in 2017-18 on the back of an increase in the trade deficit (Chart 1.18). During 2017-18, all major components of merchandise imports expanded (Chart 1.19). Going forward, increased domestic demand along with a worsening of the terms of trade, particularly due to rising crude oil prices, may impact the current account, although robust global growth is likely to boost India’s exports. 1.13 In the wake of widening current account deficit, cost-effective access of exporters to US dollar credit in particular assumes significance. Aggregate export credit increased moderately from ₹2,353 billion in March 2017 to ₹2,445 billion in December 2017 (provisional). In this regard, ensuring that Indian public sector banks have continuing access to global money markets is critical, as they contribute about 45 per cent of the export credit. Enhanced supply of export credit from private sector banks (PvBs), Foreign Banks (FBs) and Non-banking financial companies (NBFCs) could offset the potential adverse impact on trade credit.
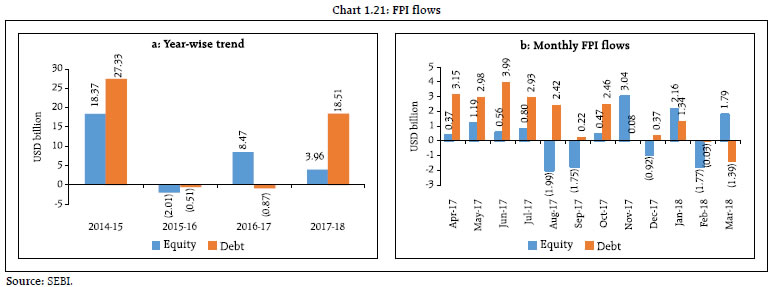
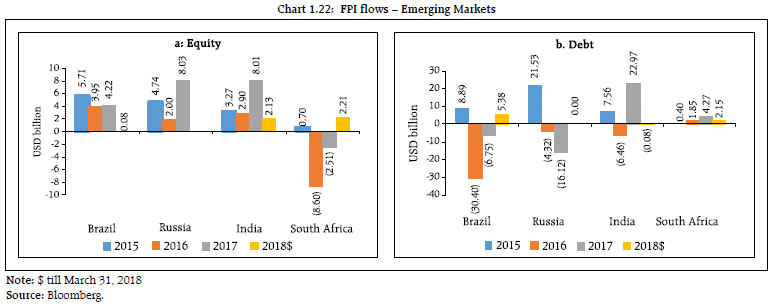
ii. Capital account 1.14 The relative valuation of Indian equities vis-à-vis its emerging market peers appears to be somewhat elevated in terms of forward P/E multiple (Chart 1.20). A gradual normalisation of global liquidity and a re-rating of risky assets imply that the earnings outlook will play a critical role in sustaining investor flows. 1.15 The first three quarters of financial year 2017-18 witnessed buoyant foreign portfolio investment (FPI) flows into the capital market with a greater preference for debt (Charts 1.21a and b). Subsequently, there has been a net capital outflow since February 2018. India, however, continues to outperform other emerging markets with regard to equity flows (Charts 1.22 a and b). More recent data with respect to FPI flows to emerging markets in general shows investor unease, specifically with regard to local currency debt as US interest rates firm up. 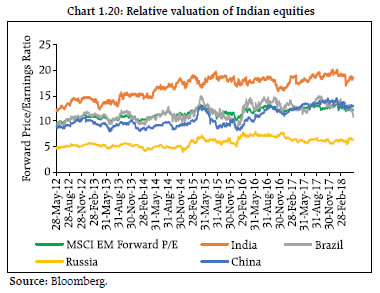
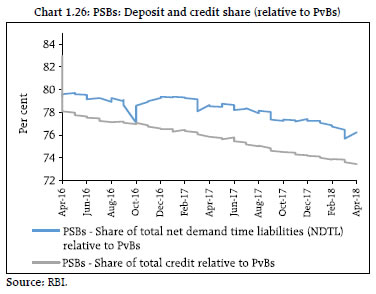
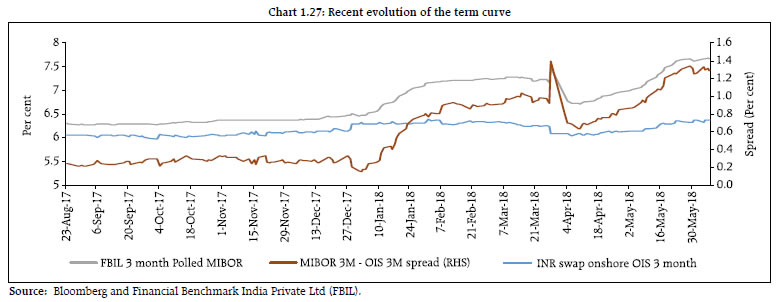
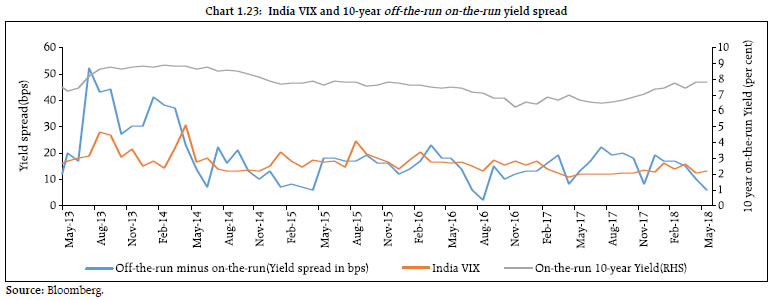 1.16 In this regard, the market pricing of sharp moves both in equity and in debt requires careful watch. Contemporaneous market indicators of volatility from equity markets (India VIX) and debt markets (10-year off-the-run minus on-the-run yield spread, unadjusted for tenor difference) show co-movements in stressed conditions. However, they are currently off the highs (attained in June 2013), implying an orderly market condition despite the gradual steepening of the short-term yield spreads (Charts 1.23 and 1.27). D. Shifts in market microstructure and credit frictions 1.17 There are efforts underway to bring transparency to banks’ balance sheets and the functioning of their boards so that government recapitalisation plans for public sector banks (PSBs) do not engender a perverse incentive for banks’ managements to skirt accountability. The current challenge is to bring a sustainable credit culture buffeted by a superior governance structure in the banking ecosystem to cater to the needs of the growing and increasingly modern Indian economy. In this context, this section of the Financial Stability Report examines certain developments in the funding market microstructure and some credit frictions created by a set of structural changes in the credit market space following some recent developments.4 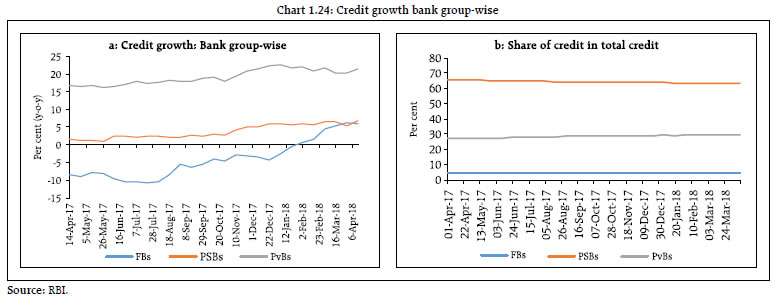 1.18 In recent years, the share of public sector banks (PSBs) in credit delivery has been gradually coming down5 and credit demand is increasingly being met by private sector banks (PvBs) (Charts 1.24 a and b). At the same time, credit intermediation is also shifting to non-banking channels6. Financial credit flows, aided in particular by mutual funds, continue to be robust though they are off their highs (Chart 1.25). 1.19 At a disaggregated level, credit growth throws up a divergence in the credit risk appetite of PSBs and PvBs, given their relative stress levels although the relative share of PSBs in deposits shows a slower rate of decline (Chart 1.26). This has implications for market interest rates. For example, the 3-month MIBOR-OIS spread has remained elevated although it is currently off its highs, possibly implying that such an elevation is unrelated to the interest rate view (Charts 1.27). In the LCR regime inter-bank borrowing requires 100 per cent run-off as compared to 40 per cent run-off for unsecured wholesale funding from non-financial corporates. This may plausibly be coming in the way of inter-bank borrowing thereby impeding the flow of liquidity from relatively liquidity rich PSBs to the PvBs. 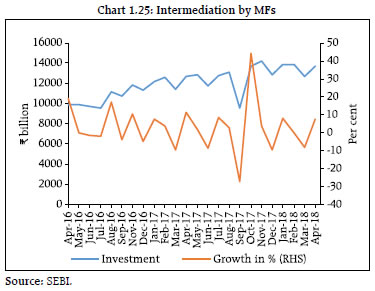
 1.20 Under stressed market conditions7 there have been multiple illustrations of withdrawal of price supporting bids despite a sharp fall in prices (Charts 1.28a and b) leading to poor market depth8. Broadly, on days where there were sharp movements in yields, PSBs appear to be the major providers of liquidity while foreign banks (FBs) and Primary Dealers (PDs) appear to be the consumers of liquidity. 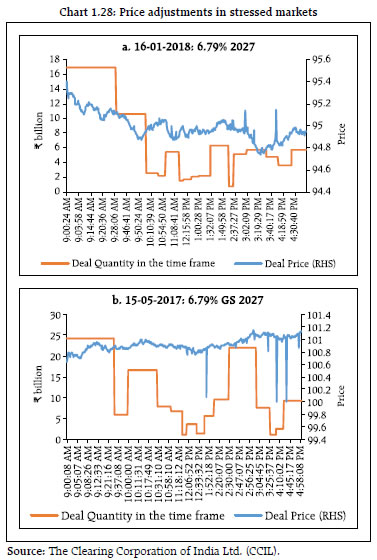
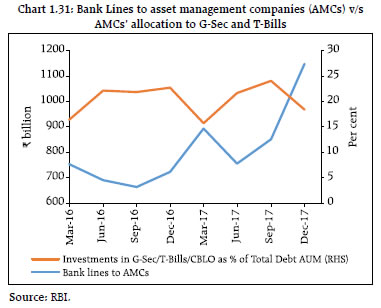
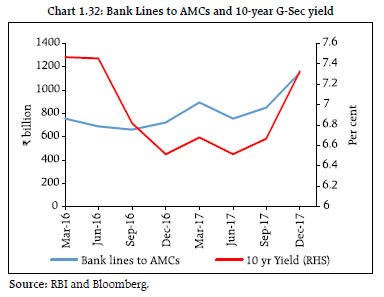
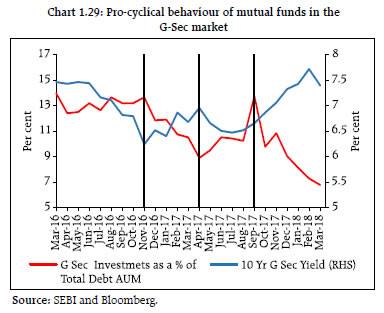 1.21 In this regard, mutual funds as liquidity consumers have showed a pro-cyclical behaviour (Chart 1.29) particularly when the outlook for interest rates was bearish as their aggregate holdings of T-Bills and dated government bonds as a proportion of debt ‘assets under management’ (AUM) have shown a noticeable decline relative to spread products since September 2017 (Chart 1.30). At the same time, bank liquidity lines9 to MFs show a pro-cyclical approach, rising when the interest rate views are bearish and being flat otherwise. This implies a behaviour consistent with moral hazard, wherein liquidity insurance by financial intermediaries allow asset managers to load on yield-enhancing illiquid investments (Charts 1.31 & 1.32). 1.22 Furthermore, while there’s a sharp decline in the relative share of PSBs/PvBs in providing MF contingent liquidity lines since September, 2017, the FBs have gained in relative share (Chart 1.33). Two reasons can be attributed to such a behaviour. Since, such confirmed credit lines require 100 per cent run-off for LCR computation, PvBs with slender surplus SLR and robust credit growth prospects would not have found the liquidity provisions remunerative. On the other hand, FBs with sizeable surplus SLR (Box 3.3 Chart 5a) seem to have somewhat limited credit appetite. While, from a micro prudential perspective such liquidity provisions may appear optimal, given the slender market depth under stressed conditions, shifting liquidity demands from asset markets to funding markets and back to asset markets (through banks) have self-reinforcing feedback loop and hence require prudential oversight. 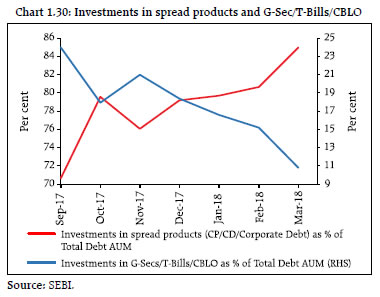
 1.23 The all-India composite House Price Index (HPI) growth moderated to 7.6 per cent (y-on-y) in Q3: 2017-18 as compared to 8.3 per cent in the corresponding quarter of the previous year (Chart 1.34). The gross non-performing advances (GNPAs) ratio for housing finance assets increased to 1.51 per cent in March 2018 from 1.28 per cent in March 2017. Given the growing dominance of the retail housing segment in incremental credit allocations,10 any potential dilution in credit standards for incremental growth needs to be eschewed. Systemic Risk Survey11 1.24 In the latest systemic risk survey (SRS), participants assigned a moderate probability to the realisation of global risks, domestic macroeconomic conditions, institutional and market risks over a six month horizon. About 40 per cent of the respondents felt that the prospects of domestic banking sector are going to improve marginally in the next one year, while the other respondents are still concerned about the continuous rise in NPAs and faltering governance standards in banks.
|