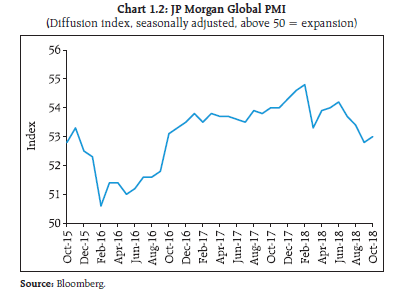
The global growth outlook for 2018 and 2019 remains steady although the underlying downside risks have risen. The upward trend in policy rates in the US along with greater supply of US treasuries will adversely affect capital flows to emerging markets (EMs) and exert upward pressure on interest rates and corporate spreads. In the meanwhile, commodity prices, particularly oil, have softened, mostly driven by excess supply of US shale oil, uncertainty about Chinese demand and on supply concerns from Iran turning out softer than anticipated. In the domestic financial markets, structural shifts in credit intermediation and the evolving interconnectivity between banks and the non-banks calls for greater vigilance. Global economy 1.1 Global growth for 2018 and 2019 is projected1 to remain at the 2017 level of 3.7 per cent (Chart 1.1), though the expansion has become less balanced and the downside risks to global growth have risen since the publication of the previous Financial Stability Report (FSR). The global PMI2 (Chart 1.2), while still expansionary, also points to ebbing of activities. The key drivers of risk are trade conflict, inflation risk in Advanced Economies (AEs) and normalisation of their monetary policies and central banks’ balance sheets. Nevertheless, AEs are expected to grow at 2.4 per cent in 2018 (a marginally faster pace than in 2017) and 2.1 per cent in 2019 while growth in Emerging Markets and Developing Economies (EMDEs) is expected to be steady at 4.7 per cent in both 2018 and 20193, though the latter will be susceptible to a stronger dollar, emerging dynamics on the global trade front, and geopolitical risks. 1.2 In the meanwhile, financial conditions in AEs have tightened as their monetary policy regimes shift towards normalcy. The recent tightening in financial conditions (Chart 1.3) in the US is largely driven by volatility swings in equity markets and the marginal widening of investment grade credit spreads. After the latest Fed rate hike in December 2018, the aggregate policy regime in US appears to have significantly tightened as per the latest financial conditions index (FCI), leading to median rate hike forecast for 2019 being trimmed from three to two. Financial conditions in Europe remain constricted by the developments in Britain and Italy. Indications from Bank of Japan (BoJ) point towards a rethink in its Quantitative Easing (QE) program although the reaction of currency markets is muted, so far. 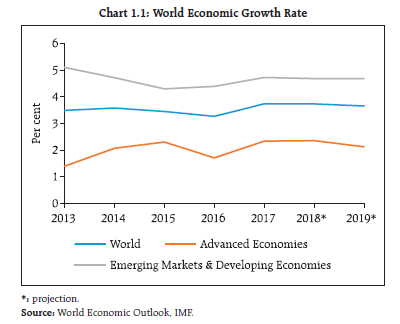
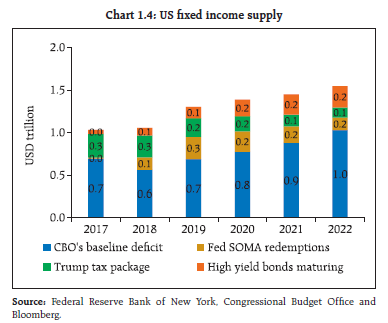
 1.3 Hence, the underlying global macro-financial conditions coupled with geopolitical uncertainty have potentially increased spillover risk to EMDEs. The spillover risks are tracked in four dimensions: i. Supply of safe assets; ii. Protectionist trade policies; iii. Commodity market behaviour; and iv. Direction of capital flows. (i) Supply of safe assets 1.4 Tax cuts in the US are expected to add US dollar (USD) 1.5 trillion to the US budget deficit over 10 years (Chart 1.4). The enhanced borrowing requirement, coupled with a shrinking balance sheet of the US Federal Reserve (FED) could be a significant near-term risk to the market. With a gradual normalisation of the global monetary policy, the possibility of a substantial increase in the supply of USD denominated safe assets concurrent with a robust US fixed income issuance across high yield and investment grades poses risks of pushing treasury rates higher and corporate spreads wider while impacting the US dollar. Some of the issues relating to asset pricing implications of rising US Federal Funds rate is explored in Box 1.1. 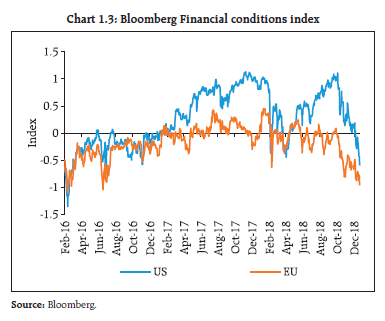
Box 1.1 : Is this time different? Risk-free curve and movement in corporate spreads in US rate increase cycle The movement in US Federal Funds rate and its consequent impact on the US treasury term-structure has implications for global interest rates. This discussion contrasts the impact of US Federal Funds rate rises during 2004-07 and the ongoing one, specifically with regard to the impact on US Treasury term-structure and corporate spreads. Charts 1 & 2 plot the evolution of US Federal Funds (fed funds) rate, S&P Index and 5-year treasury yield for 2004-07 and 2016-18. As can be seen, 5-year US Treasury yield differential with the fed funds rate during 2004-07 was narrower with the former occasionally lower than the overnight fed funds rate in sharp contrast to 2016-18 wherein the 5-year US Treasury yield has been consistently and at times significantly higher. Chart 3 gives the yield differential between 5-year and 3-month treasury and OIS yields. Both are risk-free, OIS by construction (through centralised clearing and day end collateral transfer) and US Treasury (UST) by definition. As the trend in Chart 3 shows, the spread with respect to 3-month has nudged higher since September 2017 towards zero, while the 5-year spread has been consistently positive. A contrast with 2004-07 (Chart 4) clearly shows that the UST-OIS differential currently is possibly pointing at the future supply of USTs induced by the US structural budget deficit although the puzzle with regard to sustenance of such positive spreads is that such spreads are arbitrageable and such arbitrages carry little risk, if taken to maturity. The positive differential in spreads in the longer tenor predates the recent tax reforms. Such widening of spreads of long tenor US treasuries has an impact on corporate funding rates as most of the recent corporate issuances are being benchmarked to the US treasury curve and not the risk-free swap curve. 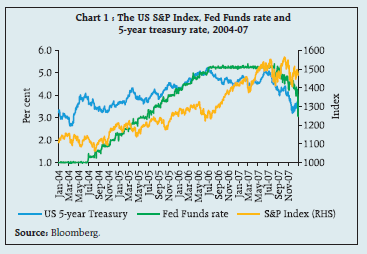
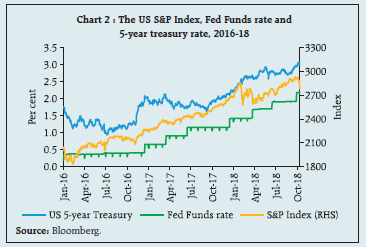
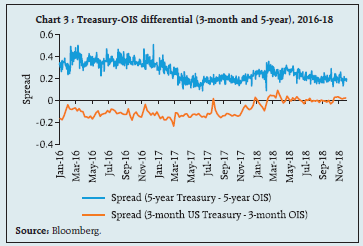
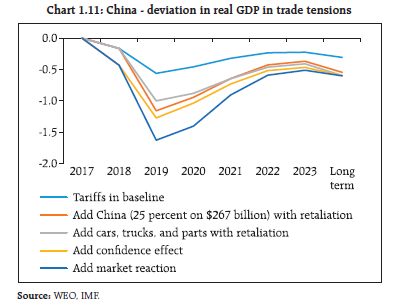
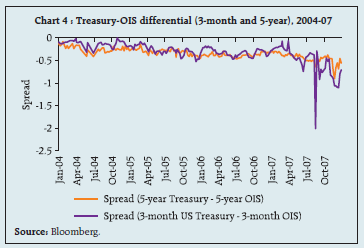 Chart 5 plots the evolution of 3-year and 5-year US CDS spreads implied by the respective indices. As can be seen in the chart, the declining trend in spreads in both the indices which was almost coterminous with the increase in Fed interest rate (December 2015) have reversed since December 2017, again almost coterminous with the passage of American tax reform. While no clear trend in respect of movement in corporate spreads can be seen in 2018, there has been significant volatility. Credit spreads movements are generally seen as counter-cyclical to the state of the economy. However, the recent gyrations in CDS spreads without any specific trend, if sustained going forward, and the development of an alternate synthetic risk-free curve different from the US treasury curve (a probable structural modification) are possibly two distinguishing features of the current rate increase cycle which have significant implications for global corporate borrowing rates and global monetary policy. | 1.5 With the USD money market rates having implications for transmission of US monetary policy impulses across the world, widening of both the 3-month and 6-month LIBOR – OIS basis assumes significance. As the trend in T-bill - OIS basis has been steady over the period (Chart 1.5), the widening of the LIBOR-OIS basis possibly has to do with a demand-supply imbalance in unsecured funding. The recently released data by the US Federal Reserve4 shows that aggregate commercial paper (CP) outstanding, which was declining in August-September 2018, has nudged marginally higher in October 2018. Notwithstanding the underlying causes, such idiosyncratic movement in LIBOR has a cascading impact for USD funding costs for corporates and banks in emerging markets. 1.6 Looking at the other major central banks, the quantitative easing (QE) programmes of the European Central Bank (ECB) and the BoJ have possibly kept the USD risk-free interest rates and corporate spreads low so far, though the ECB’s withdrawal of its QE by December 2018 along with similar intentions seen at the BoJ are expected to have implications for the global liquidity pool as there has been significant overseas asset acquisition by European and Japanese asset managers since 2010 (Chart 1.6) which is seen to be ebbing off. The declining trend in net hedged returns is also a dampener in USD investments (Chart 1.7). Finally, the improvement in USD cross currency basis for both Euro and Japanese Yen (JPY) (Chart 1.8) is also a possible pointer to the limited appetite for USD assets from Euro/JPY domiciled funds. (ii) Protectionist trade policies 1.7 Growth in world trade (Chart 1.9) suggests that trade volumes are yet to be significantly affected by the ongoing trade tension between the US and China. The World Economic Outlook (WEO) in its simulated effect of the impact of this trade conflict noted that the impact of tariffs imposed so far is small but material, with the US and China bearing the brunt of the costs. According to the WEO these costs would roughly double if US imposes a 25 per cent tariff on an additional USD 267 billion of imports from China and if China responds with a 25 per cent tariff as well. While the WEO’s simulation shows short-term gains for some countries as high priced imports from US and China get substituted away by exports from such countries, such gains are likely to disappear over time (Charts 1.10 & 1.11).
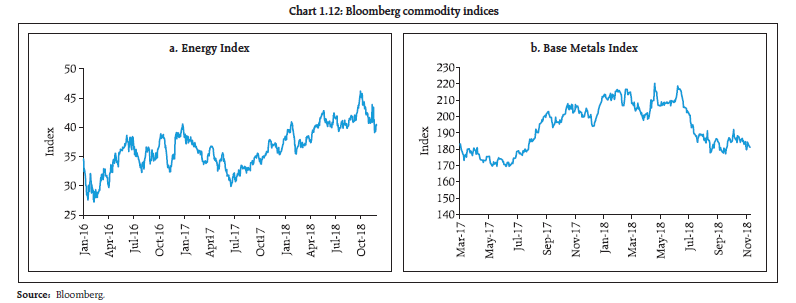
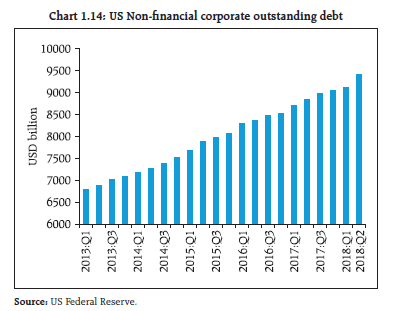
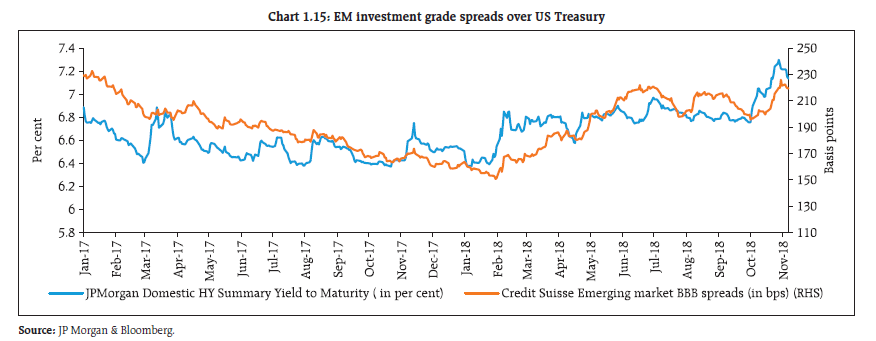
(iii) Commodity market behaviour 1.8 The earlier bullish outlook on the energy sector for Q3 and Q4, 2018, driven by global demand expectations and anticipated supply constraints from Venezuela and Iran, has clearly given way to a sombre reflection with crude oil retracing early Q3 gains as US sanctions against Iran turned out to be far less stringent than anticipated and US crude oil production is rising faster than anticipated. The sharp increase in US crude oil stocks also show that the oil market is oversupplied. The base metals space, however continues to bear the effect of the trade tensions and the lingering uncertainty about the robustness of Chinese demand (Chart 1.12). (iv) Direction of capital flows 1.9 The re-pricing of risk in the wake of the recent spurt in volatility has materially affected the risky credits (Chart 1.13). This re-pricing in the High Yield (HY) sector, notwithstanding the partial retracement in VIX index as well as High Yield Bond index, is particularly relevant in the context of concerns expressed by former Federal Reserve Chair Janet Yellen5 with respect to the general leveraged position of US corporate balance sheet (Chart 1.14). Concurrently, EM investment grade credit has also undergone a re-rating. This has implications for pricing of credits for EM corporates and hence debt flows to EMs (Chart 1.15). A sharp pull back from riskier emerging market assets triggered by a no-deal Brexit or an intensification of Euro-area sovereign debt concerns are the biggest near-term risks facing the financial markets. 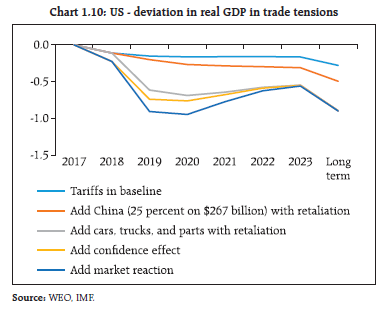
 1.10 Besides, EMs’ currency evolution too has implication for debt flows to these markets. While the depreciation in emerging market currency index and the dollar index is mostly symmetric, the EMs depreciation in 2018 has been particularly sharp (Chart 1.16). While the indications from the ECB about the withdrawal of quantitative easing (QE) measures had led to a bounce in the US dollar index, the recent weakness in Euro zone GDP data has led to a rethink of market speculations about the upward adjustment in Euro interest rate in late 2019 and a consequent retracement of the gains. The recently released Financial System Report of Bank of Japan (BoJ) highlights that while the ongoing accommodative financial policy has supported the economic expansion as also suppressed downside risk to the real economy in the near term, from a somewhat longer-term perspective, if the growth potential of Japan’s economy does not increase, then the recent financial developments could build pressure on balance sheet adjustments and thereby amplify downward pressure on the economy in the event of a future negative shock. While such thinking does not point to a fundamental reassessment of the ongoing accommodative financial policy regime as yet, it does imply some rethinking on the costs that the program is inducing although currency markets are yet to show any substantive reaction to such a reassessment. The general widening in EMs’ credit spreads and a fluctuating risk appetite are ongoing risks for EMs to contend with as the US budget deficit widens and the AEs monetary stimulus subsides. 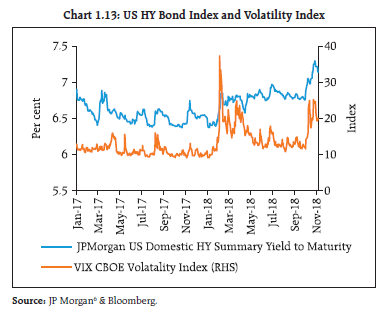
 Domestic macro-financial developments A. Risks to growth 1.11 On the domestic front, growth in gross domestic product (GDP) slowed down to 7.1 per cent year-on-year (y-o-y) in Q2:2018-19 from 8.2 per cent in Q1:2018-19, weighed down by moderation in private consumption (Chart 1.17 a and b). On the supply side, growth of gross value added (GVA) at basic prices decelerated to 6.9 per cent in Q2:2018-19, reflecting moderation in agriculture and industrial activities.
B. Fiscal Balance 1.12 The Finance Minister, in the Budget Speech 2018-19, proposed to accept key recommendations of the Fiscal Reform and Budget Management Committee relating to adoption of the debt rule and to bring down the central government’s debt to GDP ratio to 40 per cent. The government has also accepted the recommendation to use fiscal deficit target as the key operational parameter. The achievement of the target of 3.0 per cent of gross fiscal deficit to GDP ratio, however, has been deferred to 2020-21 as per the proposed new regime of the Fiscal Responsibility and Budget Management Act (FRBM). The government has further decided to insert adequately defined ‘escape and buoyancy clauses’ to determine when the targets may be relaxed or tightened as the case may be. The government has also decided to do away with the deficit targets on revenue account (RD) and consequentially, effective revenue deficit (ERD)7. 1.13 Fiscal deficit was brought down sequentially from 4.1 per cent of the GDP in 2014-15 to 3.9 per cent in 2015-16, and further to 3.5 per cent in 2017-18. Since fiscal discipline is particularly important from ratings agencies’ perspective, considering that India remains a relatively high debt and high deficit country among similarly rated countries, the government has been taking steps to stick to the fiscal deficit target of 3.3 per cent in 2018-19. C. External Balance a. Current account 1.14 The current account deficit (CAD) to GDP ratio fell to a twelve year low in 2016-17 after having increased precariously to 4.8 per cent of GDP in 2012-13 (Chart 1.18). Decline in the merchandise trade deficit, both in absolute terms and as per cent of GDP, alleviated stress on the current account. However, current account deficit widened to a four year high in 2017-18 driven by merchandise trade deficit. The CAD increased to 2.7 per cent of GDP in H1:2018-19 from 1.8 per cent in H1:2017-18 on the back of widening of the trade deficit. Merchandise trade data for the period April 2018 - October 2018 also suggests some revival of growth in major components of imports suggesting some pick-up in domestic demand relative to 2017-18 (Chart 1.19). Going forward, the ongoing trade related dispute between US and China which until now has had a limited impact on global trade flows remains a significant risk. Additionally, outlook for international crude oil prices feeding into input costs remains uncertain with potential implications for India’s terms of trade which worsened in H1: 2018-19. 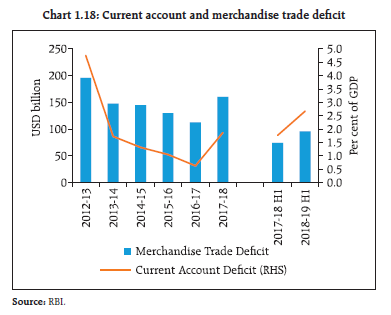 b. Capital account 1.15 The relative valuation of Indian equities vis-à-vis its emerging market peers continues to be somewhat elevated in terms of the forward P/E multiple (Chart 1.20). A gradual normalisation of global liquidity and re-rating of risky assets imply that the earnings outlook and domestic flows will play a major role in sustaining valuation and also overseas investor flows. 1.16 April-November 2018 witnessed a substantial outflow by FPIs from both Indian equity and debt markets, except in July, August and November. The sell-off intensified during October, when equities worth USD 3.9 billion were sold by FPIs, the most in a month during the last 10 years. This sell-off followed foreign portfolio investment (FPI) outflows of USD 1.5 billion in September (Chart 1.21). In relative terms, India is an underperformer withregard to equity flows specifically in comparison withRussia and Brazil (Chart 1.22). Improvements in easeof doing business together with liberalisation in FDIpolicies have potential to attract higher inflows. Therecent policy announcement of the Reserve Bankto have a rule-based dynamic limit for outstandingstock of External Commercial Borrowings (ECBs) at6.5 per cent of GDP at current market prices wouldlimit accumulation of forex liabilities in corporatebalance sheet and would enhance financial stability.
D. Financial markets 1.17 The recent volatility in India VIX was mirrored in foreign exchange (Fx) implied volatility as also in Fx realised volatility. While there is no specific lead and lag relationship between Fx implied volatility and India VIX, all the three market parameters are significantly off their lows in the current financial year8 (Chart 1.23).
Credit intermediation by mutual funds and certain emerging issues 1.18 Chart 1.24 plots the flow of resources to the commercial sector over the last 5 years. After declining in 2016-17, the banks’ share in reported flow of credit, increased sharply in 2017-18 possibly owing to the large recapitalisation of public sector banks (PSBs) undertaken during the financial year. A significant part of the increase in non-bank sources of reported credit (domestic) witnessed during 2017-18 was because of the increased data coverage of government non-banking financial intermediaries. During 2018-19 (till mid-November), the relative proportion of domestic bank and non-bank resources was almost evenly matched. With regard to the flow of resources from domestic non-bank sources, the share of net credit by housing finance companies (HFCs) in the total flow of credit (from domestic sources) nearly doubled from 6.2 per cent in 2013-14 to 11.7 per cent in 2017-18. The share of foreign resources in the total flow of credit to the commercial sector was largely range-bound between 16-19 per cent during the period under observation, with foreign direct investment (FDI) being the dominant contributor. 1.19 Mutual funds (MF) have played a catalytic role in the reshaping of the non-bank financial intermediation outlined earlier. The recent episode in the wake of IL&FS default however underlined certain issues in this market intermediated credit provisioning structure, the narrative on which can be broadly divided into: a) Nature of credit intermediation of MFs and the IL&FS incident induced dislocation; b) Price impact of MF dislocation with specific focus on money market rates; c) Fair value of corporate issuances in banks and MFs; and d) Credit concentration in MF portfolios and possible behavioural implications. a) Nature of credit intermediation of MFs and IL&FS incident induced dislocation 1.20 Mutual Funds have about ₹ 65 billion of IL&FS group exposure out of a total debt of around ₹ 900 billion. Mutual Funds have passed the default risk to investors as a pass-through vehicle. Chart 1.25 traces the growth and the relative size of funds based on the nature of assets. As is evident in the chart, debt and liquid/money market funds have a dominant share which has remained mostly stable and as on September 2018 constituted 51 per cent of the AUM. A disaggregated investor analysis of debt and liquid/money market funds shown in Charts 1.26 and 1.27 reveals that high net-worth individuals/corporates/banks and financial institutions constituted around 90 per cent of the total corpus for debt funds (as on September 2018) whereas for liquid/money market funds the proportion of the same cohort was greater than 95 per cent. In sharp contrast to the investor profile in debt and liquid/money market funds, close to 50 per cent of the investors in equity funds comprise retail investors. 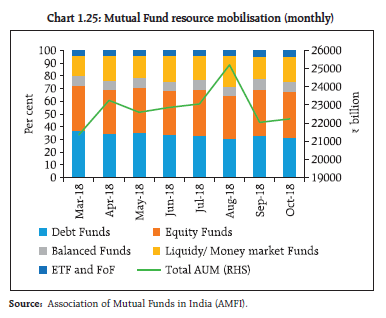 b) Price impact of credit dislocation with specific focus on money market rates 1.21 The spread between 3-month interbank rate and 3-month OIS which outlines the idiosyncratic money market liquidity induced risk has shown an upward movement since September 2018 (Chart 1.28). Such a movement is notwithstanding an enhancement in the Facility to Avail Liquidity for Liquidity Coverage Ratio (FALLCR) and the open market operations (OMO) undertaken during the period. The effect in money market rates is magnified due to banks’ possible precautionary motive to hoard liquidity against the backdrop of potential drawdown from substantial confirmed credit lines extended to non-bank financial intermediaries.
c) Fair value of corporate issuances in banks and MF portfolios - Some emerging issues 1.22 Valuation of credit instruments require two pre-requisites - an arbitrage free sovereign pricing curve and transparent corporate spreads specific to the tenor and rating. However, the extant valuation frameworks for corporate bond book appear to be falling short in terms of both benchmarking issues and valuation methods. A portfolio of corporate bonds that does not reflect the fair and exchangeable value of the underlying assets has two implications: –(i) it fails to serve as a barometer for the health of the underlying obligors and, (ii) it can potentially impose externalities on the rest of the market when investors prefer flight to safety as discrepancies in valuations get discovered. In addition, a wedge between primary market price discovery and the internal carrying cost of equivalent securities may potentially act as a disincentive to trade in underlying securities resulting in a negative feedback loop with regard to price discovery. The growth in the debt/ money market mutual funds’ AUM shows that the valuation done by mutual funds in an illiquid corporate bond market is by and large representative of market. In absence of such fair valuation, the end investors of mutual funds which include banks, institutions, HNIs and corporate treasury would have arbitraged the mutual funds like Unit 64. SEBI Regulations have put responsibility on mutual funds to have fair valuation. It has recently redefined categorisation of mutual fund schemes based on underlying securities and has put maturity restrictions in each category. The Mutual Funds are authorised to impose exit loads and redemption gates for managing liquidity risk. As debt becomes an important and increasing part of the corporate capital structure, partially induced by the imposition of Liquidity Coverage Ratio (LCR) as also prospective imposition of Net Stable Funding Ratio (NSFR) on banking intermediaries, it is important to deepen corporate bond market to address the infirmities in appropriate benchmarking of valuation of corporate bonds. 1.23 In this regard, the Reserve Bank in its Statement on Developmental and Regulatory Policies following the Fifth Bi-monthly meeting for 2018-19 of the Monetary Policy Committee has proposed that all floating rate loans to Micro and Small Enterprises and new floating rate personal or retail loans extended by banks from April 1, 2019 shall be priced based on external benchmarks. In addition, the recently enhanced disclosure norms for credit ratings agencies (CRAs) both with regard to liquidity as also on support from a Parent / Group / government are expected to more accurately reflect the near-term vulnerabilities of the obligor and hence will lead to reflection of such vulnerabilities in the related asset prices. d) Credit concentration in MF portfolios and possible behavioural implications 1.24 The procyclical behaviour of Mutual Funds (MF) with regards to government securities holdings and replacing exposure on the sovereign curve with exposure to spread products when the interest rate view is bearish, with obvious implications for liquidity of underlying portfolios has been commented in the previous issue of FSR9. Concentration of exposure in any portfolio has implications for the market stability. A diversified portfolio will be less risky compared to a concentrated portfolio of similar credit. SEBI has put various safeguards for creating diversified portfolio among Mutual Funds. SEBI regulations put single issuer limit, group exposure limit and sector exposure limit on Mutual funds. These limits are constantly revised to ensure that Mutual Funds’ portfolio remains diversified. It might be appropriate to consider investor level concentration limit on issuer to ensure diversification at issuer level. To improve liquidity in money market and liquid funds, valuation and maturity restrictions are under review by SEBI. A mandatory liquidity limit may also be considered by them. In this regard an effective ALM regime in non-banking financial sector may also enhance systemic resilience. 1.25 The deepening and broadening of the financial markets also has some inevitable side-effects, in terms of greater inter-connectedness and potential contagion and there needs to be further coordination among the regulators so as to identify possible regulatory arbitrage opportunities on account of regulatory gaps or perceived and real informational asymmetries amongst the regulators. On the other hand, the balance between market development and a desirable level of investor and credit discipline and greater oversight becomes crucial for a sustainable and stable financial system and to maintain inter-generational equity. Housing Market 1.26 House prices have been cooling in the last five quarters, despite accelerated housing credit growth and favourable bank lending rates (Chart 1.29). The large pile of unsold homes resulting from tepid demand conditions gradually led to moderation in price increase. There has, however, been a pick- up in house sales in H1:2018-19 leading to a reduction in unsold inventory, thereby improving the house sales-to-inventory ratio for major cities (Chart 1.30). Notwithstanding improved consumer sentiments consequent to stabilisation of disruptions in the implementation of GST and RERA10, the recent spike in launches is mostly driven by government schemes to promote affordable housing. Systemic Risk Survey11 1.27 In the latest systemic risk survey (SRS), participants perceived financial market risks as a high-risk category affecting the financial system while global risks, risk perception on macroeconomic conditions and institutional positions are perceived as medium risks affecting the financial system. About 50 per cent of the respondents felt that the prospects of domestic banking sector are going to improve marginally in the next one year supported by stabilisation of the insolvency and bankruptcy process.
|