Credit growth of scheduled commercial banks (SCBs) improved (13.1 per cent y-o-y) in September 2018, driven largely by private sector banks (PVBs) (22.5 per cent y-o-y). The asset quality of SCBs is showing signs of improvement with GNPA ratio declining from 11.5 per cent in March 2018 to 10.8 per cent in September 2018 and annualised slippage ratio coming down from 7.6 per cent to 4.1 per cent in the same period. The stressed advances ratio is gradually converging to the GNPA ratio following the withdrawal of various restructuring schemes. However, sector-wise analysis shows higher stress in mining, food processing and construction sectors. Projected GNPA ratio under the baseline scenario may decline from 10.8 per cent in September 2018 to 10.3 per cent in March 2019. Sensitivity analysis indicates that 18 SCBs, including all public sector banks under Prompt Corrective Action (PCA-PSBs), may fail to maintain the required CRAR under a 2 SD shock to the GNPA ratio. An analysis of portfolio of Micro, Small and Medium Enterprises (MSMEs) shows that the performance of PSBs in the MSME segment trails that of other intermediaries (private banks and non-banking financial companies (NBFC)), both in terms of inherent as well as realised credit risk. In terms of quality, incremental credit portfolio of PCA-PSBs shows a declining conversion rate to non-performing assets (NPA) in FY 2017-18 compared to FY 2016-17, although the rate still remains significantly large vis-à-vis other financial intermediaries. Analysis of the financial network structure for the period September 2017 - September 2018 reveals a shrinking inter-bank market and increasing bank linkages with asset management companies-mutual funds (AMC-MFs) for raising funds and with NBFCs/Housing Finance Companies (HFCs) for lending. Instrument-wise data for AMCs’ receivables and NBFC/HFCs’ payables points to a shift towards short-term instruments (commercial paper (CP) and certificates of deposit (CDs)) at the cost of long-term instruments. Contagion analysis for the banking sector has been carried out using two different approaches – one in which PSBs’ implicit sovereign guarantee is taken into account (no default case) and another in which the default triggers for PSBs are similar to the PVBs. The significant difference between the results of the two approaches can be seen as potential amplification of solvency/liquidity losses caused by PSB defaults in the absence of implicit sovereign backing. Section I Scheduled commercial banks1 2.1 In this section, the soundness and resilience of scheduled commercial banks (SCBs) is discussed under two broad sub-heads: i) performance, and ii) resilience using macro-stress tests through scenarios and single-factor sensitivity analyses2. Performance 2.2 SCBs’ credit growth on a year-on-year (y-o-y) basis improved across bank groups between March and September 2018, largely driven by the private sector banks (from 21.3 per cent in March 2018 to 22.5 per cent in September 2018) (Chart 2.1a). Private sector banks’ deposit growth continued to be robust at 18.4 per cent. The performance of the PSBs has witnessed an overall improvement with credit growth increasing from 5.9 per cent in March 2018 to 9.1 per cent in September 2018 and deposit growth increasing from 3.2 per cent to 5 per cent in the same period. However, there has been a further widening between PCA and non-PCA PSBs: while the non-PCA PSBs’ credit growth improved from 9.1 per cent in March 2018 to 13.6 per cent in September 2018 and deposits increased from 6.1 per cent to 7.9 per cent in the same period, the PCA-PSBs registered negative growth in both credit and deposits (Chart 2.1b). 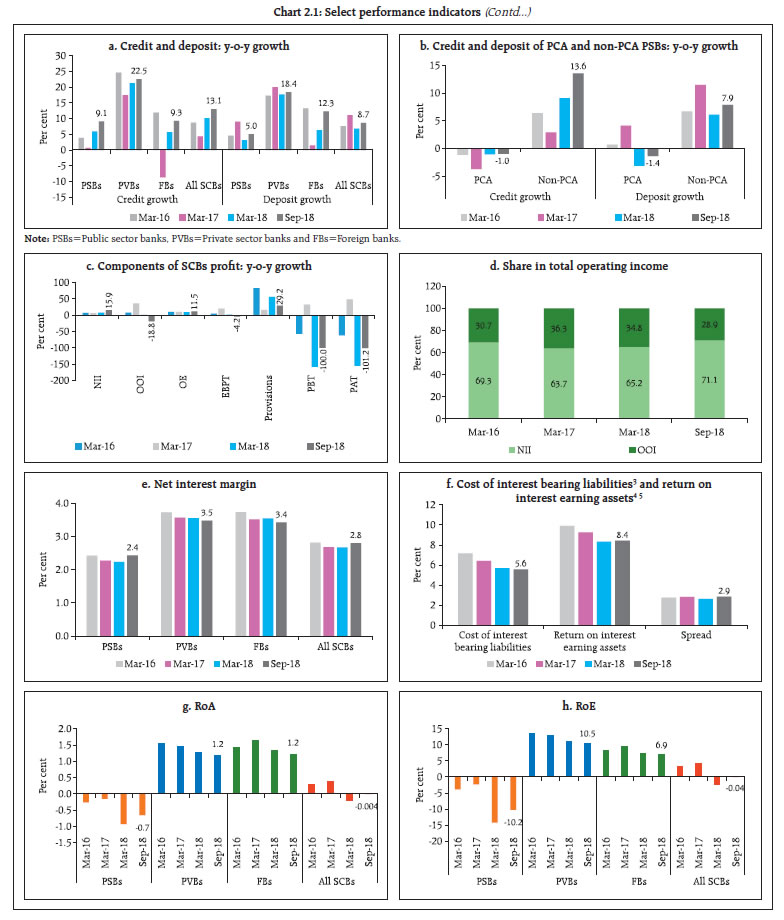 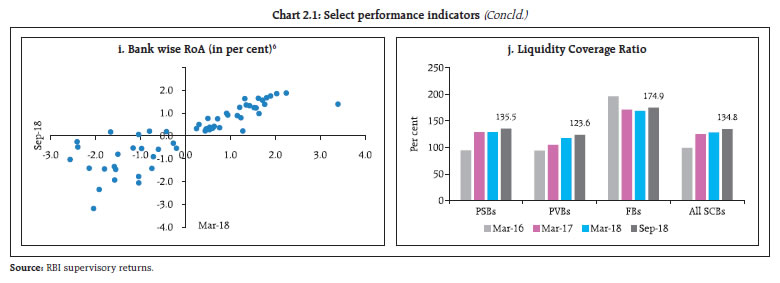 2.3 SCBs’ net interest income (NII) growth improved in September 2018 as compared to March 2018, while there was decline in other operating income (OOI). This, along with higher growth in operating expenses (OE), pulled down the earnings before provisions and tax (EBPT). However, growth in provisions7 was lower between March and September 2018 (Chart 2.1c). 2.4 The share of NII in total operating income improved in September 2018 as compared to March 2018 (Chart 2.1d). Interestingly, net interest margins (NIM) of SCBs have improved mainly due to PSBs. Higher growth in NII improved the NIM of the PSBs, though still lower than PVBs and FBs. 2.5 Profitability ratios of SCBs continued to be impacted. However, ratios improved from their March 2018 levels. Individually, in a sample of 55 SCBs, 24 banks were able to improve their return on asset (RoA) in September 2018 as compared to March 2018 (Chart 2.1i). On the other hand, private sector banks, which were able to maintain their profitability till recently, have experienced decline in their profitability ratios. The RoA of 8 out of 19 PVBs in the sample improved in September 2018 as compared to March 2018. 2.6 The liquidity coverage ratio (LCR), intended to build banks’ short-term resilience to potential liquidity disruptions, improved for PSBs and PVBs in September 2018. PSBs are able to maintain better LCR than the PVBs (Chart 2.1j). Asset quality and capital adequacy 2.7 Asset quality showed improvement with SCBs’ gross non-performing assets (GNPA) ratio declining from 11.5 per cent in March 2018 to 10.8 per cent in September 2018. Their net non-performing assets (NNPA) ratio also registered a decline during the period (Chart 2.2a and 2.2b). In a sign of possible recovery from the impaired asset load, the GNPA ratio of both public and private sector banks showed a half-yearly decline, for the first time since March 2015, the financial year-end prior to the launch of Asset Quality Review (AQR). 2.8 The restructured standard advances (RSAs) ratio steadily declined in September 2018 to 0.5 per cent following the withdrawal of various restructuring schemes in February 2018. This suggested increasing shift of the restructured advances to NPA category. Even the y-o-y growth in GNPA of SCBs decelerated in September 2018 across all bank groups barring foreign banks (Chart 2.2d). 2.9 Provision coverage ratio (PCR) of all SCBs was higher in September 2018 as compared to March 2018, with improvements noticed for both PSBs and PVBs (Chart 2.2e). 2.10 The capital to risk-weighted assets ratio (CRAR) of SCBs declined marginally from 13.8 per cent in March 2018 to 13.7 per cent in September 2018 (Chart 2.2f). CRAR of PSBs declined from 11.7 per cent to 11.3 per cent. There was a marginal decline in Tier I leverage ratio of the SCBs between March and September 2018 (Chart 2.2g). 2.11 Distribution of banks’ GNPA ratio shows that number of banks having GNPA ratio less than 10 per cent has gone down in September 2018 as compared to March 2018 (Chart 2.2h). Distribution of banks’ capital adequacy ratio shows that the number of banks having their CRAR less than 9 per cent has increased in September 2018 (Chart 2.2i). Sectoral Asset Quality 2.12 Among the broad sectors, the asset quality of industry sector improved in September 2018 as compared to March 2018 whereas that of agriculture and retail sectors deteriorated (Chart 2.3a). The improvement in asset quality of industry sector was marked by a reduction in fresh slippages in September 2018 (Chart 2.3b). 2.13 Among the sub-sectors within industry, stressed advances ratios of ‘mining’, ‘food processing’ and ‘construction’ sectors have increased in September 2018 as compared to March 2018 (Chart 2.3c). Credit quality of large borrowers11 2.14 Share of large borrowers in SCBs’ total loan portfolios and their share in GNPAs was at 54.6 per cent and 83.4 per cent respectively at the end of September 2018. Top 100 large borrowers accounted for 16.0 per cent of gross advances and 21.2 per cent of GNPAs of SCBs (Chart 2.4). In the large borrower accounts, proportion of funded amount outstanding with any signs of stress (including SMA-0, 1, 2, restructured loans and NPAs) has come down from 30.4 per cent in March 2018 to 25.4 per cent in September 2018, while the proportion of SMA-212 loans in the total funded amount outstanding has increased marginally from 0.7 per cent in March 2018 to 1.1 per cent in September 2018.In absolute terms, SMA-2 grew sharply by 58.6 per cent between March and September 2018 largely as a result of base effect, since the SMA-2 portfolio as on March 2018 had fallen drastically as a result of increased slippage to NPAs during the last quarter of FY2017-18.
Risks Banking stability indicator 2.15 The banking stability indicator (BSI) shows that asset quality of the banks has improved, although profitability continues to erode (Charts 2.5 and 2.6). Resilience - Stress tests Macro stress test - Credit risk13 2.16 The resilience of the Indian banking system against macroeconomic shocks was tested through macro-stress tests for credit risk. These tests encompassed a baseline and two (medium and severe) adverse macroeconomic risk scenarios (Chart 2.7). The baseline scenario assumes specific rates in future14. The adverse scenarios were derived based on standard deviations in the historical values of each of the macroeconomic variables separately, that is, univariate shocks: up to one standard deviation (SD) of the respective variables for medium risk and 1.25 to 2 SD15 for severe risk (10 years historical data). The horizon of the stress tests is one year. 2.17 Under the baseline scenario, the GNPA ratio of all SCBs may come down from 10.8 per cent in September 2018 to 10.3 per cent by March 2019 (Chart 2.8). Among the bank groups, PSBs’ GNPA ratio may decline from 14.8 per cent in September 2018 to 14.6 per cent by March 2019 under baseline scenario, whereas PVBs’ GNPA ratio may decline from 3.8 per cent to 3.3 per cent in March 2019. FBs’ GNPA ratio under baseline scenario might decline from 3.6 per cent to 3.1 per cent in March 2019.
2.18 Under the assumed baseline macro scenario, system level CRAR is projected to come down to 12.9 per cent in March 2019. Further deterioration of CRAR is projected under severe stress scenario (Chart 2.9a). 2.19 As many as eight PSBs under prompt corrective action framework (PCA PSBs) may have CRAR below the minimum regulatory level of 9 per cent by March 2019 without taking into account any further planned recapitalisation by the government. Together with these, a total of 9 banks may have CRAR below 9 per cent under baseline scenario. However, if macroeconomic conditions deteriorate, ten out of eleven PCA PSBs may record CRAR below 9 per cent under severe macro stress scenario. Together with these banks, 13 banks may have CRAR below 9 per cent (Chart 2.9b). 2.20 Under baseline scenario, CET 1 capital ratio may decline from 10.4 per cent in September 2018 to 10.0 per cent in March 2019. Five banks, all PCA PSBs, may have common equity CET 1 capital ratio below minimum regulatory required level of 5.5 per cent by March 2019. Under severe stress scenario, the system level CET 1 capital ratio may decline to 9.3 per cent by March 2019. Seven SCBs, including 6 PCA PSBs and one non-PCA PSB may have CET1 ratio below 5.5 per cent by March 2019 (Chart 2.10). Sensitivity analysis: Bank level17 2.21 A number of single-factor sensitivity stress tests18 based on September 2018 data, were carried out on SCBs to assess their vulnerabilities and resilience under various scenarios19. Their resilience with respect to credit, interest rate and liquidity risks was studied through a top-down20 sensitivity analysis. Credit risk 2.22 Under a severe shock of 2 SD21 (that is, if the GNPA ratio of 54 select SCBs moves up from 10.922 per cent to 14.9 per cent), the system-level CRAR will decline from 13.4 per cent to 11.1 cent and Tier-1 CRAR will decline from 11.2 per cent to 9 per cent. The impairment in capital at the system level could thus be about 18.5 per cent. The results of reverse stress test show that it requires a shock of 4.15 SD to bring down the system-level CRAR to 9 per cent. Bank-level stress test results show that 18 banks23 having a share of 31.7 per cent of SCBs’ total assets might fail to maintain the required CRAR under a shock of a 2 SD increase in GNPA ratio (Chart 2.11). PSBs were found to be severely impacted with the CRAR of 16 of the 21 PSBs likely to go down below 9 per cent in case of such a shock. 
 2.23 Distribution of CRAR of select SCBs shows that under a 2 SD shock on the GNPA ratio, CRAR will come down below 9 per cent for as many as 18 banks, mostly PSBs (Chart 2.12). PVBs and FBs experienced a less than 3.1 per cent shift in CRAR under 2 SD shock while PSBs dominate the right half of the distribution (Chart 2.13a). Among PSBs, PCA PSBs experienced larger shifts in CRAR under the shock as compared to non-PCA PSBs, pointing towards the stress underlying in their books making them more vulnerable to shocks. (Chart 2.13b).
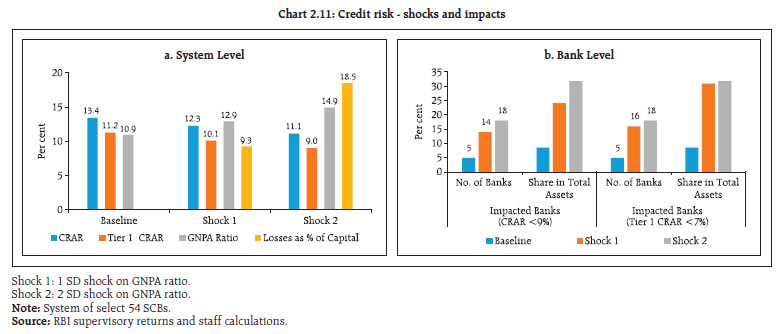
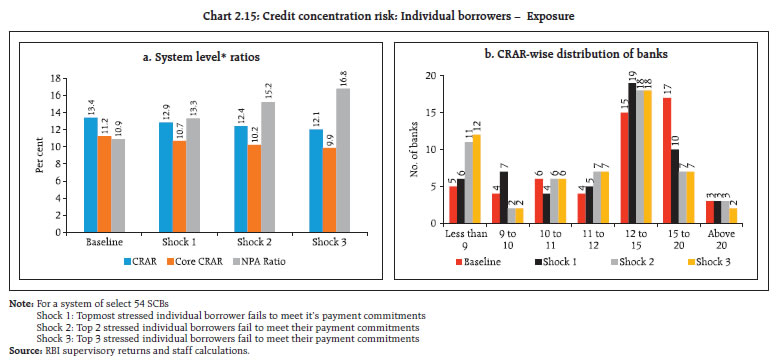
Credit concentration risk 2.24 Stress tests on banks’ credit concentration, considering top individual borrowers according to their stressed advances, showed that in the extreme scenario of the top three individual borrowers failing to meet their revised payment commitments24, the impact was significant for 14 banks. These banks account for 26.6 per cent of the total assets of SCBs. The impact on CRAR at the system level under the assumed scenarios of failure of the top 1, 2 and 3 stressed borrowers will be 62, 94 and 118 basis points (Chart 2.14). 2.25 Stress tests on banks’ credit concentration, considering top individual borrowers according to their exposures, showed that in the extreme scenario of top three individual borrowers failing to meet their payment commitments25, the impact was significant for twelve banks. These banks account for 21 per cent of the total assets of SCBs (Chart 2.15). The impact on CRAR at the system level under the assumed scenario of default by all the top 3 individual borrowers will be 135 basis points. 
| Table 2.1 Credit concentration risk: Group borrowers – exposure | | Shocks | System Level* | Bank level | | CRAR | Core CRAR | NPA Ratio | Losses as % of Capital | Impacted Banks (CRAR < 9 per cent) | | Baseline (Before shock) | 13.4 | 11.2 | 10.9 | --- | No. of Banks | Share in Total Assets of SCBs (in %) | | Shock 1 | 12.5 | 10.3 | 15.0 | 7.6 | 6 | 10.3 | | Shock 2 | 11.7 | 9.5 | 18.3 | 13.6 | 11 | 18.3 | | Shock 3 | 11.1 | 8.9 | 21.1 | 18.8 | 14 | 23.2 | * For a system of select 54 SCBs.
Shock 1: Topmost group borrower fails to meet it’s payment commitments
Shock 2: Top 2 group borrowers fail to meet their payment commitments
Shock 3: Top 3 group borrowers fail to meet their payment commitments
Source: RBI supervisory returns and staff calculations | 2.26 Stress tests using different scenarios, based on the information of top group borrowers in the banks’ credit exposure concentration, reveal that the losses could be around 7.6 per cent and 13.6 per cent of the capital at the system level under the assumed scenarios of default by the top group borrower and by the top two group borrowers respectively26. As many as fourteen banks will not be able to maintain their CRAR level at 9 per cent if top 3 group borrowers fail to meet their payment commitments (Table 2.1). Sectoral credit risk 2.27 To assess the bank-wise vulnerability due to their exposures to certain subsectors, sensitivity analysis was undertaken. Subsector-specific shocks based on respective historical standard deviation (SD) of GNPA ratios were considered to assess the credit risk due to the banks’ exposure to vulnerable subsectors. With 1 SD and 2 SD shock on GNPA ratio of some subsectors, the corresponding increase in the GNPAs of 54 banks in different sub-sectors is shown in the Table 2.2 below. 2.28 The resulting losses due to increased provisioning and reduced income were taken into account to calculate a banks’ stressed CRAR and risk weighted assets (RWAs). The number of banks failing (i.e. their CRAR turning below 9 per cent) under subsector specific shocks is presented in the Table 2.3 below. | Table 2.2: Growth in GNPAs due to subsector specific shocks - September 2018 | | (per cent) | | | Mining | Food Processing | Petroleum | Cement | Metals | Jewellery | Construction | Transport | Power | Telecom | | 1 SD Shock | 24 | 20 | 34 | 36 | 41 | 23 | 28 | 26 | 31 | 37 | | Source: RBI supervisory returns and staff calculations |
| Table 2.3: Number of banks failing under subsector specific shocks | | | Mining | Food Processing | Petroleum | Cement | Metals | Jewellery | Construction | Transport | Power | Telecom | | 1 SD shock | 0 | 0 | 0 | 0 | 1 | 0 | 0 | 0 | 1 | 0 | | 2 SD shock | 1 | 0 | 0 | 0 | 1 | 0 | 0 | 1 | 1 | 0 | Note: 5 banks have CRAR less than 9 per cent before the shocks are applied and are excluded from the above table.
Source: RBI supervisory returns and staff calculations | 2.29 The results showed that shocks to metal segment will lead to decline of 25 bps in system level CRAR under severe 2 SD shock whereas power sector exposure will lead to around 19 bps decline in system level CRAR (Table 2.4). Interest rate risk 2.30 A look at the tenor distribution of available for sale (AFS) portfolio shows that for PVBs about 62 per cent of their portfolio is concentrated in the “less than 1-year” residual maturity bucket as on end-September 2018 (Chart 2.16). While the highest proportion of investments of PSBs (about 28.5 per cent of AFS portfolio of PSBs) are of 5-year to 10-year maturity, about 42 per cent of FBs’ total AFS portfolio is of 1-year to 3-year tenor as on end-September 2018. Tenor distribution of PVBs may be reflecting the bearish interest rate view in the prevailing market conditions forcing them to choose lesser risk over higher returns. 2.31 There is a steep rise across all categories of banks in the proportion of investments held in the shorter maturity bucket (less than 1-year) pertaining to the held for trading (HFT) portfolio from 27 per cent as on end-March 2017 to a peak of 64 per cent as on end-June 2018, which settled at 52 per cent as on end-September 2018 owing to decline in PVBs proportion of investment in this maturity bucket (Chart 2.17). Lower durations of the HFT portfolio and relatively higher proportion of investments in the lower tenors might possibly be due to the banks engaging in carry trade, borrowing in the repo/ CBLO and investing in shorter tenor money market instruments, in the absence of a clear interest rate view. The absolute value of the HFT portfolio of sample of banks considered increased from ₹796 billion to ₹1,177 billion in the same period. | Table 2.4 Decline in system level CRAR (bps) (in descending order) | | Subsector | 1 SD shock | 2SD shock | | Metal | 14 | 25 | | Power | 10 | 19 | | Transport | 4 | 7 | | Construction | 2 | 4 | | Food processing | 2 | 3 | | Telecom | 1 | 3 | | Jewellery | 1 | 2 | | Cement | 1 | 2 | | Petroleum | 1 | 1 | | Mining | 1 | 1 | | Source: RBI supervisory returns and staff calculations |
2.32 For investments under AFS and HFT categories (direct impact) a parallel upward shift of 2.5 percentage points in the yield curve will lower the CRAR by about 92 basis points at the system level (Table 2.5). At the disaggregated level, ten banks accounting for about 17.4 per cent of the total assets were impacted adversely and their CRAR fell below 9 per cent. The total loss of capital at the system level is estimated to be about 7.8 per cent. 2.33 PV01 values were at ₹2.8 billion for PSBs, ₹0.8 billion for PVBs and ₹0.4 billion for FBs as on end-September 2018.The tenor-wise distribution of PV01 indicates that the highest PV01 value is in the 7-year to 10-year maturity bucket. A further upward pressure on the yields may constrain an already stressed profitability of the banking sector. Equity price risk 2.34 Under the equity price risk, the impact of a shock of a fall in equity prices on bank capital and profit were examined. The system-wide CRAR would decline by 57 basis points from the baseline under the stressful 55 per cent drop in equity prices, while the CRAR of 7 banks will fall below the regulatory requirement of 9 per cent in the same scenario (Chart 2.18). The impact of a drop in equity price is limited for the overall system considering the regulatory limits prescribed on banks’ exposures to capital markets and therefore typically low proportion of capital market exposures on their balance sheets. Table 2.5: Interest rate risk – Bank groups - shocks and impacts
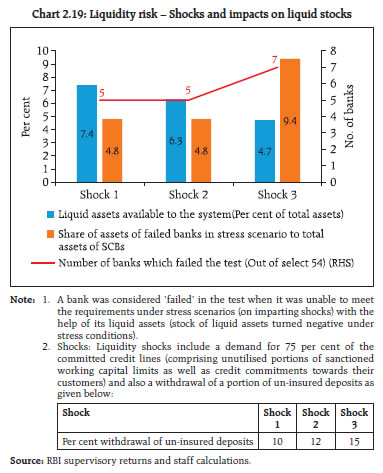
(under shock of 250 basis points parallel upward shift of the INR yield curve) | | (per cent) | | | Public sector banks | Private sector banks | Foreign banks | All SCBs | | AFS | HFT | AFS | HFT | AFS | HFT | AFS | HFT | | Modified duration | 2.8 | 1.4 | 1.5 | 2.3 | 1.6 | 1.7 | 2.3 | 2.1 | | Share in total Investments | 39.8 | 2.8 | 37.0 | 3.7 | 90.9 | 9.1 | 42.3 | 3.4 | | Reduction in CRAR (bps) | 116 | 48 | 112 | 92 | | Source: RBI supervisory returns and staff calculations. | Liquidity risk: Impact of deposit run-offs on liquid stocks 2.35 The liquidity risk analysis aims to capture the impact of deposit run-offs and increased demand for the unutilised portions of credit lines which were sanctioned/committed/guaranteed. Banks in general may be in a position to withstand liquidity shocks with their high-quality liquid assets (HQLAs)27. In assumed scenarios, there will be increased withdrawals of un-insured deposits28 and simultaneously there will also be increased demand for credit resulting in withdrawal of the unutilised portions of sanctioned working capital limits as well as utilisation of credit commitments and guarantees extended by banks to their customers. 2.36 Using their HQLAs required for meeting day-to- day liquidity requirements, 49 out of the 54 banks in the sample will remain resilient in a scenario of assumed sudden and unexpected withdrawals of around 10 per cent of deposits along with the utilisation of 75 per cent of their committed credit lines. (Chart 2.19). Stress testing the derivatives portfolio of banks: Bottom-up stress tests 2.37 A series of bottom-up stress tests (sensitivity analyses) on derivative portfolios were conducted for select sample banks29 with the reference date as on September 30, 2018. The banks in the sample, reported the results of four separate shocks on interest and foreign exchange rates. The shocks on interest rates ranged from 100 to 250 basis points, while 20 per cent appreciation/depreciation shocks were assumed for foreign exchange rates. The stress tests were carried out for individual shocks on a stand-alone basis. 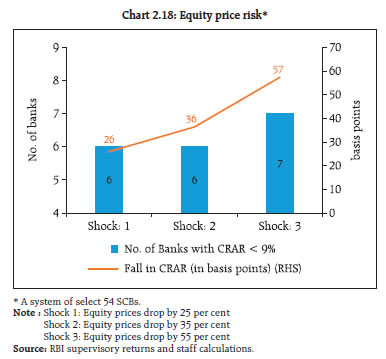
 2.38 Chart 2.20 plots the mark-to-market (MTM) impact as a proportion of CET 1 capital - as can be seen therein, the impact of the sharp moves are mostly muted in the individual banks. However, since risks can only be transferred and not eliminated, there’s a possibility that such risks are possibly residing in the corporate balance sheets. With the adoption of Indian accounting standards (Ind AS) in NBFCs and companies by MCA, it has however become easier for banks to ascertain the hedging profile of their clients and thereby reassess the counterparty exposures being run. The nature of corporate hedging profile has implications for secondary market liquidity under stressed conditions as well. 2.39 The stress test results showed that the average net impact of interest rate shocks on sample banks were negligible. The results of the scenario involving appreciation of INR point to the effect of the shock continuing to normalise in September 2018 after a previous spike (Chart 2.21). Section II Scheduled urban co-operative banks Performance 2.40 At the system level30, the CRAR of scheduled urban co-operative banks (SUCBs) remained constant at about 13.5 per cent between March 2018 and September 2018. However, at a disaggregated level, CRAR of five banks were below the minimum required level of 9 per cent. GNPAs of SUCBs as a percentage of gross advances increased from 6.2 per cent to 8.2 per cent and their provision coverage ratio31 declined from 61.4 per cent to 48.4 per cent during the same period. Further, RoA increased from 0.6 per cent to 0.7 per cent while the liquidity ratio32 declined from 34.8 per cent to 34.1 per cent during the same period.
Resilience – Stress tests Credit risk 2.41 The impact of credit risk shocks on the CRAR of SUCBs was observed under four different scenarios33. The results show that under a severe shock (scenario iv) of increase in GNPAs by two SD, which turns into loss category, the system level CRAR of SUCBs may come down below the minimum regulatory requirement. At individual level, a larger number of banks (30 out of 54) may not be able to maintain the minimum CRAR. Liquidity risk 2.42 A stress test on liquidity risk was carried out using two different scenarios; i) 50 per cent and ii) 100 per cent increase in cash outflows, in the one to 28 days’ time bucket. It was further assumed that there was no change in cash inflows under both the scenarios. The stress test results indicate that SUCBs may be significantly impacted under a stress scenario (out of 54 banks, 22 banks under Scenario i and 40 banks under Scenario ii). Section III Non-banking financial companies 2.43 As of September 30, 2018, there were 10,190 non-banking financial companies (NBFCs) registered with the Reserve Bank, of which 108 were deposit accepting (NBFCs-D). There were 276 systemically important non-deposit accepting NBFCs (NBFCs- ND-SI)34. All NBFC-D and NBFCs-ND-SI are subjected to prudential regulations such as capital adequacy requirements and provisioning norms along with reporting requirements. Performance 2.44 The aggregate balance sheet size of the NBFC sector35 increased to ₹26 trillion in September 2018 from ₹22.2 trillion in September 2017 expanding by 17.2 per cent. There was 5.8 per cent increase in share capital of NBFCs in September 2018 whereas borrowings grew by 17.2 per cent. Loans and advances of the NBFC sector increased by 16.3 per cent and investments increased by 14.1 per cent (Table 2.6). | Table 2.6: Aggregated balance sheet of the NBFC sector: y-o-y growth | | (Per cent) | | | March 2018 | September 2018 | | 1. Share capital | 8.3 | 5.8 | | 2. Reserves and surplus | 19.9 | 17.5 | | 3. Total borrowings | 19.1 | 17.2 | | 4. Current liabilities and provisions | 15.4 | 24.5 | | Total Liabilities / Assets | 15.0 | 17.2 | | 1. Loans and advances | 19.2 | 16.3 | | 2. Investments | 9.1 | 14.1 | | 3. Others | -5.9 | 27.5 | | Income/Expenditure | | | | 1. Total income | 8.9 | 16.7 | | 2. Total expenditure | 7.5 | 16.2 | | 3. Net profit | 22.9 | 16.2 | Note: Data are provisional.
Source: RBI supervisory returns. | 2.45 Net profit increased by 16.2 per cent (annualised) during the half year ended September 2018 as compared to 22.9 per cent during the year ended March 2018. RoA for the half year ended September 2018 was 1.8 per cent (annualised) as compared to 1.7 per cent during March 2018 (Table 2.6 and 2.7). Asset quality and capital adequacy 2.46 GNPAs of the NBFC sector as a percentage of total advances increased to 6.1 per cent in September 2018 from 5.8 per cent in March 2018. 2.47 As per extant guidelines, NBFCs are required to maintain a minimum capital level consisting of Tier-I36 and Tier-II capital, of not less than 15 per cent of their aggregate risk-weighted assets. NBFCs’ CRAR decreased to 21.0 per cent in September 2018 from 22.8 per cent in March 2018 (Chart 2.22). | Table 2.7: Select ratios of the NBFC sector | | (Per cent) | | | Mar-18 | Sep-18 | | 1. Capital market exposure to total assets | 7.3 | 7.0 | | 2. Real estate exposure to total assets | 6.6 | 5.9 | | 3. Leverage ratio | 3.4 | 4.0 | | 4. Net profit to total income | 15.3 | 16.5 | | 5. RoA | 1.7 | 1.8 | | 6. RoE | 7.5 | 4.4 | Note: Data is provisional.
Source: RBI supervisory returns. |
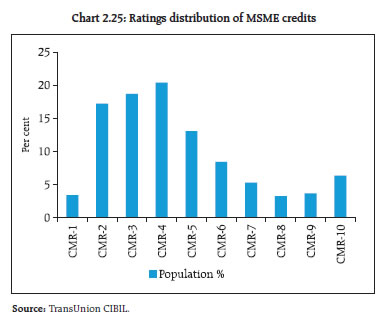
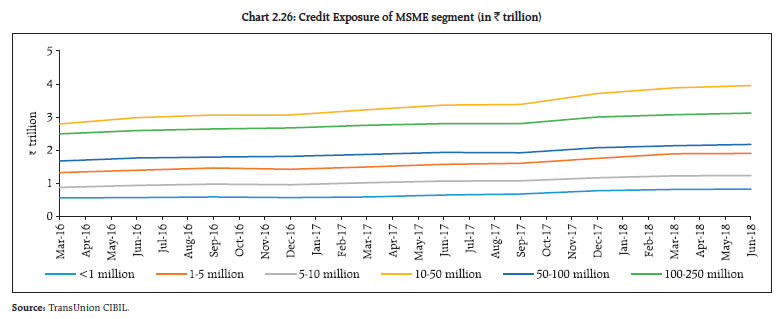
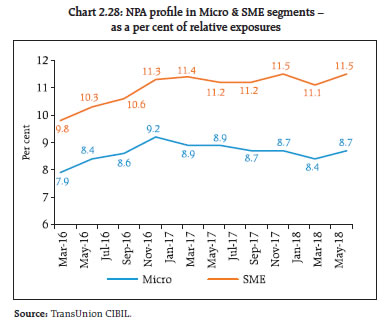
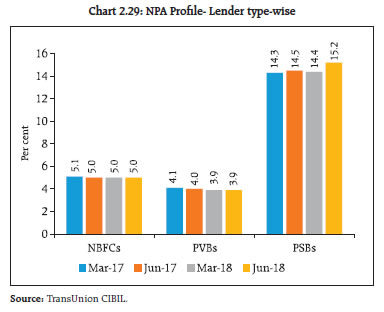
Resilience – stress tests System level 2.48 Stress test on credit risk for the NBFC sector for the year ended September 2018 was carried out under three scenarios: Increase in GNPA by (i) 0.5 standard deviation (SD), (ii) 1 SD and (iii) 3 SD. The results indicate that in the first scenario, the sector’s CRAR declines marginally to 20.6 per cent from 21.0 per cent. In the second scenario, it declines to 18.8 per cent and in the third scenario it declines to 14.7 per cent. Individual NBFCs 2.49 The stress test results for individual NBFCs indicate that under first two scenarios, around 8 per cent of the companies will not be able to comply with the minimum regulatory capital requirements of 15 per cent. Around 12 per cent of the companies will not be able to comply with the minimum regulatory CRAR norm under the third scenario. Section IV Micro, Small and Medium Enterprises (MSME) exposure of financial intermediaries – A comparative analysis 2.50 The quality of wholesale portfolio (sanctioned limit ≥ ₹50 million), particularly of Public Sector Banks (PSBs) has drawn significant attention. The Financial Stability Report (FSR) of June 2018 carried out a detailed analysis of wholesale portfolio origination quality of Solo vis-à-vis Consortium / Multiple Banking Arrangements (MBA). As had been seen therein, Consortium / MBA contribute disproportionately to the NPA share of PSBs relative to their share in advances. In a similar vein, issues relating to origination quality of MSME sector exposures of banks, amongst others, is examined here. More importantly, while the PCA framework poses restrictions on the expansion of wholesale portfolio, the credit extension to the MSME sector has been left relatively unconstrained for most of the PCA banks. Hence a related issue is the quality of portfolio origination. MSME sector is also being catered to by NBFCs. The portfolio performance across banks and NBFCs is contrasted and it is also important to see whether the issue of portfolio performance can be related to broad portfolio characteristics in this sector. For examining MSME sector and the issues outlined above, a uniform definition of impairment unrelated to regulatory forbearance as also their application by the related institution is required. Furthermore, the traditional definition of MSME based on ‘investment in plant and machinery’ for this purpose is considered to be inferior. The TransUnion CIBIL database which considers the entity’s total credit exposure38 and classifies impaired status based on performance of related accounts and has followed the 90 days past due norms for impairment across institutions, independent of the institutional accounting classification norms has been accessed for the entire analysis39. 2.51 The first issue in this regard that requires to be noted is that the inherent default characteristics of the MSME portfolio as defined herein is significant, as compared to wholesale credit. Charts 2.23 and 2.24 contrast the one-year default transition of CIBIL MSME rank (CMR) vis-à-vis CRISIL long term ratings and as can be seen therein MSME credits have much larger default transition probability. In addition, the MSME portfolio outstanding across financial intermediaries also have significant default risk embedded based on March 2018 ratings distribution (Chart 2.25). 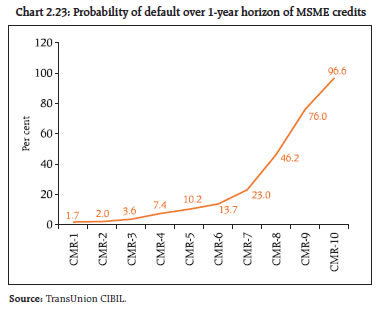 2.52 As can be seen from Chart 2.26, the relative exposure in ₹10-50 million size dominates the chart, possibly owing to specific targets for micro segments within priority sector for commercial banks. The relative market share of Public Sector Banks (PSBs) is shifting in favour of Private Sector Banks (PVBs) / Non-Banking Financial Companies (NBFCs) similar to that happening in the wholesale banking segment (Chart 2.27). Given the larger NPA rate in the SME segment relative to Micro segment (Chart 2.28), such shift may actually be beneficial for PSBs as regards their NPA profile. Yet, as Chart 2.29 demonstrates, the relative NPA share of PSBs, notwithstanding their significant branch network and hence local knowledge, far outstrips that of not only PVBs but also that of NBFCs, who have a relatively significant funding disadvantage vis-à-vis PSBs. In this regard, it is required to be stressed that NBFC impairment irrespective of extant regulatory norms is being based here at 90 days past due, similar to commercial banks. 
 2.53 The significant underperformance of the PSBs with regards to MSME, underscores the requirement of a more detailed look at their MSME portfolio profile. The MSME rating scale of TransUnion CIBIL shows a distribution of MSME rating grades that is consistent with the poor impairment performance. New Private Sector Banks (new PVBs)40 have a significantly better profile of ‘New To Bank’ (NTB) MSME accounts. They have acquired 47 per cent of the NTBs in the CMR 1-3 ranks as compared to 36 per cent for Old private sector banks (old PVBs), 37 per cent for PSBs and 34 per cent for NBFCs. Similarly, for the riskiest of MSME profile, new PVBs are performing significantly better, accounting for just 10 per cent of their recent acquisition in the CMR 7-10 credit space as compared to 14 per cent in old PVBs 17 per cent in PSBs and 14 per cent in NBFCs (Table 2.8). 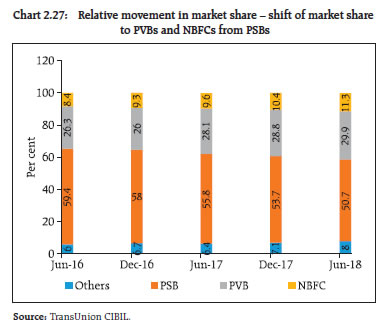
 2.54 While incremental credit acquisition under CMR 7-10 category across Old PVBs, PSBs and NBFCs appear comparable, the underlying nature of assets being acquired in this space across lenders are significantly different. TransUnion CIBIL estimates the lending of new PVBs to this high-risk segment is being significantly mitigated by extending only asset-backed loans (Commercial Vehicle, Commercial Equipment, Auto loans, Gold loans, Mortgage loans) while PSBs are extending plain working capital and term loan structures in this high-risk segment (62 per cent, Table 2.9). Even NBFCs, which have 14 per cent acquisition in this segment are doing better by having 80 per cent of their exposure in the form of asset-backed structures, thus significantly mitigating their risk. The issue of frauds in working capital limits in PSBs in general have been highlighted in the previous FSR41. 2.55 The risk snapshot of outstanding MSME portfolio (as on March 2018) is of particular importance. Chart 2.30 plots the rating distribution on Non-NPA-MSME portfolio across lenders. While new PVBs have around 6-7 per cent of their aggregate exposure in the CMR 7-10 ratings segment, exposure of NBFCs and PSBs to the segment is about 20 per cent. However, given the fact that aggregate NPAs of NBFCs are significantly lower than that of PSBs, vulnerability of PSBs appear to be significantly higher on this ratings spectrum. | Table 2.8: Distribution of incremental MSME borrowers across credit spectrum across lenders | | (per cent) | | | CMR- 1 | CMR- 2 | CMR- 3 | CMR- 4 | CMR- 5 | CMR- 6 | CMR-7 to 10 | | New PVBs | 5 | 19 | 23 | 24 | 13 | 7 | 10 | | Old PVBs | 2 | 13 | 20 | 27 | 12 | 12 | 14 | | PSBs | 2 | 14 | 21 | 25 | 11 | 11 | 17 | | NBFCs | 2 | 12 | 20 | 28 | 13 | 11 | 14 | | Source: TransUnion CIBIL. |
| Table 2.9: Proportion of asset acquisition in CMR 7-10 segment across lenders | | (per cent) | | | Plain Working Capital / Term Loan | Asset Backed / Retail Loans | Non- Fund Based / Trade | Other Facilities | | New PVBs | 22 | 62 | 7 | 9 | | Old PVBs | 60 | 21 | 8 | 10 | | Public Sector Banks | 62 | 16 | 12 | 10 | | NBFCs | 4 | 80 | 6 | 11 | | Source: TransUnion CIBIL |
2.56 The above analysis with regards to MSME exposure regards PSBs as an undifferentiated group. Given the fact that 11 of the 21 PSBs are currently under PCA, the nature of incremental exposure of somewhat disaggregated PSB group (between PCAPSBs and non-PCA PSBs) has been examined further. The analysis is restricted to exposures below ₹50 million since exposure exceeding this threshold gets covered under CRILC42 data. 2.57 As can be seen in Tables 2.10-2.11, the relative share of PCA-PSBs in this particular segment has increased in FY 2017-18 as compared to FY 2016- 17, i.e. during the period when PCA restrictions were imposed for exposures beyond a threshold. However, since such thresholds were generally well above ₹50 million, expansion of credit where aggregate exposure is less than ₹50 million is therefore not constrained by supervisory restrictions. In terms of absolute amount, PCA-PSBs incremental exposure to this segment increased by about 166 per cent from ₹226.80 billion to ₹602.80 billion between FY 2016- 17 and FY 2017-18. Such sharp increase may require examination of possible dilution of credit standards further and additions to supervisory strategy for PCA banks. 2.58 Table 2.12 and Table 2.13 tabulate NPA rate in respect of fresh acquisitions / renewals within the financial year (FY)43. To explain, for PSBs under PCA, 4.07 per cent of the fresh exposure / renewals upto September 2016 turned NPA by the end of September 2016. The numbers have shown a declining trend in PCA-PSBs between FY 2016-17 and FY 2017-18, yet 2 per cent of the freshly sanctioned portfolio turning impaired within the same FY in 2017-18 is till too high, especially given their constrained capital position and across the board superior performance among private financial intermediaries. Worryingly, other PSBs cohort have also shown an increased conversion rate in FY 2017-18 amidst across the board improvement. | Table 2.10: Incremental exposure of accounts with aggregate exposure < ₹50 million: March 2016 – March 2017 | | (per cent) | | Balance of borrowers acquired between Mar-16 to Mar-17 as of | New PVBs | Old PVBs | PSBs Under PCA | Other PSBs | Other Lenders | Grand Total (₹ billion) | | Mar-16 | 19 | 9 | 29 | 32 | 11 | 330.43 | | Jun-16 | 23 | 7 | 21 | 33 | 16 | 600.45 | | Sep-16 | 21 | 7 | 19 | 35 | 18 | 855.82 | | Dec-16 | 16 | 5 | 12 | 24 | 44 | 1529.87 | | Mar-17 | 23 | 8 | 15 | 35 | 19 | 1495.65 | Note: For quarter ending Mar 2017, the period is Jan1-Mar 31,
Source: TransUnion CIBIL. |
| Table 2.11: Incremental exposure of accounts with aggregate exposure < ₹50 million: March 2017 – March 2018 | | (per cent) | | Balance of borrowers acquired between Mar’17 to Mar’18 as of | New PVBs | Old PVBs | PSBs Under PCA | Other PSBs | Other Lenders | Grand Total (₹ billion) | | Mar-17 | 22 | 11 | 39 | 19 | 8 | 821.08 | | Jun-17 | 25 | 9 | 30 | 24 | 12 | 1181.47 | | Sep-17 | 28 | 8 | 26 | 25 | 14 | 1794.39 | | Dec-17 | 30 | 7 | 22 | 26 | 15 | 2366.31 | | Mar-18 | 31 | 7 | 20 | 26 | 15 | 2970.39 | Note: For quarter beginning March 2017, it is from March 1-31, 2017.
Source: TransUnion CIBIL. |
| Table 2.12: Slippage to NPA in fresh acquisition within a Financial year: FY 2016-17 | | (per cent) | | NPA Rate | New PVBs | Old PVBs | PSBs Under PCA | Other PSBs | Other Lenders | Grand Total | | Mar-16 | 0.22 | 0.54 | 2.59 | 0.67 | 0.96 | 1.15 | | Jun-16 | 0.11 | 0.99 | 4.03 | 0.74 | 0.86 | 1.33 | | Sep-16 | 0.38 | 0.96 | 4.07 | 0.95 | 1.10 | 1.44 | | Dec-16 | 0.69 | 1.49 | 3.98 | 1.00 | 0.30 | 1.02 | | Mar-17 | 0.95 | 1.21 | 4.69 | 1.17 | 0.79 | 1.58 | | Source: TransUnion CIBIL. |
| Table 2.13: Slippage to NPA in fresh acquisition within a Financial year: FY 2017-18 | | (per cent) | | NPA Rate | New PVBs | Old PVBs | PSBs Under PCA | Other PSBs | Other Lenders | Grand Total | | Mar-17 | 0.04 | 0.45 | 1.40 | 0.58 | 0.79 | 0.79 | | Jun-17 | 0.14 | 0.72 | 2.02 | 0.54 | 0.75 | 0.93 | | Sep-17 | 0.14 | 0.64 | 1.84 | 0.51 | 0.77 | 0.79 | | Dec-17 | 0.25 | 0.72 | 2.07 | 0.73 | 1.73 | 1.03 | | Mar-18 | 0.23 | 0.64 | 1.99 | 1.25 | 0.80 | 0.97 | | Source: TransUnion CIBIL. | 2.59 To conclude, PSB performance in the MSME segment trails that of other intermediaries. This is both in terms of inherent as well as realised credit risk. In terms of newly acquired portfolio, PCA-PSBs show a declining conversion rate to NPA in FY 2017- 18 although the rate still remains significantly large vis-à-vis other financial intermediaries. Given the importance of this segment as also the health of the PSBs, targeted monitoring of segmental performance specifically with regards to growth rate as also quality (specifically generation of poorly collateralised working capital/ term loan exposures) is required to be in place so as to ensure better screening of credits across all thresholds. Section V Network of the financial system44 2.60 A financial system can be visualised as a network if we consider the financial institutions as nodes and the ‘bilateral exposures’ between them as links joining these nodes. Financial institutions establish links with other financial institutions for efficiency gains and risk diversification, but these same links lead to risk transmission in case of a crisis. 2.61 The total outstanding bilateral exposures45 among the entities in the financial system increased from ₹28.7 trillion as on September-end 2017 to ₹32.4 trillion as on September-end 2018, amounting to a y-o-y increase of 13.1 per cent (Chart 2.31 a). 2.62 As on September-end 2018, Scheduled Commercial Banks (SCBs) continue to be the dominant players accounting for nearly 46.5 per cent of the financial system’s bilateral exposure. In other words, SCBs’ lending to and borrowing from all other entities in the financial system (including other SCBs) is 46.5 per cent of total lending and borrowings in the financial system (Chart 2.31 b). 2.63 Share of Asset Management Companies – Mutual Funds (AMC-MFs), Non-Banking Finance Companies (NBFCs) and Housing Finance Companies (HFCs) stood at 13.7 per cent, 12.5 per cent and 9.4 per cent respectively, as on September-end 2018 and has been steadily increasing for the last few quarters. This indicates their increasing interlinkages with the financial system. There is a decline in AMC-MFs’ share in the latest quarter (Q2:2018-19) as they have reduced their lending to NBFCs and HFCs (Chart 2.31 b). 2.64 Share of Insurance companies and all-India financial institutions (AIFIs) has been nearly constant in the range of 8-8.5 per cent each over the last few quarters. In contrast, Pension funds’ (PFs) share in total bilateral exposures has been increasing but in absolute terms, it is still quite small at about 1 per cent as at end-September 2018. 2.65 In terms of inter-sectoral47 exposures, AMCMFs followed by the insurance companies were the biggest fund providers in the system, while the NBFCs followed by the HFCs and SCBs were the biggest receiver of funds. Within the SCBs, however, both the Private Sector Banks (PVBs) and the Foreign Banks (FBs) had a net payable position vis-à-vis the entire financial sector, whereas the Public Sector Banks (PSBs) had a net receivable position (Chart 2.32 and Table 2.14).
| Table 2.14: Inter-sector assets and liabilities – September 2018 | | (₹ billion) | | Fin. Entity | Receivables | Payables | | PSBs | 7,579.0 | 3,149.8 | | PVBs | 3,469.6 | 8,795.1 | | FBs | 955.4 | 1,186.1 | | SUCBs | 137.3 | 56.0 | | AIFIs | 2,595.1 | 2,717.2 | | AMC-MFs | 8,345.5 | 500.4 | | Insurance companies | 5,098.4 | 201.6 | | NBFCs | 560.2 | 7,457.8 | | PFs | 658.2 | 58.2 | | HFCs | 412.0 | 5,688.6 | | Source: RBI supervisory returns and staff calculations. | 2.66 Between March 2018 and September 2018, net receivables of the AMC-MFs from the financial sector, which had been growing at a significant rate, registered a decline. In contrast, net receivables of the PSBs registered a significant jump during the same period. For all major borrowers (i.e. institutions which had a net payable position against the rest of the financial system), there was a moderation in the growth of their net payables to the financial sector (Chart 2.33). Inter-bank market 2.67 Size of the inter-bank market (both fund-based and non-fund-based) has consistently declined over the last few years when considered as a proportion of total assets of the banking system. During the last one year (September 2017 to September 2018), fund based inter-bank exposures have declined from 4.6 per cent to 3.8 per cent of the total bank assets (Chart 2.34). 2.68 This is generally in line with the global experience wherein unsecured inter-bank markets are increasingly being replaced with secured funding lines. Concomitantly, banks which were hitherto big lenders in the inter-bank market are now lending a greater proportion to NBFCs and HFCs. From a contagion perspective, this reduction in the size of the inter-bank market has a moderating influence on contagion losses within the banking sector. But on the other hand, this signifies a greater interlinking of the banking system with the rest of the financial sector. 2.69 PSBs continued to be the biggest player as a group in the inter-bank market with a share of 53.1 per cent (in comparison to a share of 63.7 per cent in the total bank assets) followed by PVBs at 31.1 per cent (share of 29.8 per cent in total bank assets) and FBs at 15.8 per cent (share of only 6.5 per cent in total bank assets) as at end-September 2018 (Chart 2.35).
2.70 As at end-September 2018, 73 per cent of the fund-based inter-bank market is short-term (ST) in nature in which the highest share was of ST deposits followed by Call Money (Call) and ST loans. The composition of long-term (LT) fund based inter-bank exposure shows that LT loans had the highest share followed by LT deposits (Chart 2.36). Inter-bank market: Network structure and connectivity 2.71 Inter-bank market usually has a core-periphery structure. The network structure48 of the banking system49 for end-September 2018 shows that there were 4 banks in the inner-most core and 9 banks in mid-core. Chart 2.37 depicts the core-periphery structure of the inter-bank market as at end-September 2018. A similar analysis for every quarter over the last 5 years indicates how inter-connectedness has evolved over time. During the last 5 years, number of banks in the inner-most core have ranged between 2 and 5. These are usually the biggest PSBs or PVBs (Chart 2.37). 2.72 Most foreign banks and almost all ‘old’ private banks are usually in the outermost periphery making them the least connected banks in India. Remaining PSBs and PVBs along with a few major FBs make up the mid and outer-core. 2.73 The degree of interconnectedness in the banking system (SCBs), as measured by the connectivity ratio50, has been declining slowly over the last five years. This is in line with a shrinking inter-bank market as mentioned earlier. The cluster coefficient51, which depicts local interconnectedness (i.e. tendency to cluster), has remained almost constant in the last 5 years indicating that clustering/ grouping within the banking network has not changed much over time (Chart 2.38).
Exposure of AMCs-MFs 2.74 AMC-MFs were the largest net providers of funds to the financial system. Their gross receivables were around ₹8,345 billion (around 36.5 per cent of their average AUM as on September 2018), and their gross payables were around ₹500 billion in September 2018. 2.75 Top three recipients of their funds were SCBs followed by NBFCs and HFCs. While their receivables from SCBs (in terms of percentage share) have gone up, their receivables from NBFCs have come down in the last few quarters. Share of HFCs has been almost constant (Chart 2.39a).
2.76 AMC-MFs were quite active in the money markets (particularly Commercial Paper (CP) and Certificate of Deposits (CD) markets) with about 47 per cent of their receivables being short-term in nature. The remaining 53 per cent of their receivables were long-term in nature, in which LT debt and Equity were the most important. Share of LT debt in AMC’s gross receivables has come down sharply at the cost of increasing share of other instruments particularly CPs and CDs (Chart 2.39b). Exposure of insurance companies 2.77 Insurance companies had gross receivables of ₹5,098 billion and gross payables of around ₹202 billion making them the second largest net providers of funds to the financial system as at end-September 2018. 2.78 Like AMC-MFs, a breakup of their gross receivables indicates that the top 3 recipients of their funds were SCBs followed by NBFCs and HFCs. LT debt and Equity account for almost all the receivables of the insurance companies, with little exposure to short-term instruments. In line with the conservative investment style of insurance companies, there has not been any significant change in both the share of different borrowers and different instruments (Chart 2.40a and b).
Exposure to NBFCs 2.79 NBFCs were the largest net borrowers of funds from the financial system with gross payables of around ₹7,458 billion and gross receivables of around ₹560 billion as at September-end 2018. A breakup of gross payables indicates that the highest funds were received from SCBs followed by AMC-MFs and insurance companies. The share of SCBs has been on an increasing trend for the last few quarters (Chart 2.41a). 2.80 The choice of instruments in NBFC funding mix clearly demonstrates the increasing role of both LT Loans (provided by SCBs and AIFIs) and CPs (subscribed to by AMC-MFs primarily and to a lesser extent by SCBs) and a declining share of LT debt (held by insurance companies and AMC-MFs) (Chart 2.41b). Exposure to housing finance companies 2.81 HFCs were the second largest borrowers of funds from the financial system with gross payables of around ₹5,689 billion and gross receivables of only ₹412 billion as at end-September 2018. HFCs’ borrowing pattern was quite similar to that of NBFCs except that AIFIs also played a significant role in providing funds to HFCs. Except SCBs, whose share in providing funds to HFCs has increased, share of AMCs, insurance companies and AIFIs has declined (Chart 2.42a). 2.82 As is the case of NBFCs, LT debt, LT loans, and CPs were the top three instruments through which HFCs raised funds from the financial markets though their funding mix has undergone a significant change in the last six quarters. Reliance on CP (subscribed to by AMCs and to a lesser extent by SCBs) and LT Loans (from Banks and AIFIs) has increased remarkably and that on LT debt has declined. (Chart 2.42b). The CP Market: A closer look52 2.83 Among all the short-term instruments through which financial institutions raise funds from each other, CP is the most important one and in the light of the recent turbulence and re-pricing of risk in this market, the network topology of the CP market is presented. 2.84 In the CP market, AMC-MFs are the biggest investors and HFCs, NBFCs and AIFIs are the biggest issuers. There has been a substantial increase in the size of the outstanding CPs between September 2017 and September 2018 (Chart 2.43 and 2.44). Contagion analysis53 Joint Solvency54-Liquidity55 contagion analysis for SCBs 2.85 A contagion analysis is a network technique used to estimate the systemic importance of different banks. Failure of a bank which is systemically more important leads to greater solvency and liquidity losses to the banking system. Solvency and liquidity losses, in turn, depend on the initial capital and liquidity position of the banks along with the number, nature (whether it is a lender or a borrower) and magnitude of the interconnections that the failing bank has with the rest of the banking system.
2.86 In this analysis, banks are hypothetically triggered one at a time and their impact on the banking system is seen in terms of the number of subsequent bank failures that take place and the amount of solvency and liquidity losses that are incurred (Chart 2.45). 2.87 Till the last edition of FSR, failure criterion for solvency contagion was taken as Tier-1 CRAR falling below 7 per cent. However as at end-September 2018, 5 PSBs did not meet this criterion and under the assumption of the model employed, these 5 banks would have failed. 2.88 It is because of the implicit sovereign guarantee which these PSBs enjoy that breaching the regulatory capital requirement did not create a situation where these banks could have defaulted. To account for these differences between PSBs and PVBs, contagion analysis has been carried out under two approaches this time. 2.89 In the 1st approach, the stability lent by the implicit sovereign guarantee of PSBs is accounted for by taking a differentiated solvency failure criterion for PSBs and PVBs. A PSB is considered to have failed only if its Tier -1 Capital becomes less than 0, while for PVBs the criterion remains same as earlier i.e. Tier-1 CRAR falling below 7 per cent. Now when a hypothetical bank failure is triggered, PSBs will still be vulnerable to the losses emanating from the failed trigger bank but will not be contagious as they are assumed to absorb all the losses (as long as their Tier-1 CRAR remains greater than 0 per cent) and not transmit them further. 2.90 In the 2nd approach, it is assumed that the PSBs don’t enjoy the sovereign backstop, and for all practical purposes are similar to PVBs. Under the assumption of the extant model, this then implies that the five PSBs which don’t meet the criterion of Tier-1 capital of 7 per cent would default and start a contagion process on their own. So now, when we consider the hypothetical failure of a trigger bank, the losses that would accrue to the system would not only be because of the trigger bank in consideration, but also because of the 5 PSBs that were automatically triggered. 2.91 For any given trigger bank, the difference between the two approaches can be seen as the potential of amplification of solvency/liquidity losses caused by PSB defaults and as a proxy for the potential systemic loss caused by an inadequately capitalised public sector banking system given the implicit sovereign guarantee. 2.92 Losses caused by the top 5 banks with the maximum capacity to cause solvency losses are presented under both approaches. Under approach 1, failure of Bank 1 will cause a solvency loss of 7.3 per cent of Tier 1 capital of the banking system, liquidity loss of 3.3 per cent of total HQLA and a failure of 7 banks. Under approach 2, solvency losses would have been amplified to 12.9 per cent of Tier 1 capital, liquidity loss to 7.3 per cent of HQLA and the number of defaulting banks would increase to 23 (Charts 2.46, 2.47 and 2.48).
2.93 In this context an analysis on the potential systemic footprint of banks subjected to the prompt corrective action (PCA) of the RBI is presented in Box 2.1. Solvency contagion impact56 after macroeconomic shocks to SCBs 2.94 The contagion impact of the failure of a bank is likely to be magnified if macroeconomic shocks result in distress in the banking system in a situation of a generalised downturn in the economy. Macroeconomic shocks are given to the SCBs, which cause some of the SCBs to fail the solvency criterion, which then act as a trigger causing further solvency losses. The initial impact of macroeconomic shocks on individual banks’ capital was taken from the macro-stress tests, where a baseline and two (medium and severe) adverse scenarios were considered for September 201957. Box 2.1: PCA banks: Estimating the change in their Systemic Footprint using Contagion Analysis This exercise has been carried out using contagion analysis to assess whether PCA framework has helped in reducing the systemic footprint of PCA banks. The true or the underlying systemic footprint can only be estimated if we do away with the implicit sovereign guarantees enjoyed by the PCA banks (as in Approach 2 earlier). Systemic impact, then, can be estimated by considering the total solvency losses that will be incurred by the banking system if PCA banks fail simultaneously. Solvency losses due to a simultaneous failure of 11 PCA banks have declined from ₹735 billion (6.8 per cent of Total Tier-1 capital) to ₹342 billion (3.1 per cent of total Tier-1 Capital) in the last 4 quarters and to this extent the PCA framework has been successful in reducing the systemic footprint of the PCA banks (Chart 1) Lending and other restrictions imposed on PCA banks under the PCA framework have led to a reduced impact on the system through connectivity. This has reduced the contagion losses incurred by the banking system in case of PCA banks’ failure (Chart 2).
| 2.95 Initial capital loss due to macroeconomic shocks is 5.7 per cent, 9.5 per cent and 13 per cent of Tier 1 Capital for baseline, medium and severe stress scenarios respectively. The number of banks failing due to macroeconomic shocks are 12 for baseline and 14 each for medium and severe stress. 2.96 The contagion impact overlaid on the outcome of the macro stress test shows that additional solvency losses due to contagion (on top of initial loss of capital due to the macro shocks) to the banking system in terms of Tier 1 capital are limited to 5.4 per cent for the baseline, 7.6 per cent for both medium and severe stress. Also, the additional number of defaulting banks due to the contagion (excluding initial defaulting banks due to the macro shocks) are two for baseline, six each for medium and severe stress (Chart 2.49).
|