Well over a decade after the global financial crisis, financial vulnerabilities continue to build globally although the financial system resilience has increased. Domestic financial markets saw some disruption emanating from the non-bank space and its growing importance in the financial system. In order to finetune the supervisory mechanism for the banks, the Reserve Bank has recently reviewed the structure of supervision in the context of the growing diversity, complexities and interconnectedness within the Indian financial sector. The Securities and Exchange Board of India (SEBI) has put in place broad guidelines for interoperable framework between Clearing Corporations. It has also concurrently overhauled the margin framework to make it more robust. The Insurance Regulatory and Development Authority of India (IRDAI) has constituted a committee to identify Systemically Important Insurers. The Insolvency and Bankruptcy Board of India (IBBI) is showing steady progress in the resolution of stressed assets. National Pension System (NPS) and Atal Pension Yojana (APY) have both continued to progress towards healthy numbers in terms of total number of subscribers as well as assets under management (AUM). With an increase in the quantum of frauds reported in the banking system being attributed to prevalence of legacy cases particularly in PSBs, there is a need for timely recognition and reporting to reduce their economic costs and to address the vulnerabilities in a proactive and timely manner. International and domestic regulatory developments International developments 3.1 Well over a decade after the global financial crisis (GFC) and the subsequent policy responses, the October 2018 Global Financial Stability Report (GFSR) observed that , “Although the global banking system is stronger than before the crisis, it is exposed to highly indebted borrowers as well as to opaque and illiquid assets and foreign currency rollover risks.” GFSR (April 2019) reiterates that “… financial vulnerabilities have continued to build in the sovereign, corporate, and non-bank financial sectors in several systemically important countries leading to elevated medium-term risks”, given that the financial conditions continue to be accommodative. More importantly, the key trigger for the GFC and the subsequent backlash in political economy terms impinges on society at large. Box 3.1 sheds some light on the social dimension of risks and its implications for society. 3.2 One area where jurisdictions are trying to strengthen the oversight mechanism subsequent to GFC is ‘financial accounting’. In India, the regulatory framework for NBFCs has been overhauled with the introduction of Ind AS by the Ministry of Corporate Affairs in a phased manner (please refer footnote 40 of Chapter II). Concurrently, the European Banking Authority (EBA) adopted IFRS 9, replacing the previous accounting standard for financial instruments (IAS 39) for European banks with effect from January 01, 2018. IFRS 9 is an improvement over IAS 39 in terms of accounting for financial instruments by banks since it moves from an earlier model of an incurred loss approach to a more forward looking expected credit loss approach for credit provisioning. To get a better understanding of the initial impact of the new provisions, EBA recently published1 its first observations on the impact and implementation of IFRS by EU institutions. Some of its significant observations are: Box 3.1: Risk society – The paradigm of risk? The way ‘risk’ is being talked about in the contemporary world, as if nothing has changed much after the GFC to herald a less risky or riskless environment, could be an indication that the world is along the evolutionary path of transition from ‘modern industrial society’ to ‘risk society’ (Ulrich Beck and Anthony Giddens) where one must probably acquiesce in the inevitability of ‘manufactured risks’ and the outcomes of ‘reflexivity’ (Ulrich Beck, Anthony Giddens and Scott Lash) to better understand and face evolving risks which are not restricted to place or time. The post crisis developments in political economies across the world and the debates over increasing inequality along with the linkages between social and financial stability forced the world to rethink about many modern ‘economists’ view of the society’ that is largely decoupled with the sociological underpinnings transforming the society. Beck opined that the risk which is inherent in modern society would contribute towards the formation of a global risk society. His ‘risk society’ revolves around the following thoughts: Risks unlike wealth accumulate at the bottom of the society and are unevenly distributed although they carry the ‘social boomerang effect’ and are transnational to encompass everyone and to catch up with those who produce those risks – such as those that lead to environmental degradation or to major financial crises. In other words, ‘risk’ is of everyone’s concern ultimately and hence the calls for ‘cosmopolitan empathy’ and ‘cosmopolitan solidarity’ – something akin to global cooperation to address systemic impact of risks or even a fiscal-monetary cooperation to generate growth sans inflation. Since the society is also reflexive to reorient itself to deal with newer risks, leading to new layers of risks over the old ones, possibly also implying that managing of small-scale risks can end up engendering much larger tail risks, may be due to the ‘confidence build-up’ – something that is extremely relevant in the light of the global financial crisis and even its aftermath. The role of ‘history’ in a risk society is different. “In the risk society, the past loses the power to determine the present. Its place is taken by the future, thus, something non-existent, invented, fictive as the ‘cause’ of current experience and action” (Beck 1992: p 34). Remember the gloomy prognosis during the middle of the last decade, just ahead of the GFC, of the pundits about the impending shortage of food grains and commodities for human consumption and their skyrocketing prices! In other words, the notion of risk is an attempt to bring the future into the present and make it calculable (Horlick-Jones, 2004: 109)2 “Can the concept of risk carry the theoretical and historical significance which is demanded of it here? It is also true that risks are not an invention of modernity”, though, “The risks accepted by Columbus were personal risks, not global dangers or mass destructors” (Beck 1992: p 21). On the other hand, the increasing specialization demanded by the ‘industrial society’, might also be stifling the ability to grasp the real-world developments which are getting more complex and interconnected. “…the dominant risk paradigms have been able to surround themselves with the appearance (and self-delusion) of critical pluralistic debate and learning, through the growth of a plethora disciplines, sub-disciplines and schools of thought vigorously competing for ascendancy and recognition in the interpretation and management of risks of modern technological society” (Scott Lash, Bryan Wynne – Beck 1992 :p 5). Think about a bank or a fund manager taking risks on behalf of the depositors/investors? Or the role played by technology in financial markets – the necessary evil? Are ‘risk’ and ‘crisis’ being increasingly viewed as synonyms and is risk an evil? While Beck clarifies that “…risk is, unlike crisis not an exception but rather the normal state of affairs” (Beck 2013), Giddens (1999) feels that there “can be no question of merely taking a negative attitude towards risk. Risk needs to be disciplined, but active risk taking is a core element of a dynamic economy and an innovative society” In this context it is a plausible assumption that risk is being used in the ‘Knightian uncertainty’ sense. To get a perspective on the difference, as Knight clarifies “Uncertainty must be taken in a sense radically distinct from the familiar notion of Risk, from which it has never been properly separated.... The essential fact is that ‘risk’ means in some cases a quantity susceptible of measurement, while at other times it is something distinctly not of this character; and there are far-reaching and crucial differences in the bearings of the phenomena depending on which of the two is really present and operating.... It will appear that a measurable uncertainty, or ‘risk’ proper, as we shall use the term, is so far different from an unmeasurable one that it is not in effect an uncertainty at all.”3 How is the world dealing with risks? “These tensions between business and the elimination of risks, and between the consumption and production of risk definitions, range across all areas of social action……. The market expanding exploitation of risks favours a general to and fro between revealing and concealing risks – with the effect that ultimately no one quite knows whether the ‘problem’ might not be the ‘solution’ or vice versa, who profits from what, where responsibilities for creation are being covered up or concealed through causal speculation……”. How the stakeholders react to risks in a risk society is quite interesting. “The risk society shifts from hysteria to indifference and vice versa”, ……. the latter “where everything turns into a hazard, somehow nothing is dangerous anymore” (Beck 1992: p 37). This fatalistic acceptance comes when the society is irreparably affected by the risks – the kind of surrender to the consequences after the GFC happened for example. “The idealized model of the risk system, reflected in the scientists’ exclusive focus on the laboratory knowledge, contained not only questionable physical assumptions but a naive model of that part of the society. What is more, it was deployed in effect as a social prescription, without any interest or negotiation over its validity or acceptability” (Scott Lash, Bryan Wynne – Beck 1992,:p 5). More immediately, globalization, digital technologies, unconventional monetary policies, hyper-competition and immigration have created a few winners and pools of losers. This has inevitably led to backlash putting enormous strains on the post WWII welfare society. How does society deal with emerging ‘social-financial instability’ loops? A widely accepted way to address financial instability is to build in redundancies. Applying the same conceptual framework herein, possibly there’s scope to reexamine the redistributive model of the state currently employed. To the extent such redistributive model targets better skill development / re-tooling for the future, the economic impact of such redundancy provisions may in fact be salutary. Hence, this risk-mitigation versus risk acceptance framework would clearly be preferable to the “fatalistic acceptance” referred to earlier. References: 1. Ulrich Beck, Scott Lash, Bria n Wyne (1992), Risk Society: Towards a New Modernity. New Delhi: Sage. (Translated from the German Risikogesellschaft, 1986). 2. Giddens, Anthony (1999) Runaway World: How Globalization is Reshaping Our Lives. London : Profile. 3. Ulrich Beck (2013), World at Risk. Polity: Cambridge (Translated from the German Weltrisikogeselshafft, 2007) 4. Clea D. Bourne : ‘Remaking’ the Economy after Crisis, Central Banking in Risk Discourses (2016). 5. Knight, F. H. (1921), Risk, Uncertainty, and Profit. Boston And New York: Houghton Miffin Company |
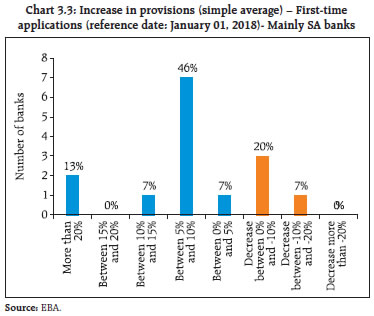
a) The day-one impact on Common Equity Tier 1 (CET1) ratios, based on the data collected for the sample of banks,4 was a negative 51 bps (based on a simple average). However, there was significant variability in the CET1 impact among the banks in the sample (Chart 3.1). Banks using mainly an internal rating based (IRB) approach experienced a significantly smaller negative impact in terms of the CET15 (-19 bps on a simple average), than banks mainly using the standardised approach (SA) for credit risk (-157 bps on a simple average). 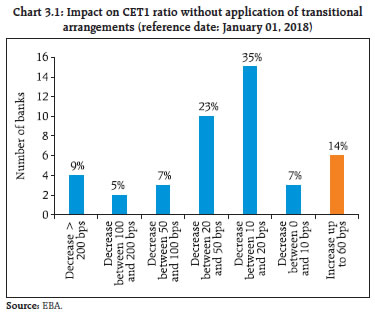 b) The difference between the increase in provisions and the related CET1 impact in relative terms for IRB and SA banks can be mainly attributed to the fact that for IRB banks regulatory expected losses are already reflected in CET1. In practice, this means that the existing IRB shortfall under the erstwhile incurred loss-based IAS 39 absorbs part of the increase in provisions when applying IFRS 9, as it was already being deducted from CET1 (Charts 3.2 and 3.3). 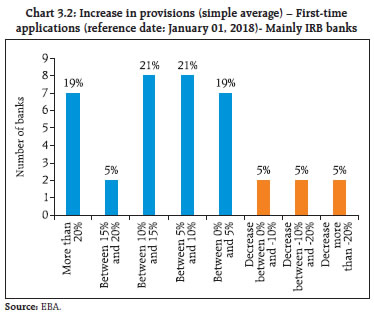
 c) As regards asset classification, banks reported that 85 per cent of on-balance sheet exposures (gross amount) were allocated to stage 1; 8 per cent to stage 2; and 7 per cent to stage 3. Regarding the off-balance sheet exposures (commitments and financial guarantees), the allocation corresponded to 93 per cent, 5 per cent and 2 per cent in stages 1, 2 and 3 respectively. In this regard, it is also relevant to understand how the subjective assessments of impairment have been applied with regard to expected credit loss (ECL). Under IFRS 9, assets 30 days past due are required to be classified as stage 2 impaired on a rebuttable basis. As can be seen in Table 3.1, for 10 of the 53 banks, no assets beyond 30 days past due were unimpaired implying that only 19 per cent banks had adopted the automatic factor to transfer their exposures from stage 1 to stage 2 without applying subjective evaluation allowed by the accounting regime. This possibly highlights the importance of standardisation of benchmarks for use in subjective evaluations so as to make the balance sheet and P&L numbers comparable. d) Concurrently, it is also relevant to find out to what extent assets classified under 90 days past due as impaired (under incurred loss model) qualified as stage 3 impaired under the ECL impairment model. Table 3.2 shows that 26 per cent banks considered all assets past due beyond 90 days as impaired. e) These observations may be useful for jurisdictions that are seeking to move towards IFRS 9, especially the ‘subjectivity’ that is embedded in IFRS 9 which could be prone to misuse in jurisdictions fraught with ‘governance’ problems. | Table 3.1: Assets more than 30 days past due classified in stage 1 (reference date: June 30, 2018) | | 30-days-past-due assets in stage 1 | 0%6 | Between 0% and 10% | More than 10% | | Number of banks | 10 | 27 | 16 | | Source: EBA. |
| Table 3.2: Assets more than 90 days past due not classified in stage 3 (reference date: June 30, 2018) | | 90 days past due assets not classified in stage 3 | 0%7 | Between 0% and 5% | More than 5% | | Number of banks | 14 | 26 | 13 | | Source: EBA. | 3.3 With regard to bank supervision, the revised market risk capital framework was recently endorsed by the Group of Governors and Heads of Supervision (GHOS). Some of the key changes include (a) clarifications on the scope of exposures that are subject to market risk capital requirements; (b) a simplified standardised approach for use by banks that have small or non-complex trading portfolios; (c) refined standardised approach treatment of foreign exchange risks and index instruments; (d) revised standardised approach risk weights applicable to general interest rate risk, foreign exchange and certain exposures subject to credit spread risks; (e) revisions to the assessment process to determine whether a bank’s internal risk management models appropriately reflect the risks of individual trading desks; and (f) revisions to the requirements for identifying risk factors that are eligible for internal modelling. This revised standard comes into effect on January 01, 2022. Once implemented, the revised framework is estimated to increase market risk capital requirements by 22 per cent on average as compared with Basel 2.5 as against 40 per cent increase under the framework issued in 2016. Market risk-weighted assets (RWAs) will account for 5 per cent of total RWAs on average, compared with 4 per cent under Basel 2.5.8 3.4 On the OTC-derivatives front, the G-20 had outlined five areas of reforms - trade reporting of OTC derivatives; central clearing of standardised OTC derivatives; exchange or electronic platform trading, where appropriate, of standardised OTC derivatives; higher capital requirements for non-centrally cleared derivatives; and initial and variation margin requirements for non-centrally cleared derivatives. Central clearing is a key feature of global derivatives markets since the GFC. Almost two-third of over-the- counter (OTC) interest rate derivative contracts, as measured by outstanding notional amounts, are now cleared via central counterparties (CCPs). Systemically important banks and CCPs interact in highly concentrated OTC markets. The endogenous interactions between banks and CCPs in periods of stress could potentially lead to destabilising feedback loops both in asset and derivative markets. In this context, a recent BIS review9 highlighted the potential feedback loop that can consequently form. It calls for mutually reinforcing regulatory standards for CCPs and banks as also incentivising the two entities to work together to ensure financial stability. 3.5 The International Organisation of Securities Commissions (IOSCO) published a report10 setting out its views on good practices for audit committees of listed companies in supporting the quality of external audits. The report notes that while the auditor has primary responsibility for audit quality, the audit committee should promote and support quality thereby contributing to greater confidence in the quality of information in the listed company’s financial reports. The report also recommends certain best industry practices with regard to appointment as also assessment of the auditors’ independence. 3.6 The International Association of Insurance Supervisors (IAIS) launched a consultation document11 on a proposed holistic framework for the assessment and mitigation of systemic risks in the insurance sector. The sources of systemic risks that it identified include, (a) liquidity risk, (b) interconnectedness, (c) lack of substitutability and (d) other risks like climate and cyber risks. Climate risks affecting insurers can be grouped into two main categories: physical risks arising from extreme climate events and transition risks arising due to policies and regulations for transitioning to a low carbon economy. The report posits that non-incorporation of physical risks arising due to climate change can potentially result in underpricing / under reserving, thereby overstating insurance sector resilience. IAIS further identifies three transmission channels whereby these sources of systemic risks may be transmitted to the broader economy: (i) the asset liquidation channel, (ii) exposure channel and, (iii) the critical functions channel. IAIS proposes internalising the systemic transmission channels in its policy guidelines. 3.7 The Basel Committee on Banking Supervision (BCBS) published a report12 identifying and comparing a range of regulatory and supervisory cyber-resilience practices observed in banks across jurisdictions. The current challenges and initiatives for enhancing cyber-resilience are summarised in 10 key findings and illustrated by case studies which focus on concrete developments in the jurisdictions covered. BCBS classifies the expectations and practices into four broad dimensions of cyber resilience: governance and culture; risk measurement and assessment of preparedness; communication and information-sharing; and interconnections with third parties. Some of the key findings of the study are: -
In most jurisdictions, broader IT and operational risk management practices are quite mature and are used for addressing cyber-risks and for supervising cyber-resilience. Despite convergence in high level expectations, technical specifications and supervisory practices differ across jurisdictions. -
Although management models such as the three lines of defence (3LD) model are widely adopted, cyber-resilience is not always clearly articulated across technical, business and strategic lines leading to the ineffectiveness of the 3LD model. -
Globally, forward-looking indicators of cyber-resilience are being picked up through the most widespread practices, though no standard set of metrics has emerged, yet causing strain for supervisors and banks to comment on cyber-resilience. -
Regulatory frameworks for outsourcing activities across jurisdictions are quite established and share substantial commonalities. However, there is no common approach regarding third parties beyond outsourced services, which implies different scope for regulations and supervisory actions. 3.8 The Financial Action Task Force (FATF), in its 2019 report13 to G-20 ministers and central bank governors sets out its ongoing work to fight money laundering and terrorist financing. The report notes that blockchain and other distributed ledger technologies may deliver significant benefits to the financial system and the broader economy. Virtual assets, however, also pose serious money laundering and terrorist financing risks. FATF is actively monitoring virtual currency/crypto-asset payment products and services, including pre-paid cards linked to virtual currencies, Bitcoin ATMs and initial coin offerings (ICOs). Domestic developments I. The Financial Stability and Development Council 3.9 Since the publication of the last FSR in December 2018, the Sub-Committee of the Financial Stability and Development Council (FSDC) held its 22nd meeting chaired by the Governor, RBI on March 14, 2019. It discussed various issues that impinge on financial stability in the country, including ways of addressing challenges pertaining to the quality of credit ratings, interlinkages between housing finance companies and housing developers and interlinking of various regulatory databases. The Sub-Committee also reviewed the activities of its various technical groups and the functioning of State Level Coordination Committees (SLCCs) in various states / union territories. A thematic study on financial inclusion and financial stability and a National Strategy for Financial Inclusion (NSFI) are the other issues that were discussed. 3.10 The Financial Stability and Development Council held its meeting on 19th June, 2019 which was chaired by the Finance Minister of India. The Meeting reviewed the current global and domestic economic situation and financial stability issues including, inter-alia, those concerning Banking and NBFCs. The Council also held consultations to obtain inputs/ suggestions of the financial sector regulators for the Budget. All the regulators presented their proposals for the Union Budget 2019-20. The Council took note of the activities undertaken by the FSDC Sub-Committee chaired by Governor, RBI and the action taken by members on the decisions taken in earlier meetings of the Council. II. Banks (A) Supervision 3.11 The revised prudential framework on stressed assets issued by the Reserve Bank on June 7, 2019 significantly extends the erstwhile stressed asset resolution framework as also builds in incentive for early adoption of a resolution plan (RP). The major features of the revised framework are as follows: i. Applicability: Scope widened to include Small Finance Banks, Systematically Important NBFC (non-Deposit taking) & NBFCs (Deposit taking) besides SCBs (excl. RRB) & All India Term Financial Institutions. ii. Resolution Strategy: Lenders shall undertake a prima facie review of the borrower account within thirty days from default (“Review Period”) and may also decide on the resolution strategy, including the nature of the Resolution Plan (RP), the approach for implementation of the RP, etc. The lenders may also choose to initiate legal proceedings for insolvency or recovery. iii. Adoption of Inter Creditor Agreement (ICA): All Lenders (including NBFCs and ARCs) to sign ICA; ICA addresses concerns of dissenting lenders who are to receive value greater than or equal to Liquidation value in RP. iv. Adoption of Majority vote: Resolution Plan (RP) will be binding on all lenders if approved by lenders representing 75% in value of outstanding debt (Fund based+Non-fund based) and 60% by number. Earlier, no such limit was prescribed. v. Time-Lines: Defined time-lines of 210 days, after the date of first default, for cases with Aggregate Exposure (AE) of greater than ₹20 billion (accounts with AE upto ₹15 billion to be covered by January 1, 2020, and other accounts from a date that would be specified in due course). vi. Implementation Conditions for RP: RPs involving restructuring / change in ownership in respect of accounts where the aggregate exposure of lenders is ₹1 billion and above, shall require independent credit evaluation (ICE) of the residual debt by credit rating agencies (CRAs) specifically authorised by the Reserve Bank for this purpose. vii. Disincentive on delay in resolution: Additional provisioning for delayed implementation of RP or filing of insolvency application under IBC. viii. Incentive for Implementation: Reversal of additional provisioning on implementation of RP or filing of insolvency application under IBC. 3.12 The Central Board of the Reserve Bank recently reviewed the present structure of supervision in RBI in the context of the growing diversity, complexities and interconnectedness within the Indian financial sector. With a view to strengthening the supervision and regulation of commercial banks, urban co-operative banks and non-banking financial companies, the Board decided to create a specialised supervisory and regulatory cadre within RBI. (B) Banking Frauds14 3.13 A brief analysis of frauds with amounts involving ‘₹0.1 million and above’ reported during the last 10 years is presented in Chart 3.4. It was observed that in many cases frauds being reported now were perpetrated during earlier years. The recognition of date of occurrence is not uniform across banks. To ensure timely and assured detection of frauds in large accounts, the Government issued a direction in February 2018 to all PSBs to examine all NPA accounts exceeding ₹0.5 billion from the angle of possible fraud. Systemic and comprehensive checking of legacy stock of NPAs of PSBs for fraud during 2018-19 has helped unearth frauds perpetrated over a number of years, and this is getting reflected in increased number of reported incidents of frauds in recent years compared to previous years. 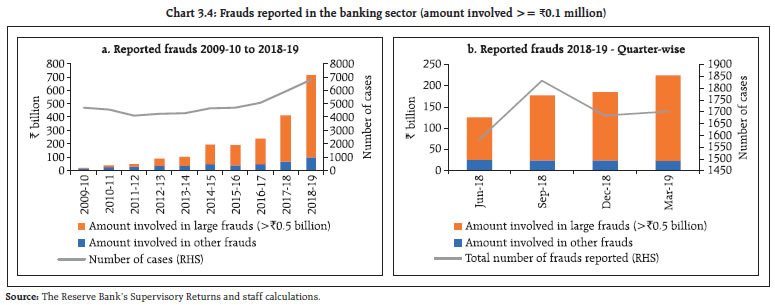 3.14 The time-lag between the date of occurrence of a fraud and the date of its detection is significant. The amount involved in frauds that occurred between 2000-01 and 2017-18 formed 90.6 per cent of those reported in 2018-19 (Chart 3.5). 3.15 With regard to frauds reported, the relative share of PSBs in the overall fraud amount reported in 2018-19 was in excess of their relative share in the credit (Chart 3.6). 3.16 Similar to earlier trends, loans and advances related frauds continued to be dominant, in aggregate constituting 90 per cent of all frauds reported in 2018-19 by value. In the advance related fraud category, cash credit / working capital loans related frauds dominated in PSBs whereas retail term loans (non-housing) were a major contributor to advance related frauds in PVBs (Chart 3.7).  3.17 As on December 31, 2018, 204 borrowers who had been reported as fraudulent by one or more banks were not classified as such by other banks having exposure to the same borrower. One of the major areas of non-uniformity in processes pertains to identifying Red Flagged Accounts (RFA). The red flagging of accounts based on an indicative list of early warning signals is not uniform across banks. In several cases, banks are unable to confirm RFA tagged accounts as frauds or otherwise within the prescribed period of six months. As per CRILC data, at the end of March 31, 2019, the RFA reported by banks exceeded the stipulated six-month period in 176 cases. The reasons cited for delays in recognising frauds include delays in completing forensic audits or inconclusive findings of forensic audits. It is proposed to revise the Master Direction on Frauds in this regard and issue necessary guidance to banks. 3.18 Since it is much more difficult to quantify operational risks than credit or market risks as some operational risks interact with credit and market risks through people and processes in a complex way, timely recognition is one important aspect that can reduce the economic costs of frauds. The Reserve Bank is reviewing its Master Direction on frauds and considering additional measures for timely recognition of frauds and enforcement action against violations. (C) Enforcement 3.19 During July 2018 to June 201915, the Enforcement Department (EFD) undertook enforcement action against 47 banks (including nine foreign banks, one payment bank and a co-operative bank), and imposed an aggregate penalty of ₹1,221.1 million for non-compliance with/contravention of directions on fraud classification and reporting, discipline to be maintained while opening current accounts and reporting to the CRILC platform and RBS; violations of directions/ guidelines issued by the Reserve Bank on know your customer (KYC) norms and Income Recognition & Asset Classification (IRAC) norms; payment of compensation for delay in resolution of ATM-related customer complaints; violation of all-inclusive directions and specific directions prohibiting opening of new accounts; non-compliance with the directions on the cyber security framework and time-bound implementation and strengthening of SWIFT-related operational controls; contravention of directions pertaining to third party account payee cheques and non-compliance with directions on note sorting, directions contained in Risk Mitigation Plan (RMP), directions to furnish information and directions on ‘Guarantees and Co-acceptances’, among others. (D) Resolution and recovery 3.20 The Insolvency and Bankruptcy Code, 2016 (IBC or Code) is an evolving piece of economic legislation. The implementation of the Code has greatly overhauled the regulatory measures in respect of resolution of impaired assets and contributed to a more efficient deployment of capital. The corporate insolvency resolution process under the Code envisages estimating a fair value and liquidation value of the assets of the corporate debtor (CD). The Insolvency and Bankruptcy Board of India (IBBI) commenced the valuation examination for asset classes of (a) securities or financial assets, (b) land and buildings, and (c) plant and machinery with effect from March 31, 2018. The Insolvency Law Committee submitted its second report on October 16, 2018 recommending the adoption of the UNCITRAL Model Law of Cross Border Insolvency, 1997, which provides for a comprehensive framework to deal with cross-border insolvency issues. It also recommended a few carve-outs to ensure that there is no inconsistency between the domestic insolvency framework and the proposed cross-border insolvency framework. 3.21 Quarter wise progress in terms of insolvency resolution is given in Table 3.3. Out of 1,858 corporates in the resolution process till March 2019, 152 were closed on appeal or review, 94 resulted in resolution and 378 yielded liquidation. About 50 per cent of the admitted corporate insolvency resolution processes were triggered by operational creditors (OC) and about 40 per cent by financial creditors (Table 3.4). | Table 3.3: The corporate insolvency resolution process -- Number of corporate debtors | | Quarter | CIRPs at the beginning of the Quarter | Admitted | Closure by | CIRPs at the end of the Quarter | | Appeal/ Review/ Settled | Withdrawal under Section 12A | Approval of Resolution Plan* | Commencement of Liquidation | | Jan- Mar, 2017 | 0 | 37 | 1 | 0 | 0 | 0 | 36 | | Apr-Jun, 2017 | 36 | 129 | 8 | 0 | 0 | 0 | 157 | | July-Sept, 2017 | 157 | 232 | 18 | 0 | 2 | 8 | 361 | | Oct-Dec, 2017 | 361 | 147 | 38 | 0 | 7 | 24 | 439 | | Jan-Mar, 2018 | 439 | 195 | 20 | 0 | 11 | 59 | 544 | | Apr-Jun, 2018 | 544 | 246 | 20 | 1 | 14 | 51 | 704 | | Jul-Sept, 2018 | 704 | 238 | 29 | 27 | 32 | 86 | 768 | | Oct-Dec, 2018 | 768 | 275 | 7 | 36 | 14 | 77 | 909 | | Jan-Mar, 2019 | 909 | 359 | 11 | 27 | 14 | 73 | 1143 | | Total | NA | 1858 | 152 | 91 | 94 | 378 | 1143 | *: These exclude 3 resolutions which have since led to liquidation.
Source: IBBI. |
| Table 3.4: Initiation of the corporate insolvency resolution process | | Quarter | No. of CIRPs initiated by | | Operational Creditor | Financial Creditor | Corporate Debtor | Total | | Jan-Mar, 2017 | 7 | 8 | 22 | 37 | | Apr-Jun, 2017 | 58 | 37 | 34 | 129 | | Jul-Sept, 2017 | 101 | 92 | 39 | 232 | | Oct-Dec, 2017 | 69 | 64 | 14 | 147 | | Jan-Mar, 2018 | 89 | 84 | 22 | 195 | | Apr-Jun, 2018 | 129 | 99 | 18 | 246 | | Jul-Sept, 2018 | 138 | 84 | 16 | 238 | | Oct-Dec, 2018 | 161 | 98 | 16 | 275 | | Jan-Mar, 2019 | 168 | 172 | 19 | 359 | | Total | 920 | 738 | 200 | 1858 | | Source: IBBI. | 3.22 The resolution plan with respect to six of the 12 large borrowers of SCBs that constituted the first batch of referrals to IBC for resolution have been approved. Other accounts are in different stages of the process. The outcome of the six large accounts that ended with resolution plans is given in Table 3.7. 3.23 Rising stress in balance sheets of companies and that of large banks and the recovery risks associated with credit portfolios has led to deliberations on an optimal institutional response to tackle the NPA overhang. The framework pertaining to resolution of NPAs has evolved from asset reconstruction companies (ARCs) to setting up of resolution mechanisms under IBC. While so far this chapter has dealt with recovery related performance under IBC, Box 3.2 gives insights into the performance of asset reconstruction companies (ARCs). | Table 3.5: No. of CIRPs ending with orders for liquidation | | State of Corporate Debtor at the Commencement of CIRP | No. of CIRPs initiated by | | Financial Creditor | Operational Creditor | Corporate Debtor | Total | | Either in BIFR or Non-functional or both | 99 | 117 | 67 | 283 | | Resolution Value < Liquidation Value | 113 | 134 | 67 | 314 | | Resolution Value > Liquidation Value | 30 | 15 | 19 | 64 | Note: 1. There were 33 CIRPs, where CDs were in BIFR or non-functional but had resolution value higher than liquidation value.
2. Where liquidation value was not calculated, it has been taken as ‘0’.
Source: IBBI. |
| Table 3.6: Value of CIRPs ending with orders for resolution | | (amount in ₹ billion) | | | Total admitted claims of FCs | Liquidation value | Realisable by FCs | Realisable by FCs as a per cent of claims admitted | | Apr - Jun 2018 | 762.4 | 180.8 | 428.9 | 56.3 | | Jul - Sep 2018 | 404.1 | 92.5 | 106.17 | 26.3 | | Oct - Dec 2018 | 76.9 | 27.8 | 69.1 | 90 | | Jan - Mar 2019 | 380.5 | 57.8 | 91.1 | 24 | | Up to March 31 2019 | 1733.6 | 384.4 | 744.97 | 43 | | Source: IBBI Quarterly Newsletters for the period FY 2018-19. |
| Table 3.7: Status of 6 large accounts initiated by the Reserve Bank | | (amount in ₹ billion) | | Name of corporate debtor | Claims of financial creditors dealt under resolution | | | Amount admitted | Amount realised | Realisation as a per cent of claims | | Electrosteel Steels Ltd. | 131.8 | 53.2 | 40.38 | | Bhushan Steel Ltd. | 560.2 | 355.7 | 63.5 | | Monnet Ispat & Energy Ltd. | 110.2 | 28.9 | 26.26 | | Essar Steel India Ltd. | 494.7 | * | * | | Alok Industries Ltd. | 295.2 | 50.5 | 17.11 | | Jyoti Structures Limited | 73.7 | 36.8 | 50.02 | *: Apportionment between FCs and OCs is under consideration by NCLAT.
Source: IBBI Quarterly Newsletter (January - March 2019). |
Box 3.2: Asset reconstruction companies - A review This study is based on the recovery data of top six ARCs although during the initial years ARCIL was the only operating ARC. Table 1 lists the summary statistics of ARCs’ recovery performance. The generally higher median relative to average recovery implies that smaller portfolios have shown better recovery performance. The significant variability in recovery performance, given any year of origination, needs to be examined as it has implications for embedding a more realistic loss given default estimation in provisioning. Also, the general recovery of low double digits across years possibly points to the inadequacies of the resolution model based on collateral disposal. Notwithstanding a fairly poor recovery experience for banks as illustrated in Table 1, the recovery performance when measured with regard to the SRs issued (that is, after factoring in the discount to the total bank claims) is generally better. Table 2 documents the SR recovery distribution of the top six ARCs. As can be seen, while the performance of ARCs given the recovery rates is fairly impressive, the recovery performance in some recent years appears to be on a decline. The recovery rate specifically shows a precipitous decline for assets that originated after 2014. Moreover, the higher recoveries with regard to SRs as compared to bank claims across ARCs possibly reflects the pricing power of a few of them rather than their recovery prowess. | Table 1: Recovery16 distribution of assets based on security receipts’ origination dates (per cent) | | Date of Origination | Max | Min | Median | Average recovery | | 2004* | 12.0 | 12.0 | 12.0 | 12.0 | | 2005* | 13.1 | 13.1 | 13.1 | 13.1 | | 2006 | 34.6 | 13.3 | 23.9 | 13.8 | | 2007 | 33.1 | 15.8 | 24.4 | 17.0 | | 2008 | 28.2 | 15.2 | 21.7 | 15.7 | | 2009 | 57.4 | 16.5 | 28.1 | 18.3 | | 2010 | 46.0 | 4.5 | 20.1 | 21.5 | | 2011 | 47.8 | 9.2 | 15.8 | 15.6 | | 2012 | 71.9 | 3.1 | 30.1 | 13.7 | | 2013 | 28.7 | 7.0 | 15.9 | 12.3 | | 2014 | 11.0 | 1.8 | 8.4 | 3.5 | | 2015 | 19.1 | 2.0 | 7.7 | 4.6 | | 2016 | 9.0 | 1.4 | 5.9 | 3.9 | | 2017 | 18.7 | 1.2 | 1.6 | 2.4 | | 2018 | 9.5 | 0.3 | 0.9 | 2.3 | *: All the measures of central tendency for years 2004 and 2005 are the same since ARCIL was the only accredited ARC during this period.
Source: Respective ARCs. |
| Table 2: Recovery17 distribution of assets based on security receipts origination dates | | Date of Origination | Max | Min | Median | Average recovery | | 2004* | 50.9 | 50.9 | 50.9 | 50.9 | | 2005* | 59.6 | 59.6 | 59.6 | 59.6 | | 2006 | 143.9 | 52.3 | 98.1 | 54.3 | | 2007 | 134.3 | 39.8 | 87.0 | 44.3 | | 2008 | 132.5 | 67.2 | 99.9 | 69.5 | | 2009 | 146.7 | 87.2 | 96.4 | 91.9 | | 2010 | 118.4 | 41.6 | 96.9 | 96.9 | | 2011 | 170.3 | 39.7 | 91.7 | 76.9 | | 2012 | 98.9 | 56.5 | 79.0 | 74.6 | | 2013 | 225.8 | 28.5 | 48.4 | 48.8 | | 2014 | 29.0 | 2.8 | 16.5 | 8.1 | | 2015 | 53.8 | 4.8 | 13.2 | 10.6 | | 2016 | 21.7 | 2.9 | 12.6 | 8.8 | | 2017 | 34.5 | 3.4 | 6.4 | 5.8 | | 2018 | 24.6 | 0.8 | 3.0 | 5.7 | *: All the measures of central tendency for years 2004 and 2005 are the same since ARCIL was the only accredited ARC during this period.
Source: Respective ARCs. | The aging of recovery (discounted to the year of the origination of SRs) shows that recovery in the early stages dominated aggregate recovery (Chart 1). This is in line with international experience although the recovery rates in the Indian case are significantly lower. Given the aging profile of recovery given in Chart 1, there is possibly a case to look at the efficacy of collateralisation in the Indian context with regards to recovery. In this regard the prudential framework for resolution of stressed assets released on June 7, 2019 may have a salutary effect through its inbuilt incentivizing of early resolution. Such built in incentives through aggressive provisioning norm ensures that banks are incentivised to look for an early resolution of the impaired assets thereby improving recovery prospects. More importantly, in the Indian context such higher provisioning requirements ensure better accountability of PSB managements, as the timely provisioning gives a better assessment to the government as owner given the sovereign bank doom loop that was referred to in Chapter 1 of this report. |
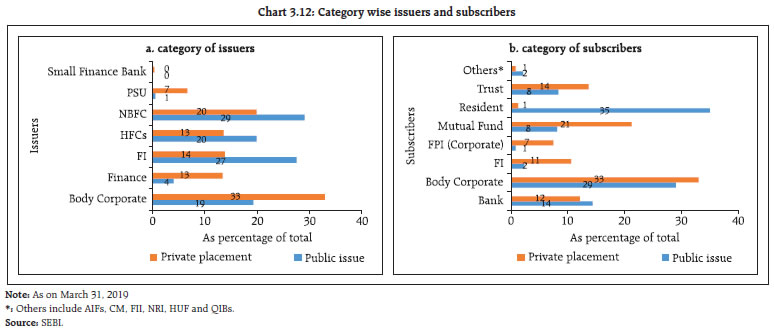
III. Securities and commodity derivatives markets (A) Regulatory developments 3.24 The broad guidelines to operationalise the interoperability framework between clearing corporations by June 01, 2019 have been laid down. Interoperability provides for linking of multiple clearing corporations and allows market participants to consolidate their clearing and settlement functions at a single clearing corporation, irrespective of the stock exchange on which the trade is executed. It is envisaged that interoperability will lead to efficient allocation of capital for market participants, thereby saving on costs and also providing better trade execution. 3.25 To bring the margin period of risk (MPOR) in greater conformity with the principles for financial market infrastructures (PFMI), and based on the recommendations of the SEBI’s Risk Management Review Committee (RMRC), it was decided that: a) Stock exchanges/clearing corporations estimate the appropriate MPOR, subject to a minimum of two days, for each equity derivative product based on liquidity therein and scale up the applicable margins accordingly. b) With a view to make the risk management framework more robust, the payment of mark-to-market (MTM) margin be mandatorily made by all the members before start of trading on the next day. c) To align the margin across index futures and index options contracts, the short option minimum charge (SOMC) for index option contracts was revised to 5 per cent from 3 per cent. (B) Market developments (i) Mutual funds 3.26 During October 2017 – March 2018 there was a net inflow of ₹697.9 billion, which declined by 9.2 per cent to ₹639.4 billion in October 2018 – March 2019. AUM increased by 11.4 per cent in March 2019 compared to March 2018 (Chart 3.8). SIP has been growing continuously, which is adding stability to the inflows. 3.27 Share of Individual holdings in total AUM, which comprises of the holdings of retail and HNIs, grew from 51.2 per cent in October 2017 to 56.4 per cent in October 2018 and it further increased to 58.1 per cent in March 2019. The individual category AUM had grown by 17.8 per cent by the end of March 2019 as compared to March 2018. 3.28 Share of Institutional holdings, which comprise of corporates and banks declined from 48.8 per cent in October 2017 to 43.6 per cent in October 2018 and it further declined to 41.9 per cent in March 2019. Sustained growth in individual holdings in mutual funds could provide more diversity in holding patterns and consequent stability to mutual funds from the point of redemption pressures (Chart 3.9). 3.29 Systematic investment plans (SIPs) grew constantly and remained a favoured choice for investors (Chart 3.10). Net folio increase during 2018-19 over 2017-18 was 9.3 million, which is a 42.4 per cent increase during the year. There was enormous growth of 421.6 per cent in the number of SIPs from 2013-14 to 2018-19 with the numbers increasing from 6 million to 31.3 million. Investments through SIPs in mutual funds are relatively more stable from the point of view of sustainability of fund inflows. (ii) Trends in capital mobilisation (a) Corporate bonds 3.30 During 2018-19, ₹366.8 billion was raised through 25 public issues in the bond market, which is highest in the last five years. Additionally, corporate bonds worth more than ₹6 trillion issued through private placement were listed on stock exchanges during the same period (Chart 3.11). The major issuers of corporate bonds were body corporates and NBFCs accounting for more than 50 per cent of outstanding corporate bonds as on March 31, 2019 (Chart 3.11 a) whereas body corporates and mutual funds were their major subscribers (Chart 3.11b). Chart 3.12 details the disaggregated issuer / investor profiles of public and private issuances. 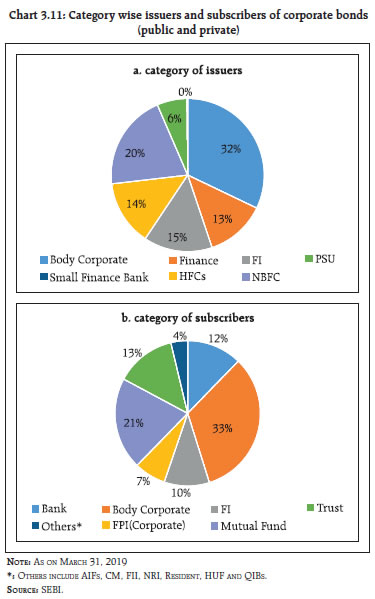
 3.31 An analysis of the credit rating of debt issues of listed companies by major credit rating agencies (CRAs) in India for the last four quarters shows that on an aggregate basis there was an increase in the share of downgraded/ suspended companies during the September - December 2018 and January - March 2019 quarters. The agency wise rating movements confirm the trend with the exception of CRISIL (Chart 3.13). (b) Initial public offerings (IPOs) 3.32 The incremental yearly growth in Capital raised through primary markets flatlined (₹8.9 trillion) after an impressive growth of 10 per cent in 2017-18 (8.8 trillion) (Chart 3.14). 3.33 During 2018-19, the funds raised by public and rights issues in equities went down significantly by more than 80 per cent as compared to 2017-18. However, capital raised by public issues in the debt market witnessed a sharp increase during the same period. The funds raised by preferential allotments also went up 2.9 times during 2018-19 as compared to 2017-18. (iii) Commodity derivatives 3.34 During 2018-19, benchmark index TR-MCX iCOMDEX increased by 2.1 per cent and NCDEX NKrishi increased by 12.4 per cent. During the same period, the S&P World Commodity Index decreased by 3.1 per cent and the Thomson Reuters CRB Index decreased by 5.9 per cent. During October 2018 – March 2019, TR-MCX iCOMDEX declined by 6.8 percent while the NCDEX NKrishi Index increased by 7.8 per cent. Both the S&P World Commodity Index and the Thomson Reuters CRB Index declined during the same period by 13.7 percent and 5.8 percent respectively (Chart 3.15) 3.35 The total turnover at all the commodity derivative exchanges (futures and options combined) saw a growth of 22.6 per cent during April 2018-March 2019 as compared to April 2017-March 2018. During 2018-19, the volume of commodity futures registered a growth of 19.8 per cent while the options volume jumped over 16 times19 in comparison to last year. 3.36 The commodity derivatives markets witnessed mixed trends during October 2018–March 2019. Concerns of US-China trade tensions, slower economic growth in China, and other commodity specific fundamentals reverberated with decline of metal segment. In the energy segment, array of geopolitical and macroeconomic factors impacted the crude oil prices. The total share of non-agri derivatives in the turnover was observed to be 91.1 per cent during October 2018 – March 2019 (Table 3.8). | Table 3.8: Segment wise turnover in commodity derivatives | | Period/Turnover (₹billion) | Agri | Metals | Bullion | Energy | Total | | Apr 2018-Sep 2018 | 3,450.4 | 13,774.6 | 8,070.8 | 10,426.4 | 35,722.2 | | Oct 2018-Mar 2019 | 3,072.7 | 11,587.0 | 8,927.9 | 14,469.7 | 38,057.2 | | Change (%) | -10.9 | -15.9 | 10.6 | 38.8 | 6.5 | | Share (%) | 8.8 | 34.4 | 23.0 | 33.7 | 100 | | Source: SEBI. | 3.37 Trading in commodity derivatives commenced at BSE and NSE from October 2018. Commodities currently trading on BSE include gold, silver, crude oil, copper, guar gum, guar seed and cotton. The commodities trading at NSE include gold, silver and crude oil. IV. The insurance market 3.38 Exponential growth in insurance was observed post opening up of the sector in 2000-01. Sizeable market share coupled with higher interconnectivity of some insurers engendered a need to identify systemically important insurers as also to have adequate regulatory framework for them. 3.39 The risk-based capital (RBC) approach links the level of required capital with the risks inherent in the underlying business. It represents an amount of capital that a company should hold based on an assessment of risks to protect stakeholders against adverse developments. In September 2017, IRDAI formed a ten-member steering committee for planning and implementation of Risk-based solvency regime. 3.40 IRDAI constituted a ‘Project Committee’ to study and develop an appropriate framework for Risk-based Supervisory Framework in Insurance industry. The Project Committee submitted their report in November 2017. Subsequently, in January 2018, an Implementation Committee was formed which has submitted its interim report in June 2018. A note to the industry regarding Authority’s intention of moving towards Risk Based Supervisory Framework (RBSF) was circulated to all the insurance companies in October 2018. V. Pension funds 3.41 The National Pension System (NPS) and Atal Pension Yojana (APY) both continued to progress towards healthy numbers in terms of the total number of subscribers as well as assets under management (AUM). The number of subscribers in NPS and APY reached 12.4 million and 14.9 million respectively (Table 3.9). AUM under NPS and APY touched ₹3.11 trillion and ₹68.60 billion respectively (Table 3.10). | Table 3.9: Subscriber growth in pension funds | | Sector | March 2018 (million) | March 2019 (million) | | Central Government | 1.92 | 1.99 | | State Governments | 3.87 | 4.32 | | Corporate | 0.70 | 0.80 | | All Citizen Model | 0.69 | 0.93 | | NPS Lite | 4.40 | 4.36 | | APY | 9.61 | 14.95 | | Total | 21.18 | 27.36 | | Source: PFRDA. |
| Table 3.10: Assets under management | | Sector | March 2018 (₹ billion) | March 2019 (₹ billion) | | Central Government | 849.54 | 1,090.10 | | State Government | 1,156.79 | 1,584.92 | | Corporate | 213.78 | 308.75 | | All Citizen Model | 57.43 | 95.69 | | NPS Lite | 30.05 | 34.09 | | APY | 38.17 | 68.60 | | Total | 2,345.76 | 3,182.14 | | Source: PFRDA. | 3.42 The Pension Funds Regulatory and Development Authority (PFRDA) continued its work for financial inclusion of the unorganised sector and low-income groups by expanding the coverage under APY. As on 31st March 2019, 406 banks were registered under APY with the aim of bringing more citizens under the pension net. 3.43 As on March 31, 2019 pension funds under NPS had an aggregate debt exposure (investments in debentures issued by IL&FS) of around ₹12.8 billion to the distressed IL&FS Group. The total NPAs in this exposure were around ₹3.6 billion as on March 31, 2019. Out of this exposure, ₹2.3 billion is in the form of unsecured debt. As per the recent National Company Law Appellate Tribunal (NCLAT) order dated February 13, 2019, all investments made in IL&FS by PFs are now classified as ‘Red’ category under IBC, meaning that these companies are not even able to make payments to senior secured financial creditors. 3.44 Given the sudden and sharp downgrade of some corporate debt by credit rating agencies (CRAs), PFRDA advised the pension funds not to depend only on the ratings given by the rating agencies but also undertake detailed research and analysis of the issuer/entity in which they propose to make investments. VI. Recent regulatory initiatives and their rationale 3.45 Some of the recent regulatory initiatives, along with the rationale thereof, are given in Table 3.11. | Table 3.11: Important regulatory initiatives (November 2018 - June 2019) | | 1. The Reserve Bank of India | | Date | Measure | Rationale/ Purpose | | January 01, 2019 | Micro, Small and Medium Enterprises (MSME) Sector - Restructuring of Advances: RBI declared special forbearance for MSMEs under which one-time restructuring of MSME debt is permitted with a maximum exposure of ₹250 million subject to the condition that existing loans to MSMEs should be classified as ‘standard’ and without any downgrade in the asset classification. Banks will incur an additional provision of 5% for the restructured accounts. Banks and NBFCs are required to make appropriate disclosures related to such restructured MSME accounts. | To facilitate meaningful restructuring of MSME accounts that have become stressed. | | January 16, 2019 | External Commercial Borrowings (ECB) Policy - New ECB Framework: RBI notified the new ECB framework under which eligible borrowers can now raise ECBs up to USD 750 million or equivalent per financial year under the automatic route. The existing Track I (medium-term foreign currency denominated ECB) and Track II (long-term foreign currency denominated ECB) have been merged into one track as ‘Foreign Currency Denominated ECB’. Existing Track III (Indian rupee denominated ECB) and the Indian rupee denominated bonds (masala bonds) route has been merged as ‘Rupee Denominated ECB’. The list of eligible borrowers and recognised lenders has been expanded. | To simplify the ECB policy by removing the scope of inter-track arbitrage, create a level playing field for all eligible borrowers, and widen the base of borrowers and lenders. | | February 07, 2019 | ECB Facility for Resolution of Applicants under the Corporate Insolvency Resolution Process: RBI amended guidelines to relax the end-use restrictions for resolution applicants under the Corporate Insolvency Resolution Process (CIRP) and allow them to raise ECBs from recognised lenders, except the branches / overseas subsidiaries of Indian banks, for repayment of rupee term loans of the target company under the approval route. | To facilitate better value recoveries (lower haircuts) for the Indian banks | | February 22, 2019 | Harmonisation of different categories of NBFCs: The RBI decided to harmonise three different categories of NBFCs into one, based on the principle of regulation by activity rather than regulation by entity. Accordingly, three categories of NBFCs, that is, asset finance companies (AFCs), loan companies (LCs) and investment companies (ICs) are to be combined into a single category NBFC Investment and Credit Company (NBFC-ICC). | To allow greater operational flexibility to NBFCs. | | March 01, 2019 & May 24, 2019 | VRR for Foreign Portfolio Investors (FPIs) Investment in Debt: The Reserve Bank launched the Voluntary Retention Route (VRR) in debt on March 1, 2019 under which, FPIs can voluntarily commit to remain invested in a Committed Portfolio Size (CPS) for a committed retention period (minimum period of three years or as decided by the Reserve Bank). Investments through this Route will be free of certain regulatory norms applicable to FPI investments under General Investment Limit. Participating FPIs are provided special facilities such as permission to carry out repo/reverse repo transactions for cash management and the use of currency/ interest rate derivatives to hedge currency/ interest rate risks. The first tranche of investment limits (₹400 billion for investment in Government Securities (VRR-Govt.) and ₹350 billion for investments in Corporate debt instruments (VRR-Corp)) were made available for allotment ‘on tap’. Subsequently, additional operational flexibilities viz., VRR-Combined (for investment in both G-Sec and corporate debt instruments) and option to hold investments till their maturity/sale at the end of retention period were introduced vide the revised scheme notified on May 24, 2019. | To encourage FPIs willing to undertake long-term investments to invest in Indian debt markets. | | June 03, 2019 | Large exposures framework (LEF): The large exposures framework (LEF) became effective from April 01, 2019.Banks must apply LEF norms at two levels viz consolidated (group) level and Solo level. An exposure to counter-party will constitute both on and off-balance sheet exposures. The limit for a single counterparty is 20% which can be increased to 25% under exceptional circumstances with approval of the Boards of the banks. Also, banks’ exposures to a single NBFC will be restricted to 15 percent of their eligible capital base whereas for group level it will be restricted to 25 percent of their Tier I Capital.Banks shall lay down a board approved policy for determining connectedness among the counterparties. Any breach of the above LE limits shall be reported to RBI immediately and rapidly rectified. | To address concentration risk | | 2. The Securities and Exchange Board of India | | Date | Measure | Rationale/ Purpose | | November 13, 2018 | Guidelines for Enhanced Disclosures by Credit Rating Agencies (CRAs): The circular inter-alia covers the disclosures pertaining to support from parent/group/government, including a section on liquidity, inter-linkages of subsidiaries, material event specifications and average one-year rating transition rates for long-term instruments. | To further enhance the quality of disclosures made by CRAs and strengthen the rating framework. | | December 17, 2018 | Review of the risk management framework for the equity derivatives segment: The review discusses the mandatory payment of mark-to-market (MTM) margin by members, before start of trading on the next day, aligning the margins across index futures and index options contracts, estimation of the appropriate margin period of risk (MPOR) by stock exchanges/clearing corporations based on the liquidity of the equity derivative product. | To bring MPOR in greater conformity with the Principles for Financial Market Infrastructures (PFMI). | | February 21, 2019 | To give effect to the recommendation of SEBI’s Risk Management Review Committee: SEBI has revised minimum haircut applicable to G-sec based on the type and tenor of the securities, as under: • Treasury bills and liquid G-sec having residual maturity of less than 3 years - 2%. • Liquid G-sec having residual maturity of more than 3 years - 5%. • All other semi-liquid and illiquid G-sec - 10%. | To give effect to the recommendations of SEBI’s Risk Management Review Committee. | | April 10, 2019 | Risk-based capital and net worth requirements for clearing corporations. | To ensure that the net worth of a clearing corporation adequately captures the risks faced by it. | | 3. The Pension Fund Regulatory and Development Authority (PFRDA) | | Date | Measure | Rationale/ Purpose | | January 07, 2019 | Cyber Security Policy for Intermediaries. | To enhance the cyber security framework for intermediaries. | | January 31, 2019 | Implementation of the recommendations of the Committee for Streamlining National Pension System (NPS) pertaining to monthly contributions, choice of pension fund for central government subscribers including default option and choice of investment patterns. | To rationalise NPS. | | March 11, 2019 | Display of information by points of presence (PoPs) while processing the National Pension System’s (NPS) contributions in the online mode. | With a view to ensuring greater transparency and fairness in the interest of NPS subscribers. | | March 25, 2019 | Amendment to Investment Guidelines (Applicable to Scheme CG, Scheme SG, Corporate CG and NPS Lite and Atal Pension Yojana): It was decided to increase the cap on government securities and related investments and short-term debt instruments and related investments by 5% each. | To provide flexibility to pension funds to improve the scheme’s performance depending on market conditions. | | 4. The Insolvency and Bankruptcy Board of India (IBBI) | | Date | Measure | Rationale/ Purpose | | October 16, 2018 | The Insolvency Law Committee submitted its 2nd report recommending adoption of the UNCITRAL Model Law of Cross Border Insolvency, 1997, which provides for a comprehensive framework to deal with cross-border insolvency issues. | For consistency between the domestic insolvency framework and the proposed cross-border insolvency framework. | | November 13, 2018 | The central government amended the Companies (Registered Valuers and Valuation) Rules, 2017 making them applicable for valuation with respect to any property, stocks, shares, debentures, securities or goodwill or any other assets or net worth of a company or its liabilities under the provisions of the Companies Act, 2013. | It streamlines the requirements of qualification and experience for registration as valuers. | | January 24, 2019 | IBBI (Insolvency Resolution Process for Corporate Persons) Regulations, 2016 amended to clarify procedural issues pertaining to resolution plans and actions to be taken by RP. | To bring more clarity to procedural issues and streamlining the resolution process. |
|