The momentum of global growth has slowed in 2018 and diverged across jurisdictions. Regulatory reforms have strengthened bank balance sheets but idiosyncratic factors are affecting profitability and asset quality of banks in certain economies. Capital positions remain comfortable and above the regulatory minimum. The recent tightening of financial conditions in emerging market economies, geopolitical risks and ongoing trade tensions could pose risks to the outlook. 1. Introduction II.1 The global recovery, which began in mid-2016 and gained traction in 2017 has lost some momentum in 2018 so far and financial conditions have tightened especially in emerging market economies (EMEs). For the greater part of the year these economies experienced capital outflows and currency depreciations on the back of a strong US dollar, intensified trade tensions, country-specific factors—especially in Argentina and Turkey—and signs of a slowdown in China. On the other hand, market volatility subsided in the advanced economies (AEs) and risk appetite remained relatively strong. II.2 Against these macroeconomic conditions, some signs of moderation in international banking are becoming visible in 2018 after it picked up steam over most of 2017. Bank lending growth turned uneven with a noticeable slowdown in EMEs and overall cross-border bank credit contracted by $130 billion between Q1:2018 and Q2:2018. II.3 In the rest of the chapter, section 2 sets out the macro-financial environment against which section 3 analyses the performance of the global banking system through the lens of a few key indicators. Section 4 highlights developments in the banking systems of major AEs and EMEs. The performance of the 100 largest global banks is analysed in section 5. The policy initiatives across jurisdictions in the banking arena are guided by the reform agenda initiated after the global financial crisis under the aegis of Financial Stability Board (FSB). The progress in this respect continued in 2017 and 2018 as well, which has been covered in detail in section 6. Section 7 concludes with some perspectives on the outlook. 2. The Macro-Financial Environment II.4 After reaching a six-year high in 2017 and getting broad-based across AEs and EMEs alike, global growth appears to be shedding its momentum in 2018 so far, while becoming asynchronous and differentiated across geographies. Barring the US, growth moderated in several large AEs such as the UK and Euro area, while in EMEs, it remained almost unchanged at 2017 levels, except for some country-specific idiosyncratic developments such as in Argentina and Turkey which spread risk aversion across EMEs as an asset class. Inflation in AEs, although still benign, inched up towards targets in response to higher oil prices, while in EMEs it was somewhat higher and differentiated. The surge in trade and investment in 2017 lost speed in the first half of 2018 due to weaker capital spending in the midst of heightened uncertainties, the large overhang of debt looming over both public and private sector balance sheets and bouts of turbulence that have stirred up risk-on-risk-off swings in investor sentiment and capital flows (Chart II.I). Spillovers from trade tensions, rising US interest rates and balance sheet normalisation, and geopolitical configurations accentuate the downside tilt to the balance of risks. 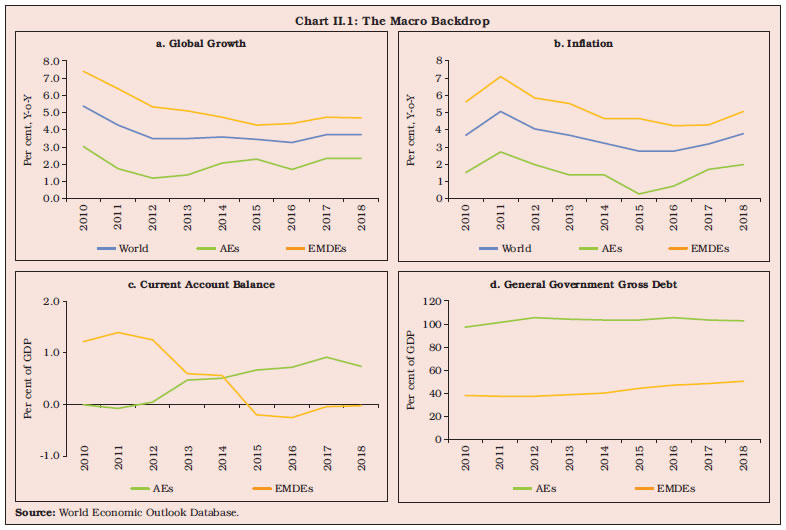 II.5 Mirroring the global and country-specific macroeconomic and financial conditions, credit growth picked up in 2017 and 2018 so far across AEs and EMEs albeit disparately. Fluctuations in credit growth contain information not only about the state of the financial cycle but also about risks to real economic activity. Credit growth within the Euro area, which moved synchronously since 2009 among constituent economies, reflecting the common shock of the sovereign debt crisis as also shared policies in response to the shock, maintained co-movement (Chart II.2). Among other AEs, divergences in credit growth reflected differing positions in the financial cycle. In the US, there was a slowdown in credit growth in 2017 reflective of modest economic expansion in that year but in the first half of 2018, an upturn has taken hold on the shoulders of robust economic activity. Credit growth in Japan slipped into negative territory in 2017 as the high demand for funds related to merger and acquisition deals that supported significant growth in 2016 started to wane. On the other hand, credit growth in the EMEs increased in 2017 relative to 2016 exceptions being Brazil, Indonesia and Turkey. Rapid credit growth accompanied by sharp increase in household debt raised overheating concerns in China in 2017. 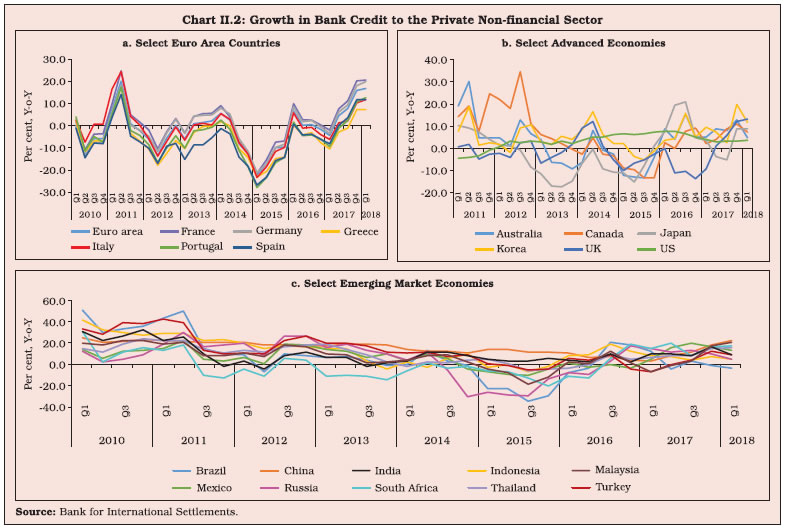 II.6 The Euro area bank lending survey points to credit standards easing in 2018 and supporting loan growth. Credit growth revived in the US and Japan in 2018, driven by commercial and industrial loans in the US and small firms in Japan. Banks in China, however, appear to have turned averse to lending in 2018 amidst slowing economic activity, rising credit risks, and threats of trade war. 3. Performance of the Global Banking Sector II.7 Banking systems in various parts of the world are converging to the Basel III standards albeit at varying speeds and from heterogeneous initial conditions. Key performance indicators of the banking sector include profitability, asset quality and capital adequacy, which taken together, help in assessing its health and resilience. Banks have strengthened their balance sheets across jurisdictions with higher levels of capital and liquidity. In this regard, a divergence was discernible between banks in AEs and in EMEs—a gradual improvement in the former, but signs of weakness in the latter due to build-up of stressed assets. 3.1 Return on Assets II.8 Improving macroeconomic conditions in the Euro area and the fading of debilitating crisis legacies translated into higher profitability1 of banks, abstracting from country-specific differences (Chart II.3). Amongst the Euro area banks, losses incurred by banks in Italy and Portugal reversed in 2017, reflecting a drop in loan loss provisions along with improvement in operational efficiency and a significant reduction in impairments. Banks in Greece, which turned modestly profitable in 2016, sank back into losses in 2017, largely due to an increase in loan-loss provisions. Available information in 2018 so far suggests continuing improvement in bank profitability, especially in Portugal and Spain. Prolonged periods of low interest rates in the Euro area eased funding conditions, but squeezed net interest margins for banks and weighed on their profitability. Banks in other AEs such as those in Canada and Australia continued to increase profitability. RoAs of banks in the US, which had declined marginally in 2017 on account of a one-time tax increase and higher non-interest expenses, revived in 2018 owing to higher net operating revenue. 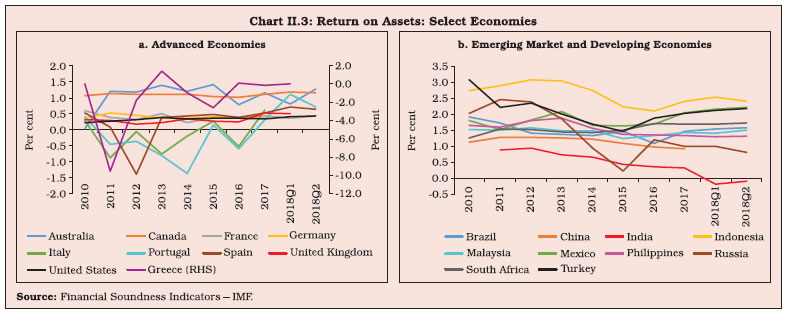 II.9 RoAs of banks in EMEs reflected mixed movements through 2017 and 2018 so far, tracking outcomes on non-performing loans. While banks in Russia, India and China suffered declines, those in Brazil, Mexico and Indonesia posted robust RoAs in 2017 as well as in 2018 (Table II.1). Notably, profitability of banks in Russia was adversely affected by additional loss provisions required by a number of large banks undergoing financial resolution. Banks in India, on the other hand, suffered from weak asset quality and recorded their lowest RoAs since 2008, in 2017 and 2018 so far. Banks in Indonesia remained the most profitable among peer Asian EMEs in 2017 and during 2018 so far as operating expenses fell, resulting in efficiency gains. 3.2 Capital Adequacy II.10 Capital positions remained comfortable for both EMEs and AEs in 2017 and in 2018 so far, above the prescribed levels. Banks in AEs built up capital buffers in 2017 above levels achieved in 2016 (Chart II.4). Banks in the UK maintained the highest capital to risk-weighted assets ratios (CRARs), notwithstanding a marginal decline from a year ago. The high ratios for banks in the UK reflect both higher capital as well as reduction in riskiness of their balance sheets. Stress tests carried out by the Bank of England in 2017 showed that no bank is required to strengthen its capital position further, thus validating the building strength of the UK banking system. 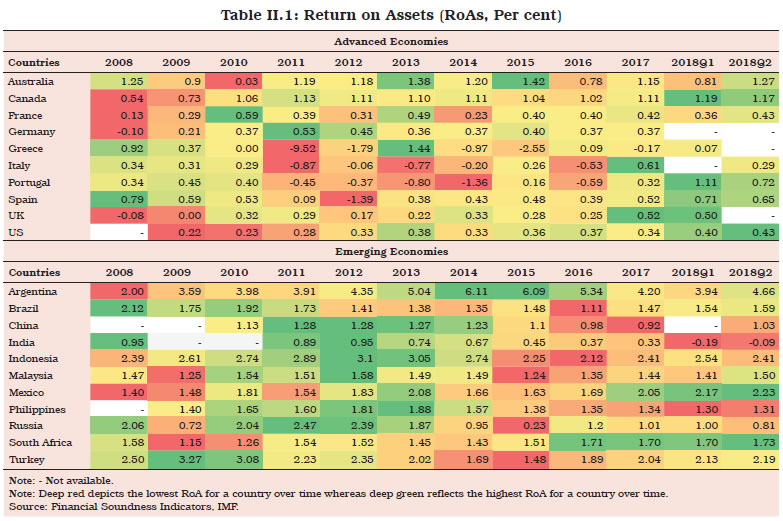
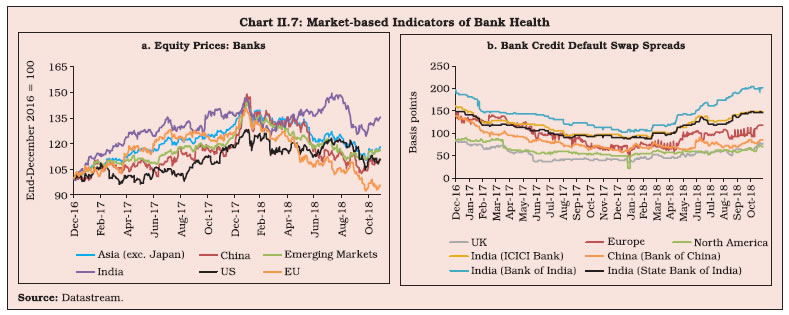
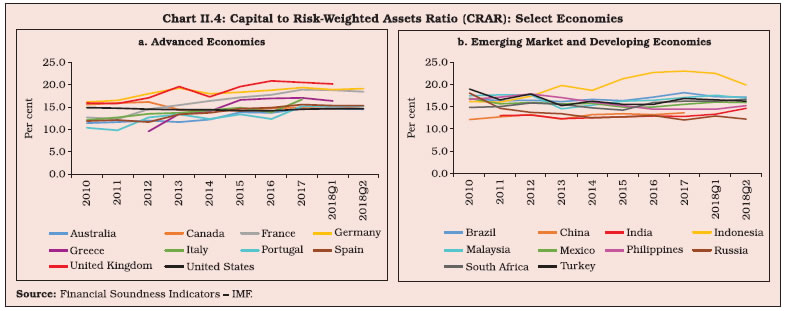 II.11 CRAR positions also improved across EMEs banks in 2017, well above the regulatory minimum (Table II.2), although banks in India and Russia suffered a moderation in their CRARs on account of rising non-performing loans (NPL) ratios and declines in RoAs. Reforms undertaken in Indonesia after the East Asian crisis of 1997-98 have yielded benefits in recent years as they emerged as the most capitalized among peers. 3.3 Asset Quality II.12 Asset quality measured by the non-performing loans (NPL)2 ratio improved across banks in AEs, except for those in Greece which are reeling under the persisting visceral effects of the sovereign debt crisis (Chart II.5). Considerable improvement was evident in other countries such as Portugal, Italy and Spain, mainly on the back of robust economic recovery. II.13 For banks in major EMEs, NPL ratios remained low, reflecting improving macroeconomic performances which helped reduce asset quality stress. India and Russia were notable exceptions, with double digit NPL ratios in 2017 deteriorating further in 2018. 3.4 Leverage Ratio II.14 The leverage ratio3 has drawn interest in the post-global financial crisis period as risk weights alone were found to inadequately reflect the incipient build-up of stress in banks’ balance sheets. Accordingly, specific prescriptions on the leverage ratio have become a defining feature of the Basel III framework. Bank in AEs maintained leverage ratios well above the regulatory prescription of a minimum of 3 per cent in 2017 as well as in 2018. All of them, except for banks in Spain and the UK, reported an improvement in their leverage ratios in 2017 (Chart II.6). Among EMEs, banks maintained leverage ratios of more than thrice the prescribed levels, except for those in China, India and South Africa. 3.5 Financial Market Indicators II.15 Attesting to the improvement in the overall health of banks, market-based indicators showed sustained improvement in 2017 (Chart II.7). At the onset of 2018, however, as overall business uncertainties emanating from trade wars, slowdown in the Chinese economy and European Union (EU) banking problems increased, bank equity prices nosedived. In Q2:2018, while the equity prices of banks in other jurisdictions continued to reel under pressure, Indian banks bucked the trend, surging ahead of their peers on measures such as recapitalization of banks. In Q3:2018, however, a price correction in Indian banks’ scrips was evident as issues of frauds and corporate governance emerged along with continuing asset quality problems. Credit default swap (CDS) spreads narrowed in 2017 as investor optimism cautiously returned to bank stocks. The lowest CDS spreads were reported for banks in the UK and North America. On the other hand, a general repricing of risk across other AEs and EMEs led to a widening of bank CDS spreads in 2018 relative to 2017. 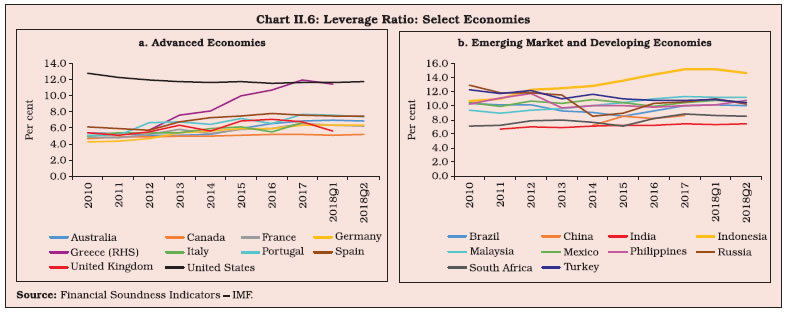
 4. Overall Banking Developments in Select Economies II.16 Banks in AEs generally improved their performance in 2017 through 2018 as reflected in better asset quality, improved CRARs and stronger and leaner structures. In contrast, banks in EMEs remained weighed down by country-specific and idiosyncratic factors. 4.1 The US II.17 In the US banking system, credit growth moderated in 2017 across all segments of bank loans (Chart II.8). This is attributable to a number of factors, including but not limited to, lack of demand for business loans, reduction in customers’ need to finance inventories and tightened standards for subprime credit card and auto lending. In 2018, however, there was a reversal as credit grew at robust rates, supported by a revival in commercial and industrial loans. 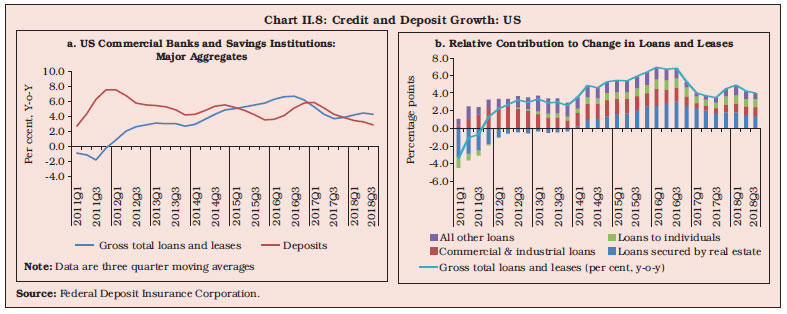 II.18 Asset quality in US banks was boosted by lower delinquency rates4 in 2017, especially in respect of real estate loans since Q3:2017. In addition, the net charge-offs5 reached a decadal low in 2017, despite an increase in outstanding real estate loans over the last four years (Chart II.9). Notably, the rise in household credit risk was not located in the mortgage segment of the market. Subprime credit card and auto loans saw major incidence of delinquency in 2017 while agriculture since early 2016 and consumer loans in the current year (up to Q3:2018) had higher delinquency rates. 4.2 The UK II.19 Banks in the UK have become resilient over the last decade, with a steady improvement in capital ratios as well as in liquidity positions. Stronger balance sheets have enabled banks to re-engage in intermediating the credit needs of recovering economic activity, although consumer credit growth slowed since Q2:2017 and credit conditions tightened for smaller companies (Chart II.10). The cost of funding, though still low by historical standards, edged up during Q1:2018, partly reflecting an increase in swap rates. While loans to private non-financial corporations picked up in recent quarters, bank lending to other financial corporations has been on a decline. 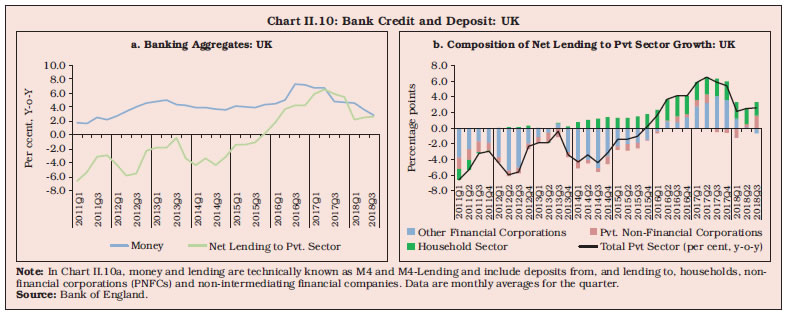 II.20 Loans to large businesses accounted for almost all of the increase in industrial credit during 2017 (Chart II.11a). Growth in the latter has, however, been decelerating in 2018. The Bank of England’s Credit Conditions Survey (BOE-CCS) suggests that loan availability to SMEs and medium sized enterprises is likely to be compressed (Chart II.11b and c). The default rate on secured loans to households was reported to have declined in 2017, while the loss given default (LGD) increased up to Q3:2017, followed by a decrease in Q4 and in first two quarters of 2018, before inching up again in Q3:2018 (Chart II.11d). 4.3 Euro Area II.21 Banks in the Euro area have become leaner and stronger, as evident in smaller balance sheets and improved capital positions. As part of the consolidation process, balance sheets of monetary financial institutions (MFIs) have shrunk with the sizeable decline in issuances of debt securities to fund asset growth (Chart II.12a). Policy-driven reduction in bank lending rates as also expansion in availability of loans brought about easier credit conditions in the Euro area as reflected in lending surveys (Chart II.12b and c). II.22 The asset quality of banks has improved across the Euro Area, except in Latvia and Estonia. Overall, NPL ratios have been trending down in recent years to reach 3.9 per cent in Q1:2018, but considerable heterogeneity exists across countries. For instance, banks in four countries viz., Greece, Cyprus, Portugal and Italy had NPL ratios of more than 10 per cent at end-2017 as lengthy and expensive judicial processes and lack of a market for NPLs hindered faster resolution (Table II.3). II.23 Accommodative monetary policy and large scale central bank asset purchases kept bank funding markets stable during 2017, with shifts away from wholesale funding towards more stable deposits of households and corporates, despite historically low deposit rates. These movements were reinforced in 2018 (Chart II.13). 4.4 China II.24 China is taking big strides in reorienting its growth strategy with deleveraging. As a result, credit growth slowed during 2017 but remained strong. Frequent reductions in reserve requirements for lenders during 2018 supported new loan growth. However, the ongoing trade war with the US and a crackdown by policymakers on shadow financing has tightened overall credit conditions in 2018 so far (Chart II.14a). New measures such as limits on reliance on wholesale funding, growth of wealth management products and better recognition of non-performing loans (NPLs) enhanced the resilience of the financial system and reduced inter-connectedness. These dynamics are also aiding the return to more normal levels of credit/ GDP ratios (Chart II.14b). While the asset quality of banks in China improved during 2017, their profitability continued to be pressurized by low net interest margins (Chart II.14c).
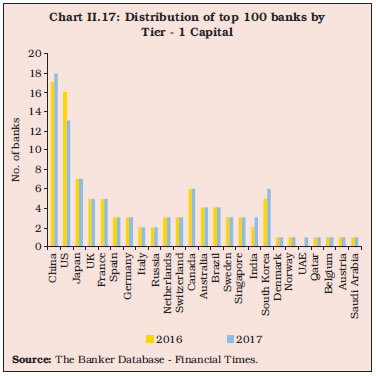
4.5 Brazil II.25 With economic recovery and strengthening of macroeconomic fundamentals, financial institutions in Brazil saw improved profitability and credit indicators as also an increase in risk appetite in 2017. Led by households, credit growth has started to improve and turned positive during recent quarters in 2018, although still anaemic relative to historical standards (Chart II.15a). Banks’ performance improved as mirrored in an increase in profitability and a reduction in the NPL ratio (Chart II.15b). As of Q3:2018, banks are well capitalized, liquid and profitable, despite incurring heavy losses during the recession. 4.6 Russia II.26 The Russian economy is emerging from a recession on the back of rising international crude oil prices, which regenerated demand for personal and corporate loans (Chart II.16). However, the failure of some banks in 2017 highlighted the importance of bank balance sheet clean-up and checks on related party lending in its early stage. “Zombie” banks have been liquidated or rehabilitated as part of concerted policy efforts to strengthen the banking system. 5. World’s Largest Banks6 II.27 In a sample of the world’s top 100 banks ranked by Tier 1 capital, EME banks increased their presence and held more assets in 2017 relative to their position in 2016. The US lost its share in top 100 banks to China, India, South Korea and the UAE (Chart II.17). II.28 Return on assets, measuring profitability of the 100 largest banks was higher in 2017 relative to the previous year. Specifically, the number of banks in the top 100 with positive RoAs increased in 2017 and only one bank recorded negative returns compared to five in 2016. However, the number of banks with RoAs of more than 1.0 per cent remained unchanged (Chart II.18a and b). Declining number of banks with high NPL ratios is leading to increased profitability—fewer banks had NPL ratios of more than 5 per cent in 2017 than in 2016. II.29 Improvement in asset quality was also accompanied by relatively stronger capital positions, leading to concomitant reduction in financial leverage when compared with the previous year. Sixty banks had leverage ratios of at least 6 per cent in 2017, up from 53 banks in 2016 (Chart II.19a). Furthermore, all banks in the top 100 maintained a leverage ratio of more than 3 per cent in 2016 and 2017 i.e. above the regulatory minimum prescribed under Basel III. 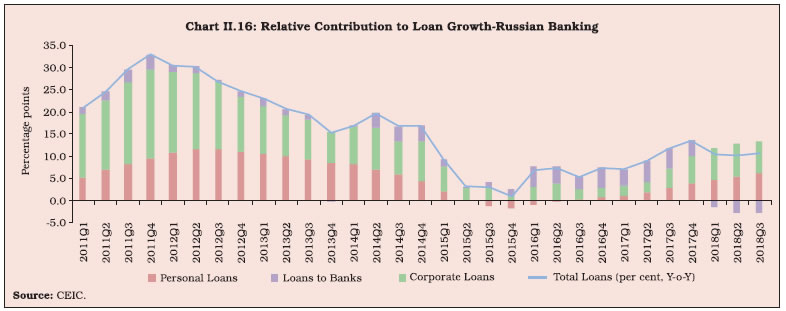
 II.30 In addition to improvements in leverage ratios, capital positions relative to risk-adjusted assets remained strong during 2017. For instance, banks with capital to risk weighted asset ratio (CRAR)7 of more than 12 per cent, i.e. one and a half times the level prescribed under Basel III, increased in 2017 (Chart II.19b). Nonetheless, higher capital for banks did not imply higher profitability as RoAs remained weak (Chart II.20 a). Moreover, for the only bank reporting negative RoA for the year, the NPL ratio was the highest, signifying the adverse impact of deterioration in asset quality on profitability (Chart II.20 b). 6. Global Banking Policy Developments II.31 In the year 2017 and 2018 so far, policy developments in the global banking arena are shaped by two distinct challenges: first, need to strengthen the banking sector by carrying on structural reforms and plugging vulnerabilities and second, conditioning the ongoing reforms on the evolving economic and political changes.
II.32 Towards fulfilment of the first goal, reforms are at various stages of implementation to build a safer and more resilient financial system a decade after the global financial crisis (Box II.1). In this context, the establishment of the Financial Stability Board (FSB) constitutes a key institutional reform invested as it is, with the mandate of identifying and assessing risks and vulnerabilities, designing remedial policies and promoting coordination among authorities responsible for financial stability. 6.1 Other Global Regulatory Reforms II.33 The Basel III processes and co-moving standard-setting initiatives have focused on four core areas: (i) making financial institutions more resilient; (ii) ending too-big-to-fail (TBTF); (iii) making derivatives markets safer; and (iv) transforming non-bank financial intermediation into resilient market-based financial intermediation. 6.2 Building Resilient Financial Institutions II.34 Basel III is the centrepiece of the international endeavour to build more resilient financial institutions. Globally, banks are building higher and better quality capital and liquidity buffers. In particular, significant progress has been made in the implementation of the leverage ratio and liquidity cushions. Revised standards on securitisation and market risk frameworks are evolving on agreed timelines. On the other hand, delays in implementation of some Basel III standards— capital requirements for equity investments in funds; standardised approach for counterparty credit-risk, capital requirements for exposures to central counterparties; margin requirements for non-centrally cleared derivatives; and the revised Pillar 3 framework—are impeding a full convergence to Basel III. 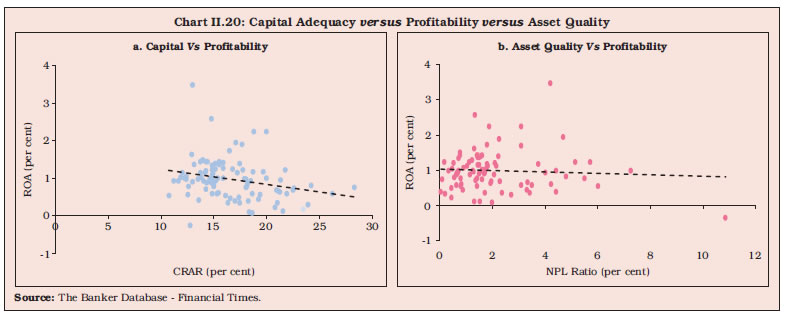
Box II.1: Ten Best Global Banking Practices Post-GFC financial sector reforms are set to reshape banking practices, leveraging on technology advances in financial services and spurred by competitive disintermediation by non-banks, capital markets, electronic trading platforms, and changing demographics and customer profiles. Against this backdrop, it is useful to track the key standard setting benchmarks that have evolved over this period and how they have influenced banking practices in jurisdictions for which authoritative information is available. 1. Capital Buffers Basel III standards (2009) prescribe minimum regulatory capital requirements, a capital conservation buffer, a countercyclical capital buffer and a leverage ratio (Table 1). There has been animated debate on the adverse impact of these capital requirements on bank lending versus the importance of these buffers in minimizing taxpayer funded bailouts. Meanwhile, banks are aligning their capital positions with these norms. In several jurisdictions, including India, national regulators have set CRAR at a level slightly higher than the Basel minimum (Table 2). | Table 1. Basel III Guidelines | | a. Capital Requirements | | Regulatory Capital | As per cent to risk-weighted assets | | I. Minimum Common Equity Tier 1 (CET1) Ratio | 4.5 | | II. Capital Conservation Buffer (CCB) | 2.5 | | III. Minimum Common Equity Tier 1 Ratio plus Capital Conservation Buffer (I + II) | 7.0 | | IV. Additional Tier 1 Capital | 1.5 | | V. Minimum Tier 1 Capital Ratio (I + IV) | 6.0 | | VI. Tier 2 Capital | 2.0 | | VII. Minimum Total Capital Ratio (MTC) (V+ VI) | 8.0 | | VIII. MTC plus CCB (II+VII) | 10.5 | | b. Liquidity Ratios | | Liquidity Coverage Ratio : Minimum 100 per cent by Jan 1, 2019 Net Stable Funding Ratio : At least 100 per cent on ongoing basis |
| Table 2: Jurisdictions with higher Capital Adequacy norms | | Jurisdiction | Minimum Common Equity Ratio | Minimum Tier 1 Capital Ratio | Minimum Total Capital Ratio | | Requirement under Basel III | 4.5 | 6.0 | 8.0 | | Brazil | | | 11.0, gradually aligning to Basel III by 2019 | | India | 5.5 | 7.0 | 9.0 | | China | 5.0 | 6.0 | 8.0 | | South Africa | 5.0 | 6.75 | 9.0 | | Mexico (includes CCB in minimum requirements) | 7.0 | 8.5 | 10.5 | | Switzerland | 4.5 to 10.0 | 6.0 to 13.0 | 8.0 to 19.0 | | Turkey | 4.5 | 6.0 | 12.0 | | Singapore | 6.5 | 8.0 | 10.0 | | Source: Regulatory Consistency Assessment Programme (RCAP) reports of the Bank for International Settlements (BIS). | In the US, Federal Deposit Insurance Corporation (FDIC) insured institutions maintained a (CET1) capital ratio of 13.1 per cent at end Q2:2018 while in the Euro area the ratio was over 14 per cent at end of Q2:2018. In comparison, banks in India have CET1 at 10.65 per cent as at the end of June, 2018. 2. Liquidity Buffers Towards the end of 2010, the Basel Committee on Banking Supervision (BCBS) recommended two liquidity standards—the liquidity coverage ratio (LCR)8 and the net stable funding ratio (NSFR)9 (Table 1). The objective of LCR is to reduce banks’ reliance on short-term, volatile funding sources that may be subject to rollover risks, while the aim of NSFR is to build liquidity resilience over the medium to long term. While the LCR in India is being phased in during 2015-19, the Reserve Bank has notified that the NSFR guidelines will come into effect from April 01, 2020. Indian banks maintained an LCR of 139 per cent as at end-June 2018. Banks in the Euro area as of Q2:2018, maintained an LCR of 141 per cent. 3. Asset Quality There is considerable heterogeneity in prudential frameworks governing NPA recognition, classification and measurement. Recent guidelines on prudential treatment of problem assets (PTA) (BCBS, 2017) complement the existing accounting and regulatory framework for asset categorisation. In the case of Ireland after the 2008 crisis, regulatory tightening became inevitable to arrest the rise in NPLs. In Romania a multi-faceted approach has been adopted: encouraging banks to dispose off non-collateralised and fully provisioned NPLs; recognizing the market value of collaterals; and conducting stricter on-site inspections. State empowered asset management companies (AMCs) to reduce NPLs have been adopted by many Asian countries such as Thailand, Korea and Japan. In the Indian context, the Reserve Bank has adopted a multi-pronged strategy of recognition, provisioning and resolution to address the NPA problem. The enactment of the Insolvency and Bankruptcy Code (IBC) has strengthened the NPA resolution process considerably. 4. Profitability Banks need to maintain profitability to reward equity holders as owners, while building adequate reserves against unforeseen contingencies. In the country experience, the general tendency has been to adopt a multi-dimensional approach to the analysis of profitability indicators such as NIM, RoA and RoE. For example, a high net interest margin (NIM)—a metric for gauging asset-liability management by banks may indicate that the bank is profitable. When seen in conjunction with a low loan-to-assets ratio, however, it can point to lazy banking or even a highly leveraged bank exposed to liquidity risk. For a discussion on profitability, please refer to section 3.1 of this chapter. 5. Risk Management Efficient risk capture is the first line of defense against build-up of vulnerabilities. To strengthen regulation, Basel III has revised standardised approaches for credit risk, market risk and operational risk under pillar 1, along with a redrawn boundary between the trading book and the banking book etc. Under pillar 2 of Basel III reforms, guidance for management of interest rate risk in the banking book has been published in 2016. BCBS jurisdictions are working to implement standards for interest rate risk in the banking book, which has a deadline of implementation in 2018. As of September 2018, countries such as Argentina, Japan and Indonesia have published the final rules. In the case of India, draft regulation has been published. The BCBS deadline for implementation of revised approaches to risks is set in 2022. 6. Harnessing FinTech Technology-enabled innovation in financial services, commonly known as FinTech, challenges the traditional brick-and-mortar banking model by lowered costs and vastly expanded financial reach. Mobile banking, P2P lending, aggregators and the like have changed the way financial services are being offered, but it is critical to be mindful of the embodied risks. In February 2018, the BIS issued sound practices for banks and bank supervisors in the context of FinTech. Jurisdictions in which FinTech has already made a significant difference to the financial landscape include the US, China, UK, Singapore, France and India. In India, more than half of the transactions of most big banks include some form of FinTech. The use of artificial intelligence (AI) and machine learning (ML) is still relatively low, but it could ignite the next wave of banking services reform. 7. Investing in Cybersecurity Recent cyberattacks across the globe highlight the severity of cyber risks. Studies have shown that cyber risk could have potential implications for financial stability. Guidance on cyber resilience for financial market infrastructure (Committee on Payments and Market Infrastructures, 2016), provides general directions to assess preparedness of cyber resilience capabilities. Regulators have recognised the importance of managing cyber risks among regulated entities and have rolled out approaches to enhance banks’ cybersecurity frameworks. Jurisdictions such as European Union have published guidelines for assessment of Information and Communication Technology (ICT) risk (2017) in addition to setting up a risk reporting framework. The UK has developed CBEST (2015), a supervisory toolkit for testing the cyber resilience of individual institutions. The US Federal Financial Institutions Examination Council (FFEIC) developed a cybersecurity assessment tool in 2015 to assess cybersecurity risks and preparedness of institutions. A cyber-incident reporting framework of ECB has been operational since 2017. In June 2016, the Reserve Bank also put in place a cybersecurity framework for banks. In terms of the framework, banks report unusual cyber-incidents within 2-6 hours and a Cyber Crisis Management Group has been set up to analyse the incident based on its criticality. 8. Financial Inclusion, Financial Literacy and Consumer Protection Banking practices with respect to financial inclusion have differed from country to country. Kenya benefited through mobile banking, bundling of services, and digital financial services. Brazil implemented a correspondent banking model to target the under-banked. India, Indonesia and Russia have introduced no-frills accounts for low-income customers. Microfinance intuitions have helped Bangladesh in financial inclusion. A correctly implemented financial inclusion strategy has been shown to improve bank stability (Ahamed and Mallick, 2017). Also, as a best practice, inclusion needs to be complemented by financial literacy and customer protection. India leads the BRICS in many important parameters. It has caught up with China, with 80 per cent of its adult population having access to bank accounts in 2017. The gender gap in access to banking has shrunk sharply over the last three years. Introduction of Prime Minister’s Jan Dhan Yojana (PMJDY) has been a game changer for financial inclusion (Please refer to section 11 of chapter IV for details). 9. Strengthening Corporate Governance Best practices aimed at strengthening the corporate governance have been mooted in various fora, including in multilateral agencies such as the BIS, the IMF, OECD and the World Bank as well as by national authorities. The core principle has been that the ultimate responsibility should rest with the board of banks which should be qualified, individually and collectively. The governance of the bank should be adequately transparent to its shareholders, depositors, other relevant stakeholders and market participants. There are significant differences in the legislative and regulatory frameworks across countries. The EU issued the CRD IV directive in 2013 requiring member states to ensure effective oversight by the management body, with due consideration given to knowledge, qualifications and skills. New Zealand also requires that a strict majority of the bank’s board must be non-executive, and at least half of the board must be independent. In India, the Reserve Bank has been developing and strengthening corporate governance practices in banks since early 2001, including ‘fit and proper’ criteria for directors of banks, processes for collecting information and exercise of due diligence, including scrutiny of declarations made by the bank directors. Banks also have independent committees like audit committees and risk committees. A Banks Board Bureau was set up by the government in 2016 with a view to improving the governance in PSBs. 10. Accounting Standards Worldwide, banks follow a globally accepted and consistent set of accounting principles under the International Financial Reporting Standards (IFRS). With effect from January 01, 2018, the implementation of IFRS9 has begun, with a forward-looking approach embodied in an expected loss model, replacing the IAS39 based on the incurred loss model. Among the G20 economies, 15 have adopted the use of IFRS standards for all or most companies, with notable exceptions being Japan, where IFRS standards are voluntary, the US where domestic securities issuers follow national standards, and China, India and Indonesia, which have adopted national standards modelled along the lines of IFRS. On a more global scale, 143 jurisdictions have begun using IFRS for or all or most of domestic publicly accountable entities (listed companies and financial institutions). From April 1, 2019 banks in India are expected to transition to Indian Accounting Standards (IND-AS), which are IFRS-converged. Nonbanking financial companies have already transitioned to the new accounting standard. Reference Ahamed, M. and S. Mallick (2017): ‘Is financial inclusion good for bank stability? International evidence’, Journal of Economic Behavior and Organization, ISSN 0167-2681. |
6.3 Too-Big-To-Fail II.35 Most FSB members have adopted frameworks for loss absorbency for systemically important banks. Total loss absorbency capacity (TLAC) issuance strategies are now in place for almost all global systemically important banks (G-SIBs) on course to meet the 2019 requirements. However, work remains on fully transposing TLAC into domestic regulations, including the BCBS’s standard on TLAC holdings and internal TLAC requirements for host authorities of material G-SIB subsidiaries. II.36 Supervisory colleges have been established for almost all G-SIBs. Resolution regimes with comprehensive powers broadly in line with the FSB’s Key Attributes of Effective Resolution Regimes for Financial Institutions have been implemented in most of the G-SIB home jurisdictions. However, the frameworks for bail-ins and early termination rights remain weak. Most G-SIBs have not fully implemented the BCBS principles on risk data aggregation and risk reporting, even as work is underway to address challenges relating to information sharing and coordinated risk assessments. 6.4 Making Derivatives Markets Safer II.37 The FSB’s agenda on over-the-counter (OTC) derivatives markets consists of standardisation, central clearing, exchange or electronic platform trading, margining and reporting of OTC derivatives transactions to trade repositories. II.38 Implementation of OTC derivatives reforms is underway, although with delays, in some jurisdictions only on account of the sheer scale and complexity of the reforms. The implementation is most advanced for trade reporting and capital requirements for non-centrally cleared derivatives. While the central clearing framework has been implemented by 75 per cent of the FSB members, the framework for margin requirements and platform trading framework is in place in about 50 per cent of the FSB membership. 6.5 Transforming Non-bank Financial Intermediation into Resilient Market-based Finance II.39 While a system-wide monitoring framework to assess risks and spillovers associated with the non-bank financial intermediation system has been developed by the FSB in collaboration with standard setting bodies, its implementation remains at a relatively early stage. II.40 A FSB peer review concluded that jurisdictions should establish a systematic process for assessing non-bank financial intermediation risks, and ensure that any non-bank financial entities or activities that could pose material financial stability risks are brought within the regulatory perimeter. The FSB conducts an annual system-wide monitoring exercise to track developments in the non-bank financial intermediation system in an activity-based “economic function” approach in which authorities narrow their focus to those parts of the non-bank financial sector where financial stability risks from non-bank financial intermediation are most likely to arise. 6.6 Misconduct Risks II.41 In recent years, the FSB has also been coordinating several initiatives—misconduct; correspondent banking and remittances; climate-related financial disclosure and Fin Tech—in order to secure financial stability on an enduring basis. The FSB is implementing an action plan to address misconduct risks through a range of preventative measures focusing on (i) improvements to financial institutions’ governance and compensation structures; (ii) upgrading global standards of conduct in the fixed income, commodities and currency markets; and (iii) reforms to major financial benchmark arrangements to reduce the risks of their manipulation. II.42 A stocktake on these efforts was published in May 2017 by the FSB, which set out areas for supervisors to mitigate misconduct risk. In May 2018, the FSB issued a consultative document on recommendations for consistent national reporting of data on the use of compensation tools. 6.7 Correspondent Banking and Remittances II.43 In November 2015, the FSB launched a four-point action plan to assess and address the decline in correspondent banking. In March 2016, the FSB established the Correspondent Banking Coordination Group (CBCG) to coordinate and maintain efforts towards the implementation of the action plan in four areas viz., (i) examining the dimensions and implications of the issue; (ii) clarifying regulatory expectations, including guidance by the Financial Action Task Force (FATF) and the Basel Committee on Banking Supervision (BCBS); (iii) domestic capacity-building in jurisdictions that are home to affected respondent banks; and (iv) strengthening tools for due diligence by correspondent banks. The FSB also publishes a Correspondent Banking Data Report which highlights the decline in the number of correspondent banking relationships (CBRs) especially for the US dollar and the Euro. The termination of CBRs is attributed inter alia to industry consolidation, lack of profitability, the overall risk appetite, and various causes related to anti-money laundering and countering the financing of terrorism (AML/ CFT) or sanctions regimes. 6.8 Climate-Related Financial Disclosures II.44 Access to better quality information on climate-related financial risks is essential to enable market participants to understand and manage them. The industry-led Task Force on Climate-related Financial Disclosures (TFCD) (Chairman: Michael Bloomberg) has made recommendations on climate-related financial disclosures that are applicable to organisations across sectors and jurisdictions. The recommendations are structured around four thematic areas: governance; strategy; risk management metrics; and targets. 6.9 Implications of financial technology innovations II.45 In view of the rapid proliferation of technology-enabled innovation in financial services or FinTech, the FSB has been analysing potential financial stability implications therefrom. In its report to the G20 in June 2017, the FSB highlighted 10 areas that merit authorities’ attention of which, three are seen as priorities for international collaboration: (i) managing operational risk from third-party service providers; (ii) mitigating cyber risks; and (iii) monitoring macro financial risks associated with FinTech activities. II.46 The FSB has undertaken a review of the financial stability risks posed by the rapid growth of crypto-assets. Its initial assessment is that crypto-assets do not pose risks to global financial stability currently. The market continues to evolve rapidly, however, and this initial assessment could change if crypto-assets were to become more widely used or interconnected with the core of the regulated financial system. 6.10 Jurisdiction specific banking policy developments II.47 In the US, the Dodd Frank Act was passed after the global financial crisis to contain excessive risk build-up and to strengthen regulatory rules. In May 2018, the Economic Growth, Regulatory Relief, and Consumer Protection Act was signed into law which modifies some provisions of the Dodd Frank Act, including, inter alia, the Volcker Rule (a ban on proprietary trading and certain relationships with investment funds), the qualified mortgage criteria under the Ability-to-Repay Rule, and enhanced regulation for large banks. The new law also provides smaller banks with an “off ramp” from Basel III capital requirements and makes other changes to the regulatory system. II.48 In the Euro Area, the European Central Bank (ECB) reviewed and streamlined its supervisory priorities. With the United Kingdom’s departure from the European Union scheduled for March 2019, banks’ preparedness for Brexit remains a high priority for ECB Banking Supervision. ECB Supervisors plan to closely monitor the implementation of banks’ Brexit plans to ensure that they comply with supervisory expectations. 7. Summing up II.49 Improvement in global growth and intensification of post-global crisis reforms has lent considerable support to banks and has made them resilient, as seen in improving capital and liquidity buffers, and declining NPL ratios. Credit growth is taking hold in many jurisdictions across the world. Technology-driven banking is the next frontier, presenting risks as also opportunities. Crypto-currencies need constant monitoring on overall financial stability considerations, given the rapid expansion in their usage. Going forward, the risks emanating from geo-political conditions in some countries as also the pace of normalisation by monetary authorities in AEs need to be monitored closely. Intensification of these risks entail reversal of capital flows from EMEs, financial market volatility and institutional fragility amplified by swings in global risk sentiment.
|