The consolidated balance sheet of NBFCs expanded in 2017-18 and in 2018-19 so far, buoyed by strong credit expansion. The profitability of NBFCs improved on the back of fund-based income, low NPA levels relative to banks and strong capital buffers. Recent concerns about asset-liability mismatches have been proactively addressed through liquidity provisions by the Reserve Bank. Disbursement by all AIFIs expanded during the year, with the largest expansion recorded by SIDBI through stepped-up refinancing for on-lending mainly to the MSME sector. 1. Introduction VI.1 Non-banking financial institutions (NBFIs) comprise a heterogeneous group of financial intermediaries. Those under the regulatory purview of the Reserve Bank consist of all-India financial institutions (AIFIs), non-banking financial companies (NBFCs)1 and primary dealers (PDs) (Chart VI.1). AIFIs are apex institutions established during the development planning era to provide long-term financing/refinancing to specific sectors such as (i) agriculture and rural development; (ii) trade; (iii) small industries; and (iv) housing. NBFCs are dominated by joint stock companies, catering to niche areas ranging from personal loans to infrastructure financing. PDs play an important role as market makers for government securities. The Reserve Bank regulated NBFI sector grew by 15.8 per cent in 2017-18; by the end of March 2018, it was 19.8 per cent of the scheduled commercial banks (SCBs) taken together in terms of balance sheet size. Within the NBFI sector, AIFIs constituted 23 per cent of total assets, while NBFCs represented 75 per cent and standalone PDs accounted for 2 per cent. 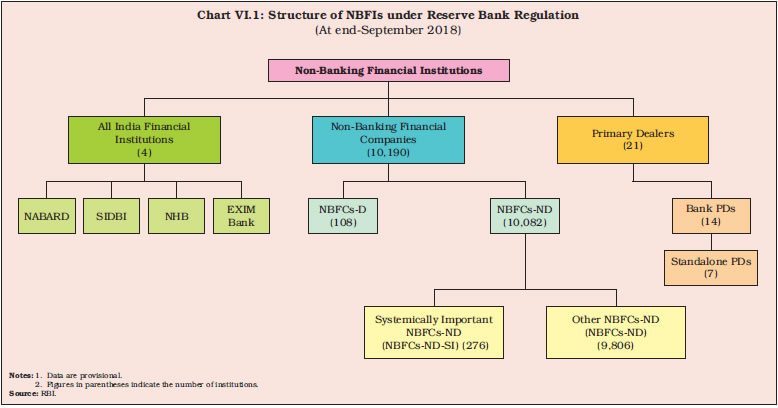 VI.2 Against this background, this chapter presents an analysis of the financial performance of NBFIs in 2017-18 and during April-September 2018. The rest of the chapter is organised into four sections. Section 2 provides an overview of the NBFC sector–non-deposit taking systemically important NBFCs (NBFCs-ND-SI) and deposit-taking NBFCs (NBFCs-D). The activities of housing finance companies (HFCs), which are under the regulatory purview of the National Housing Bank (NHB), are also covered in this section. Section 3 discusses the performance of AIFIs, followed by an evaluation of the role of primary dealers in Section 4. Section 5 concludes with an overall assessment and policy perspectives. 2. Non-Banking Financial Companies VI.3 NBFCs are classified on the basis of a) their liability structures; b) the type of activities they undertake; and c) their systemic importance. In the first category, NBFCs are further subdivided into NBFCs-D–which are authorised to accept and hold public deposits– and non-deposit taking NBFCs (NBFCs-ND)– which do not accept public deposits but raise debt from market and banks. Among NBFCs-ND, those with an asset size of ₹5 billion or more are classified as NBFCs-ND-SI. At the end of September 2018, there were 108 NBFCs-D and 276 NBFCs-ND-SI as compared with 168 and 230, respectively, at the end of March 2018. VI.4 Since 1997, the Reserve Bank has endeavoured to limit the operations and growth of NBFCs-D with the objective of securing depositors’ interest. This strategy was adopted in recognition of the fact that these deposits are not covered by the Deposit Insurance and Credit Guarantee Corporation (DICGC). NBFCs-D with investment grade rating are allowed to accept fixed deposits from the public for a tenure of 12 to 60 months only with interest rates capped at 12.5 per cent. VI.5 NBFCs can also be categorised on the basis of activities undertaken as they typically focus on niche segments and fulfil sector– specific requirements. Consequently, their varied business models require appropriate modulation of the regulatory regime. Till 2010, the NBFC sector was divided into five categories viz., asset finance companies; loan companies; residuary non-banking companies; investment companies and mortgage guarantee companies. Since then, however, newer types of activity have been added to the NBFC space. At the end of September 2018, there were 12 activity-based classifications of NBFCs (Table VI.1). VI.6 At the end of September 2018, the number of NBFCs registered with the Reserve Bank declined to 10,190 from 11,402 at the end of March 2018. NBFCs are required to have a minimum net owned fund (NOF) of ₹20 million. In a proactive measure to ensure strict compliance with the regulatory guidelines, the Reserve Bank cancelled the Certificates of Registration (CoR) of NBFCs not meeting this criterion. The number of cancellations of CoRs of NBFCs has exceeded new registrations in recent years2 (Chart VI.2). | Table VI.1: Classification of NBFCs by Activity | | Type of NBFC | Activity | | 1. Asset Finance Company (AFC) | Financing of physical assets including automobiles, tractors and generators. | | 2. Loan Company | Provision of loan finance. | | 3. Investment Company | Acquisition of securities for purpose of selling. | | 4. NBFC-Infrastructure Finance Company (NBFC-IFC) | Provision of infrastructure loans. | | 5. NBFC-Systemically Important Core Investment Company (CIC-ND-SI) | Makes investments and loans to group companies. | | 6. Infrastructure Debt Fund-NBFC (IDF-NBFC) | Facilitation of flow of long-term debt into infrastructure projects. | | 7. NBFC-Micro Finance Institution (NBFC-MFI) | Credit to economically dis-advantaged groups. | | 8. NBFC-Factor | Acquisition of receivables of an assignor or extending loans against the security interest of the receivables at a discount. | | 9. NBFC-Non-Operative Financial Holding Company (NOFHC) | Facilitation of promoters/ promoter groups in setting up new banks. | | 10. Mortgage Guarantee Company (MGC) | Undertaking of mortgage guarantee business. | | 11. NBFC-Account Aggregator (NBFC-AA) | Collecting and providing information about a customer’s financial assets in a consolidated, organised and retrievable manner to the customer or others as specified by the customer. | | 12. NBFC–Peer to Peer Lending Platform (NBFC-P2P) | Providing an online platform to bring lenders and borrowers together to help mobilise funds. | | Source: RBI. | 2.1 Ownership Pattern VI.7 NBFCs-ND-SI constitute 84.8 per cent of the total assets of the NBFC sector. Within the NBFCs-ND-SI sphere, government owned NBFCs hold more than a third assets, indicating their systemic importance (Table VI.2). During 2017-18, the regulatory requirements for government-owned NBFCs—both non-deposit taking and deposit taking—were aligned with those for other NBFCs in a phased manner (Chapter III provides details). VI.8 NBFCs-D accounted for 15.2 per cent of total assets and 17.6 per cent of the total credit deployed by NBFCs at the end of March 2018. Non-government companies dominate this segment, accounting for 87.5 per cent of assets of all NBFCs-D. Unlike private limited NBFCs-ND-SI in which 98 companies constituted 16.1 per cent of the total assets, four private limited NBFCs-D accounted for 21.9 per cent of total assets, pointing to concentration of assets (Table VI.2). | Table VI.2: Ownership Pattern of NBFCs | | (At end-March 2018) | | (Amount in ₹ billion) | | Type | NBFC-ND-SI | NBFC-D | | Number of Companies | Asset Size | Share in per cent | Number of Companies | Asset Size | Share in per cent | | Number | Asset Size | Number | Asset Size | | 1 | 2 | 3 | 4 | 5 | 6 | 7 | 8 | 9 | | A. Government Companies | 29 | 6,858 | 12.6 | 35.5 | 8 | 432 | 4.8 | 12.5 | | B. Non-government Companies (1+2) | 201 | 12,442 | 87.4 | 64.5 | 160 | 3,028 | 95.2 | 87.5 | | 1. Public Limited Companies | 103 | 9,332 | 44.8 | 48.4 | 156 | 2,271 | 92.9 | 65.6 | | 2. Private Limited Companies | 98 | 3,110 | 42.6 | 16.1 | 4 | 757 | 2.4 | 21.9 | | Total (A+B) | 230 | 19,300 | 100.0 | 100.0 | 168 | 3,460 | 100.0 | 100.0 | Note: Data are provisional.
Source: Supervisory Returns, RBI. | 2.2 Balance Sheet VI.9 The consolidated balance sheet of NBFCs expanded in 2017-18 and in 2018-19 (up to September), buoyed by strong credit expansion. Category-wise, the balance sheet of NBFCs-ND-SI expanded by 13.4 per cent, while the balance sheet of NBFCs-D registered robust growth at 24.4 per cent in 2017-18 on account of a sharp rise in loans and advances (Table VI.3) (Appendix Tables VI.1 and VI.2). | Table VI.3: Abridged Balance Sheet of NBFCs | | (Amount in ₹ billion) | | Items | At end-March 2017 | At end-March 2018 | At end-Sept 2018 | | NBFCs | NBFCs- ND-SI | NBFCs-D | NBFCs | NBFCs- ND-SI | NBFCs-D | NBFCs | NBFCs- ND-SI | NBFCs-D | | 1 | 2 | 3 | 4 | 5 | 6 | 7 | 8 | 9 | 10 | | 1. Share Capital and Reserves | 4,527 | 4,104 | 423 | 5,153 | 4,590 | 563 | 5,595 | 4,997 | 598 | | | (19.0) | (19.8) | (11.9) | (13.8) | (11.8) | (33.1) | (15.1) | (13.5) | (30.0) | | 2. Public Deposits | 306 | - | 306 | 319 | - | 319 | 326 | - | 326 | | | (12.9) | - | (12.9) | (4.2) | - | (4.2) | (12.0) | - | (12.0) | | 3. Debentures | 6,481 | 5,813 | 668 | 7,155 | 6,321 | 834 | 7,551 | 6,681 | 870 | | | (20.2) | (19.7) | (23.9) | (10.4) | (8.7) | (24.9) | (-0.4) | (-2.1) | (14.9) | | 4. Bank Borrowings | 3,134 | 2,520 | 614 | 4,039 | 3,319 | 720 | 4,936 | 4,108 | 828 | | | (-7.2) | (-7.2) | (-7.0) | (28.9) | (31.7) | (17.3) | (49.3) | (52.8) | (34.2) | | 5. Commercial Paper | 1,291 | 1,143 | 148 | 1,406 | 1,224 | 182 | 1,816 | 1,525 | 291 | | | (51.2) | (45.1) | (124.2) | (8.9) | (7.1) | (23.0) | (19.7) | (13.0) | (74.3) | | 6. Others | 4,058 | 3,436 | 622 | 4,688 | 3,846 | 842 | 5,795 | 4,909 | 886 | | | (14.8) | (12.7) | (28.0) | (15.5) | (11.9) | (35.4) | (25.0) | (26.1) | (19.2) | | Total Liabilities | 19,798 | 17,017 | 2,781 | 22,760 | 19,300 | 3,460 | 26,019 | 22,220 | 3,799 | | | (14.9) | (14.7) | (15.9) | (15.0) | (13.4) | (24.4) | (17.2) | (16.0) | (25.2) | | 1. Loans and Advances | 14,800 | 12,347 | 2,453 | 17,643 | 14,533 | 3,110 | 19,842 | 16,427 | 3,415 | | | (12.8) | (12.2) | (15.8) | (19.2) | (17.7) | (26.8) | (16.3) | (14.4) | (26.1) | | 2. Investments | 2,759 | 2,628 | 131 | 3,011 | 2,880 | 131 | 3,352 | 3,186 | 166 | | | (21.9) | (21.0) | (42.4) | (9.1) | (9.6) | (0.0) | (14.1) | (12.8) | (48.2) | | 3. Cash and Bank Balances | 796 | 700 | 96 | 649 | 553 | 96 | 848 | 747 | 101 | | | (36.1) | (44.3) | (-4.0) | (-18.5) | (-21.0) | (0.0) | (27.5) | (31.3) | (5.2) | | 4. Other Current Assets | 1,106 | 1,021 | 85 | 1,168 | 1,064 | 104 | 1,639 | 1,537 | 102 | | | (8.0) | (7.2) | (18.1) | (5.6) | (4.2) | (22.4) | (30.1) | (32.7) | (0.0) | | 5. Other Assets | 336 | 321 | 15 | 288 | 270 | 18 | 337 | 323 | 14 | | | (40.0) | (43.9) | (-11.8) | (-14.3) | (-15.9) | (20.0) | (26.2) | (28.7) | (-12.5) | Notes: 1. Data are provisional
2. Figures in parentheses indicate y-o-y growth in per cent.
Source: Supervisory Returns, RBI. | VI.10 In the recent years, the loan companies (LCs) expanded their lending portfolio manifold against the backdrop of slow credit growth of SCBs, easy liquidity and better transmission to their interest rates vis-a-vis SCBs (Box VI.1). Continuing this trend, LCs continued to grow at a healthy pace in 2017-18 and in 2018-19 (up to September). The balance sheet of infrastructure finance companies (NBFCs-IFC), the other major category of NBFCs-ND-SI, grew at a higher rate in 2017-18 and 2018-19 (up to September), because of expansion in loans and advances to industries. On the other hand, the balance sheet of NBFCs-micro finance institutions (NBFCs-MFI) shrank due to conversion of a few large ones into small finance banks. Box VI.1: What Explains the Robust Credit Growth of NBFCs? Four prominent determinants propelling NBFC credit growth vis-à-vis SCBs are examined in order to empirically explore the recent rapid growth in the share of NBFCs in the credit pie: lending rate spread between NBFCs and SCBs; credit growth of SCBs; the asset quality of NBFCs and liquidity conditions. In addition, real sector variables such as gross domestic product (GDP) growth and index of industrial production (IIP) growth are also introduced alternately in the specification to control for procyclicality. A panel generalized method of moments (GMM) framework is used in order to address possible endogeneity arising from inclusion of GDP and other variables. Supervisory data on 76 loan companies3 for the period December 2015 to March 2018 has been used to estimate the following equation, the results of which are presented in Table 1. Credit Growth Loan NBFCijt = Ln WAL Rspreadijt-1 – GNPA loan NBFCsijt-1 – Credit growth SCBst + Net LAFt – εijt The results reveal insights into the NBFCs’ lending behaviour, which seem to be consistent with the stylised facts. The statistically significant association between credit growth and liquidity conditions—represented by a dummy of net liquidity adjustment facility (LAF) positions, suggests that NBFCs operate a passive strategy for managing asset-liability mismatches (ALM) by covering gaps in the wholesale funding markets, rendering them vulnerable to liquidity risks. The statistically significant coefficient with expected negative sign for spreads between NBFC lending rate over bank lending rates suggests that sharper decline in their interest rates as compared to the SCBs aided the former’s credit growth. Besides liquidity conditions, aggregate demand is strongly associated with NBFCs’ lending, suggesting procyclicality and warranting counter-cyclical capital buffers. Loan delinquency has the expected negative sign, although eyeballing of data suggests that levels of loan impairment are relatively low (Chart 1). The slowdown in SCBs’ credit growth during the period of study provided a fillip to loan companies as substitution effects provided tailwinds. This was especially true of their lending to commercial real estate, consumer durables, and vehicle loans (Chart 2). These results are found to be robust to specification changes. | Table 1: Growth in credit of Loan Companies | | Explanatory Variables | Dependent Variable: LNGROSS_ADVANCES_G | | | 1 | 2 | 3 | 4 | 5 | 6 | | LNWALR_SPREAD(-1) | -0.088*** | | | | | | | | (0.0058) | | | | | | | G_SCB_CREDIT | -0.077*** | -0.257*** | | | | | | | (0.015) | (0.014) | | | | | | GNPA_RATIO(-1) | -0.018*** | -0.035*** | -0.004*** | -0.007*** | -0.031*** | -0.031*** | | | (0.0006) | (0.0002) | (0.0003) | (0.0007) | (0.0005) | (0.0005) | | WALR_SPREAD(-1) | | -0.007*** | -0.007*** | -0.006*** | -0.002*** | -0.002*** | | | | (0.011) | (0.0011) | (0.0011) | (0.0007) | (0.0006) | | NET_LAF(-1) | | 0.499*** | | | | | | | | (0.139) | | | | | | SCB_RETAIL_G(-1) | | | -0.328*** | -0.354*** | | | | | | | (0.0007) | (0.0018) | | | | NET_LAF | | | | 0.960*** | 1.319*** | 2.001*** | | | | | | (0.1148) | (0.5086) | (0.4963) | | G_REAL_GDP | | | | | 0.763*** | | | | | | | | (0.0848) | | | G_IIP | | | | | | 0.448*** | | | | | | | | (0.0357) | | Sargan statistic | 0.31 | 0.44 | 0.43 | 0.54 | 0.35 | 0.34 | | Cross-sections | 60 | 69 | 69 | 69 | 69 | 69 | | Observations | 257 | 320 | 252 | 252 | 320 | 320 | ***: p<0.01; **: p<0.05; and *: p<0.10.
Note: LNWALR_Spread: log of spread between WALR of banks and NBFCs; G_SCB_Credit: SCB credit growth; GNPA_ratio: GNPA ratio of loan companies; Net LAF: Dummy for surplus/deficit liquidity conditions; SCB_retail_G: Growth in SCBs’ retail loans; G_Real_GDP: Real GDP growth; G_IIP: IIP growth. |
  In conclusion, empirical findings suggest that slowdown in SCBs’ credit, relative decline in NBFCs cost of lending vis-à-vis banks and an increase in aggregate demand contributed to the rapid expansion in NBFC credit. References Bernanke, B. S., and A. S. Blinder (1992): ‘The Federal Funds Rate and the Channels of Monetary Transmission’, American Economic Review, Vol. 82, 901–921. Calza, A., Gartner, C. and J. Sousa (2001): ‘Modelling the Demand for Loans to the Private Sector in the Euro area’, ECB Working Paper Series No. 55, April. Guo, K. and V. Stepanyan (2011):‘Determinants of Bank Credit in Emerging Market Economies’, IMF Working Paper Series No. 11/51, March. Ivanović, M (2016): ‘Determinants of Credit Growth: The Case of Montenegro’, Journal of Central Banking Theory and Practice, Vol.2, pp. 101-118. | VI.11 The growth of loans and advances, constituting about three-fourth of total assets of NBFCs-ND-SI, accelerated in 2017-18 and 2018 19 (up to September) (Table VI.4). While the retail and the services sectors were the driving forces, loan books also expanded due to credit to medium and large industries sector. The more active role of these entities in 2017-18 and 2018-19 (up to September) is attributable to improved credit demand due to revival in manufacturing and service activity, coupled with robust consumption demand, and the tepid performance of equity markets. | Table VI.4: Major Components of Liabilities and Assets of NBFCs-ND-SI by Classification of NBFCs | | (Amount in ₹ billion) | | Category/ Liability | At end-March 2017 | At end-March 2018 P | At end-Sept 2018 P | Percentage Variation of Total Liabilities (Mar 2018 over Mar 2017) | Percentage Variation of Total Liabilities (Sept 2018 over Sept 2017) | | Borrowings | Other Liabilities | Total Liabilities | Borrowings | Other Liabilities | Total Liabilities | Borrowings | Other Liabilities | Total Liabilities | | 1 | 2 | 3 | 4 | 5 | 6 | 7 | 8 | 9 | 10 | 11 | 12 | | Asset Finance Company | 1,026 | 283 | 1,309 | 1,179 | 267 | 1,446 | 1,485 | 519 | 2,004 | 10.5 | 32.3 | | Core Investment Company | 246 | 510 | 756 | 363 | 625 | 988 | 182 | 600 | 782 | 30.8 | -17.9 | | Factoring - NBFC | 15 | 13 | 28 | 18 | 20 | 38 | 18 | 20 | 38 | 37.7 | 10.5 | | IDF-NBFC | 95 | 25 | 120 | 175 | 32 | 206 | 198 | 34 | 232 | 72.0 | 39.8 | | Infrastructure Finance Company | 5,160 | 1,637 | 6,797 | 5,497 | 1,958 | 7,455 | 6,838 | 1,712 | 8,549 | 9.7 | 19.4 | | Investment Company | 955 | 1,118 | 2,073 | 1,095 | 1,278 | 2,373 | 1,441 | 1,349 | 2,790 | 14.5 | 10.4 | | Loan Company | 4,064 | 1,329 | 5,393 | 5,012 | 1,271 | 6,283 | 5,245 | 2,119 | 7,364 | 16.5 | 17.6 | | NBFC-MFI | 390 | 152 | 542 | 354 | 158 | 512 | 309 | 151 | 460 | -5.6 | -15.3 | | Total | 11,951 | 5,066 | 17,017 | 13,692 | 5,609 | 19,300 | 15,716 | 6,504 | 22,220 | 13.4 | 16.0 | | Category/ Asset | Loans and Advances | Other Assets | Total Assets | Loans and Advances | Other Assets | Total Assets | Loans and Advances | Other Assets | Total Assets | Percentage Variation of Total Assets (Mar 2018 over Mar 2017) | Percentage Variation of Total Assets (Sept 2018 over Sept 2017) | | Asset Finance Company | 1,026 | 283 | 1,309 | 1,195 | 251 | 1,446 | 1778 | 226 | 2,004 | 10.5 | 32.3 | | Core Investment Company | 123 | 632 | 756 | 140 | 848 | 988 | 69 | 713 | 782 | 30.8 | -17.9 | | Factoring - NBFC | 25 | 3 | 28 | 30 | 8 | 38 | 31 | 7 | 38 | 37.7 | 10.5 | | IDF-NBFC | 81 | 39 | 120 | 102 | 104 | 206 | 174 | 58 | 232 | 72.0 | 39.8 | | Infrastructure Finance Company | 6,051 | 746 | 6,797 | 6,966 | 488 | 7,455 | 7,323 | 1,227 | 8,549 | 9.7 | 19.4 | | Investment Company | 353 | 1,720 | 2,073 | 514 | 1,859 | 2,373 | 673 | 2,117 | 2,790 | 14.5 | 10.4 | | Loan Company | 4,286 | 1,107 | 5,393 | 5,172 | 1,111 | 6,283 | 5,992 | 1,373 | 7,364 | 16.5 | 17.6 | | NBFC-MFI | 402 | 141 | 542 | 414 | 97 | 512 | 388 | 72 | 460 | -5.6 | -15.3 | | Total | 12,346 | 4,670 | 17,017 | 14,533 | 4,767 | 19,300 | 16,427 | 5,793 | 22,220 | 13.4 | 16.0 | Note: Data are provisional.
Source: Supervisory Returns, RBI. | VI.12 Amongst NBFCs-D, the balance sheets of asset finance companies (AFCs) increased because of the inclusion of deposits garnered by government-owned NBFCs. LCs’ deposit growth, on the other hand, declined by 26.4 per cent in 2017-18, and by 9.9 per cent in FY2018-19 (up to September), while borrowings increased at a faster pace. Credit, which constituted 89.9 per cent of total assets of NBFCs-D showed strong growth (Table VI.5). 2.3 Sectoral Credit of NBFCs VI.13 Industry accounts for more than half of total credit extended by NBFCs, followed by retail, services and agriculture. A significant part of the credit to industry is provided by government-owned NBFCs, especially by NBFCs-IFC (Chart VI.3). | Table VI.5: Major Components of Liabilities and Assets of NBFCs-D by Classification of NBFCs | | (Amount in ₹ billion) | | Items | Asset Finance Companies | Loan Companies | Total NBFCs-D@ | | At end- March 2017 | At end- March 2018 | At end- Sept 2018 | At end- March 2017 | At end- March 2018 | At end- Sept 2018 | At end- March 2017 | At end- March 2018 | At end- Sept 2018 | | 1 | 2 | 3 | 4 | 5 | 6 | 7 | 8 | 9 | 10 | | No. of Companies | 90 | 98 | 79 | 25 | 28 | 28 | 115 | 126 | 107 | | Deposits | 113 | 177 | 204 | 193 | 142 | 128 | 306 | 319 | 326 | | Borrowings | 1,059 | 1,320 | 1,280 | 782 | 998 | 1,133 | 1,841 | 2,318 | 2,413 | | Total Liabilities/Assets | 1,471 | 1,757 | 1,915 | 1,310 | 1,703 | 1,884 | 2,781 | 3,460 | 3,799 | | Total Advances | 1,304 | 1,576 | 1,739 | 1,149 | 1,534 | 1,676 | 2,453 | 3,110 | 3,415 | | Investments | 58 | 58 | 70 | 73 | 73 | 96 | 131 | 131 | 166 | Notes: 1. Data are provisional.
2. @: Total excludes investment companies.
Source: Supervisory Returns, RBI. | VI.14 Retail loans of NBFCs grew at a robust 46.2 per cent during 2017-18—on top of a growth of 21.6 per cent during 2016-17—reflecting upbeat consumer demand, especially in the vehicle loans segment. Credit to the services sector was driven mainly by commercial real estate and retail trade. The growth in lending to commercial real estate is noteworthy in view of a sharp deceleration in SCBs’ credit to this sector. Credit to agriculture and allied activities revived during 2017-18, reflecting the low base of the preceding year. NBFCs’ lending to the MSME sector was also robust, compensating for the deceleration in SCBs’ credit (Table VI.6). Increasingly, NBFCs are looking for newer avenues to diversify their lending portfolios (Appendix Table VI.3). 2.4 Resource Mobilisation VI.15 The major sources of resource mobilisation of NBFCs-ND-SI have been debentures and bank borrowings with the latter being preferred during 2017-18 and in 2018-19 (up to September), in contrast to the larger recourse to debentures in 2016-17 (Chart VI. 4). VI.16 The share of CPs which declined during 2017-18 turned around in H1:2018-19 partly replacing the reduction in share of debentures (Table VI.7). VI.17 The compositional shift in borrowings in 2017-18 was mainly due to rising yields, which adversely affected the cost of market borrowings, especially of CPs, while lending rates of banks fell in the monetary easing cycle, making borrowing from banks more attractive (Chart VI.5). Secondly, lending to NBFCs especially to those with high credit ratings and better financial performance—presented a lucrative business alternative to banks in an environment characterised by rising non performing assets (NPAs) and pervasive risk aversion. | Table VI.6: Credit to Select Sectors by NBFCs | | (Amount in ₹ billion) | | Items | At end- March 2017 | At end- March 2018 | At end- September 2018 | Percentage Variation (Mar 2018 over Mar 2017) | | 1 | 2 | 3 | 4 | 5 | | I. Gross Advances | 14,857 | 17,643 | 19,842 | 18.8 | | II. Food Credit | 1.7 | 2.7 | 5.0 | 64.2 | | III. Non-food Credit (1 to 5) | 14,855 | 17,640 | 19,837 | 18.7 | | 1. Agriculture and Allied Activities | 354 | 476 | 596 | 34.4 | | 2. Industry (2.1 to 2.4) | 8,940 | 9,655 | 10,374 | 8.0 | | 2.1 Micro and Small | 508 | 561 | 516 | 10.4 | | 2.2 Medium | 172 | 252 | 325 | 46.7 | | 2.3 Large | 4,375 | 4,785 | 5,128 | 9.4 | | 2.4 Others | 3,885 | 4,055 | 4,405 | 4.4 | | 3. Services | 2,224 | 3,013 | 3,563 | 35.5 | | Of which, | | | | | | 3.1 Commercial Real Estate | 958 | 1,257 | 1,337 | 31.2 | | 3.2 Retail Trade | 170 | 275 | 325 | 61.9 | | 4. Retail Loans | 2,490 | 3,639 | 4,381 | 46.2 | | Of which, | | | | | | 4.1 Housing Loans | 106 | 135 | 165 | 27.5 | | 4.2 Consumer Durables | 57 | 88 | 111 | 54.2 | | 4.3 Vehicle/Auto Loans | 1,035 | 1,675 | 1,942 | 61.9 | | 5. Other Non-food Credit | 847 | 857 | 923 | 1.1 | Note: Data are provisional.
Source Supervisory Returns, RBI. |
 VI.18 Bank lending to NBFCs revived in 2017-18 and 2018-19 (up to September) from the slowdown in 2016-17 and indirect lending decreased (Chart VI.6). 2.5 NBFCs-D: Deposits VI.19 The Reserve Bank has been striving to wean away NBFCs from collecting public deposits as alluded to earlier. A revised regulatory framework was issued in November 2014 mandating that only rated NBFCs-D shall accept and maintain public deposits. These guidelines also permitted AFCs to raise public deposits up to a limit of 1.5 times the NOF only, unlike 4 times the NOF allowed earlier. | Table VI.7: Sources of Borrowings of NBFCs-ND-SI | | (Amount in ₹ billion) | | Items | At end- March 2017 | At end- March 2018 | At end-Sept 2018 | Share in per cent | | March 2017 | March 2018 | Sept 2018 | | 1 | 2 | 3 | 4 | 5 | 6 | 7 | | 1. Debentures | 5,795 | 6,321 | 6,681 | 48.6 | 46.2 | 42.5 | | 2. Bank borrowings | 2,527 | 3,318 | 4,108 | 21.2 | 24.2 | 26.1 | | 3. Borrowings from FIs | 263 | 221 | 277 | 2.2 | 1.6 | 1.8 | | 4. Inter-corporate borrowings | 404 | 500 | 701 | 3.4 | 3.7 | 4.5 | | 5. Commercial paper | 1,119 | 1,224 | 1,525 | 9.4 | 8.9 | 9.7 | | 6. Borrowings from government | 193 | 175 | 1 | 1.6 | 1.3 | 0.01 | | 7. Subordinated debts | 333 | 352 | 361 | 2.8 | 2.6 | 2.3 | | 8. Other borrowings | 1,283 | 1,580 | 2,062 | 10.8 | 11.5 | 13.1 | | 9. Total borrowings | 11,917 | 13,691 | 15,716 | 100.0 | 100.0 | 100.0 | Note: Data are provisional.
Source: RBI Supervisory Returns. |
VI.20 The number of companies authorised to accept deposits came down from 178 in 2016-17 to 168 in 2017-18 and 108 in 2018-19 (up to September). Deposit growth slowed down from 12.9 per cent in 2016-17 to 4.2 per cent in 2017-18 (Chart VI.7). 2.6 Financial Performance of NBFCs VI.21 NBFCs’ profitability improved during 2017-18 and 2018-19 (up to September) mainly due to an increase in fund-based income. The income of NBFCs-D increased faster than that of NBFCs-ND-SI in 2017-18. While the cost to income ratio of NBFCs and in particular of NBFCs-D declined, reflecting improvement in operational efficiency, this ratio rose in respect of NBFCs-ND-SI pointing to the increasing operating costs (Appendix tables VI.4 and VI.5). In H1:2018-19, net profits of NBFCs-ND-SI decelerated mainly due to increased expenditure (Table VI.8). 2.7 Profitability VI.22 NBFCs’ profitability indicators—returns on equity (RoE) and returns on assets (RoA)— were higher during 2017-18 than a year ago, although the net interest margin (NIM) decreased, reflecting higher interest expenses (Chart VI.8). During the current financial year so far (up to September 2018), the profitability ratios of NBFCs were marginally lesser to those reported in the previous year. VI.23 The profitability of NBFCs-ND-SI, gauged in terms of RoA and RoE, increased in 2017-18, although NIM was lower mirroring higher interest payments. The factoring companies dragged down this segment’s profitability while the bottom lines of NBFCs-IFC and AFCs improved (Chart VI.9). In H1: 2018-19, the profitability of loan companies and AFCs within the NBFC-ND-SI classification improved, as their robust credit growth continued. 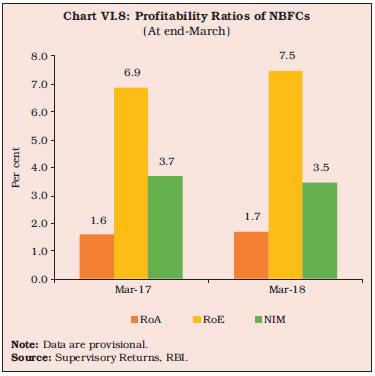
| Table VI.8: Financial Parameters of the NBFC Sector | | (Amount in ₹ billion) | | Items | 2016-17 | 2017-18 | H1:2018-19 | | NBFCs | NBFCs- ND-SI | NBFCs-D | NBFCs | NBFCs- ND-SI | NBFCs-D | NBFCs | NBFCs- ND-SI | NBFCs-D | | 1 | 2 | 3 | 4 | 5 | 6 | 7 | 8 | 9 | 10 | | A. Income | 2,310 | 1,909 | 402 | 2,515 | 2,034 | 480 | 1,395 | 1,111 | 284 | | | (7.8) | (6.9) | (12.6) | (8.9) | (6.5) | (19.4) | (16.7) | (7.8) | (73.2) | | B. Expenditure | 1,822 | 1,498 | 325 | 1,958 | 1,584 | 374 | 1069 | 863 | 206 | | | (11.9) | (11.5) | (14.0) | (7.5) | (5.7) | (15.1) | (16.2) | (9.8) | (53.7) | | C. Net Profit | 314 | 263 | 50 | 386 | 316 | 70 | 230 | 179 | 51 | | | (-14.4) | (-17.3) | (2.0) | (22.9) | (20.2) | (40.0) | (16.2) | (4.1) | (96.2) | | D. Total Assets | 19,797 | 17,017 | 2,781 | 22,760 | 19,300 | 3,460 | 26,019 | 22,220 | 3,799 | | | (14.9) | (14.7) | (15.9) | (15.0) | (13.4) | (24.4) | (17.2) | (16.0) | (25.2) | | E. Financial Ratios | | | | | | | | | | | (as per cent of Total Assets) | | | | | | | | | | | (i) Income | 11.7 | 11.3 | 14.5 | 11.0 | 10.5 | 13.9 | 5.4 | 5.0 | 7.5 | | (ii) Expenditure | 9.2 | 8.9 | 11.7 | 8.6 | 8.2 | 10.8 | 4.1 | 3.9 | 5.4 | | (iii) Net Profit | 1.6 | 1.6 | 1.8 | 1.7 | 1.6 | 2.0 | 0.9 | 0.8 | 1.3 | | F. Cost to Income Ratio (Per cent) | 78.9 | 68.3 | 80.9 | 77.9 | 72.7 | 77.8 | 72.1 | 68.7 | 83.3 | Notes: 1. Data are provisional.
2. Figures in parentheses indicate y-o-y growth in per cent.
Source: Supervisory Returns, RBI. | VI.24 In the case of NBFCs-D, NIM of LCs declined considerably in 2017-18 as compared to 2016-17, reflective of higher redemption of public deposits raised by these entities (Chart VI.10). In H1: 2018-19, however, the profitability of deposit taking NBFCs improved as compared to the previous year. 2.8 Asset Quality VI.25 Since November 2014, the asset classification norms of NBFCs have been incrementally aligned with those of banks, leading to higher NPA recognition4. During 2017-18, however, there has been an improvement in asset quality, with a part of the portfolio of assets classified as NPAs in 2016-17 being upgraded to standard assets. As a result, both the gross non-performing assets (GNPAs) ratio and the net non-performing assets (NNPAs) ratio declined during 2017-18 (Chart VI.11). In quarter-ended September 2018, however, since the GNPA ratio deteriorated marginally, NBFCs made larger provisions and hence, the NNPA ratio improved. 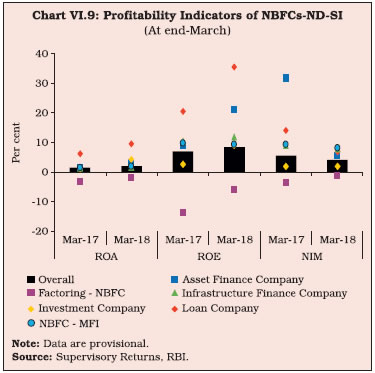 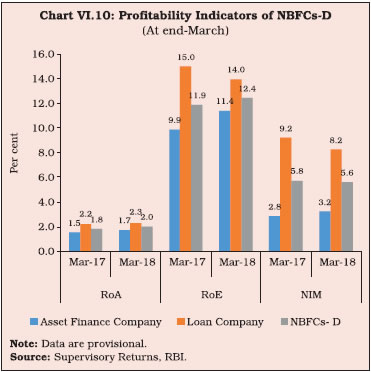 VI.26 The improvement in asset quality was reflected in the composition of NBFC assets. Advances in 2016-17 classified as sub-standard were upgraded to standard advances, while loss advances moved to the doubtful assets category in 2017-18 (Chart VI.12). However, in quarter-ended September 2018, the proportion of sub-standard assets increased as some standard assets were degraded. The upgradation of some doubtful assets to the sub-standard category, however, augurs well for the asset quality. VI.27 Gross NPA ratio of NBFCs-ND-SI improved in 2017-18 vis-à-vis 2016-17 as a significant portfolio of assets classified as NPA in 2016-17 was upgraded to standard assets, accompanied by a pick-up in asset growth. A few large accounts of NBFCs-IFC, which were adversely affected by the revised NPA recognition norms in 2016-17, revived in 2017-18 and were upgraded to standard assets. Except LCs, all categories of NBFCs-ND-SI reported improvement in asset quality (Chart VI.13a). The reduction in the GNPA ratio was especially significant in the case of AFCs. NBFCs-MFI reported a marginal decrease in their GNPA ratio, although it remains elevated in 2017-18. The lending operations of the NBFCs-MFI sector, which had slowed down in 2016-17 revived, but this sector is yet to recover fully from delinquencies in asset quality. Net NPAs broadly followed the pattern of gross NPAs, except for LCs which showed an improvement, unlike their GNPA ratios (Chart VI.13b). VI.28 Sectors with high stressed assets5 ratios observed lower credit growth. During H1:2017-18, sector with high levels of stressed assets like industry received lower flows of credit, while credit to sectors with relatively lower levels of stressed assets such as services and retail grew robustly (Chart VI.14). In H2: 2017-18, the stressed assets ratio in industry and agriculture reduced and a concomitant increase in credit growth was visible. VI.29 In the case of NBFCs-D as well, the impact of harmonisation of NPA recognition norms is waning. Asset growth also aided in the decline in the GNPA ratio. More than half of the NPAs were reported in loans to transport operators and construction sector, which were almost entirely financed by AFCs. As a result, NPAs of AFCs were higher than those of LCs (Chart VI.15). 2.9 Capital Adequacy VI.30 NBFCs are generally well capitalised, with the system level capital to risk-weighted assets ratio (CRAR) remaining well above the stipulated norm of 15 per cent. During 2017-18, the NBFC sector’s CRAR improved further. In 2018-19 (up to September), however, their capital positions moderated somewhat due to the increase in non-performing assets (Chart VI.16). VI.31 All categories of NBFCs-ND-SI reported CRARs well above the stipulated norm during 2017-18. For the sector as a whole, capital adequacy increased due to significant improvement in respect of investment companies (Chart VI.17). In quarter ended-September 2018, capital position of NBFCs-MFI improved, after some deterioration during 2017-18. VI.32 For the last two years, the CRAR of NBFCs-D has remained constant. The capital position of LCs, however has worsened due to delinquency in asset quality (Chart VI.18). 2.10 Exposure to Sensitive Sectors VI.33 The Reserve Bank has delineated the capital market, real estate and commodities as sensitive sectors in view of the risks associated with fluctuations in prices of these assets. While SCBs’ lending to sensitive sectors accelerated, NBFCs’ lending to these sectors decelerated in 2017-18 (Chart VI.19). 2.11 Residuary Non-Banking Companies (RNBCs) VI.34 The principal business of RNBCs is collecting deposits and deploying them as allowed by the Reserve Bank. As of March 2015, only two RNBCs were registered with the Reserve Bank. In September 2015, the registration of one company was cancelled. Both the RNBCs have stopped accepting deposits and are in the process of repaying old deposits. VI.35 To sum up, the NBFC sector’s consolidated balance sheet continued to expand on the back of strong credit growth on the asset side and borrowings on the liability side. The credit growth was led by retail and services sector loans. Deposit mobilisation decelerated in response to regulatory initiatives. Profitability and soundness indicators improved. 2.12 Housing Finance Companies (HFCs) VI.36 The credit needs of the housing finance market are met mainly by scheduled commercial banks (SCBs) and housing finance companies (HFCs).6 The importance of HFCs is underscored by the fact that their share was 25.3 per cent in the flow of credit to the commercial sector from non-bank domestic sources in 2017-18. HFCs’ share in lending to housing increased from 41.0 per cent in 2016-17 to 43.6 per cent in 2017-18. Although the loan books of both SCBs and HFCs expanded during 2017-18, the lending of the latter grew at almost twice the pace of that of SCBs (Chart VI.20). VI.37 At the end of March 2018, there were 91 HFCs, of which 18 were deposit-taking and the remaining 73 were non-deposit taking. Deposit-taking HFCs are all public limited companies. The only one government-owned HFC had a share of 4.2 per cent in total assets in 2017-18. The asset size of non-government owned HFCs, the dominant segment, grew at a rate of 27.5 per cent during 2017-18 (Table VI.9). 2.12.1 Balance Sheet VI.38 A sharp increase in loans and advances of HFCs—propelled by the recent initiatives of the Government of India to boost affordable housing—was instrumental in driving the growth of their consolidated balance sheet. On the asset side, loans and advances constituted more than four-fifth of their balance sheet while more than two-third of their loan portfolio comprised housing loans in 2017-18. On the liabilities side, deposits and borrowings together accounted for almost four-fifth of the total liabilities of HFCs, with borrowings being the dominant source of funds. Borrowings, including debentures and CPs, increased at 27.7 per cent in 2017-18 while pubic deposits grew at a more moderate rate of 8.7 per cent. HFCs raised resources largely via debentures, which constituted nearly half of all borrowings, followed by bank loans (Table VI.10). | Table VI.9: Ownership Pattern of HFCs | | (At end-March) | | (Amount in ₹ billion) | | Type | 2017 | 2018 | | Number | Asset Size | Number | Asset Size | | 1 | 2 | 3 | 4 | 5 | | A. Government Companies | 1 | 393 | 1 | 489 | | B. Non-government Companies (1+2) | 82 | 8,715 | 90 | 11,108 | | 1. Public Limited Companies | 65 | 8,696 | 72 | 11,093 | | 2. Private Limited Companies | 17 | 20 | 18 | 15 | | Total (A+B) | 83 | 9,109 | 91 | 11,598 | | Source: NHB. |
| Table VI.10: Consolidated Balance Sheet of HFCs | | (At end-March) | | (Amount in ₹ billion) | | Items | 2016 | 2017 | 2018 | Percentage Variation | | 2016-17 | 2017-18 | | Share Capital | 79 | 93 | 305 | 18.3 | 228.2 | | Reserves and Surplus | 736 | 932 | 1,247 | 26.6 | 33.7 | | Public Deposits | 935 | 1,121 | 1,219 | 19.8 | 8.7 | | Debentures | 2,589 | 3,364 | 4,100 | 29.9 | 21.9 | | Bank Borrowings | 1,723 | 1,727 | 2,310 | 0.2 | 33.7 | | Borrowings from Fls | 135 | 216 | 279 | 59.9 | 29.5 | | Inter-corporate Borrowings | 22 | 20 | 40 | -10.5 | 99.9 | | Commercial Paper | 481 | 682 | 975 | 41.9 | 42.9 | | Borrowings from Government | - | - | - | - | - | | Subordinated Debts | 133 | 163 | 202 | 22.6 | 24.1 | | Other Borrowings | 78 | 186 | 211 | 137.7 | 13.7 | | Current Liabilities | 184 | 245 | 318 | 33.3 | 29.7 | | Provisions | 97 | 83 | 126 | -15.3 | 52.5 | | Others* | 139 | 171 | 184 | 22.6 | 7.7 | | Total Liabilities/ Assets | 7,332 | 9,003 | 11,516 | 22.8 | 27.9 | | Loans and Advances | 6,053 | 7,286 | 9,354 | 20.4 | 28.4 | | Hire Purchase and Lease Assets | 0.01 | 0.02 | 0.04 | 100.0 | 100.0 | | Investments | 316 | 551 | 739 | 74.3 | 34.0 | | Cash and Bank Balances | 188 | 227 | 196 | 20.7 | -13.9 | | Others** | 775 | 938 | 1,228 | 21.0 | 30.9 | *: includes deferred tax liabilities and other liabilities.
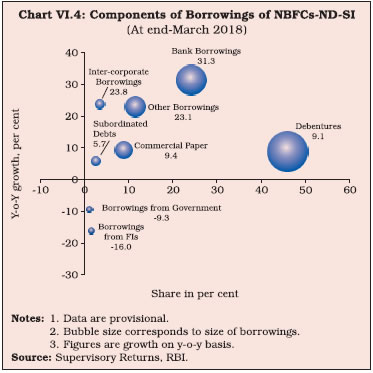
**: includes fixed assets, tangible and intangible assets, other assets and deferred tax asset.
Note: Information submitted by 84 out of 91 HFCs as on March 31, 2018.
Source: NHB. | 2.12.2 Resource Profile of HFCs VI.39 Apart from debentures and borrowing from banks, public deposits, external commercial borrowings, capital market instruments such as CPs and the NHB’s refinance support constituted the sources of funds for HFCs (Chart VI.21). VI.40 HFCs primarily mobilise term deposits of over one-year maturity; however, deposit growth decelerated in 2017-18, partly reflecting the high base of the previous year (Chart VI.22). VI.41 The distribution of deposits reveals a concentration in 6 per cent to 9 per cent interest rate bucket during 2017-18 (Chart VI.23 a and b), with deposit mobilisation slowing down across maturities (Chart VI.23 c and d). 2.12.3 Financial Performance VI.42 Both income and expenditure of HFCs decelerated in 2017-18 as compared to 2016-17. While expenditure decelerated partly reflecting lower spending on interest payments, income growth was marred by lower fund-based income. Accordingly, net profits of HFCs grew at a lower rate in 2017-18 as compared to 2016-17 (Chart VI.24). VI.43 While there was a marginal decline in RoAs of HFCs in 2017-18 vis-à-vis in 2016-17 as profitability declined, the cost to income ratio of HFCs remained fairly stable (Table VI.11) 2.12.4 Soundness Indicators VI.44 GNPA and NNPA ratios, which had come down in 2014-15 and remained stable at 1.1 and 0.5 per cent, respectively for the next three years, inched up again in 2017-18 and 2018-19 (up to September). However, the asset quality of HFCs remained better than that of SCBs and NBFCs (Chart VI.25).
Table VI.11: Financial Ratios of HFCs
(As per cent of Total Assets) | | (At-end March) | | Particulars | 2013-14 | 2014-15 | 2015-16 | 2016-17 | 2017-18 | | 1 | 2 | 3 | 4 | 5 | 6 | | Total Income | 10.8 | 10.8 | 10.5 | 10.0 | 9.0 | | 1. Fund Income | 10.6 | 10.6 | 10.3 | 9.8 | 8.8 | | 2. Fee Income | 0.2 | 0.2 | 0.2 | 0.2 | 0.2 | | Total Expenditure | 7.9 | 7.8 | 7.5 | 7.4 | 6.6 | | 1. Financial Expenditure | 7.2 | 7.1 | 6.8 | 6.4 | 5.7 | | 2. Operating Expenditure | 0.7 | 0.7 | 0.7 | 0.9 | 1.0 | | Tax Provision | 0.8 | 0.9 | 0.9 | 0.8 | 0.7 | | Cost to Income Ratio (Total Exp./Total Income) | 73.3 | 72.6 | 71.6 | 73.6 | 73.6 | | Return on Assets (RoA) (PAT/Total Assets) | 2.1 | 2.0 | 2.0 | 2.1 | 2.0 | | Source: NHB. | 3. A ll India Financial Institutions VI.45 At the end of March 2018, there were four financial institutions under the regulation and supervision of the Reserve Bank viz., the Export Import Bank of India (EXIM Bank), the National Bank for Agriculture and Rural Development (NABARD), the Small Industries Development Bank of India (SIDBI) and the National Housing Bank (NHB) (Chart VI.26). 3.1 AIFIs’ Operations7 VI.46 Financial assistance sanctioned by AIFIs during 2017-18 increased by 2.4 per cent whereas disbursement growth was robust at 21.1 per cent in line with an upturn in overall economic activity. Disbursement by all AIFIs expanded during the year, with the largest expansion recorded by SIDBI mainly reflecting increase in refinancing to the banks for on-lending to the MSME sector (Table VI.12) (Appendix Table VI.6). 3.2 Balance Sheet VI.47 The AIFIs’ consolidated balance sheet expanded by 16.4 per cent during 2017-18 on the back of loans and advances, which constituted the largest share of assets. On the liability side, bonds and debentures and other borrowings also increased during the year to finance increased credit disbursement and investment activities (Table VI.13).
| Table VI.12: Financial Assistance Sanctioned and Disbursed by AIFIs | | (₹ billion) | | Category | 2016-17 | 2017-18 | | S | D | S | D | | 1 | 2 | 3 | 4 | 5 | | SIDBI | 406 | 395 | 588 | 587 | | NABARD | 2,401 | 1,977 | 2,174 | 2,278 | | NHB | 379 | 234 | 449 | 249 | | EXIM BANK | 709 | 531 | 777 | 685 | | Total | 3,895 | 3,137 | 3,989 | 3,799 | S: Sanction D: Disbursement
Source: SIDBI, NABARD, NHB and EXIM Bank. | VI.48 AIFIs largely raised short-term funds for financing their activities. While the NHB accounted for more than half of the total resources raised in 2017-18, the EXIM Bank accounted for the least, with most of its funds being foreign currency borrowings (Table VI.14). | Table VI.13: AIFIs’ Balance Sheet | | (Amount in ₹ billion) | | Items | 2017 | 2018 | Percentage Variation | | 1 | 2 | 3 | 4 | | Liabilities | | | | | 1. Capital | 155 | 199 | 28.4 | | | (2.6) | (2.8) | | | 2. Reserves | 490 | 511 | 4.3 | | | (8.1) | (7.3) | | | 3. Bonds and Debentures | 1,472 | 1,850 | 25.7 | | | (24.4) | (26.3) | | | 4. Deposits | 2,467 | 2,913 | 18.1 | | | (40.9) | (41.5) | | | 5. Borrowings | 898 | 1,005 | 11.9 | | | (14.9) | (14.3) | | | 6. Other Liabilities | 552 | 544 | -1.4 | | | (9.1) | (7.8) | | | Total Liabilities/Assets | 6,034 | 7,023 | 16.4 | | Assets | | | | | 1. Cash and Bank Balances | 193 | 237 | 22.8 | | | (3.2) | (3.4) | | | 2. Investments | 408 | 495 | 21.3 | | | (6.8) | (7.1) | | | 3. Loans and Advances | 5,283 | 6,097 | 15.4 | | | (87.6) | (86.8) | | | 4. Other Assets | 150 | 193 | 28.7 | | | (2.5) | (2.8) | | Note: Figures in parentheses are percentages of total liabilities/assets.
Source: Audited OSMOS returns. |
| Table VI.14: Resources Mobilised by Financial Institutions in 2017-18 | | (Amount in ₹ billion) | | Institution | Total Resources Raised | Total Outstanding | | Long- Term | Short- Term | Foreign Currency | Total | | 1 | 2 | 3 | 4 | 5 | 6 | | 1. SIDBI | 79 | 542 | 3 | 624 | 870 | | 2. NABARD | 353 | 1,350 | 2 | 1,705 | 1,141 | | 3. NHB | 42 | 3,561 | 2 | 3,606 | 527 | | 4. EXIM BANK | 34 | 122 | 184 | 340 | 1,042 | | Total | 508 | 5,574 | 192 | 6,274 | 3,579 | Note: Long-term rupee resources comprise borrowings by way of bonds/ debentures; while short-term resources comprise CPs, term deposits, ICDs, CDs and borrowings from the term money market. Foreign currency resources largely comprise borrowings by way of bonds, etc. in the international market.
Source: SIDBI, NABARD, NHB and EXIM Bank. | VI.49 Resources mobilised by the AIFIs through CPs, certificate of deposits, and term deposits increased during 2017-18. This resulted in higher utilisation of borrowing limits (Table VI.15). The NABARD and the SIDBI together constituted 80 per cent of all resources raised by the AIFIs from the money market. 3.3 Sources and Uses of Funds VI.50 Funds raised and deployed by the AIFIs doubled in 2017-18, over a year ago. This was due to the sharp increase in repayment of past borrowings mainly through external sources of funds. Resource mobilisation from the market and capital infusion from the government contributed to the internal source of funds (Table VI.16). 3.4 Maturity and Cost of Borrowings and Lending VI.51 The weighted average cost (WAC) of rupee resources raised by all the AIFIs–except for the EXIM bank–declined in 2017-18 (Chart VI.27.a). The weighted average maturity (WAM) of rupee resources increased for the SIDBI, the EXIM Bank and the NABARD, while it declined for the NHB (Chart VI.27.b). Thus, the AIFIs raised more long-term resources in the face of falling long-term average costs. | Table VI.15: Resources Raised by AIFIs from the Money Market | | (At end-March)# | | (Amount in ₹ billion) | | Instrument | 2016-17 | 2017-18 | | 1 | 2 | 3 | | A. Total | 613 | 737 | | (i) Term Deposits | 24 | 54 | | (ii) Term Money | 22 | 32 | | (iii) Inter-corporate Deposits | 0 | 0 | | (iv) Certificate of Deposits | 125 | 189 | | (v) Commercial Paper | 442 | 462 | | Memo Items; | | | | B. Umbrella Limit | 742 | 817 | C. Utilisation of Umbrella Limit*
(A as percentage of B) | 82.6 | 90.2 | #: End-June for NHB.
*: Resources raised under A.
Note: AIFIs are allowed to mobilise resources within the overall ‘umbrella limit’, which is linked to the net owned funds (NOF) of the FI concerned as per its latest audited balance sheet. The umbrella limit is applicable for five instruments– term deposits; term money borrowings; certificates of deposits (CDs); commercial paper (CPs); and inter-corporate deposits.
Source: SIDBI, NABARD, NHB and EXIM Bank. | VI.52 The long-term prime lending rate (PLR) of all AIFIs declined in 2017-18 except for NHB, which reported a marginal increase. This may be attributed to the monetary easing cycle, which resulted in reduction of cost of funds. The SIDBI and the EXIM Bank had the highest and the lowest PLRs, respectively (Chart VI.28). | Table VI.16: Pattern of AIFIs’ Sources and Deployment of Funds | | (Amount in ₹ billion) | | Items | 2016-17 | 2017-18 | | 1 | 2 | 3 | | A. Sources of funds | | | | (i) Internal | 11,331 | 12,887 | | | (67.2) | (38.2) | | (ii) External | 4,374 | 19,480 | | | (26.0) | (57.8) | | (iii) Others* | 1,148 | 1,325 | | | (6.8) | (3.9) | | Total (i+ii+iii) | 16,853 | 33,692 | | | (100.0) | (100.0) | | B. Deployment of Funds | | | | (i) Fresh Deployment | 3,175 | 6,851 | | | (18.8) | (20.3) | | (ii) Repayment of Past Borrowings | 2,217 | 20,982 | | | (13.2) | (62.3) | | (iii) Other Deployment | 11,460 | 5,859 | | | (68.0) | (17.4) | | Of which: Interest Payments | 296 | 322 | | | (1.8) | (1.0) | | Total (i+ii+iii) | 16,853 | 33,692 | | | (100.0) | (100.0) | *: Includes cash and balances with banks and the Reserve Bank of India.
Note: Figures in parentheses are percentages of total.
Source: SIDBI, NABARD, NHB and EXIM Bank. |
3.5 Financial Performance VI.53 AIFIs posted a modest growth in income during the year, with a decline in non-interest income operating as a drag. Expenditure increased at a greater rate than income, which resulted in a decline in net profits of AIFIs during the year. Operating expenses increased only marginally as the wage bill declined in 2017-18 relative to 2016-17 (Table VI.17). | Table VI.17: Financial Performance of Select AIFIs | | (Amount in ₹ billion) | | Item | 2016-17 | 2017-18 | Percentage Variation | | 2016-17 | 2017-18 | | 1 | 2 | 3 | 4 | 5 | | A. Income | 424 | 442 | 7.3 | 4.2 | | (a) Interest Income | 409 | 430 | 6.0 | 5.1 | | | (96.5) | (97.3) | | | | (b) Non-interest Income | 15 | 12 | 66.7 | -19.6 | | | (3.5) | (2.7) | | | | B. Expenditure | 326 | 347 | 8.3 | 6.3 | | (a) Interest Expenditure | 298 | 316 | 6.8 | 6.2 | | | (91.3) | (91.3) | | | | (b) Operating Expenses | 28 | 30 | 27.3 | 7.3 | | | (8.7) | (8.7) | | | | Of which Wage Bill | 21 | 16 | 40.0 | -22.2 | | C. Provisions for Taxation | 26 | 10 | 18.2 | -62.4 | | D. Profit | | | | | | Operating Profit | 73 | 94 | 4.3 | 29.0 | | Net Profit | 47 | 22 | -2.1 | -52.8 | Note: Figures in parentheses are percentages of total income/expenditure.
Source: Audited OSMOS returns. |
VI.54 All the financial ratios of AIFIs decreased in 2017-18 from a year ago (Chart VI.29). VI.55 During 2017-18, the EXIM Bank registered losses on account of significantly higher requirement of provisions. As a result, their net profit per employee was negative. The NABARD was the only organisation which reported an increase in net profit per employee (Table VI.18). Barring the SIDBI and the NABARD, the operating profits of all the AIFIs declined, indicating loss of efficiency in the use of working capital. VI.56 The EXIM Bank’s average RoA, which was barely positive last year, turned negative this year. However, all the AIFIs posted higher CRARs than the stipulated norm of 9 per cent (Chart VI.30). 3.6 Soundness Indicators VI.57 The total amount of the AIFIs’ net NPAs as well as their net NPA ratio declined during 2017-18 as both EXIM Bank and SIDBI reported a decline (Chart VI.31). The sharp decline in net NPA of EXIM bank was partly reflective of higher provisioning. | Table VI.18: AIFIs’ Select Financial Parameters | | Institution | Interest Income/ Average Working Funds
(per cent) | Non-interest Income/ Average Working Funds
(per cent) | Operating Profit/ Average Working Funds
(per cent) | Net Profit per Employee
(₹ million) | | 2017 | 2018 | 2017 | 2018 | 2017 | 2018 | 2017 | 2018 | | 1 | 2 | 3 | 4 | 5 | 6 | 7 | 8 | 9 | | EXIM | 7.3 | 7.2 | 0.7 | 0.5 | 2.1 | 1.7 | 1.2 | -86.0 | | NABARD | 6.8 | 6.5 | 0.1 | 0.1 | 1.2 | 1.2 | 6.0 | 7.4 | | NHB | 7.4 | 7.2 | 0.4 | 0.1 | 2.6 | 2.1 | 7.2 | 6.3 | | SIDBI | 7.6 | 6.9 | 0.4 | 0.5 | 2.2 | 2.3 | 9.6 | 1.3 | | Source: SIDBI, NABARD, NHB and EXIM Bank. | VI.58 The NPAs of AIFIs experienced aging, with sub-standard assets moving to the doubtful assets category in 2017-18. This was mainly evident in the case of EXIM Bank—which accounted for 94.5 per cent of the doubtful assets of all AIFIs taken together as at end-March 2018 (Chart VI.32). 4. Primary Dealers VI.59 As on March 31, 2018, there were 21 primary dealers (PDs) – 14 operating as departments of banks and 7 standalone PDs registered as NBFCs under Section 45 IA of the RBI Act, 1934. 4.1 Operations and Performance of PDs VI.60 The PDs have mandatory obligations to participate as underwriters in auctions of government dated securities. They are also mandated to achieve a minimum success ratio (bids accepted as a proportion to bidding commitments) of 40 per cent in primary auctions of treasury bills (T-bills) and cash management bills (CMBs), assessed on a half-yearly basis. VI.61 With respect to auctions of T-bills and CMBs, all PDs achieved the stipulated minimum success ratio of 40 per cent. Outperforming their minimum prescribed performance threshold in 2017-18, the PDs achieved a share of 66.5 per cent in total issuance of T-Bills / CMBs during the year, though it was lower than 74.4 per cent in the previous year. In H1:2018-19, the PDs achieved a share of 72.1 per cent in total issuance of T-Bills/CMBs. VI.62 During 2017-18, the government issued dated securities with face value of ₹5,880 billion through auctions, marginally higher than ₹5,820 billion during the previous year. PDs’ share of allotment in the primary issuance of dated securities rose during 2017-18 to 53.7 per cent compared to 47.5 per cent in 2016-17. However, against a total issuance of ₹2,760 billion during H1:2018-19, allotment to PDs stood at 46.9 per cent as against 49.3 per cent during H1:2017- 18 (Table VI.19). VI.63 There was partial devolvement on three instances amounting to ₹103 billion during 2017-18 as against four instances amounting to ₹53 billion in 2016-17. Furthermore, there was devolvement on four instances during H1:2018-19, amounting to ₹80 billion. The underwriting commission paid to PDs increased significantly to ₹613.1 million in 2017-18 as compared with ₹356.6 million in the previous year due to the higher possibility of devolvement. Consequently, the average rate of underwriting commission increased in 2017-18 vis-a-vis 2016-17. In H1: 2018-19, underwriting commission paid to PDs amounted to ₹876.3 million (Chart VI.33). | Table VI.19: Performance of PDs in the Primary Market | | (Amount in ₹ billion) | | Items | 2016-17 | 2017-18 | H1:2018-19 | | 1 | 2 | 3 | 4 | | Treasury Bills and CMBs | | | | | (a) Bidding Commitment | 8,340 | 10,136 | 6039 | | (b) Actual Bids Submitted | 32,365 | 49,352 | 19,650 | | (c) Bid to Cover Ratio | 3.9 | 4.9 | 3.3 | | (d) Bids Accepted | 4,946 | 5,772 | 3,708 | | (e) Success Ratio (d)/(a) (in per cent) | 59.3 | 56.9 | 61.4 | | Central Government Dated Securities | | | | | (f) Notified Amount | 5,820 | 5,880 | 2,760 | | (g) Actual Bids Submitted | 12,573 | 13,965 | 5,891 | | (h) Bid to Cover Ratio | 2.2 | 2.4 | 2.1 | | (i) Bids of PDs Accepted | 2,763 | 3,157 | 1,294 | | (j) Share of PDs (i)/(f) (in per cent) | 47.5 | 53.7 | 46.9 | | Source: Returns filed by PDs. |
VI.64 In the secondary market, all PDs individually achieved the required minimum annual total turnover ratio target in outright and repo transactions for dated G-secs and T-bills. For the period H1:2018-19 as well, the required minimum annual total turnover ratio target was achieved by all PDs individually. 4.2 Performance of Standalone PDs VI.65 The secondary market turnover of standalone primary dealers (SPDs) decreased on a year-on-year basis in the outright segment while it increased marginally in the repo segment during 2017-18, reflecting underlying slack in the market. However, the SPDs’ share in outright, repo and total market turnover increased marginally during the year. For the period H1:2018-19, the share of SPDs in the secondary market in the outright and repo segment was 31.7 per cent and 33.9 per cent, respectively. Total market share across both segments was 33.0 per cent for the period (Table VI.20). | Table VI.20: Performance of SPDs in the G-secs Secondary Market | | (Amount in ₹ billion) | | Items | 2016-17 | 2017-18 | H1:2018-19 | | 1 | 2 | 3 | 4 | | Outright | | | | | Turnover of SPDs | 52,365 | 37,343 | 13,632 | | Market Turnover | 168,741 | 113,999 | 43,045 | | Share of SPDs (per cent) | 31.0 | 33.0 | 32.0 | | Repo | | | | | Turnover of SPDs | 36,586 | 40,454 | 22,874 | | Market Turnover | 118,350 | 127,803 | 67,499 | | Share of SPDs (per cent) | 30.9 | 32.0 | 34.0 | | Total (Outright + Repo) | | | | | Turnover of SPDs | 88,951 | 77,797 | 36,507 | | Market Turnover | 287,091 | 241,802 | 110,544 | | Share of SPDs (per cent) | 31.0 | 32.0 | 33.0 | Notes: 1. Total turnover under outright is total of buy and sell.
2. Total turnover for standalone PDs for outright and repo trades includes both sides quantity that is, buy + sell.
3. In case of repo, only first leg is considered for SPDs’ turnover.
4. Total market turnover includes standalone PDs’ turnover for both outright and repo volume.
Source: Clearing Corporation of India Limited. | 4.3 Sources and Application of SPDs’ Funds VI.66 Funds mobilised by SPDs through borrowings rose more steeply by 63.6 per cent during 2017-18 compared to 2016-17. The overall increase in borrowing compensated for the reduction in capital as well as the subdued growth in reserves and surplus due to dividend distribution and buy-back of equity shares. Hence, the share of borrowings increased from 83.7 per cent in 2016-17 to 89.1 per cent in 2017-18. For the period H1:2018-19 also, borrowings continued to remain the major source of funds amounting to 90 per cent of the total funding. Secured loans was the major component of total borrowings during the period (Table VI.21). 4.4 Financial Performance of SPDs VI.67 SPDs’ profits after tax (PAT) deteriorated significantly in 2017-18 on account of the sharp decline in trading profit in an environment of heightened market uncertainty. All seven SPDs posted substantially lower profits during 2017-18 than in the previous year (Appendix Table VI.7). Hence, their aggregate income declined by 27.6 per cent while their expenditure posted an increase of 8.3 per cent due to increased interest expenses. This resulted in a decline of net profits by 75.7 per cent. During H1:2018-19, PAT was negative (Table VI.22). | Table VI.21: Sources and Applications of SPDs’ Funds | | (Amount in ₹ billion) | | Items | 2016-17 | 2017-18 | H1:2018-19 | Percentage Variation 2017-18 over 2016-17 | | 1 | 2 | 3 | 4 | 5 | | Sources of Funds | 312 | 479 | 512 | 53.4 | | 1. Capital | 15 | 14 | 15 | -3.5 | | 2. Reserves and Surplus | 36 | 37 | 35 | 2.0 | | 3. Loans (a+b) | 261 | 427 | 462 | 63.6 | | (a) Secured | 154 | 316 | 365 | 105.1 | | (b) Unsecured | 107 | 112 | 97 | 4.4 | | Application of Funds | 312 | 479 | 512 | 53.4 | | 1. Fixed Assets | 0.4 | 0.3 | 0.3 | -21.8 | | 2. HTM Investments (a+b) | 15 | 21 | 72 | 39.9 | | (a) Government Securities | 15 | 21 | 63 | 39.9 | | (b) Others | 0.02 | 0.07 | 9.0 | 262.5 | | 3. Current Assets | 318 | 468 | 462 | 47.3 | | 4. Loans and Advances | 10 | 8 | 17 | -15.2 | | 5. Current Liabilities | -31 | 19 | 40 | - | | 6. Deferred Tax | -0.31 | -0.07 | 0.3 | - | | 7. Others | -0.06 | -0.02 | 0.1 | - | Note: Percentage variation could be slightly different as absolute numbers have been rounded off to ₹ billion.
Source: Returns submitted by PDs. | VI.68 Commensurate with the decrease in PAT, SPDs’ return on net worth also fell in 2017-18 as compared to 2016-17. Furthermore, their cost to income ratios worsened during the year signifying an erosion in operational efficiency (Table VI.23). VI.69 The combined CRAR for all SPDs dipped marginally in 2017-18 vis-à-vis 2016-17, though it remained comfortably above the regulatory stipulation of 15 per cent. Their comfortable capital buffer position continued in H1:2018-19 (Chart VI.34) (Appendix table VI.8). | Table VI.22: Financial Performance of SPDs | | (Amount in ₹ billion) | | Items | 2016-17 | 2017-18 | H1:2018- 19 | Variation 2017-18 over 2016-17 | | Amount | Per cent | | 1 | 2 | 3 | 4 | 5 | 6 | | A. Income (i to iii) | 42 | 30 | 15 | -12 | -27.6 | | (i) Interest and Discount | 27 | 30 | 19 | 3 | 9.9 | | (ii) Trading Profits | 14 | -0.02 | -4 | -14 | - | | (iii) Other Income | 1 | 1 | 0 | 0 | - | | B. Expenses (i to ii) | 24 | 26 | 16 | 2 | 8.3 | | (i) Interest | 21 | 23 | 15 | 2 | 9.8 | | (ii) Other Expenses including Establishment and Administrative Costs | 3 | 3 | 1 | 0 | - | | C. Profit Before Tax | 18 | 5 | -1 | -13 | -74.9 | | D. Profit After Tax | 12 | 3 | -1 | -9 | -75.7 | | Source: Returns submitted by PDs. |
| Table VI.23: SPDs’ Financial Indicators | | (Amount in ₹ billion) | | Indicators | 2016-17 | 2017-18 | H1:2018-19 | | 1 | 2 | 3 | 4 | | (i) Net Profit | 12 | 3 | -1 | | (ii) Average Assets | 444 | 482 | 541 | | (iii) Return on Average Assets (Per cent) | 2.6 | 0.6 | -0.2 | | (iv) Return on Net Worth (Per cent) | 22.8 | 5.8 | -2.2 | | (v) Cost to Income Ratio (Per cent) | 16.3 | 37.7 | * | Note: *: Negative income reported by PDs.
Source: Returns submitted by PDs. | VI.70 During 2017-18, PDs achieved the minimum success ratio prescribed for them in primary auctions of T-bills and CMBs as well as in outright and repo transactions in the secondary market. The average underwriting commission paid to PDs during the year also increased due to an increase in devolvement. The net profits of SPDs, especially their trading profits declined considerably in 2017-18 due to the prevalence of market uncertainties. However, they have a comfortable capital position. 5. Overall Assessment VI.71 The NBFC sector, with a size of around 15 per cent of SCBs’ combined balance sheet, has been growing robustly in recent years, providing an alternative source of funds to the commercial sector in the face of slowing bank credit. The financial performance of NBFCs, including profitability, asset quality and capital adequacy, improved during 2017-18 as they weathered the transient effects of demonetisation and GST implementation. The move to allow NBFCs-ND-SI to co-originate priority sector loans (PSL) with banks is expected to generate synergy arising from the combination of low-cost funds from banks and lower cost of operations of NBFCs relative to the latter. While in 2018-19, though concerns surrounding the sector due to debt defaults amidst temporary asset liability mismatches arose, the inherent strength of the sector, coupled with the Reserve Bank’s continuing vigil on the regulatory and supervisory front, will ensure that the growth of the sector is sustained and liquidity fears are allayed.
|