Global economic activity is slowing down while the pace of disinflation remains sluggish, provoking caution among monetary policy authorities. In India, domestic drivers – private consumption and gross fixed investment – were robust and net exports remained sequentially positive in their support to gross domestic product (GDP) growth in Q1:2024-25. The underperformance of agriculture was compensated for by a buoyant manufacturing sector and resilient services. Household consumption is poised to grow faster in Q2 as headline inflation eases, with a revival of rural demand already taking hold. Consumer price index (CPI) inflation came in below the Reserve Bank’s target for the second consecutive month in August, although in light of the recent experience, food price volatility remains a contingent risk. Introduction The theme score of the 1961 American film Come September was a rage across the world. It even inspired several Hindi and Tamil songs and films, so much so that the month of September became synonymous with music. But September is also the cruellest month for markets in the west from where, in the recent period, almost all global spillovers seem to be erupting. As people return from the summer vacation to begin trading again in a rejuvenated reach for returns, volatility heightens to a crescendo. Hedging against September seasonality soon costs more than it saves. This September is living up to its reputation with a flurry of actions by leading central banks – the European Central Bank (ECB) implemented its second rate cut of the year, followed by a 50 basis points (bps) cut by the United States (US) Federal Reserve, while the Bank of England and Bank of Japan diverged, maintaining status quo. Quickly recovering from a turbulent August 2 release of US non-farm payrolls data, which unleashed a bloodbath in markets worldwide as yen carry trades unwound, investors had regained poise, repositioning portfolios and re-building leverages. Once again, however, on a single data release on September 3 – the US Institute for Supply Management (ISM) manufacturing index – recessionary fears resurfaced, setting off a rout in US equity markets that quickly spread to Asia and Europe. Thus, as markets recalibrate their expectations of central banks pivoting from divergence to convergence, a Russian roulette seems to be playing out. Every incoming data dispels the gathering good feeling of a soft landing and sparks fears of a thudding end to disinflationary monetary policy pathways. Overall, however, markets have demonstrated substantial resilience in the face of high volatility. The speed of recovery has been remarkable, and magnitudes of exchange rate changes were not outsized when compared to past episodes. Trading remained orderly, enabled by liquidity conditions that accommodated large changes in margins in central counterparties. All around, indicators point increasingly to slowing global economic activity, more so on the eastern shores of the Atlantic, which vindicated the ECB’s September rate cut to secure a soft landing. In the US, the now famous remark – “The time has come for policy to adjust” – has built up expectations that the economy is gaining prominence in monetary policy discourse1. In China, even though consumer inflation has picked up modestly due to supply constraints related to extreme weather, weakening producer prices are fuelling concerns that deflationary forces are taking root. A rising number of manufacturing industries face lacklustre demand alongside a deep property market downturn now into its third year. As discussed in Section II, our world monitor assesses that global growth has lost some speed in the first half of 2024 relative to the preceding semester, and momentum has slackened further in the third quarter. Among more recent high frequency indicators of global economic activity, job growth is getting softer than initially anticipated as labour markets continue to slow down, unemployment rates are ticking up and wage growth is easing, although historically high immigration is providing some offset. Consumer confidence surveys show a deterioration in sentiment about jobs. Equity prices are still stretched but the crash in Nvidia’s stock in early September wiped out about US$ 300 billion in market value, hinting that the artificial intelligence (AI) overhype may be tapering off and expectations are catching up with reality. Overseas investors also aggressively withdrew from Asian tech stocks, although India seems to have bucked that sell-off supported by buying interest in the primary market. Short-term yields have fallen below longer-term ones in a reversal of the yield curve inversion and along with swap curves, they seem to suggest that monetary policy easing is due. Parched returns are drying up the venture capital ecosystem. Record volumes of corporate debt are being issued to head off the volatility triggered by worsening macroeconomic data, and to benefit from falling borrowing and refinancing costs. OPEC plus has decided to delay a planned output increase as crude prices slumped below US$ 70 per barrel briefly on September 10, but it still plans to revive 2.2 million barrels per day of idle supplies over the course of 2025. Meanwhile, non-OPEC supplies are rising faster, and as the International Energy Agency warns in its September 2024 report, global oil demand is slowing sharply – electric vehicles are already displacing 1.8 million barrels of oil every day – and this is fuelling the sell-off in oil markets. In metal markets, the copper-gold price ratio is closing on to 4 – a rising ratio indicates higher industrial demand and hence a positive growth outlook. Although upside pressures have likely been seen off, the pace of disinflation remains sluggish, provoking caution among monetary policy authorities about the pace of easing. In fact, the Governing Council of the ECB noted in its September meeting that inflation is expected to rise again in the latter part of this year, partly because previous sharp falls in energy prices will drop out of the annual rates. Hence, it is judged that inflation remains high as wages are still rising at an elevated pace. Expressing determination to ensure that inflation returns to its 2 per cent medium-term target in a timely manner, it decided to keep policy rates sufficiently restrictive for as long as necessary to achieve this aim. In the US, it is argued that the Fed’s modest success in disinflation is at risk because the US is moving from a regime of monetary dominance to fiscal dominance2. In fact, the US Treasury’s debt issuance strategy may be providing indirect interest rate cuts estimated at the equivalent of a one percentage point cut in the Federal Funds rate with 70 per cent of new debt raised through short-term bills. All in all, “the limits of our knowledge….demand humility and a questioning spirit focused on learning lessons from the past and applying them flexibly to our current challenges.”3 Defying gravity, global merchandise trade volume continued to recover in the third quarter of 2024, according to the latest World Trade Organization (WTO) Goods Trade Barometer, amidst rising geopolitical tensions, ongoing regional conflicts, shifting monetary policy in advanced economies (AEs) and weakening export orders. As Section II points out, barring the sub-par performance of electronics, other components of global trade such as automotive products, container shipping and air freight are all firmly above trend, but new export orders are turning down, and raw materials have declined – causes for concern going forward. According to the WTO, global trade growth is expected to pick up gradually over the next two years as lower inflation and rising incomes lift real wages and boost demand for goods, including imports. The volume of merchandise trade is expected to increase by 2.6 per cent in 2024 and 3.3 per cent in 2025. The outlook is also positive for commercial services trade and digitally delivered services. Asia will make the biggest contribution to trade growth. The outlook for 2025 is more positive, with all regions contributing to export and import growth, but risks to this forecast are substantial. In its 2024 World Trade Report, the WTO has argued that trade helps to widen the circle of global growth by being a key part of the solution to creating a more inclusive global economy. Yet, some economies and regions have failed to harness the growth-giving properties of trade either because they are not sufficiently integrated into the global economy or because they are limited to exporting low valued added or highly volatile commodities amidst challenges from high trade costs, weak institutional capacity, infrastructure deficits and some types of trade policies such as protective tariffs. For instance, it is increasingly believed that the era of mega deals is coming to an end on geopolitical considerations. The battle to secure critical metals and supremacy in semiconductor and green technologies is getting progressively disruptive. Against this backdrop, the WTO makes the case for promoting an open, rules-based and predictable multilateral system for expanding inclusiveness within economies and for facilitating catch-ups and income convergence across economies. Others argue, however, that deglobalisation is a myth that hides the real shifts4. This is evident in the renewed expansion of world trade since the start of 2024, after the post-pandemic rebound when supply chains declogged and consumers turned away from goods towards services. Among the real shifts is that export growth for emerging market economies (EMEs) has far outstripped that of AEs even before the pandemic, suggesting that globalisation is, in fact, continuing. Another shift is in the ratio of global trade in goods to industrial production, which has been declining and being read as deglobalisation. This is, however, predominantly a China phenomenon. This ratio, when calculated by excluding China, has been rising and has accelerated through the post-pandemic rebound. It is currently above its long-term trend. Thus, what could be happening are geographical shifts in the pattern of trade rather than deglobalisation. Yet another factor is the containerisation of cargo movement that has ushered in a new era of global transportation. Although constituting only about 17 per cent of global maritime trade volume, this fast growing segment accounts for almost two-thirds of global trade by value, led by Asia. In another gravity challenging development described as ‘the rise of the rest’, EMEs are building up a growth rate lead over AEs to levels not seen in 15 years. Projections suggest that the proportion of EMEs other than China in which per capita GDP is likely to rise faster than the US is on course to surge from 48 per cent over the past five years to 88 per cent in the next five years5. These EMEs have far lower budget and current account deficits than the US, leaving them with greater capacity to invest and drive future growth. In the coming decade, their exports are likely to be particularly strong for green technologies and raw materials required to build them, like lithium and copper that are supplied mainly by them. The AI boom is already boosting exports of chips from existing suppliers such as Taiwan and Korea, and investments are increasing in countries like India, Malaysia and Mexico. Corporate earnings are growing at an annual rate of 19 per cent in these EMEs as against 10 per cent in the US and they are also ahead in earnings forecasts in the April-June 2024 quarter. Consequently, profit margins have also improved. Their stock markets are catching the scent of this revival and in a few of them, this is powered by a strong and rapidly expanding base of domestic investors. In the recent period, the US dollar has weakened; historically, this has led to greater capital flows to emerging markets. Investors are not likely to lump EMEs under the broad brush of a single asset class – they will look for a select group of stars that are able to draw strength from favourable trends forming in global trade, the US dollar, economic reforms and political change. “They emerge from obscurity, and the deeper the shadows from which they spring, the more drama surrounds their comeback.”6 Turning to domestic developments and the evolution of risks, more needs to be read into the slowing of India’s GDP in Q1:2024-25 than just disappointment. As pointed out in Section III, domestic drivers – private consumption and gross fixed investment – were robust and net exports remained sequentially positive in their support to GDP. The seasonally adjusted momentum of Q1 GDP was strong. Gross value added (GVA) growth actually rose sequentially in Q1, but the increase in subsidies – 3.6 per cent by the Union government and 26 per cent by the states – offset the gains from showing up in GDP growth. Household consumption is poised to grow faster in Q2 as headline inflation eases, with a revival of rural demand already taking hold. The demand for fast moving consumer goods (FMCG) is also accelerating as companies target older customers with healthy lifestyle products in response to rising longevity and affluence and younger ones with premiumisation. Yet another consumption booster is the ramping up of hiring by e-commerce majors ahead of the festival season, not just in the metros but in tier 2 and 3 cities as well. Logistics hiring is also rising to support increased transportation, warehousing and delivery activities. According to TeamLeaseServices, about 62 per cent of companies across telecom, internet service providers and allied industries intend to expand their workforce in this year. As regards net exports, the widening trade deficit and a spurt in overseas travel by Indians is likely to swing the current account balance from a small surplus in January-March 2024 to a deficit of 1-1.2 per cent of GDP in the first half of 2024-25. Capital flows in the form of portfolio debt flows, net FDI and non-resident deposits are providing comfortable financing. Merger and acquisitions deals have been on the decline in the Asia-Pacific region in 2024, but India has emerged as a bright spot with an increase in volumes. On the supply side, agriculture suffered in Q1:2024-25 as India experienced the highest number of heatwave days in the summer of 2024, surpassing the previous high in 2010. Hence, the policy-driven prioritisation of agriculture sector development assumes significance, especially the focus on climate resilience, productivity, innovation and value added exports. Only about 25 per cent of agricultural exports are processed as against the global average of 50 per cent. Attracting large, globally competitive firms to produce in, and export from India can grow strong Indian brands, increase global market presence, create employment and boost farmers’ income. Alongside, interventions such as the AgriStack – a farmer-centric digital infrastructure – will create comprehensive and authenticated databases on farmer demographics, land holdings, crop sowing, livestock ownership and details of schemes and benefits. The Krishi Decision Support System will integrate information on crops, soil, weather and water resources to provide a comprehensive geospatial system. The underperformance of agriculture in Q1 was compensated for by a buoyant manufacturing sector and resilient services. In fact, sustained growth in operating profits and deceleration in interest expenses enabled the corporate interest coverage ratio to touch a 9-quarter high, which bodes well for the year ahead. There is also evidence of a drastic shortening of the working capital cycle – the time a company takes to convert current assets like inventory into sales. The increase in online payments has contributed significantly to this better use of working capital, supported by increasing formalisation. This suggests that working capital could play a larger role in profitability going forward. Financial markets are undergoing shifts. In the primary equity market, there is a surge of interest in small and medium enterprises (SMEs) initial public offerings (IPOs), including from domestic mutual funds, with massive oversubscriptions. 54 per cent of IPO shares allotted to investors were sold within a week of listing.7 September is set to be the busiest month for IPOs – mainboard and SME – in 14 years, with over 28 companies entering the market so far. A growing number of listed companies are turning to qualified institutional placements for raising capital, estimated at around ₹60,000 crore in the first eight months of 2024. With intermittent corrections on global cues, benchmark indices in the secondary market have moved up, and the outlook remains bullish. Global funds have been investing heavily in the Indian debt market for the fifth month in a row since May 2024. On the other hand, corporate debt issuances remained low during the financial year so far despite easing yields as issuers awaited the US rate cut. In the credit market, with deposit mobilisation becoming a challenge, banks continue to rely heavily on certificates of deposit to meet funding needs so that lagging deposit growth does not constrain credit. Banks are also offering higher interest rates on deposits, with more than two-thirds of term deposits earning 7 per cent and above. The gap between credit and deposit growth is, however, beginning to narrow. Non-banking financial companies are increasingly turning to offshore bonds. Microfinance institutions are facing some asset quality issues, warranting slowing down the pace of loan growth. As large risk capital investors tread cautiously, the early stage investment landscape is seeing an increasing number of micro venture capital firms and founder-led funds. Despite guardrails and concerns about interconnectedness with the regulated financial system, the footprint of private credit – non-bank lending in high-yielding and illiquid debt-like instruments - is gradually expanding to cater to customised requirements of borrowers that are underserved by traditional sources of capital. Rough estimates place private credit assets under management at around US$ 15 billion. Fintech lenders, which are reported to have captured over 52 per cent of the market share of personal loans, are increasingly turning to private credit to raise funds and diversify borrowing sources. The resilience of private credit in a credit downturn, however, remains untested. Headline CPI inflation came in below the Reserve Bank’s target for the second consecutive month in its August reading. This is a positive development, especially as the index has remained flat between July and August. Some vegetable price shocks have begun to reverse, and if this continues and broadens, the persistence that characterised food inflation developments in the first quarter of 2024-25 may be behind us. An unfavourable base effect may haunt the September number. The outlook for international crude prices has turned benign and may be sustained, given developments relating to OPEC plus alluded to earlier and weak demand. The prospects of headline inflation averaging 4.5 per cent in the second half of 2024-25, as set out in the August 2024 resolution of the monetary policy committee, have improved. Nonetheless, in light of the recent experience, food price volatility remains a contingent risk. Set against this backdrop, the remainder of the article is structured into four sections. Section II covers the rapidly evolving developments in the global economy. An assessment of domestic macroeconomic conditions is set out in Section III. Section IV encapsulates financial conditions in India, while the last Section sets out concluding remarks. II. Global Setting The global growth outlook is rendered uncertain in an environment of cooling labour markets, ongoing geopolitical tensions and decline in commodity prices. Growing expectations of monetary policy easing by major central banks, however, continue to instill confidence about a soft landing. Our model-based nowcast points towards a tapering of global growth momentum during Q3:2024 (Chart II.1). The global supply chain pressures index (GSCPI) increased in August 2024, rising above its historical average for the first time since November 2023 (Chart II.2a). Geopolitical risks remained high due to continued tensions in the Middle East, albeit with a sequential moderation in August 2024 (Chart II.2b). Supply disruptions have kept container shipping costs elevated, although they recorded some moderation during August-September 2024 from the peak levels recorded in July (Chart II.2c). Consumer sentiment was divergent across geographies, increasing in the US for the first time in five months while it worsened in the Euro area (Chart II.3a). Financial conditions eased in both AEs and EMEs (Chart II.3b).
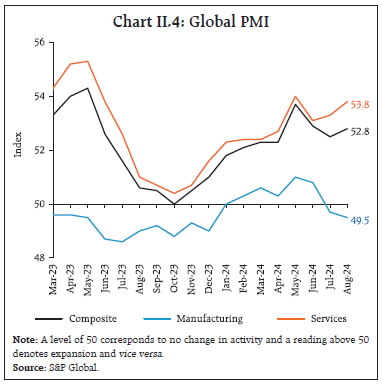
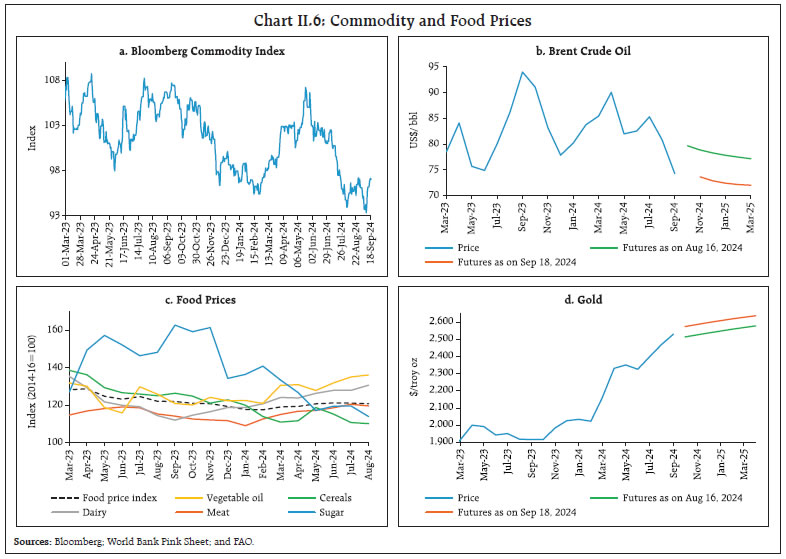
The global composite purchasing managers’ index (PMI) increased marginally in August, with a robust expansion in services activity offset by weakness in manufacturing (Chart II.4). While the services PMI was driven by steepest gains in new business since June 2023, the manufacturing PMI fell to an eight-month low in August due to contraction in new orders and output growth. The composite PMI for export orders declined at a faster rate in August (Chart II.5). Although new exports expanded at a faster pace in case of services, manufacturing export orders declined markedly in August 2024 leading to a contraction in overall exports. Global commodity prices softened in August 2024. The Bloomberg commodity index declined by 0.4 per cent (m-o-m) in August (Chart II.6a). Brent crude oil prices declined by 1.9 per cent (m-o-m) in August as weak demand more than offset the supply disruption caused by the oil blockade in Libya (Chart II.6b). Oil prices continued to decline in early September, dipping below US$ 70 for the first time since December 2021 as demand sentiments continued to weaken. The Food and Agriculture Organization’s (FAO’s) food price index registered a marginal decline in August 2024 as decreases in the price indices for sugar, meat and cereals outweighed increases in vegetable oils and dairy products (Chart II.6c). Gold prices, however, increased by 4.3 per cent in August (m-o-m), backed by expectations about rate cuts and safe haven demand amidst geopolitical tensions (Chart II.6d). 

 Inflation declined across major economies, although at a slow and uneven pace. In the US, CPI inflation moderated to 2.5 per cent (y-o-y) in August from 2.9 per cent in July. US headline personal consumption expenditure (PCE) inflation, however, remained steady at 2.5 per cent in July. As per flash estimates, Euro area inflation decelerated to 2.2 per cent in August from 2.6 per cent in July. Headline inflation in the UK remained steady at 2.2 per cent in August while inflation in Japan (CPI excluding fresh food) edged up to 2.8 per cent (Chart II.7a). Among EMEs, inflation increased in China, softened in Brazil and South Africa, and remained steady in Russia in August (Chart II.7b). Core and services inflation trended downwards in major AEs although it remained higher than the headline (Chart II.7c and 7d). The decline in global inflationary pressures is also captured by the PMI for selling prices (Chart II.8). Globally, prices charged for goods and services rose at the slowest rate in nearly four years in August 2024.
Global equity markets rebounded from the heavy selling in the first week of August as expectations of rate cuts by major central banks outweighed concerns over slowing economic activity. Accordingly, the Morgan Stanley Capital International (MSCI) world index recorded a 2.4 per cent increase m-o-m in August (Chart II.9a). After a downturn in the first week of September driven by weak labour market data in the US, equity markets continued their rally over the rest of September following the release of better than expected US CPI data. US government securities yields on 10-year and 2-year bonds softened by 13 bps and 32 bps, respectively, in August. The yield curve inversion (negative spread between 10-year and 2-year yields) reverted in early September as financial markets factored in expectations of rate cuts (Chart II.9b). In the currency markets, the US dollar weakened by 2.3 per cent in August, despite some strengthening in the last week. Concomitantly, the MSCI currency index for EMEs increased by 2.0 per cent in August due to capital inflows (Chart II.9c and II.9d).
There was a marked decline in US stock market volatility index (VIX) in the later part of August following the sharp increase over unwinding of Yen carry trade, although it increased again in the first week of September (Chart II.10). Among AE central banks, the US Fed cut its target range by 50 bps to 4.75-5.0 per cent in September, marking its first cut in four years. Both the ECB and the Bank of Canada lowered policy rates by 25 bps while BoE and Japan held policy rates unchanged in their September meetings (Chart II.11a). New Zealand cut its benchmark rate by 25 bps in its August meeting, marking the first cut since March 2020 while Sweden and the Czech Republic reduced policy rates in August. On the other hand, other AE central banks such as Israel, Iceland, Norway and South Korea maintained status quo in their policy rates. Among EME central banks, Chile, Peru and Indonesia cut their key rates by 25 bps, whereas Brazil and Russia hiked their policy rates by 25 bps and by 100 bps, respectively, in September. Philippines, Mexico and Romania reduced their key rates by 25 bps during their August meetings. (Chart II.11b). III. Domestic Developments The Indian economy experienced headwinds from supply chain pressures, which rose above historical average levels (Chart III.1a). Our economic activity index (EAI)8, based on a range of high frequency indicators, projects GDP growth at 7.0 per cent in Q2:2024-25 on the back of a ticking up of momentum relative to the preceding quarter (Charts III.1b and III.1c). | Table III.1: Baseline Projections | | (y-o-y in per cent) | | Periods | GDP Growth | CPI Inflation | | Q3: 2024-25 | 8.4 | 4.4 | | Q4: 2024-25 | 6.6 | 4.6 | | FY 2024-25 | 7.3 | 4.6 | | Q1: 2025-26 | 8.0 | 4.1 | | Q2: 2025-26 | 6.4 | 3.9 | | Q3: 2025-26 | 6.4 | 3.8 | | Q4: 2025-26 | 6.2 | 3.7 | | FY 2025-26 | 6.7 | 3.9 | | Source: RBI staff estimates. | The in-house dynamic stochastic general equilibrium (DSGE) model projects GDP growth at 7.3 per cent (y-o-y) and headline CPI inflation at 4.6 per cent (y-o-y) during 2024-25 (Table III.1 and Chart III.2). During 2025-26, GDP is projected to grow at 6.7 per cent, with headline CPI inflation softening to 3.9 per cent.
Aggregate Demand Real GDP growth softened to 6.7 per cent in Q1:2024-25 in relation to 8.2 per cent in Q1:2023-24 (7.8 per cent in Q4:2023-24). The deceleration in growth is reflective of a contraction in government final consumption expenditure (GFCE) by 0.2 per cent in Q1:2024-25 ahead of the general elections (Chart III.3). Private final consumption expenditure (PFCE) growth accelerated to a seven-quarter high of 7.4 per cent in Q1:2024-25 due to resilient urban demand and improving rural demand conditions. Growth in gross fixed capital formation (GFCF) at 7.5 per cent in Q1:2024-25 pushed the share of GFCF in GDP to 34.8 per cent – the highest since Q2:2012-13. On the external front, exports expanded by 8.7 per cent in Q1:2024-25, while imports registered a relatively modest growth of 4.4 per cent. Accordingly, net exports contributed positively by 0.7 percentage points to GDP growth in Q1:2024-25.  High-frequency indicators show that demand remained firm in August 2024, with e-way bills reaching a record high, though the growth rate slowed compared to the previous month (Chart III.4a). Toll collections, however, moderated to 6.8 per cent (y-o-y) in August from 9.4 per cent (y-o-y) in the previous month (Chart III.4b). Automobile sales recorded a growth of 7.5 per cent (y-o-y) in August 2024, supported by two-wheelers (Chart III.5a). Domestic tractor sales contracted by 5.8 per cent (y-o-y) in August after registering three consecutive months of expansion (Chart III.5b). After recording double digit growth in July, vehicle registrations moderated in August due to contraction in the transport vehicles segment (Chart III.5c). Average daily petroleum consumption contracted by 2.6 per cent (y-o-y) in August 2024, driven by a decline in diesel consumption (Chart III.5d). 
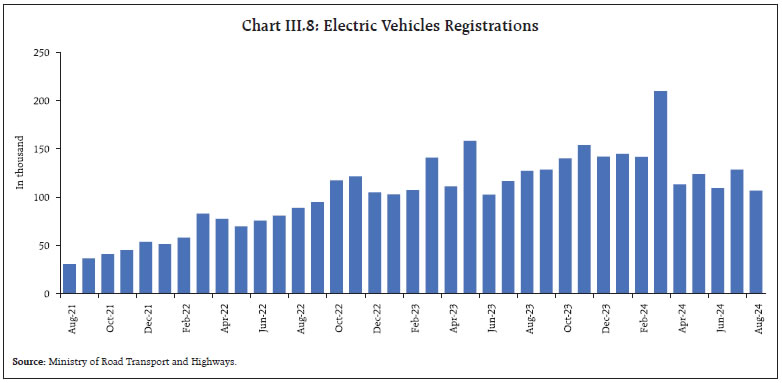
 In order to meet India’s updated nationally determined contributions (NDC) goals9 by 2030, the investment required in manufacturing capacity for solar energy, electrolysers, wind and batteries, and green hydrogen is estimated at ₹30 lakh crore over the period 2024-2030. Green bonds in domestic and international capital markets by both private and public sector entities worth US$ 3.43 billion have been issued so far, with the Government of India’s sovereign green bonds (SGrBs) being the largest contributor (Chart III.6). The Reserve Bank has included bank loans up to a limit of ₹30 crore for purposes like solar-based power generators, biomass-based power generators, windmills, micro-hydel plants, and renewable energy-based public utilities, under priority sector lending. As of March 31, 2024 scheduled commercial banks (SCBs’) credit limits for the non-conventional energy sector stood at ₹1.19 lakh crore with a total outstanding of ₹75,251 crore (Chart III.7). Further, the loan portfolio of Indian Renewable Energy Development Agency Ltd. (IREDA), which provides financial assistance for renewable energy sources, reached ₹63,207 crores in 2024 so far upto June, recording a y-o-y growth of 33.9 per cent. Going forward, IREDA plans to expand green financing to ₹1.36 lakh crore by the financial year 2030. 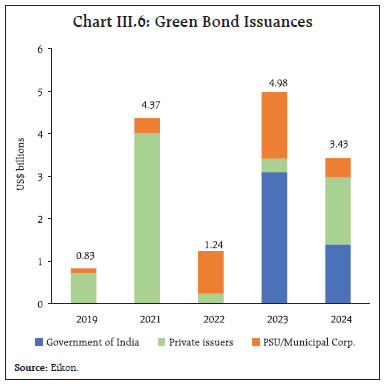 Electric vehicles adoption in India has been gathering pace over the recent years (Chart III.8). To expedite this process further, the union cabinet approved the Electric Drive Revolution in Innovative Vehicle Enhancement (PM E-DRIVE) scheme10 on September 11, 2024 with an outlay of ₹10,900 crore. 
 As per the latest Periodic Labour Force Survey (PLFS) data11, the Labour Force Participation Rate (LFPR) and the Worker Population Ratio (WPR) in urban India declined marginally during April-June 2024 in relation to the previous quarter (January - March 2024). The unemployment rate in urban areas decreased to 6.6 per cent during April-June 2024 from 6.7 per cent in the previous quarter (Chart III.9). There was an increase in the share of regular salaried and casual labour in total employment, while that of self-employed workers declined in April-June 2024 from the previous quarter (Chart III.10a). Overall, employment in the tertiary sector contributed 62.4 per cent of total urban employment during April-June 2024 (Chart III.10b). 
 As per the PMI employment indices, organised manufacturing employment recorded its sixth consecutive month of expansion in August 2024, with robust growth in the intermediate goods segment. Job creation in both manufacturing and services sectors continued to expand, albeit at a moderate pace (Chart III.11). Households’ demand for work under the Mahatma Gandhi National Rural Employment Guarantee Act (MGNREGA) contracted for the third month in a row in August, reflecting higher demand for agricultural labour during the kharif sowing season. On a y-o-y basis, it recorded a decline for six consecutive months, indicating increased availability of jobs in rural areas on farms and in construction (Chart III.12).
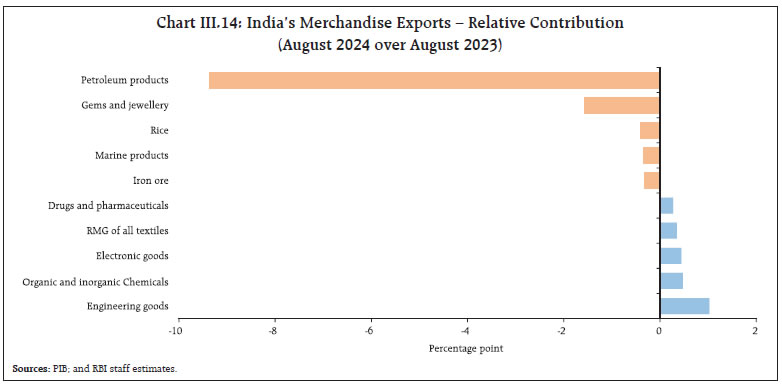
India’s merchandise exports at US$ 34.7 billion contracted by 9.3 per cent (y-o-y) in August 2024 mainly due to an unfavourable base effect which more than offset the positive momentum (Chart III.13). Exports of 11 out of 30 major commodities (accounting for 37.8 per cent of the export basket) contracted on a y-o-y basis in August. Petroleum products, gems and jewellery, rice, marine products, and iron ore contributed to the contraction, while engineering goods, organic and inorganic chemicals, electronic goods, ready-made garments (RMG), and drugs and pharmaceuticals supported export growth in the month (Chart III.14). During April-August 2024, however, India’s merchandise exports expanded by 1.1 per cent to US$ 178.7 billion, primarily led by electronic goods, engineering goods, drugs and pharmaceuticals, RMG of all textiles, and organic and inorganic chemicals, while petroleum products, gems and jewellery, rice, marine products, and iron ore dragged exports down. 
 Exports to 12 out of 20 major destinations contracted in August 2024 whereas during April-August 2024, 11 out of 20 major destinations recorded an expansion in exports. Notably, India’s exports to top 3 destinations, viz., the US, the UAE, and the Netherlands increased during April-August 2024. Merchandise imports at US$ 64.4 billion expanded by 3.3 per cent (y-o-y) in August, aided by a positive momentum (Chart III.15). Out of 30 major commodities, 18 commodities (accounting for 54.1 per cent of the import basket) registered growth on a y-o-y basis.
Gold, silver, electronic goods, machinery, and chemicals contributed positively, while POL, chemical materials and products, pearls, precious and semi-precious stones, dyeing, tanning and colouring materials, and vegetable oil contributed negatively to overall import growth (Chart III.16). During April-August 2024, India’s merchandise imports increased by 7.1 per cent (y-o-y) to US$ 295.3 billion, led by petroleum, crude and products, gold, electronic goods, transport equipment, and silver, while pearls, precious and semi-precious stones, chemical material and products, coal, coke and briquettes, fertilisers, and dyeing, tanning and colouring materials contributed negatively. Imports from 9 out of 20 source countries expanded in August 2024 on a y-o-y basis. Imports from 14 out of 20 source countries increased during April-August 2024 with imports from top 3 source countries, viz., China, Russia, and the UAE, recording an expansion. The merchandise trade deficit rose to a 10-month high at US$ 29.6 billion in August 2024. The share of POL in the total merchandise trade deficit declined to 17.1 per cent in August 2024 from 28.1 per cent a year ago (Chart III.17). During April-August 2024, India’s merchandise trade deficit widened to US$ 116.6 billion from US$ 99.2 billion a year ago. Petroleum products were the largest source of the deficit, followed by electronic goods (Chart III.18).
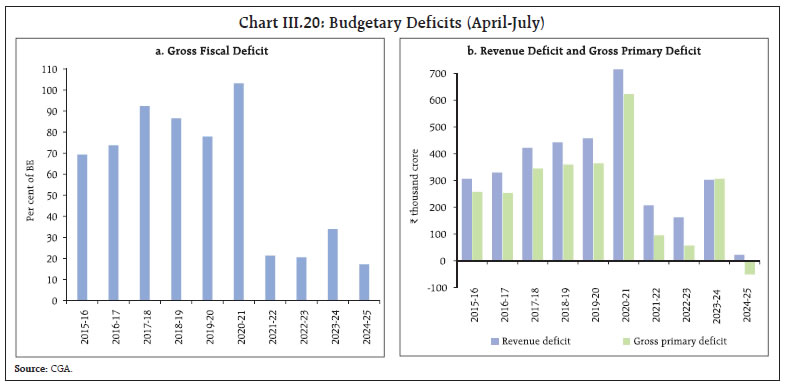
Services exports at US$ 30.6 billion grew by 16.6 per cent (y-o-y) in July 2024 and services imports rose by 15.7 per cent (y-o-y) to US$ 15.9 billion (Chart III.19). Consequently, net services export earnings increased by 17.6 per cent (y-o-y) to US$ 14.7 billion during the month. In 2023, India was the seventh largest services exporter, with a share of 4.3 per cent in world services exports. All major key deficit indicators of the Union government, viz., the gross fiscal deficit (GFD), the revenue deficit (RD) and the primary deficit (PD) improved during April-July 2024 [both in absolute terms as well as per cent of budget estimates (BE)] relative to the corresponding period of the previous year (i.e., April-July 2023).12 During April-July 2024, the GFD has come down to 17.2 per cent of the BE, the lowest in more than a decade (Chart III.20a). Moreover, a primary account surplus was posted during April-July 2024 (Chart III.20b). This improvement in the financial position of the Union government during April-July 2024 occured on the back of growth in revenue receipts. On the other hand, the total expenditure of the Union government contracted by 5.8 per cent during April-July 2024 on a y-o-y basis, largely attributable to the model code of conduct imposed due to the general elections held in Q1:2024-25. 
 On the receipts side, gross tax revenue recorded a growth of 21.3 per cent during April-July 2024, with direct and indirect taxes registering an increase of 35.4 per cent and 7.6 per cent, respectively, on a y-o-y basis. Under direct taxes, income tax registered double digit growth rate of 53.4 per cent (y-o-y). Under indirect taxes, goods and services tax (GST) collections recorded a growth rate of 9.5 per cent (Chart III.21a). With the surplus transfer of ₹2.11 lakh crore from the Reserve Bank, non-tax revenue receipts recorded a y-o-y growth of 68.8 per cent during April-July 2024 over the corresponding period of the previous year (Chart III.21b). On the other hand, the non-debt capital receipts registered a contraction of 53.4 per cent during April-July 2024 on a y-o-y basis (including disinvestment). Overall, total receipts recorded a y-o-y growth of 32 per cent. 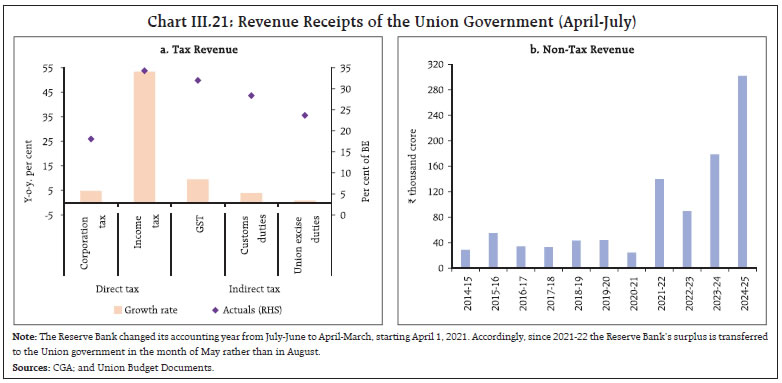
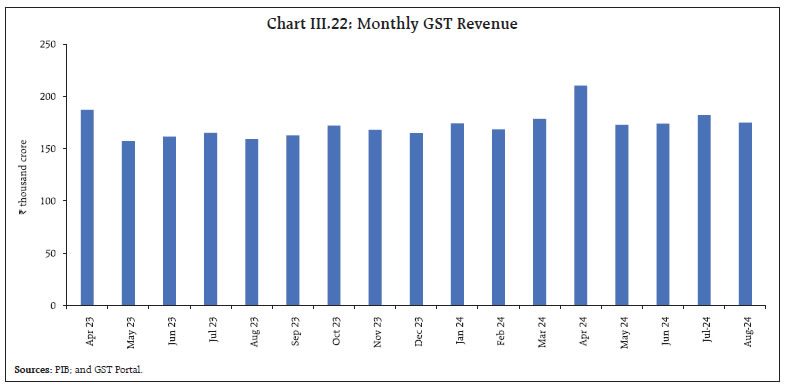 Gross GST collections (Centre plus States) for the month of August 2024 stood at ₹1.75 lakh crore, registering a growth of 10 per cent on a y-o-y basis (Chart III.22). After accounting for refunds, net GST collections stood at ₹1.51 lakh crore, growing at 6.5 per cent on a y-o-y basis. Accounts data for April-July 2024 indicate that States’ GFD declined by 13.2 per cent and their RD fell by 14.9 per cent (y-o-y). This consolidation was achieved through an increase in revenue receipts and contraction in capital expenditure (Chart III.23a). States’ revenue receipts increased marginally on account of growth in tax and non-tax revenues, even as grants from the Union Government contracted (Chart III.23b). Within States’ own tax revenues, growth in goods and services tax (SGST) moderated, while excise duties and sales tax/value added tax (VAT) were higher than a year ago. On the expenditure side, growth in revenue expenditure picked up, while capital expenditure declined during April-July 2024. Going forward, capital expenditure is expected to pick up owing to the Union government’s provision of special assistance of ₹ 1.5 lakh crore long term interest free loans. Aggregate Supply Aggregate supply – measured by gross value added (GVA) at basic prices – expanded by 6.8 per cent in Q1:2024-25 as against a growth of 8.3 per cent a year ago. Real GVA growth was propelled by the industrial sector and resilience in the services sector (Chart III.24). The growth in agriculture moderated to 2.0 per cent on a y-o-y basis in Q1:2024-25 as compared with a growth of 3.7 per cent a year ago, as rabi foodgrain production declined on account of lower water levels in major reservoirs and river basins. Within the industrial sector, manufacturing – the dominant component – recorded a strong growth of 7.0 per cent while activity in mining and quarrying increased on account of higher production of coal and natural gas. The services sector also remained buoyant, clocking a growth of 7.7 per cent in Q1:2024-25, which was broad-based across sub-sectors. The construction sector registered growth of 10.5 per cent, primarily due to a double digit growth in finished steel consumption. Growth in trade, hotels, transport, communication and services related to broadcasting moderated while growth in financial services remained robust, supported by steady profit margins of information technology (IT) companies and continued credit and deposit growth. Public administration, defence, and other services (PADO) recorded an impressive growth of 9.5 per cent in Q1:2024-25 driven by an upbeat growth in other services while public administration and defence – proxied by government revenue expenditure net of interest payment and subsidies – exhibited a contraction during the quarter. 
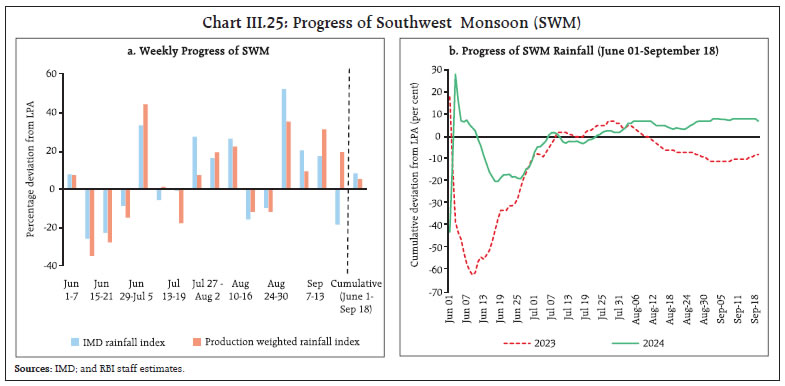 Agriculture growth prospects were boosted by the progress of southwest monsoon (SWM) rainfall. The cumulative SWM rainfall was 7 per cent above the LPA this year so far (June 1 to September 18), as against 8 per cent below the LPA a year ago (Chart III.25a). Cumulative rainfall consistently remained above the normal LPA since mid-July, unlike last year when it tapered off during the latter half of the SWM (Chart III.25b). The production weighted rainfall index (PRN) stood marginally lower at 106 per cent of LPA but it remained ‘above normal’ for all the major crops except for rice for which it was normal as on September 18, 2024. Also, all major crops recorded PRN higher than their levels in the corresponding period last year (Chart III.26). During the current SWM season so far, 19 out of the 36 meteorological sub-divisions recorded normal rainfall (Chart III.27a). The number of sub-divisions receiving excess/large excess rainfall increased to 13 in the current year from 4 a year ago, which is reflected in the higher spatial variation in rainfall across the country vis-à-vis last year (Chart III.27b). Deficient rainfall was mainly observed in states such as Arunachal Pradesh, Nagaland, Manipur, Bihar and Punjab.
Reservoir levels have been replenished to 87 per cent of capacity (as on September 19, 2024) as compared with 71 per cent in the corresponding period last year, which boosts rabi sowing prospects (Chart III.28). The live storage of 155 major reservoirs stood at 123 per cent of the level in the corresponding period of last year and 118 per cent of the last 10 years’ average. As per Indian Meteorological Department (IMD), monthly rainfall for September 2024 over the country as a whole is most likely to be above normal (Chart III.29). Further, it predicts that the neutral Indian Ocean Dipole (IOD) conditions are likely to continue until the end of monsoon season. Total area sown stood at 1096.6 lakh hectares (as on September 13, 2024), which is 2.2 per cent higher than last year and 1.7 per cent higher over the normal area as on date (Chart III.30). Except cotton, area under all major crops has increased over last year. Pulses recorded the highest increase in area at 7.9 per cent over last year. Acreage under rice, the key kharif crop which accounts for almost 37 per cent of the kharif area, increased by 4.2 per cent y-o-y. Kharif sowing of onions increased by 61 per cent while the area under tomatoes lagged behind, with key producing states reporting lower sowing due to extended heatwave condition till June. 
 As on September 17, 2024 the government has procured 525 lakh tonnes of rice in kharif marketing season (KMS) 2023-24, which is 8 per cent lower than the procurement in the last season. The stock of rice with the Food Corporation of India (FCI) stood at 422 lakh tonnes as on September 01, 2024, which is 24 per cent higher than the corresponding period last year. To reduce the excess stock of rice before the commencement of the new procurement season starting from October 1, 2024, distilleries have been allowed to purchase 23 lakh tonnes of rice from the FCI for ethanol production at the rate determined through the weekly e-auctions. Procurement of wheat at 266 lakh tonnes in rabi marketing season (RMS) 2024-25 was 1.6 per cent higher than the last season. The stock of wheat as on September 01, 2024 stood at 252 lakh tonnes and remained 3.4 per cent lower than last year. The buffer norm for rice and wheat stock for July-September quarter is 135.4 lakh tonnes and 275.8 lakh tonnes, respectively (Chart III.31). 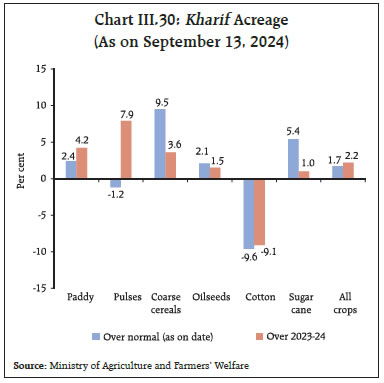

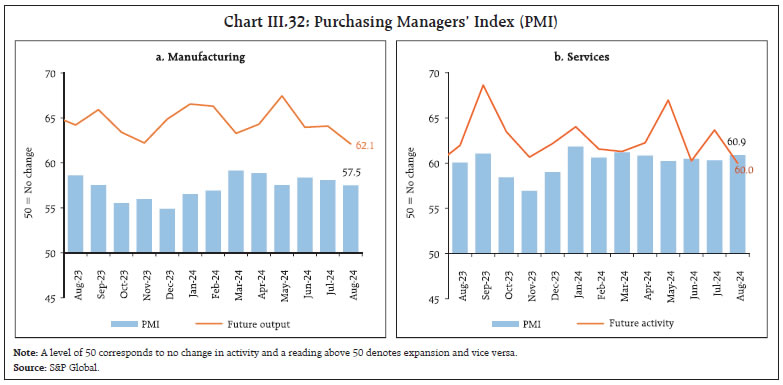 India’s manufacturing PMI eased to 57.5 in August 2024 from 58.1 in July due to deceleration in the pace of expansion in output and new businesses (Chart III.32a). The services sector PMI, increased to 60.9 in August, aided by a robust expansion in new business activities (Chart III.32b). Business expectations under both manufacturing and services, however, moderated to their lowest in over a year. Port traffic increased by 6.7 per cent (y-o-y) in August 2024, boosted by fertiliser and other miscellaneous cargo (Chart III.33a). Railway freight traffic, on the other hand, recorded a y-o-y decline in August, led by cement (Chart III.33b). Within the construction sector, steel consumption expanded by 10.0 per cent (y-o-y) in August (Chart III.34). Cement production rose by 5.5 per cent in July 2024.
Available high frequency indicators for the services sector reflect the resilience of activity in August 2024, supported by port cargo, international air passenger traffic and steel consumption (Table III.2). Inflation Headline inflation, as measured by y-o-y changes in the all-India CPI13, edged up to 3.7 per cent in August 2024 from 3.6 per cent in July 2024 (Chart III.35). The marginal increase in inflation came entirely from an unfavourable base effect of around 5 bps while the index remained unchanged at the previous month’s level (zero momentum). Both CPI fuel and CPI core (i.e., CPI excluding food and fuel) groups recorded positive momentum of 34 bps and 27 bps, respectively, while the CPI food group recorded a negative momentum of 30 bps. Food inflation (y-o-y) firmed to 5.3 per cent in August from 5.1 per cent in July as a negative momentum of 30 bps was more than offset by an unfavourable base effect of 52 bps. In terms of sub-groups, inflation in eggs, fruits, vegetables and non-alcoholic beverages picked up while it softened in cereals, meat and fish, pulses, and sugar. Edible oils and fats recorded a lower rate of deflation while deflation in spices deepened. Milk prices continued to record a modest inflation of 3.0 per cent for the third consecutive month (Chart III.36). Fuel and light recorded deflation of (-)5.3 per cent in August 2024 (as against (-)5.5 per cent in July) primarily on account of the decline in LPG prices by 24.6 per cent (y-o-y). Other items in the fuel group, however, recorded positive inflation in August. Core inflation moderated to 3.3 per cent in August from 3.4 per cent in July. Inflation increased in case of transport and communication, education, recreation and amusement, and household goods and services while it remained steady for sub-groups such as clothing and footwear, housing, and health. Personal care and effects, and pan, tobacco and intoxicants recorded a moderation (Chart III.37). In terms of regional distribution rural inflation at 4.2 per cent was higher than urban inflation at 3.1 per cent. Majority of the states registered inflation below 6 per cent (Chart III.38).
High frequency food price data for September so far (up to 18th) indicate a moderation in the prices of cereals (mainly for rice) and pulses (except for gram). Among vegetables, potato and tomato prices fell, while those of onion recorded an increase. Edible oil prices remained steady (Chart III.39).
Retail selling prices of petrol and diesel were kept unchanged in September so far (up to 18th). LPG prices also remained unchanged while subsidised kerosene prices witnessed a reduction (Table III.3). The PMIs for August 2024 indicated that the rate of expansion of input costs and selling prices moderated for both manufacturing and services. Manufacturing PMI input costs declined to a five-month low, while the services sector witnessed the slowest increase in input prices in four years (Chart III.40). Within manufacturing, the gap between selling prices and input costs widened to the highest level since April 2020. 
| Table III.3: Petroleum Products Prices | | Item | Unit | Domestic Prices | Month-over-month
(per cent) | | Sep-23 | Aug-24 | Sep-24^ | Aug-24 | Sep-24^ | | Petrol | ₹/litre | 102.92 | 100.97 | 100.97 | 0.0 | 0.0 | | Diesel | ₹/litre | 92.72 | 90.42 | 90.42 | 0.0 | 0.0 | | Kerosene (subsidised) | ₹/litre | 54.89 | 46.65 | 45.78 | 0.0 | -1.9 | | LPG (non-subsidised) | ₹/cylinder | 913.25 | 813.25 | 813.25 | 0.0 | 0.0 | ^: For the period September 1-18, 2024.
Note: Other than kerosene, prices represent the average Indian Oil Corporation Limited (IOCL) prices in four major metros (Delhi, Kolkata, Mumbai and Chennai). For kerosene, prices denote the average of the subsidised prices in Kolkata, Mumbai and Chennai.
Sources: IOCL; Petroleum Planning and Analysis Cell (PPAC); and RBI staff estimates. | During Q1:2024-25, the all-India house price index (HPI)14 increased by 3.3 per cent (y-o-y) from 4.1 per cent growth in the previous quarter and 5.1 per cent a year ago. On a sequential (q-o-q) basis, all-India HPI increased by 1.8 per cent in Q1:2024-25 with nine of the ten major cities included in the index exhibiting a rise (Chart III.41).
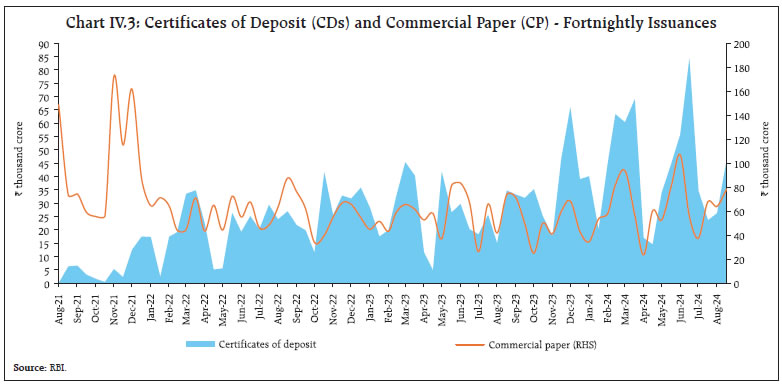
IV. Financial Conditions Surplus liquidity in the banking system moderated in the latter half of August, driven by build-up of government cash balances due to GST payments. In early September, however, a pick-up in government spending led to the return of liquidity to the banking system. Overall, the average daily net absorption under the liquidity adjustment facility (LAF) decreased to ₹1.45 lakh crore during August 16 to September 17, 2024, from ₹1.52 lakh crore during July 16 and August 15, 2024 (Chart IV.1). Of the average total absorption of ₹1.58 lakh crore from August 16 to September 17, 2024, placement of funds under the standing deposit facility (SDF) accounted for about 63 per cent. The Reserve Bank conducted two main and fourteen fine-tuning variable rate reverse repo (VRRR) operations, with maturities ranging from overnight to 7 days, cumulatively absorbing ₹5.41 lakh crore from the banking system. Banks have shown reluctance to part with liquidity for longer tenors, as evidenced by lower offer-cover ratios in the main operations.15 One variable rate repo (VRR) operation of 3-day maturity was also conducted on September 17, 2024, injecting ₹0.83 lakh crore into the banking system. Average daily borrowings under the marginal standing facility (MSF) were at ₹0.05 lakh crore during August 16 to September 17, 2024 as compared with ₹0.04 lakh crore during July 16 and August 15, 2024.  The weighted average call rate (WACR) averaged 6.53 per cent during August 16 and September 17 as compared with 6.51 per cent during July 16 to August 15, 2024 (Chart IV.2a). In the collateralised segment, the tri-party repo rate and the market repo rate moved in tandem with the WACR, averaging 13 basis points (bps) and 5 bps, respectively, below the policy repo rate during the same period (Chart IV.2b). In the short-term money market segment, yields on 3-month commercial paper (CP) issued by non-banking financial companies (NBFCs) and 3-month treasury bills (T-bills) remained broadly stable. In contrast, the rates on 3-month certificates of deposit (CDs) increased (Chart IV.2b). The average risk premium in the money market (spread between 3-month CP and 91-day T-bill rates) was at 107 bps during the period August 16 - September 17, 2024, 3 bps higher than during July 16 to August 15, 2024. In the primary market, CD issuances grew by more than 65 per cent (y-o-y) to ₹4.51 lakh crore during 2024-25 (up to September 6), significantly higher than ₹2.72 lakh crore in the corresponding period of the previous year to meet funding requirements of banks to bridge the gap between credit and deposit growth (Chart IV.3). CP issuances also increased to ₹6.28 lakh crore during 2024-25 (up to August 31), higher than ₹5.88 lakh crore in the corresponding period of the previous year. With the Reserve Bank increasing risk weights on bank loans to NBFCs, CP issuances by NBFCs increased as they diversified their funding sources beyond banks. 
 In the fixed income segment, domestic bond yields generally softened in August and September (up to September 17). The yield on the 10-year Indian benchmark government security (G-sec) moved in a narrow range of 6.76 - 6.87 per cent (Chart IV.4a). During August 16 - September 17, the average term spread (10-year minus 91-day T-bills) softened to 22 bps from 26 bps during July 16 - August 15. Overall, the fall in G-sec yields across the term structure was broadly manifested in a downward shift of the yield curve (Chart IV.4b). Corporate bond yields exhibited mixed movements, while associated risk premia generally increased during August 16 - September 16, 2024 (Table IV.1). During 2024-25 (up to July), corporate bond issuances were lower at ₹2.53 lakh crore than ₹2.90 lakh crore during the same period of the previous year. Corporate bond issuances, however, increased to ₹94,306 crore during July 2024, recording the highest monthly issuance in 2024-25 so far and nearly double of ₹54,269 crore a year ago. 
| Table IV.1: Financial Markets - Rates and Spread | | | Interest Rates (per cent) | Spread (basis points) | | (Over Corresponding Risk-free Rate) | | Instrument | Jul 16, 2024 – Aug 14, 2024 | Aug 16, 2024 – Sep 16, 2024 | Variation | Jul 16, 2024 – Aug 14, 2024 | Aug 16, 2024 – Sep 16, 2024 | Variation | | 1 | 2 | 3 | (4 = 3-2) | 5 | 6 | (7 = 6-5) | | Corporate Bonds | | | | | | | | (i) AAA (1-year) | 7.69 | 7.94 | 25 | 80 | 113 | 33 | | (ii) AAA (3-year) | 7.83 | 7.81 | -2 | 88 | 95 | 7 | | (iii) AAA (5-year) | 7.76 | 7.75 | -1 | 79 | 86 | 7 | | (iv) AA (3-year) | 8.53 | 8.56 | 3 | 158 | 170 | 12 | | (v) BBB- (3-year) | 12.12 | 12.14 | 2 | 517 | 528 | 11 | Note: Yields and spreads are computed as averages for the respective periods.
Sources: FIMMDA; and Bloomberg. | Reserve money (RM), excluding the first-round impact of changes in the cash reserve ratio (CRR), recorded a growth of 5.9 per cent (y-o-y) as on September 13, 2024 (8.4 per cent a year ago) [Chart IV.5]. Growth in currency in circulation (CiC), the largest component of RM, increased to 6.1 per cent (y-o-y) as on September 13, 2024, from 3.0 per cent as on May 17, 2024, on account of the base effect of the withdrawal of ₹2000 banknotes16, 97.96 per cent of which has been returned to the banking system, mostly in the form of deposits (as on August 31, 2024). On the sources side (assets), foreign currency assets (accounting for more than 90 per cent of NFA) continued to record double-digit growth of 15.9 per cent (y-o-y) as of September 13, 2024. Gold – the other major component of NFA – grew by 44.2 per cent, which is the highest since December 2020, mainly due to revaluation gains on account of a rise in gold prices (Chart IV.6).
Money supply (M3) rose by 10.4 per cent (y-o-y) as on September 6, 2024 (11.1 per cent a year ago).17 Aggregate deposits with banks, accounting for around 86 per cent of M3, increased by 11.1 per cent (12.3 per cent a year ago). SCBs’ credit growth stood at 14.7 per cent as on September 6, 2024 (15.1 per cent a year ago) [Chart IV.7].
SCBs’ deposit growth18, which increased after the withdrawal of ₹2000 banknotes, has remained in double digits since April 2023 (Chart IV.8). CD issuances supplement the deposit base. SCBs’ incremental credit-deposit ratio declined from 95.8 as at end-March 2024 to 95.3 as on September 6, 2024 (Chart IV.9). With the statutory requirements for CRR and statutory liquidity ratio (SLR) at 4.5 per cent and 18 per cent, respectively, around 77 per cent of deposits were available with the banking system for credit expansion as on September 6, 2024. Credit by SCBs continued to grow at robust pace (Chart IV.10). Though the growth in the personal loan segment (housing and non-housing) has moderated in the recent past, it remains the prime driver of overall credit expansion and continues to exceed the headline credit growth. Advances to industry have moved up to record double digit growth in the last quarter.
SCBs’ credit to the private corporate sector, accounting for nearly one fourth of total advances, continued its robust growth while lending to public sector entities moderated in Q1:2024-25 (Chart IV.11a). Both working capital and term loans have boosted bank credit growth (Chart IV.11b). In response to the 250 bps hike in the policy repo rate since May 2022, banks have revised upwards their repo-linked external benchmark-based lending rates (EBLRs) by a similar magnitude. The 1-year median marginal cost of funds-based lending rate (MCLR) of SCBs increased by 170 bps during May 2022 to August 2024. Consequently, weighted average lending rates (WALRs) on fresh and outstanding rupee loans increased by 189 bps and 119 bps, respectively, during May 2022 to July 2024. On the deposit side, the weighted average domestic term deposit rates (WADTDRs) on fresh and outstanding rupee term deposits increased by 245 bps and 189 bps, respectively, during the same period (Table IV.2). 
| Table IV.2: Transmission to Banks’ Deposit and Lending Rates | | (Variation in bps) | | | | Term Deposit Rates | Lending Rates | | Period | Repo Rate | WADTDR – Fresh Deposits | WADTDR- Outstanding Deposits | EBLR | 1-Yr. MCLR (Median) | WALR - Fresh Rupee Loans | WALR- Outstanding Rupee Loans | Easing Phase
Feb 2019 to Mar 2022 | -250 | -259 | -188 | -250 | -155 | -232 | -150 | Tightening Period
May 2022 to July* 2024 | +250 | 245 | 189 | 250 | 170 | 189 | 119 | Notes: 1. Data on EBLR pertain to 32 domestic banks.
2. *: Data on EBLR and MCLR pertain to August 2024.
3. WALR: Weighted Average Lending Rate. WADTDR: Weighted Average Domestic Term Deposit Rate;
MCLR: Marginal Cost of Funds-based Lending Rate; EBLR: External Benchmark based Lending Rate.
Source: RBI. | Transmission across bank groups indicates that the increase in lending rates was higher in the case of private banks than among public sector banks (PSBs); however, in case of deposits, it was higher for PSBs during the same period (Chart IV.12). Consistent with rising returns on term deposits, there has been higher accruals (16.6 per cent y-o-y growth in June 2024) [Chart IV.13]. The share of savings deposits in total deposits has come down to 29.8 per cent in June 2024 from 31.8 per cent a year ago.
As alluded to in the Introduction, the share of term deposits offering interest rates over 7 per cent increased to 66.9 per cent in June 2024, from 33.5 per cent in March 2023 and 4.5 per cent in March 2022 (Chart IV.14). Indian equity markets scaled fresh highs in the second half of August, despite geopolitical concerns, on expectations of a US Fed rate cut after the release of the dovish US Federal Open Market Committee (FOMC) minutes and remarks by the US Fed Chairman at the Jackson Hole Economic Symposium (Chart IV.15). The benchmark index closed higher in ten consecutive sessions. Markets, however, declined in early September, tracking negative global cues as concerns over global growth and a sell-off in technology stocks dented investors’ sentiments. Thereafter, markets rebounded and scaled fresh all-time highs mirroring bullish trends in global equity markets. Overall, the BSE Sensex gained 6.9 per cent since August 15, 2024 to close at 84,544 on September 20, 2024. 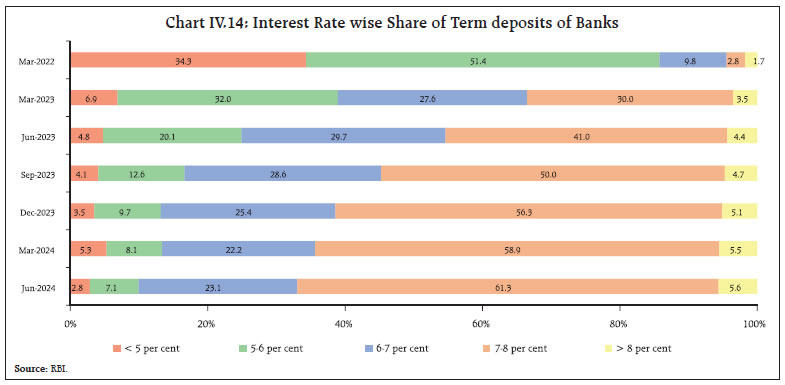
 Resource mobilisation through initial public offerings (IPOs) has remained robust in 2024 so far, as India accounted for the highest number of IPOs globally (27 per cent by volume) in H1:2024, led by public offerings of small and medium enterprises (SMEs). In terms of the amount raised, India accounted for 9 per cent of total proceeds raised through IPOs (Charts IV.16a and 16b). Investor enthusiasm in the primary segment can be gauged by the fact that the IPO of a housing finance company in the second week of September garnered bids of over ₹3 lakh crore.
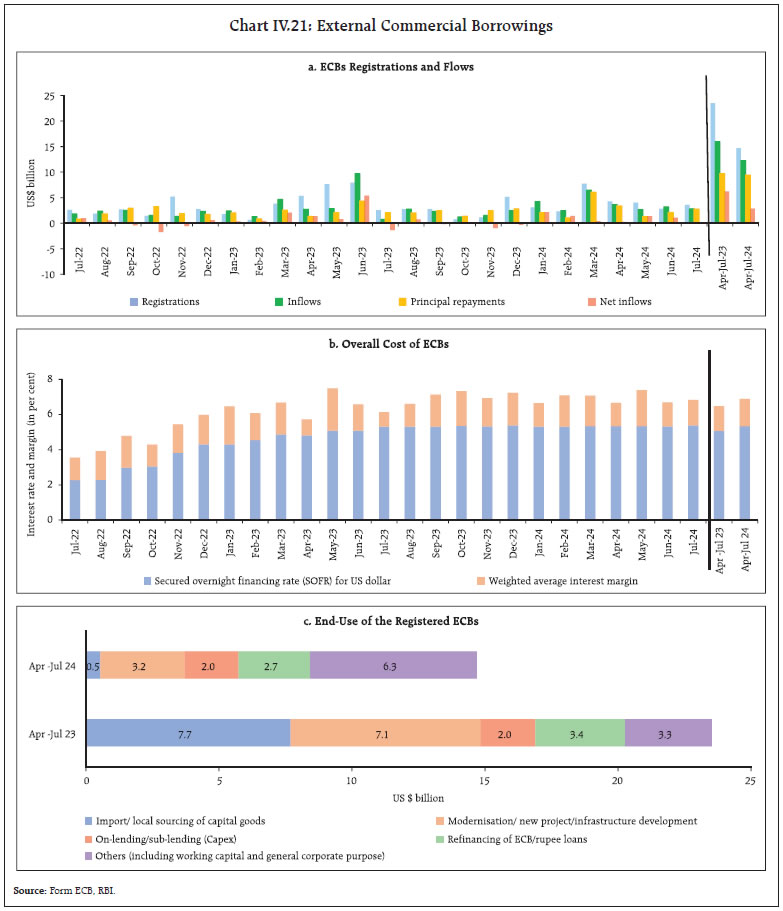
Resource mobilisation through other modes, like Qualified Institutional Placements (QIPs) and Preferential allotment, have also shown a significant uptick in 2024-25 so far19, facilitated by conducive market conditions (Chart IV.17). There has been heightened investors’ interest in IPOs in recent years.20 While the vitality in the primary market has helped companies raise capital, it has also raised concerns about promoters utilising the opportunity to offload their holdings at elevated prices, especially in the SME segment.21 It may be noted that regulatory changes like the ceiling on IPO funding22 by NBFCs and the shift from a proportionality-based allotment method to a lottery-based allotment method23 have helped contain massive oversubscription rates seen earlier in mainboard IPOs (Chart IV.18). The persistence of the proportionality-based allotment method in the SME segment partly explains the massive oversubscription rates witnessed in public offerings of the SME segment in recent times. 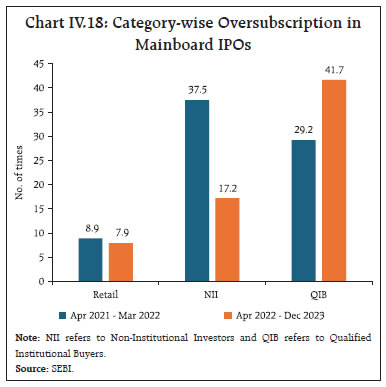 Gross inward FDI rose to US$ 27.7 billion during April-July 2024 from US$ 22.4 billion a year ago (Chart IV.19). Manufacturing, financial services, communication services, computer services, and electricity and other energy sectors accounted for more than three-fourths of the gross FDI inflows. With more than three-fourths of the flows, the major source countries were Singapore, Mauritius, the Netherlands, the US, Belgium and Japan. Net FDI rose to US$ 5.5 billion during April-July 2024 as compared to US$ 3.8 billion a year ago, due to an increase in gross FDI flows. 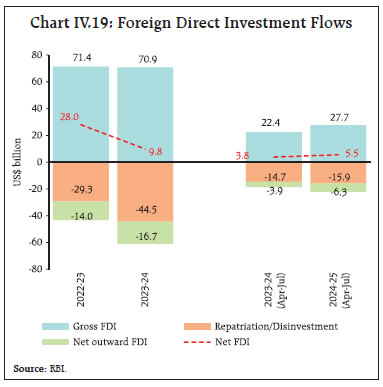 Net foreign portfolio investment (FPI) was to the tune of US$ 4.3 billion during August 2024, the third consecutive month of net inflows (Chart IV.20a). In the equity segment, they slowed to US$ 1.4 billion in August 2024 on account of rising global concerns over a possible US recession and unwinding of the yen carry trade. The slowdown was broad-based, negatively affecting FPI flows in EMEs, with large sell-offs at the beginning of the month, followed by a recovery since the middle of the month (Chart IV.20b). Within Indian equities, financial services and metals and mining recorded the highest outflows while healthcare, consumer durables and consumer services received the highest FPI inflows in August 2024. The debt segment with net inflows of US$ 2.9 billion dominated FPI flows during August 2024. In a cross-country perspective, Indian debt remained attractive since the announcement of the inclusion of Indian government bonds in the JP Morgan’s GBI-EM index in September 2023. During September 2024 (up to September 16), net FPI inflows were to the tune of US$ 5.9 billion. Non-resident deposits recorded net inflows of US$ 5.8 billion during April-July 2024 as compared with US$ 3.0 billion a year ago, with higher inflows in all three accounts namely, Non-Resident (External) Rupee Accounts [NR(E)RA], Non-Resident Ordinary (NRO) and Foreign Currency Non-Resident [FCNR(B)] accounts. Registration of external commercial borrowings (ECB) increased in July 2024 (m-o-m). During April-July 2024, however, it was lower by 37.5 per cent over the corresponding period, last year (Chart IV.21a). Both gross disbursements (US$ 12.3 billion) and net ECB inflows (US$ 2.8 billion) during 2024-25 so far were lower than in the corresponding period, last year. The overall cost of ECB loans increased by 40 bps during April–July 2024 vis-à-vis the corresponding period last year (Chart IV.21b). Nearly two-fifth of the total ECB loans contracted this year so far were intended for capital expenditure (including on-lending and sub-lending for capex) [Chart IV.21c]. 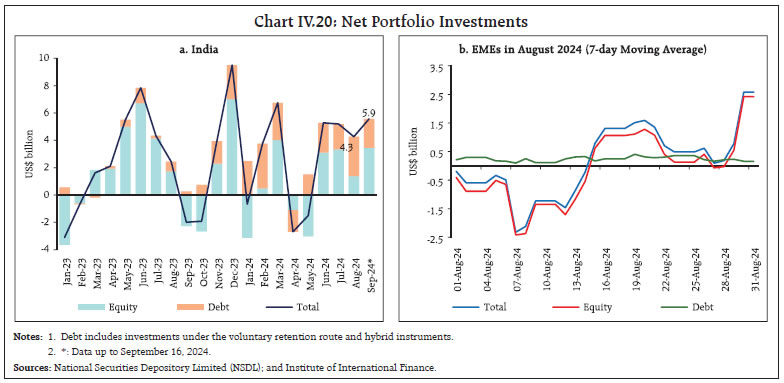
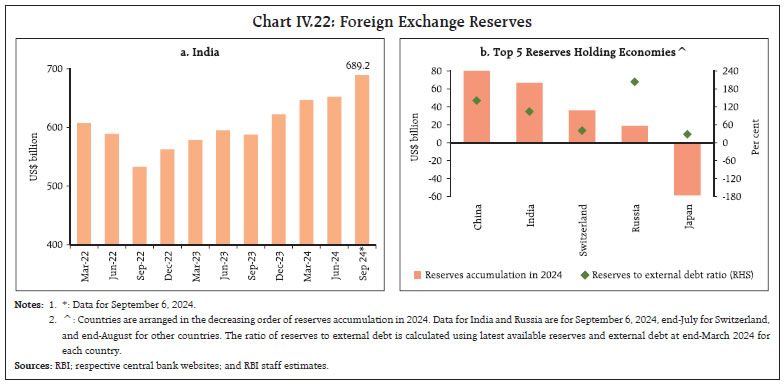 As on September 6, 2024, India’s foreign exchange reserves rose to an all-time high of US$ 689.2 billion, equivalent of more than 12 months of imports for 2023-24 and more than 103 per cent of total external debt outstanding at end-March 2024 (Chart IV.22a). India accumulated US$ 66.8 billion in 2024 so far (as on September 6), the second highest among major foreign exchange reserves holding countries (Chart IV.22b). The Indian rupee (INR) exhibited the least volatility among major currencies during August 2024, depreciating by 0.4 per cent (m-o-m) vis-à-vis the US dollar (Chart IV.23). The INR depreciated by 1.9 per cent (m-o-m) in August 2024 in terms of the 40-currency real effective exchange rate (REER) on account of the depreciation of the INR in nominal effective terms and negative relative price differentials (Chart IV.24).
Payment Systems Digital transactions exhibited healthy growth in August 2024 across major payment modes, including Real Time Gross Settlement (RTGS), National Electronic Funds Transfer (NEFT), Unified Payments Interface (UPI), Bharat Bill Payment System (BBPS), and National Automated Clearing House (NACH) (Table IV.3). The volume of UPI Person-to-Merchant (P2M) transactions accounted for 62 per cent of total UPI transactions in August 2024, an increase from 58 per cent in the previous year. The value of UPI transactions accelerated by 35 per cent during April-August 2024, reaching ₹101 lakh crore. The UPI ecosystem is also experiencing widespread adoption of its new features, including IPO on UPI24, Autopay, and cross-border P2M payments in Nepal25. The creation of UPI IPO mandates nearly trebled, with the rate of successful mandate execution reaching 100 per cent in August 2024, up from 98 per cent in August 2023. In August 2024, the creation and execution of mandates under UPI Autopay increased by 178 per cent and 173 per cent, respectively. UPI P2M transactions in Nepal exceeded one lakh transactions since its launch in March 2024.26 The growth in overall UPI transactions is expected to go up further with the launch of the UPI Circle feature at the Global FinTech Festival (GFF) 2024, which enables primary users to delegate UPI payments to up to five secondary users. 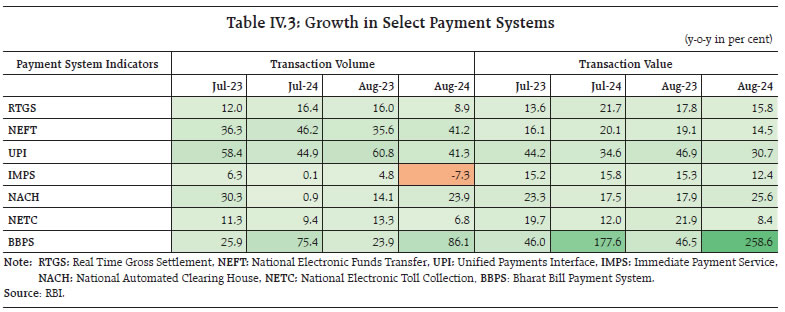 Transactions under the BBPS rose on account of growth in the volume and value of credit card bill payments and utility bill payments including DTH, gas, and electricity. The introduction of Bharat BillPay for Business at GFF 2024 is anticipated to streamline and automate business-to-business payments and collections through a centralised, interoperable platform, regardless of business size. The inclusion of auto-replenishment of FASTags and National Common Mobility Card (NCMC) under the e-mandate framework for recurring transactions is likely to boost the NETC and card transactions, respectively. The FinTech ecosystem is demonstrating vibrancy, with total funding increasing by 41 per cent during April-August 2024 from a 57 per cent contraction in the corresponding period of 2023.27 Looking ahead, with innovations in the ecosystem, new business models and evolving technology, the volume of digital payments is projected to increase threefold to reach 481 billion transactions in 2028-29.28 V. Conclusion Recent research on the energy outlook indicates that energy transition has accelerated in recent years, with the pace of clean technology deployment and capital investment surging to record levels. The era of fossil fuels’ dominance is coming to an end, with renewables expected to cross 50 per cent share of electricity generation globally by the end of this decade. Cleaner power generation can drive bulk of the aggressive emissions cuts that are urgently needed, enabling more time to tackle ‘hard-to-abate’ areas like steelmaking and aviation, where cost-competitive low-carbon solutions have yet to scale. A net-zero pathway hinges on renewables capacity tripling between now and the end of the decade. On the energy supply side, for every US dollar that goes to fossil fuels, an average of US$ 3 needs to be invested in low-carbon energy over the remainder of the decade – up from parity today. A fully decarbonised global energy system by 2050 is projected to come with a US$ 215 trillion price tag. In this context, the inaugural evaluation of the financial sector outlook for emerging market and developing economies (EMDEs) assumes significance.29 The World Bank finds that in the face of relatively higher climate-related financial sector risks and financing gaps than AEs, regulatory authorities in EMDEs are adopting novel approaches such as customised climate risk assessments, directed lending and interest rate adjustments to enable climate finance. On a durable basis, however, deep and well-functioning capital and insurance markets are essential for long-term green funding, with development banks and credit guarantee institutions providing crucial and targeted gapfills and backstops. Furthermore, climate policies based on subsidies are found to be increasingly ineffective in curbing emissions and instead, a balanced combination of financial incentives, regulations and taxes is preferred. The enabling conditions are falling into place - most banks in these countries appear relatively sound and resilient, with sufficient buffers to withstand sizable credit and sovereign risk shocks, except in some lower-income vulnerable countries. There have been improvements in financial inclusion and efforts are underway to green the financial sector amidst the search for a right balance between the role of public policy interventions and market-based competition. On the downside, EMDE banks have substantially increased their holdings of government debt, which can pose risks to financial stability in the face of a ‘sovereign-bank nexus’ tail risk which regulatory standards do not take adequate account of. Ahead of the 29th session of the Conference of the Parties (COP 29) to the United Nations Framework Convention on Climate Change (UNFCCC), there is widespread alarm that greenhouse gas emissions remain stubbornly high, particularly on per capita basis in AEs. There is still time for the world to get on track if decisive action is taken now with an even faster ramp-up of everything from renewables to green fuels.30
|