Macroeconomic risks arising from domestic weakness and global uncertainty came to the fore during 2013-14
following the US Fed’s indication that it would taper its large-scale asset purchase programme. The Reserve Bank
responded through several policy actions to mitigate the risks to macro-financial stability. It aimed at containing
exchange rate volatility, compressing the current account deficit (CAD) and rebuilding buffers. It also accorded
primacy to containing inflation, the persistence of which over the years had caused several macroeconomic
imbalances. Though these measures helped in stabilising the economy, keeping it on a disinflationary path, the
slowdown continues to pose policy challenges into 2014-15. The economy requires policies that address growth
through increased productivity, as well as greater investment and use of labour.
II.1 THE REAL ECONOMY
Growth slows to sub-5 per cent for the second
consecutive year, but growth may increase from
here
II.1.1 Real GDP growth improved marginally to
4.7 per cent in 2013-14 from 4.5 per cent in 2012-
13, recording a sub-5 per cent growth for the second
consecutive year (Chart II.1). In the absence of a
clear legal and regulatory framework in key areas
such as natural resources, especially mining
activity, environmental clearances and land
acquisition, business confidence dipped and
affected investments in the economy. Consumption
also decelerated on the back of the growth
slowdown. However, growth may increase from
here, with a moderate-paced recovery likely in 2014-15. Recovery in growth would essentially
come from an improvement in the investment
climate through better governance, transparent,
effective and efficient regulatory and legal regimes,
gains in technical efficiency, institutional
improvements, improved labour mobility and other
reforms. Better business sentiment, anticipating
such improvements following the elections, is a
welcome development.
II.1.2 In 2013-14, the agriculture sector’s rebound
to an above trend growth rate on the back of a
normal monsoon, supported overall growth. The
industrial sector contracted, while services sector
growth remained unchanged at the previous year’s
level. Structural impediments, high inflation and
domestic policy uncertainties continued to weigh
down growth prospects.
Continued deceleration in consumption and
sluggish investment
II.1.3 The growth in real GDP at market prices
increased modestly to 5 per cent during 2013-14
led by a pickup in exports coupled with a decline
in imports (Chart II.2a). The contribution of net
exports to overall growth increased significantly in
2013-14 (Chart II.2b). In contrast, there was a
slowdown in the pace of growth of the private final
consumption expenditure (PFCE) mainly due to
the persistence of inflation and slackening of disposable incomes, notwithstanding higher
growth in agriculture.
II.1.4 Real fixed investment growth decelerated
for the second consecutive year and turned
negative in 2013-14 (Chart II.3a). Statistical
measures indicate that while the trend growth rate
of real fixed investment had peaked in mid-2005-06,
it declined markedly thereafter largely on account
of the structural bottlenecks that choked investments.
The cyclical component also showed a substantial
downturn in recent years (Box II.1).
Box II.1
Investment Cycles in India and the Recent Downturn
Empirical evidence suggests that both structural and cyclical
factors have caused investment to slow down in recent years.
Moreover, these two factors have reinforced each other. The
trend component has declined since mid-2005-06, largely
reflecting the impact of structural impediments. The empirical
analysis based on quarterly data over the past fourteen
years also reveals that fiscal imbalances, fuel inflation, world
growth (as a proxy for external demand) and the monetary
policy stance impact the cyclical component of real fixed
investment growth.
The trend component of real investment in India was
estimated using the Hodrick-Prescott (HP) filter on the
deseasonalised series of real gross fixed capital formation
(GFCF) adopting a growth cycle approach. The cyclical
component of investment was extracted by subtracting the
estimated trend growth from its actual growth over the period
1997-98:Q1 to 2013-14:Q4. The series of the growth cycle and trend growth of real fixed investment is shown in the
chart below. The time period was divided into three phases,
based on the generally evolving path of real GDP growth,
i.e., Phase I (1997-98:Q1 to 2002-03:Q4), Phase II (2003-
04:Q1 to 2008-09:Q2) and Phase III (2008-09:Q3 to 2013-
14:Q4).
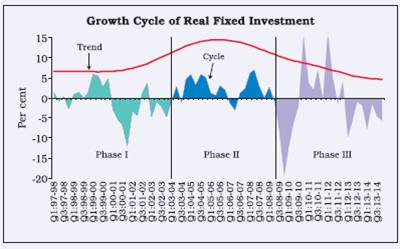 The trend growth in GFCF declined significantly from 14.5
per cent in H2 of 2005-06 to below 5 per cent in 2013-14.
In Phase I, the rate of investment growth alternated,
exceeding and remaining below trend for nearly the same
number of quarters. On the other hand, the investment
growth generally remained above trend in Phase II but
dipped below trend for the larger part in Phase III. The
cyclical component of real investment growth dipped and
turned negative especially since Q1 of 2012-13. The
cyclical component of real investment growth and real GDP
growth showed fairly strong co-movement (statistically
significant correlation of +0.62), implying that falling investment growth and GDP growth, as evident in the recent
period, are related.
In line with the observation on following trend growth in
investment a recent study by Anand and Tulin (2014) also
highlights the importance of economic policy uncertainity
and deteriorating business confidence in the recent
investment slowdown. Interest rates appears to explain a
smaller portion of investment slowdown.
Further work will be necessary to examine the contribution
of specific factors, like delays in land acquisition and
environment clearances, reduction in the marginal
productivity of capital despite lower real interest rates, weak
business confidence and policy uncertainty that may have
adversely impacted the growth rate of real investment.
Reference
Anand Rahul and Tulin Volodymyr (2014), ‘Disentangling
India’s Investment Slowdown’, IMF working paper WP/1447.
II.1.5 The rate of gross capital formation
(investment rate) declined for the second consecutive
year to 34.8 per cent in 2012-13 as compared to
35.5 per cent in 2011-12 and 36.5 per cent in
2010-11(Chart II.3b). The sectoral composition of
fixed investment shows that the private corporate
sector accounted for most of the reduction in the
overall investment rate in recent years particularly
in ‘machinery and equipment’ (Table II.1). On the
other hand, fixed investments of the public and
household sectors which are concentrated in
‘construction’ remained somewhat less volatile.
Productivity changes may have had a significant
impact on growth
II.1.6 Over the previous decade, productivity
changes may have had a significant impact on the
growth rate for the Indian economy. India KLEMS
(Capital, Labour, Energy, Material and Services)
project study has shown significant productivity
improvements in the previous decade up to 2008-09
(Box II.2). Much of this period overlapped the high
growth phase in the Indian economy. Though
estimates are not available for the subsequent years, the increase in capital-output ratios during
2011-12 to 2013-14 suggests that productivity
improvements have not continued at the same pace
over the last three years.
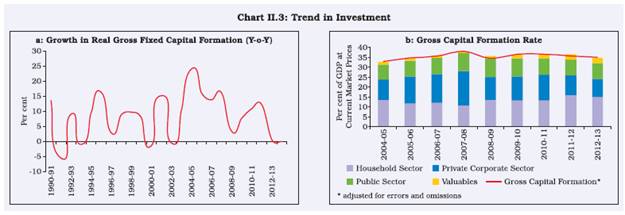
Table II.1: Gross Fixed Capital Formation |
(as percentage of GDP at current market prices) |
Year |
Public Sector |
Private Corporate Sector |
Household Sector |
Construction |
Machinery & equipment |
Total |
Construction |
Machinery & equipment |
Total |
Construction |
Machinery & equipment |
Total |
1 |
2 |
3 |
4 |
5 |
6 |
7 |
8 |
9 |
10 |
2008-09 |
5.6 |
2.9 |
8.5 |
2.2 |
8.1 |
10.3 |
10.3 |
3.1 |
13.5 |
2009-10 |
5.5 |
2.9 |
8.4 |
2.5 |
7.7 |
10.2 |
9.8 |
3.3 |
13.2 |
2010-11 |
5.1 |
2.7 |
7.8 |
2.9 |
7.5 |
10.4 |
9.1 |
3.5 |
12.7 |
2011-12 |
4.7 |
2.4 |
7.1 |
2.7 |
6.8 |
9.4 |
10.4 |
4.9 |
15.2 |
2012-13 |
5.4 |
2.4 |
7.8 |
2.4 |
6.0 |
8.5 |
9.7 |
4.4 |
14.1 |
| Source: Central Statistics Office. |
Household financial saving rate stays low in
2013-14
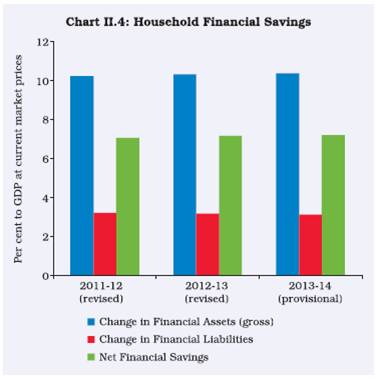
II.1.7 The Reserve Bank’s preliminary estimates
showed that the household financial saving rate remained low during 2013-14, increasing only
marginally to 7.2 per cent of GDP in 2013-14 from
7.1 per cent of GDP in 2012-13 and 7.0 per cent of
GDP in 2011-12 (Chart II.4). During 2013-14, households increased their saving in deposits
(especially with commercial banks) and small
savings, while that in currency and mutual funds
declined (Table II.2).
Box II.2
Productivity Growth in India
Productivity improvement remains an important contributory
factor in the overall growth process. Empirical studies relating
to productivity growth in India largely relate to the 1980s and
1990s. While these studies differ in terms of the methodology
used, some of the studies based on the growth accounting
framework, reveal that there was a sharp acceleration in the
rate of total factor productivity (TFP) growth in the Indian
economy after 1980. Further, the rate of growth in TFP in the
post-reform period is found to be even higher than that in
the 1980s, mainly due to improved productivity performance
of the services sector.
Recent estimates on TFP growth for 26 industries and at
the aggregate level have been prepared for the period 1980-
81 to 2008-09 under the aegis of India KLEMS research
project (RBI, 2014) which indicate that the TFP increased
significantly in the 2000s (up to 2008-09) as compared to the
previous two decades. The increase in TFP at the economy
level in the 2000s was primarily due to manufacturing,
electricity and services sectors. In agriculture and mining
sectors, however, the rate of TFP growth decelerated in
the 2000s. In the case of construction, the steep fall in TFP
growth during 1980-99 was largely arrested in the 2000s.
Looking at the reasons for productivity growth, the opening
up of the economy post-1991 has been identified as an
important factor which resulted in a significant jump in services
sector productivity which continued during the 2000s. The
electricity sector is found to have economised on the use of
energy and services input in 2000s raising the value added
per kilowatt hour of production. The manufacturing sector
has seen a more broad-based phenomenon of productivity
growth with 8 out of 14 industries showing faster productivity
growth during 2000-08. The liberal market reforms in the
1990s seem to have helped in the accumulation of capital
in some segments of manufacturing immediately after the
reforms, while opening up to foreign technology and import
of capital goods might have translated into better productivity
gains in the latter period (2000s) (Das, 2014). In some other
studies, increase in manufacturing productivity in 2000s
has been attributed to factors, such as, removal of trade
barriers and increasing openness. Infrastructure facilities as
well as labour market conditions also exerted a significant
influence on technical efficiency and productivity growth of
manufacturing industries in India.
As productivity might have been adversely impacted over
the last 3 years, going forward, removing infrastructure
bottlenecks and labour market rigidities holds the key to
improving output growth vis-à-vis factor accumulation.
Continuing relocation of labour out of low productivity
sectors to high productivity sectors is also akin to increase in
productivity. In India, although there is some migration from
agriculture, there is a need to create further employment
opportunities in industrial and services sectors to ensure
gainful employment of migrated labour and for enhancing
overall productivity level.
Period wise trend growth rate of Total Factor Productivity
by broad sector
(using labour input and capital service) |
Sector |
1980-2008 |
1980-1999 |
2000-2008 |
1 |
2 |
3 |
4 |
Agriculture, Hunting, Forestry, Fishing |
1.52 |
1.78 |
0.71 |
| Mining and Quarrying |
-0.24 |
0.22 |
-1.59 |
Manufacturing |
0.73 |
0.04 |
2.76 |
Electricity, Gas and Water Supply |
2.96 |
1.14 |
6.93 |
Construction |
-3.31 |
-4.19 |
-0.69 |
Services |
1.84 |
1.74 |
2.14 |
Total Economy |
1.40 |
1.11 |
2.26 |
| Source: KLEMS database available at www.rbi.org.in |
The recent thrust to infrastructure spending is expected
to boost productivity along with employment. Further, the
opening up of various sectors to FDI will promote greater
competition and productivity.
References
Das Deb Kusum (2014), ‘Productivity Growth in India under
Different Policy Regimes 1980-2012’, Presentation at Third
World KLEMS Conference, Tokyo, Japan, June.
Reserve Bank of India (2014), ‘Estimates of Productivity
Growth for Indian Economy’, KLEMS project report,
http://rbidocs.rbi.org.in/rdocs/PublicationReport/Pdfs/EPGIKLEMS110614, June 11, 2014.
Table II.2 : Financial Saving of the Household Sector |
Item |
Per cent to Gross Financial Saving |
` billion |
2010-11 |
2011-12
(R) |
2012-13
(R) |
2013-14
(P) |
2010-11 |
2011-12
(R) |
2012-13
(R) |
2013-14
(P) |
1 |
2 |
3 |
4 |
5 |
6 |
7 |
8 |
9 |
A. Change in Financial Assets (Gross Financial Saving) |
100.0 |
100.0 |
100.0 |
100.0 |
10,518 |
9,215 |
10,437 |
11,741 |
a. Currency |
13.0 |
11.5 |
10.7 |
8.7 |
1,371 |
1,062 |
1,116 |
1,018 |
b. Deposits |
49.9 |
59.1 |
56.6 |
58.8 |
5,248 |
5,445 |
5,906 |
6,908 |
i) With Commercial Banks |
46.5 |
53.4 |
51.1 |
53.1 |
4,886 |
4,923 |
5,338 |
6,233 |
ii) With Cooperative Banks and Societies |
3.0 |
3.6 |
3.9 |
4.2 |
311 |
336 |
412 |
489 |
iii) With Non-banking Companies |
0.5 |
2.0 |
1.5 |
1.6 |
51 |
186 |
157 |
185 |
iv) Trade Debt (Net) |
0.6 |
0.5 |
0.3 |
0.4 |
68 |
45 |
32 |
48 |
c. Shares and Debentures |
-0.4 |
-0.3 |
4.1 |
2.9 |
-43 |
-28 |
430 |
337 |
of which : |
|
|
|
|
|
|
|
|
i) Private Corporate Business |
0.6 |
0.4 |
0.4 |
0.3 |
68 |
41 |
44 |
31 |
ii) Banks |
0.1 |
0.0 |
0.1 |
0.0 |
8 |
1 |
7 |
5 |
iii) Bonds of Public Sector Undertakings |
0.1 |
0.0 |
0.0 |
0.8 |
8 |
1 |
2 |
92 |
iv) Mutual Funds (including UTI) |
-1.1 |
-1.2 |
3.4 |
1.8 |
-116 |
-106 |
350 |
210 |
d. Claims on Government |
2.7 |
-2.4 |
-0.8 |
0.4 |
287 |
-219 |
-83 |
46 |
i) Investment in Government securities |
0.0 |
0.1 |
0.0 |
0.0 |
3 |
5 |
5 |
4 |
ii) Investment in Small Savings, etc. |
3.4 |
-2.4 |
-0.7 |
0.6 |
361 |
-218 |
-73 |
75 |
e. Life Insurance Funds |
20.0 |
21.3 |
17.3 |
17.0 |
2,101 |
1,958 |
1,803 |
1,996 |
of which : |
|
|
|
|
|
|
|
|
i) Life Funds of LIC and private insurance companies |
19.9 |
21.2 |
17.2 |
16.6 |
2,095 |
1,955 |
1,800 |
1,943 |
f. Provident and Pension Funds |
13.4 |
10.3 |
11.7 |
11.6 |
1,410 |
949 |
1,223 |
1,359 |
B. Change in Financial Liabilities |
|
|
|
|
2,804 |
2,870 |
3,213 |
3,555 |
C. Net Financial Saving of Household Sector (A-B) |
|
|
|
|
7,713 |
6,345 |
7,224 |
8,186 |
R: Revised Estimates. P: Preliminary Estimates.
Note : Components may not add up to the totals due to rounding off.
|
 Gross domestic saving rate declines further in
2012-13
II.1.8 The gross domestic saving rate as per
Central Statistics Office’s (CSO’s) estimates
declined to 30.1 per cent in 2012-13 from 31.3 per cent in 2011-12, mainly on account of a decline in
the rate of household physical savings (Table II.3).
The saving rate dipped to the lowest in the past 9
years and has accentuated macroeconomic
imbalances. The household saving rate had
generally hovered around 23 per cent since 2003-
04. Following a one-off sharp increase to 25.2 per
cent in 2009-10, it declined to 21.9 per cent in
2012-13. This decline was led by a reduction in the
household financial saving rate that dipped sharply
from 12 per cent in 2009-10 to 7.1 per cent in
2012-13.
Agricultural sector rebounds in 2013-14
II.1.9 After a subdued performance in 2012-13,
agriculture emerged as the driver of growth
during 2013-14. The south-west monsoon was
6 per cent above the long period average (LPA) and
the north-east monsoon was 18 per cent above
LPA. As per the Fourth Advance Estimates,
foodgrains production during 2013-14 is placed at
264.8 million tonnes, 3.0 per cent higher than in
2012-13 (Table II.4).
Table II.3: Gross Domestic Savings: Sector-wise |
(As percentage to GDP at current market prices) |
|
Average (2005-06 to 2007-08) |
2008-09 |
2009-10 |
2010-11 |
2011-12 |
2012-13 |
1 |
2 |
3 |
4 |
5 |
6 |
7 |
Gross domestic saving (1+2+3) |
35.0 |
32.0 |
33.7 |
33.7 |
31.3 |
30.1 |
1. Household sector (i+ii) |
23.0 |
23.6 |
25.2 |
23.1 |
22.8 |
21.9 |
(i) Financial saving (Net) |
11.6 |
10.1 |
12.0 |
9.9 |
7.0 |
7.1 |
(ii) Saving in physical assets (Gross) |
11.4 |
13.5 |
13.2 |
13.2 |
15.8 |
14.8 |
2. Private corporate sector (i+ii) |
8.3 |
7.4 |
8.4 |
8.0 |
7.3 |
7.1 |
(i) Joint Stock Companies |
7.8 |
7.0 |
7.9 |
7.6 |
6.9 |
6.7 |
(ii) Cooperative Banks and Societies |
0.5 |
0.4 |
0.4 |
0.4 |
0.4 |
0.4 |
3. Public sector |
3.7 |
1.0 |
0.2 |
2.6 |
1.2 |
1.2 |
Of which: |
|
|
|
|
|
|
a) Government administration (including quasi govt. bodies) |
-0.9 |
-2.8 |
-3.1 |
-0.5 |
-2.0 |
-1.9 |
b) Non-departmental enterprises |
4.0 |
3.3 |
2.8 |
2.8 |
2.9 |
2.8 |
Note : Household financial saving is arrived at by netting out of household’s financial liabilities from their gross investment in financial assets.
Household physical saving is shown in gross terms i.e. inclusive of depreciation.
Source: Central Statistics Office.
|
Table II.4 : Agricultural Production 2013-14 |
(in million tonnes) |
Crop |
2012-13 |
2013-14* |
Percentage Change |
1 |
2 |
3 |
4 |
Foodgrains |
257.1 |
264.8 |
3.0 |
Rice |
105.2 |
106.5 |
1.2 |
Wheat |
93.5 |
95.9 |
2.6 |
Coarse Cereals |
40.0 |
43.1 |
7.8 |
Pulses |
18.3 |
19.3 |
5.5 |
Oilseeds |
30.9 |
32.9 |
6.5 |
Groundnut |
4.7 |
9.7 |
106.4 |
Rapeseed & Mustard |
8.0 |
8.0 |
0.0 |
Soyabean |
14.7 |
12.0 |
-18.4 |
Cotton # |
34.2 |
36.6 |
7.0 |
Jute & Mesta ## |
10.9 |
11.6 |
6.4 |
Sugarcane (Cane) |
341.2 |
350.0 |
2.6 |
*: Fourth Advance Estimates as on August 14, 2014.
#: Million bales of 170 kgs. each.
## : Million bales of 180 kgs. each.
Source: Ministry of Agriculture, GoI.
|
Food security management assumes importance
in the face of a sub-normal monsoon
II.1.10 Though it is still early to assess the
quantum, 2014-15 may not be as favourable for
agriculture growth as last year (see also Box I.1 in
Chapter 1). If managed well, the current stocks of
rice and wheat (63.8 million tonnes at end-July
2014) are adequate to meet food security and buffer
requirements despite a sub-normal monsoon
(Chart II.5). However, it may prove a challenge to
bring down price pressure for perishable food items,
in particular, vegetables and fruits. Further reforms
are necessary covering the entire gamut of food
management. This could cover the unbundling of
functions of the Food Corporation of India (FCI)
and the removal of perishable items from the ambit
of the agricultural produce marketing committee
(APMC) Act, with adequate safeguards to farmers.
The latter will be a significant step towards instilling
competition and price discovery.
Industrial sector contracted in 2013-14
II.1.11 Industrial sector declined during 2013-14.
This was only the third instance since 1951-52,
when the Indian industry recorded contraction, the
previous instances being 1979-80 (during the
second international oil crisis) and 1991-92 (fallout
of the Gulf war and the external payments crisis).
Moderation in demand, both domestic and global,
and rising input costs adversely affected industrial
performance during 2013-14. The contraction in the
industrial sector was reflected in mining and
manufacturing sectors and more than offset strong
growth in the electricity sector. Including 2013-14,
mining sector has contracted for 3 consecutive
years. Contraction in the manufacturing sector
reflected poor investment demand and weakness
in consumer spending.
II.1.12 As per the use-based classification, the
production of capital goods and consumer durables
declined, reflecting subdued investment and
consumption demand (Table II.5). However, the
performance of intermediate goods and consumer
non-durable goods segment improved during the
year.
Table II.5: Index of Industrial Production (IIP) |
(Per cent) |
|
Weight |
2005-06 |
2006-07 |
2007-08 |
2008-09 |
2009-10 |
2010-11 |
2011-12 |
2012-13 |
2013-14 |
Apr-Jun 2014 |
1 |
2 |
3 |
4 |
5 |
6 |
7 |
8 |
9 |
10 |
11 |
12 |
Overall IIP |
100.0 |
8.6 |
12.9 |
15.5 |
2.5 |
5.3 |
8.2 |
2.9 |
1.1 |
-0.1 |
3.9 |
Sectoral Classification |
|
|
|
|
|
|
|
|
|
|
|
Mining |
14.2 |
2.3 |
5.2 |
4.6 |
2.6 |
7.9 |
5.2 |
-2.0 |
-2.3 |
-0.6 |
3.2 |
Manufacturing |
75.5 |
10.3 |
15.0 |
18.4 |
2.5 |
4.8 |
8.9 |
3.0 |
1.3 |
-0.8 |
3.1 |
Electricity |
10.3 |
5.2 |
7.3 |
6.3 |
2.7 |
6.1 |
5.5 |
8.2 |
4.0 |
6.1 |
11.3 |
Use-Based Classification |
|
|
|
|
|
|
|
|
|
|
|
Basic goods |
45.7 |
6.1 |
8.9 |
8.9 |
1.7 |
4.7 |
6.0 |
5.5 |
2.5 |
2.1 |
7.6 |
Capital goods |
8.8 |
18.1 |
23.3 |
48.5 |
11.3 |
1.0 |
14.8 |
-4.0 |
-6.0 |
-3.6 |
13.9 |
Intermediate goods |
15.7 |
6.6 |
11.5 |
7.3 |
0.0 |
6.0 |
7.4 |
-0.6 |
1.6 |
3.1 |
3.1 |
Consumer goods |
29.8 |
10.7 |
16.1 |
17.6 |
0.9 |
7.7 |
8.5 |
4.4 |
2.4 |
-2.8 |
-3.6 |
Consumer durables |
8.5 |
16.2 |
25.3 |
33.1 |
11.1 |
17.0 |
14.2 |
2.6 |
2.0 |
-12.2 |
-9.6 |
Consumer non-durables |
21.3 |
8.6 |
12.3 |
10.2 |
-5.0 |
1.4 |
4.2 |
5.9 |
2.8 |
4.8 |
0.7 |
| Source: Central Statistics Office. |
II.1.13 Industrial output data for Q1 of 2014-15
shows an improvement over the corresponding
period last year. Growth of Index of Industrial
Production (IIP) during Q1 of 2014-15 at 3.9 per
cent is the highest in last 11 quarters. Further, the
acceleration in exports growth is expected to
provide a boost to industrial recovery.
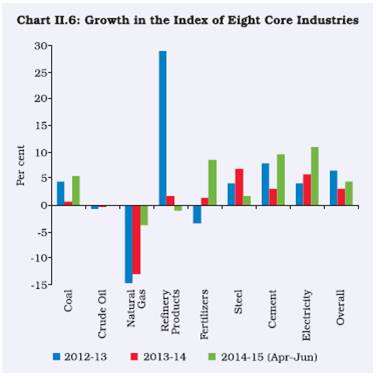
II.1.14 Growth in the eight core industries
decelerated to 3.1 per cent during 2013-14,
compared to 6.5 per cent in the previous year
(Chart II.6). Three consecutive years of contraction
in natural gas production from the KG-D6 block
from 56 mcm/d in 2010-11 to 14 mcm/d in 2013-14
has adversely affected capacity utilisation of gas
based thermal power plants while crude oil
production continued to suffer from ageing oil fields
and delay in the execution of new oil-field projects.
However, electricity generation accelerated during
the year driven mainly by hydel power. Thermal
power generation decelerated during 2013-14.
II.1.15 Growth in the eight core industries growth,
however, improved during Q1 of 2014-15 to 4.6 per
cent from 3.7 per cent in the corresponding period
in the previous year. The turnaround was caused by growth acceleration in the production of coal,
fertilisers, cement and electricity, as also markedly
lower contraction in natural gas output. Growth in
steel and refinery products decelerated.
Slowdown seen in planned corporate investment
amid economic slowdown
II.1.16 Fixed investment plans of the corporate
sector slowed down during 2013-14. The Reserve Bank’s data on the time phasing details of the major
projects, which were sanctioned financial assistance
by banks and other financial institutions or raised
funds through external commercial borrowings
(ECBs)/ foreign currency convertible bonds
(FCCBs) or domestic equity issuances, indicated
that investment intentions of 1,065 companies were
to the tune of `2.5 trillion in 2013-14. This was lower
by 17.9 per cent than the revised estimate for 2012-
13. Investment in 2013-14 was mainly envisaged
in ‘power’, ‘metal & metal products’, ‘textiles’,
‘cement’ and ‘construction’ industries.
 II.1.17 Based on the investment plans up to 2013-
14, the capital expenditure envisaged in 2014-15
aggregated `1.2 trillion, which implies that for
improving the level of aggregate capital expenditure
in 2014-15 from that of 2013-14, a capital
expenditure of more than `1.2 trillion will need to
come from new investment intentions of the private
corporate sector in 2014-15. This could be realised
as forward looking surveys and economic indicators
along with rising business confidence provide hope
that the decline in private corporate investment
could be arrested in 2014-15.
Services sector stayed weak in 2013-14
II.1.18 Growth of services sector during 2013-14
was mainly driven by the sub-sector ‘financing,
insurance, real estate & business services’ which
grew in double digits followed by ‘community, social
& personal services’ (Chart II.7). However, the
construction sector suffered a major setback in the
last 2 years on account of the economic slowdown
(Appendix Table 2). A recovery in domestic services
such as transport, trade and logistics is contingent
upon the recovery of the domestic economy.
II.1.19 Various lead indicators of the services
sector for 2014-15 signal improvement in most
segments except steel consumption and commercial
vehicle sales. Trade and transport related indicators
like cargo handled at ports, foreign tourist arrivals
and civil aviation show improved prospects. However, moderation in steel consumption indicates
a sluggish outlook for the construction sector. Weak
consumer spending on the back of elevated inflation
and interest rates has affected the automobile
sector. However, there has been some pickup in
passenger car sales during May-July of 2014-15.
Persistent efforts to address infrastructural
constraints, though revival remains modest
II.1.20 In the last few years, infrastructure sector
has been experiencing sluggish growth mainly due
to macro economic factors and policy gridlock
coupled with sector specific bottlenecks. However,
over the last one year, the government attempted
several reforms aimed at reviving the sector viz.,
streamlining approvals through the Cabinet
Committee on Investments (CCI), increasing
domestic availability of coal supply through fuel
supply agreements and coal imports at a cost-plus
basis, streamlining coal block auctioning, financial
restructuring of state electricity distribution
companies and gas pricing guidelines. These
supply-side measures have yielded some benefits,
though more efforts will be needed to turnaround
the investment in the sector. Along with supply side constraints, of late, the power sector is also facing
demand side pressures, associated with both slow
growth as well as the financial weaknesses of most
of the state and privately owned electricity
distribution companies, which has made them
reluctant to buy power. This has led to many power
producers operating at sub-optimal capacities. Plant
load factor (PLF) of thermal power plants declined
to 65.6 per cent during 2013-14 from 70.3 per cent
recorded in the previous year, putting pressure on
the profitability of power producers. In addition,
several power projects have been stuck due to
issues such as environment clearances and land
acquisition.
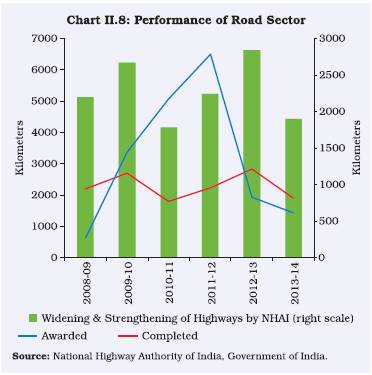
II.1.21 For the last 2 years, the road sector seems
to be experiencing stagnancy. Notwithstanding
several sector-specific measures, the road subsector
failed to attract private investment during
2013-14, partly due to increased leverage of many
construction firms operating in this area and partly
due to difficulties in land acquisition, obtaining
environmental clearances and concerns about the
financial viability of the projects. There were only
few takers for public private partnership (PPP)
projects for roads in 2013-14; less than 1,500 km
was awarded under the engineering, procurement
and construction (EPC) mode. During 2013-14, the
National Highways Authority of India (NHAI)
recorded a growth that was 33.2 per cent lower than
that during the same period in the previous year
with regard to the strengthening/widening of
national highways (Chart II.8). During the current
financial year, the new government has set a target
of 8,500 km of national highway construction; with
the majority to be awarded through the EPC route.
II.1.22 A series of governmental initiatives were
taken in 2013-14 to boost infrastructure investment.
These included establishment of the CCI and the
Project Monitoring Group (PMG) to expedite the
clearance of key mega infra projects, enactment of
new legislation for land acquisition, rehabilitation
and resettlement, treating debts due to the lenders as ‘secured’ loan in the case of PPP projects,
relaxation of external commercial borrowing (ECB)
norms for infrastructure finance companies and
facilitation of infrastructure debt funds (IDFs).
However, these initiatives yielded limited benefits.
Since its inception PMG has undertaken the
resolution of issues pertaining to projects worth
`5.8 trillion. A majority of the projects resolved by
PMG were in the power sector followed by coal
projects and related mainly to fuel supply
agreements. However, as on May 1, 2014, of the
727 central sector infrastructure projects (worth
`1.5 billion and above) monitored by the Ministry
of Statistics and Programme Implementation
(MoSPI), about 39 per cent of the projects were
reported to be delayed and 41 per cent were without
any specific date of commissioning. The cost
overruns of these projects continue to remain high
at 20 per cent.
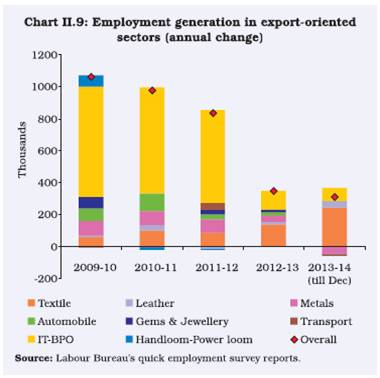
 Employment generation during 2013-14 showed
mixed trends
II.1.23 India being a highly populated developing
economy, employment generation serves as an
important indicator of inclusive and sustainable growth. The quarterly employment surveys
conducted by the Labour Bureau for select exportoriented
sectors reveal that there was a significant
moderation in the rate of employment generation
in 2012-13, though some improvement was seen
in 2013-14. Employment generation in the IT-BPO
sector has been declining over the years while the
textile sector saw an increase, especially in 2013-14
(till December) (Chart II.9). Some private data
sources of employment in the organised sector also
present a mixed picture during 2013-14. The third
Annual Employment-Unemployment Survey for
2012-13 conducted by Labour Bureau showed that
the unemployment rate was 4.0 per cent on UPSS1.
Unemployment rate in urban areas at 5.3 per cent
was higher than 3.5 per cent in rural areas. The
latest Annual Survey of Industries’ (ASI) results
pertaining to 2011-12 indicated that there was a
fall in the growth rate of organised sector employment
in 2011-12 over the previous year.
 Real activity set to improve in 2014-15
II.1.24 Stronger business sentiments, improved
consumer confidence and increased capital inflows
in the recent quarters appears to indicate a start to
a modest recovery in the growth of the economy.
The key priority is to enhance the growth rate of
the economy by addressing structural impediments
that are constraining investment activity in the
economy.
II.2 PRICE SITUATION
Headline CPI inflation moderated during 2013-14
but remains high with pressure from food prices
and other second round effects
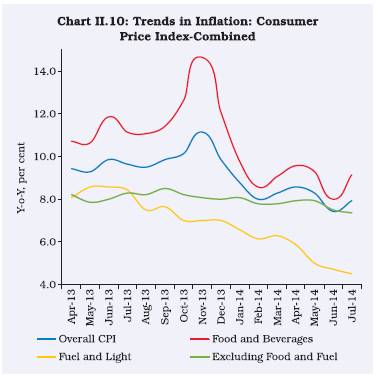
II.2.1 Inflation in terms of consumer price index
(CPI) eased during the period December 2013 to
February 2014, declining to 8.0 per cent after
remaining above 9 per cent for 22 successive
months and touching a high of 11.2 per cent in
November 2013. The moderation in consumer price
inflation resulted from a sharp correction in food
prices. However, the disinflationary momentum has
not gathered strength as decline in food prices was
temporary and second round effects from high food
inflation continue to exert pressures on the general
price level. CPI excluding food and fuel inflation
showed considerable persistence at an elevated
level during H1 of 2013-14, followed by a fall from
8.5 per cent in September 2013 to 7.8 per cent in
March 2014 and further to 7.4 per cent in July 2014
(Chart II.10). This decline in a component that has
exhibited stickiness was supported by a tight
monetary policy stance. Going forward, while
growth revival on a sustainable basis will remain
an objective, inflation risks will need to be factored
in. Given the unsatisfactory progress of south-west monsoon so far and its impact on food prices, as
also risks emanating from potential crude oil price
shocks, upside risks persist to the disinflationary
glide path set out by the Expert Committee to revise
and strengthen the monetary policy framework
(Chairman: Dr. Urjit Patel) (to 8.0 per cent by
January 2015 and 6.0 per cent by January 2016).
 II.2.2 Food and beverages group in CPI, with a
weight of 47.6 per cent contributed more than half
to headline inflation during 2012-13 and 2013-14.
The main contributors to food inflation, however,
changed over time as cereals prices dominated
during 2012-13, whereas it was the spike in
vegetable prices that kept food inflation high during
2013-14. Notwithstanding the pressure from the
food group, the contribution of CPI excluding food
and fuel inflation remained persistent. Monetary
policy response during the second half of 2013-14
was aimed at anchoring inflation expectations and
containing second round impact in the wake of such
persistence. The Reserve Bank increased the repo
rate under Liquidity Adjustment Facility (LAF) by a
total of 75 basis points to 8.0 per cent during
September 2013 to January 2014.
Insights into disinflation momentum since December
2013 suggest more is required to tame inflation
II.2.3 CPI inflation moderated during December
2013-February 2014, driven largely by seasonal
moderation in vegetable prices. CPI-Combined
inflation remained above 8 per cent till May 2014
but declined to 7.5 per cent in June 2014 on account
of favourable base effect. It, however, rebounded
to 8.0 per cent in July 2014 as vegetable prices
went up by 16.9 per cent over the month. Though
some moderation in CPI excluding food and fuel
inflation is visible in recent months, the extent of
moderation warranted by the significant growth
slowdown is yet to manifest in CPI. Such rigidity in
the core component of inflation points to the inertial
nature of inflation feeding into the elevated inflation
expectations, which would necessitate credible
anti-inflationary monetary policy to provide a
nominal anchor and break the inflation persistence.
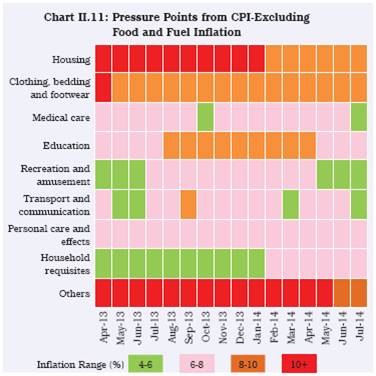
Services led components drive CPI excluding food
and fuel inflation
II.2.4 The stickiness in CPI inflation excluding food
and fuel emanated from the pressures from
housing, transport and communication and services
led components such as medical care, education
and stationery, household requisites and ‘others’
sub-category, which includes charges paid to
barbers, beauticians, washer-men, tailors and ironmen.
High inflation in the services constituents
reflected the role of wage pressures and other
second round effects. The disaggregated data in
this respect suggest that prices of most of the items
grew in a band of 6-8 per cent, while the ‘others’
sub-category grew at more than 10 per cent during
2013-14 (Chart II.11). Inflation in the housing subgroup
declined to 8.9 per cent in July 2014 after
remaining in double digits during 2012 and 2013.
Services inflation starts to taper
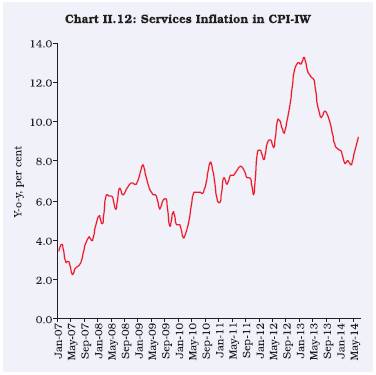
II.2.5 Given that more than 60 per cent of India’s
GDP emanates from services, understanding movements in services prices is critical to gauge
the growth-inflation dynamics. Also, much of the
services are labour intensive and, therefore, the
second round effects from wage-price spiral could
be much stronger in services inflation. The CPICombined
data do not have a separate services
category. However, the miscellaneous sub-category
that largely represents services has shown
considerable inflation persistence. Using the
disaggregated information on 32 individual price
series for services available from CPI-Industrial
Workers (IW), a composite service price index was
constructed to assess the trends in services
inflation. Inflation trends available from this index
indicate moderation in services inflation beginning
March 2013, though its level continues to remain
high at over 8 per cent (Chart II.12).
II.2.6 One key indicator of inflation persistence is
inflation expectations. As highlighted in the report
of the Expert Committee to revise and strengthen
the monetary policy framework (Chairman: Dr. Urjit
Patel), the elevated and entrenched nature of
inflation expectations in India – as measured by the
RBI’s households’ surveys – is likely a key reason why elevated inflation currently co-exists with
negative output gaps. The results of the Inflation
Expectations Survey of Households (IESH) indicate
that household inflation expectations continued to
remain elevated at double digit level during 2013-
14. As per the latest IESH Round 36 (i.e., April –
June 2014), the short-term inflation expectations
in terms of median for next three months moved up
marginally whereas the one-year ahead median
inflation expectations of households decreased
fractionally as compared with the previous quarter.
Also, about 72 per cent (75 per cent in the last
round) and 74 per cent (77 per cent in the last
round) of the respondents expected double digit
inflation rates for three-month ahead and one-year
ahead period, respectively (Box II.3).
 Volatility in inflation pointed to supply side
rigidities
II.2.7 Volatility in prices, especially of select food
items continues to pose a major challenge to
managing inflation. It is observed that since January
2012 both inflation and volatility in vegetable prices
has been the highest across the food items
(Chart II.13). Inflation in the case of cereals, milk, egg, fish and meat remained, on an average, at
double digit level and exhibited low volatility
indicating that the pressures in these commodities
were persistent.
Box II.3
Trends in Inflation Expectations: Evidence from Survey Based Measures in India
Forward looking monetary policy attaches a lot of importance
to inflation expectations as inflation expectations of economic
agents significantly influence their inter-temporal as well as
current economic choices. High inflation expectations could
lead workers to bargain for higher wages, thereby putting cost
pressure on prices leading to high actual inflation resulting in
a wage-price spiral. Monetary policy, by committing to a
credible anti-inflationary stance, endeavours to influence
inflation expectations so that they remain anchored at levels
close to the target/medium term objective (Mohanty, 2012).
Well-anchored inflation expectations imply that inflation
expectations are relatively insensitive to incoming data, i.e.,
the long-run expectation of inflation of public changes little,
in a period witnessing inflation that is higher than their longrun
expectation (Bernanke, 2007). Central banks in most
advanced as well as emerging economies, especially those
which operate with an inflation targeting framework, place
emphasis on assessment and outlook for inflation expectations
in their monetary policy communication.
Unlike the economic variables, inflation expectations are not
directly observable, and therefore would have to be either
derived from other indicators or measured using survey based
methods. From the financial market data, the differential yields
between ordinary and inflation-indexed government bonds of
similar maturity as well as the shape of the yield curve throws
light on the expected rate of inflation. The survey based
approach for measuring inflation expectations could be in the
form of direct survey of households, survey of producers’
outlook on input and output prices or survey of professional
forecasters.
In India, the absence of time series data on inflation indexed
bonds limits the source of information on inflation expectations.
The yield spreads, on the other hand, are influenced by the
outlook relating to government borrowing programme,
statutory g-sec holding requirements on banks and inflation
expectations. Therefore, a lot of emphasis has been placed
on survey based measures of inflation expectations. In the
recent period, the Reserve Bank has been conducting
qualitative and quantitative surveys at quarterly frequency to
assess the inflation expectations for India. These surveys
cover households, producers and professional forecasters.
The Inflation Expectations Survey of Households (IESH)
initiated in September 2005 elicits qualitative and quantitative
responses for three-month ahead and one-year ahead period
on expected price changes. The Technical Advisory
Committee on Surveys constituted in 2009 by the Reserve
Bank regularly deliberates on the concept, methodology and
data quality and suggests methodological improvements in
the survey. It is recognised that inflation expectations of
households are subjective and are based on individual
consumption baskets and hence may differ from the official
inflation numbers released periodically by the government. The households’ expectations are generally observed to be
higher than the official inflation estimates (Chart 1). The nearterm,
i.e., three-month ahead inflation expectations of the
households are believed to be a better indicator of consumer
expectations as compared with one-year ahead expectations,
which have wider variations.
The Reserve Bank has been conducting the survey of
professional forecasters (SPF) since September 2007. The
forecasters provide medium-term (5-year ahead) and longterm
(10-year ahead) quantitative forecasts of inflation. As
the professional forecasters consider all the available
information, both past and future, their expectations could be
considered more rational than that of households.
The professional forecasters survey suggests a fall in the
inflation expectations and the medium-term CPI inflation has
been trending down in the recent period. The 5-year and 10-
year ahead median CPI inflation expectations in the latest
survey round released in July 2014 have fallen to 7.0 per cent
and 6.0 per cent, from 7.75 per cent and 7.0 per cent,
respectively, in the survey round released in January 2014.
Such a fall in long-term inflation expectations augurs well for
the economy at a time when the central bank seeks to build
its credibility in aiming to lower inflation further.
References:
Bernanke, B. (2007). Inflation Expectations and Inflation
Forecasting, Speech delivered at the Monetary Economics
Workshop of the National Bureau of Economic Research
Summer Institute, Cambridge, Massachusetts, July 10, 2007.
Mohanty, D. (2012). The Importance of Inflation Expectations,
Reserve Bank of India Monthly Bulletin, December 2012,
2295- 2303.
Reserve Bank of India (2009). Report of the Technical
Advisory Committee on Inflation Expectations Survey of
Households, Reserve Bank of India Monthly Bulletin, May
2010, 1161- 1226.
II.2.8 Apart from the large volatility, there is also
significant variation in inflation across the states in
the country (Chart II.14). Empirical results suggest
that although over time prices tend to converge
across regions in India, inflation spikes are usually
associated with increase in variability in inflation
across regions pointing to region-specific factors
playing a role (Box II.4).
Box II.4
Regional Inflation Dynamics in India
Given large differences in economic structure in a diverse
country like India, there could be a number of region specific
factors that influence inflation dynamics. Economic literature
has identified several reasons for inflation differentials
among regions within a common currency area (Hendrikx
and Chapple, 2002). Following a food price shock, it is likely
that inflation pressure is more severe in areas where the
share of food in total consumption is high and also in areas
which depend on imports from rest of the country for
consumption. Disparities in the product and labour market
structures could also lead to inflation differentials across
regions. If a country is experiencing a phase of economic
integration between regions within the country, the Balassa-
Samuelson effect could result in inflation differentials as the
productivity differentials between tradable and non-tradable
sectors in a region will lead to inflation pressures. Variation
in transport costs could be another source of inflation
differentials.
Monetary policy is primarily focused on price stability at the
aggregate level, but heterogeneous price movements at the
regional level and inflation differentials could have a
significant impact on monetary policy efficacy. Large inflation
differences can create real interest rate deviations across
regions with uniform nominal interest rate across the country.
If inflation is manifested by demand pressures, this would
imply that the regions with high aggregate demand may
further fuel inflation due to prevailing lower real rate of
interest (Cecchetti et al, 2002). Therefore, regional
dispersion of inflation is an important input that may be useful
in designing the appropriate policy response.
The trends in regional dispersion are analysed using the
data for Consumer Price Index for Industrial Workers (CPIIW),
which give detailed information on price movements
across 78 centres in the country. A plot of the inflation trends in CPI-IW and the regional dispersion in inflation as
measured by the standard deviation indicates that there is
considerable co-movement between the two and most of
the inflation spikes are also associated with increase in
regional inflation dispersion (Chart 1). This shows that region
specific supply and demand factors play a crucial role in
shocks to inflation.
Notwithstanding the disproportionate impact of supply-side
shocks on inflation across regions, an important issue is whether, over the long-run, price levels across regions within
the country converge. The law of one price and product and
factor mobility, over time, should lead to price equalisation
between regions. Empirical evidence in the case of euro
area supports the law of one price. Applying panel unit root
tests on monthly CPI-IW data for India from April 1990 to
January 2014, it is found that the price level deviations from
national average do not have a common unit root. This shows
that, following a deviation from the national average, price
level in a particular region reverts. This implies that the law
of one price holds for India as well and the role of aggregate
demand management policies like monetary policy remains
significant in controlling inflation.
References
Hendrikx, Maarten and Bryan Chapple (2002). “Regional
Inflation Divergence in the Context of EMU,” MEB Series
2002-19, Netherlands Central Bank, Monetary and
Economic Policy Department.
Cecchetti, Stephen G., Nelson C. Mark and Robert J. Sonora
(2002). “Price Index Convergence among United States
Cities”, International Economic Review, Vol. 43, No. 4.
WPI Inflation too showed moderation during
2013-14
II.2.9 Average wholesale price index (WPI)
inflation during 2013-14 at 6.0 per cent was
significantly lower than 7.4 per cent during the
previous year (Chart II.15 and Appendix Table 3).
Whereas inflation in food articles picked up,
inflation in the fuel group remained persistent. The
decline in overall inflation in terms of the WPI was
largely driven by the fall in average inflation in
non-food manufactured products, reflecting weak
pricing power of the Indian corporate. Softer global
commodity prices, especially of metals played a
significant role in keeping inflation low in this
segment. However, on a year-on-year basis, nonfood
manufactured product inflation steadily
edged up from 2.2 per cent in July 2013 to 4.0 per
cent in March 2014 reflecting input cost pressures. Subsequently, it declined to 3.6 per
cent in July 2014.
Administered fuel price revisions reduced
suppressed inflation, but the process remains
incomplete
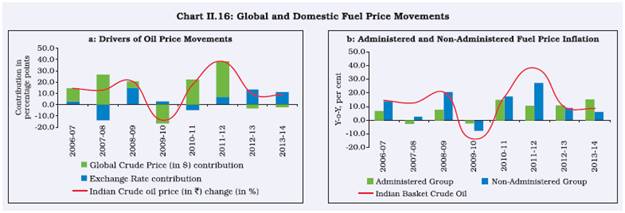
II.2.10 Although international crude prices (Indian
basket) declined by about 2 per cent in dollar terms
in 2013-14 over the previous year, sharp rupee
depreciation since May 2013 and an increase in
international crude oil prices resulted in a rebound
in WPI fuel inflation to double digit level during
2013-14 (Chart II.16). Administered prices were
adjusted in a staggered manner during the course
of the year, especially for diesel. The hike in
electricity prices in August and December 2013
exerted further pressure on the fuel group inflation.
The revision in administered petroleum prices has
caused some reduction in the extent of underrecoveries
of the Oil Marketing Companies (OMCs).
The estimated under-recovery of the OMCs during
2013-14 was high at `1.4 trillion, of which 45 per
cent was on account of diesel. Currently, the OMCs
are incurring daily under recovery of `2.26 billion
(effective August 1, 2014) on the sale of diesel,
PDS kerosene and domestic LPG. Geopolitical
developments in the Middle East and Ukraine
remain an upside risk to global crude prices with
significant implications for inflation and underrecoveries. These will need to be managed by
greater flexibility in domestic prices and adequate
budgetary provisions.
Global inflation remained diverse among advanced
and emerging economies
II.2.11 Globally, inflation pressures vary across
advanced and the emerging economies. In
advanced economies, inflation remained low aided
by range-bound commodity price movements,
large spare capacity and high unemployment
during 2013-14. Emerging market and developing
economies (EMDEs), on the other hand, witnessed
inflationary pressures driven by a weaker exchange
rate and domestic supply side factors. Many central
banks in EMDEs were faced with the trade-off
arising from a combination of slowing economic
growth and stubborn inflationary pressures. In view
of high inflation and exchange rate depreciation,
many central banks in the EMDEs including Turkey,
Ukraine, Russia, Indonesia and Brazil hiked policy
rates. In the case of advanced economies, the US
Fed began tapering in a calibrated manner in view
of a strengthening economic recovery. The
European Central Bank (ECB) introduced negative
deposit rate to encourage bank lending for
business activity.
  Global commodity prices remained range-bound
but exchange rate depreciation during H1 of
2013-14 led to some pass-through effects
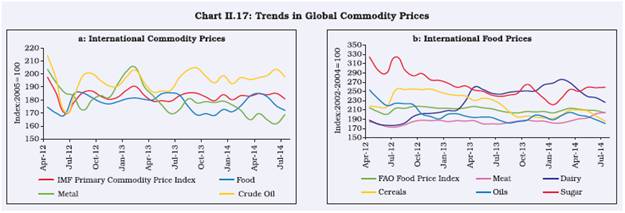
II.2.12 Global commodity prices continued to
soften amid improved supply and weak demand
conditions in 2013-14 (Chart II.17). Global crude
oil prices witnessed some uptick during H1 of
2013-14 driven by supply outages but declined in
H2 of 2013-14 on account of easing supply
concerns and tepid demand conditions. Metal
prices edged down in 2013-14 aided by surplus
supplies and slowing demand in emerging
economies, particularly in China and India. The
Food and Agriculture Organisation (FAO) food price
index declined by 1.6 per cent in 2013 as large
supplies pushed down the international prices of
commodities such as cereals, oils and sugar.
II.2.13 Global commodity prices, especially of
crude oil have remained volatile in 2014-15 so far
on account of factors including supply disruptions
from Libya, the Ukraine crisis and political
developments in Iraq. Brent crude oil spot prices
averaged US$111.9/barrel in June 2014 but
improved supply prospects in Libya led to
subsequent correction in Brent crude oil prices to
below US$104 per barrel in early-August 2014.
Further, sustained softer prices of non-oil
commodities, especially metals offset some of the
inflation risks. Weather-related concerns and
increased geopolitical tensions have caused global
prices of some cereals, especially wheat, maize
and barley to firm up during February-April 2014.
Inflation expected to be range-bound during
2014-15 but risks remain
II.2.14 The pick-up in CPI inflation after significant
moderation during December 2013-February 2014,
especially in July 2014 driven by shocks to food
prices indicates that the concerns on inflation are
far from over. The unsatisfactory progress of southwest
monsoon so far could further exacerbate
pressures on food prices as is evident from the
spikes witnessed in prices of certain vegetables
such as tomato. Such pressures could drive inflation
expectations up, necessitating policy actions to
contain inflation and mute the second round effects
unless supply side actions mitigate price pressures.
Global commodity prices may remain range-bound,
but pressure on crude oil prices from geopolitical
tensions, especially in Iraq could be a major upside
risk. With the marked reduction in external sector
risks that have imparted stability to the rupee
exchange rate, the likelihood of exchange rate
pass-through pressures on domestic inflation have
receded. However, administered price revisions,
particularly in the case of fuel will need to continue
in order to reduce the fiscal burden, which will also
add some upside pressures on prices in the nearterm.
Over the medium term, however this will help
lower inflation and inflation expectations. The
persistence of negative output gap despite a fall in
potential output growth should support the
disinflation momentum going forward.
II.3 MONEY AND CREDIT
Tapering signal posed challenges to conduct of
monetary policy in H1 of 2013-14
II.3.1 The monetary policymaking during 2013-14
can be demarcated into three distinct phases. The
easing cycle that began in January 2012 was
followed by a 125 basis points (bps) reduction in
the repo rate during April 2012 to May 2013. This
phase was interrupted by large and sudden capital
outflows. The trigger for such huge volumes of
outflows emanated from the May 2013
communication by the US Fed regarding the
possible tapering of its quantitative easing (QE) in
the following months. Uncertainty about the timing
and quantum of the tapering led to large capital
outflows from emerging market and developing
economies (EMDEs), particularly those with high
current account deficits (CAD) and high inflation,
including India.
II.3.2 EMDEs had to actively tighten their
monetary policy stance so as to stem capital
outflows and also rely on foreign exchange
interventions. The anticipated impact of QE
tapering on global liquidity, withdrawal of crossborder
capital flows and their effect on asset prices
put downward pressure on the rupee, especially
in the presence of a large and unsustainable CAD.
Monetary policy challenges from spillovers were
not unique to India; significant contagion felt across
EMDEs
II.3.3 The monetary policy of central banks in
large advanced economies (AEs) spilling over to
emerging markets were evident from the
developments during 2013-14. The experience of
such spillovers provides a rationale for greater
policy coordination in this arena (Box II.5).
II.3.4 Facing risks of currency turmoil that could
spill over to various forms of macro-financial stability and endanger growth over the medium
term, the Reserve Bank gave priority to stabilisation
of the rupee. In this the second phase, it effected
a 200 bps hike in the Marginal Standing Facility
(MSF) rate in July 2013 among other measures
(see Box III.2, Chapter 3 for chronology of events),
thereby increasing the spread between the repo
and the MSF rates to 300 bps. With the MSF rate
acting as the effective policy rate, the cost of money market funds in the economy increased significantly.
Caps on access to the LAF window and an
increased average daily CRR requirement (initially
to 99 per cent from 70 per cent, and thereafter to
95 per cent) contributed to the tightening domestic
liquidity situation and increasing the cost of
speculation (Chart II.18a). Increasing domestic
interest rates was important to prevent narrowing
of the spread that could have accelerated debt outflows given that FII debt flows are found to be
particularly sensitive to monetary policy variables
(see Box II.6).
Box II.5
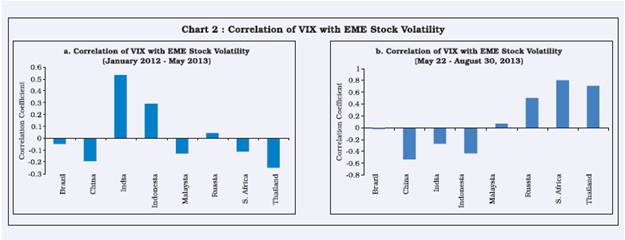
The risks from exiting unconventional monetary policies for emerging markets
Spillovers from the unwinding of unconventional monetary
policies of the US Fed to the emerging markets economies
(EMEs) occurred in significant intensity during 2013-14.
Empirical evidence from the in-house research work in the
Reserve Bank suggests a clear relationship between the US
VIX and the volatility in various financial markets in EMEs,
including India. US VIX is a widely tracked measure of volatility
in the US equity markets.
Unconventional monetary policy generally refers to nonstandard
monetary measures. These measures include
large-scale asset purchase programmes (LSAPs) also
known as quantitative easing (QE) that change the size and
composition of a central bank’s balance sheet, such as
through purchasing less credit worthy, illiquid private sector
securities. It also includes forward guidance provided by the
central banks to move expectations on long-term interest
rates. For all practical purposes, even the policy rates at or
near zero lower bound (ZLB) of nominal interest rates
constitute unconventional measures. The Bank of Japan has
resorted to QE since 2001. Since 2008, it has been joined
by the US Fed and the Bank of England in resorting to a
significant dose of unconventional monetary policy
measures.
In 2013-14, a mere indication by the Fed on tapering of the
QE resulted in stronger spillovers to EMEs. The response to
the actual tapering under which the US Fed has reduced its
QE asset purchases from US$85 billion a month to US$25
billion so far (up to August 2014) was relatively muted.
However, risks of further spillovers remains if the US monetary
policy tightening cycle takes an uncertain turn or significant
tightening occurs in a relatively short span. In the past, several
but not all of these tightening cycles have witnessed a
significant impact on bond yields, currencies and equities in
global financial markets.
In February 1994, when the Federal Open Market Committee
(FOMC) indicated the start of the tightening, Federal funds
rate rose by 300 bps in a year. There was a severe negative
reaction in bonds in both AEs and EMEs, though in the case
of equities it were essentially the EMEs equities that got
battered. The spillovers also resulted in the occurrence of the
Mexican peso crisis of 1994-95. The EMEs bond market
spreads over US treasuries reached a high, up to 1500 bps
in some cases at that stage. Regarding the spillovers from
the tapering in 2013, Eichengreen and Gupta (2013) indicated
that the largest impacts of the tapering were felt by countries that allowed exchange rates to run up in the earlier period in
expectation of continuous Federal Reserve’s easing.
Countries with larger markets experienced more depreciation
pressures and macroeconomic fundamentals like budget
deficit, public debt, level of reserves and GDP growth rates
which provided little insulation to countries that came under
depreciation pressure during the summer of May 2013.
Besides currency depreciation pressures, financial market
volatilities resulting from the QE taper have been a major
concern in the policy arena especially for emerging market
economies (EMEs). Following literature on clustering of
financial markets volatility, an augmented GARCH(1,1) model
was used to model the daily volatility of stock market returns,
percentage change in the exchange rate (USD as the base
currency) and changes in benchmark (10-years) yield for
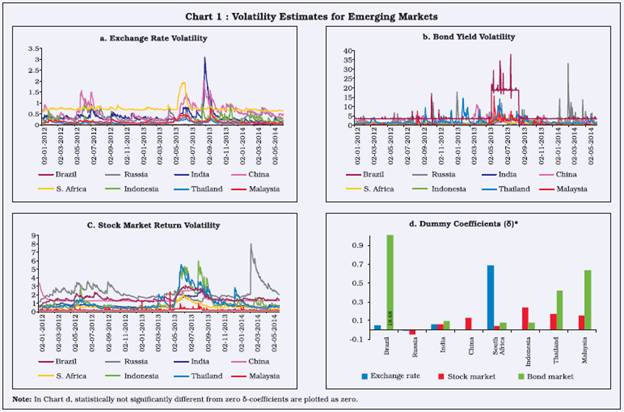
BRICS and a set of Asian emerging markets.
These estimations use daily data from January 2012 to May
2014. A dummy variable that takes value one for Fed’s
tapering talk, that is, May 22, 2013 to August 2013 otherwise
zero was introduced in the volatility equation. The estimated
conditional variance series are given in Chart 1.
The GARCH volatility estimates in most of the emerging
market countries indicate a spillover in currency, bond and
equity markets of the Fed’s tapering talk during May to August
2013. Uncertainty about the magnitude of the taper and fears
of future rate hikes led to the withdrawal of capital flows from
emerging markets in this period. The estimated dummy
variable coefficients were mostly significant and positive,
indicating that the increase in volatility in the EMEs was due
to the uncertainty surrounding the possibility and magnitude
of QE withdrawal.
Rey (2013) in her Jackson Hole paper emphasised the role
of a global financial cycle in capital flows, asset prices and
credit growth, which co-moves with the VIX. Her central
argument is the existence of the ‘irreconcilable duo’ rather
than the ‘impossible trinity’, implying that independent
monetary policies are only possible with managed capital
accounts. The paper adds that one of the policy options to
cope with the dilemma is to act on the policies of a large
source country that generates these cycles (such as that from
QE). However, these source countries are unlikely to agree
to this. To further examine Rey’s proposition during the tapering of QE, an analysis of the US-VIX and the estimated
GARCH volatility for the 8 emerging stock markets (including
BRICS) indicate changes in the correlations during the taper
announcement period. Chart 2 plots the changes in magnitude
and signs of stock market volatility correlation during the Fed
tapering talk (May-August 2013) indicating the impact of
tapering on emerging stock markets.
  Rajan (2014) has pointed out that the current ‘non-system’ in
international monetary policy as a source of substantial risk,
and argued for more consideration by source countries to the
effect that their policies will have on other countries. The
adverse effect of such a feedback loop might be minimised
by greater coordination among systemically important central
banks, multilateral arrangements for liquidity provision, better
micro-prudential measures, or independent assessors who
could analyse such policies and come to a judgement on
whether they follow the rule of the game. These measures
could minimise the snowballing of adverse feedback spillovers
of QE-withdrawal taking the locus towards a globally optimal
monetary policy framework. While international monetary policy coordination where AE central banks prepare the
markets and allow gradual adjustments remains the first best
policy choice, EMEs domestic policy responses will need to
gear up to convince markets on stable inflation, smooth
exchange rate adjustments and effective micro and macroprudential
policies.
References:
Eichengreen, Barry and Poonam Gupta (2014), ‘Tapering talk:
the impact of expectations of reduced federal reserve security
purchases on emerging markets’, Policy Research Working
Paper Series 6754, The World Bank.
Rajan, Raghuram G. (2014), ‘Competitive monetary easing:
is it yesterday once more?’, RBI Monthly Bulletin, 1-12,
available at: http://www.rbi.org.in/scripts/BS_SpeechesView.aspx?Id=886
Rey, Helen (2013), ‘Dilemma not Trilemma: The global
financial cycle and monetary policy independence’, Paper
presented at the 25th Jackson Hole symposium, Wyoming,
August.
Monetary and liquidity conditions re-calibrated to
address rising inflation challenges in H2 of 2013-14
II.3.5 While the pressures on the exchange
market were effectively managed by timely
measures including the forex swap facility for banks
and oil companies, their gradual withdrawal and
the calibrated normalisation of the interest rate
corridor helped restore stability to the financial
markets. However, increasing inflationary pressures
and the possible impact on the long term valuation
of the rupee, warranted a shift in the policy stance
beginning October 2013. In view of the upturn in
inflation and elevated inflation expectations and in
order to avert the adverse impact of low real rates
on financial savings, the Reserve Bank raised the
repo rate by 50 bps during September-October
2013 even as the MSF rate was lowered so as to
restore the interest rate corridor spread to 100 bps.
II.3.6 In order to rebuild buffers in the face of
uncertainty regarding the global interest rate cycle
and financial conditions, the Reserve Bank offered
a forex swap window (September 4-November 30,
2013) for banks’ overseas borrowing and nonresident
deposit (FCNR(B)) funds, resulting in
capital inflows in excess of US$ 34 billion through the swap facility. These facilities not only proved to
be timely in strengthening external resilience but
also helped in easing domestic liquidity significantly,
which was reflected in under-utilisation of limits by
the banks under overnight LAF repo and export
credit refinance (ECR), a steady decline in access
to MSF and the parking of excess liquidity with the
Reserve Bank through reverse repos.
II.3.7 In order to prevent liquidity tightening
measures from adversely impacting financing
conditions and with a view to keeping a check on
the long-term interest rates in the system, the
Reserve Bank conducted OMO purchase auctions
that led to net liquidity injection to the tune of about
`520 billion during the year in addition to injection
under LAF and MSF. Although access to overnight
liquidity through LAF was restricted, variable rate
term repos were introduced with 7 and 14 day
tenors.
II.3.8 However, the build up of large surplus cash
balances of the government with the Reserve Bank
up until the interim budget (February 2014) caused
the liquidity situation to tighten again. Despite the
subsequent spending by the government, the yearend
pressures on liquidity on account of annual
closure of bank accounts caused the net recourse
to LAF (including term repo and MSF) to shoot up
to around `2 trillion at the end of the year
(Chart II.18b). During 2014-15 so far, liquidity conditions have remained broadly stable barring
intermittent tightening of liquidity conditions on
account of build up of government cash balances
maintained with the Reserve Bank.
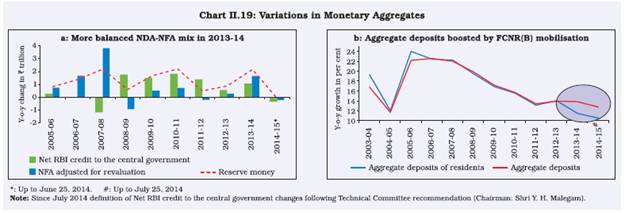
Enhanced liquidity injection, revaluation gains lead
to more balanced net domestic assets (NDA)-net
foreign assets (NFA) led expansion in monetary
aggregates
II.3.9 Following inflows under swap facilities, the
increase in reserve money during 2013-14 was
supported by a more balanced NDA-NFA mix as
compared with the skewed trend in recent years
on the sources side (Chart II.19a).
II.3.10 The broad money growth remained largely
in line with the indicative trajectory of 13 per cent
for 2013-14. However, netting out the impact of the
flows into FCNR(B) deposits through the forex
swap facility, the growth in aggregate deposits of
residents was lower at around 11 per cent and the
corresponding resident money growth (NM3) was
also lower. Near static deposit rates have also
dampened the pace of deposit mobilisation
(Chart II.19b).
II.3.11 Scheduled commercial banks (SCBs’)
credit off-take and deposit growth at around 14 per
cent in 2013-14 remained comparable to that in
2012-13. The closing of the gap between credit
and deposit helped reduce the pressure on liquidity.
Uncertainty, slowdown and banking sector asset
quality remain a drag on credit off-take
II.3.12 In line with the cyclical downturn, the
banking sector has been passing through a
challenging phase with deterioration in asset
quality, increased provisioning requirements and
decelerating profitability indicators. These factors
have contributed to increased risk aversion,
affecting credit off-take adversely. Although the
gross NPAs to the gross advances ratio has
increased y-o-y, especially in public sector banks,
the pace of growth in NPAs has moderated recently,
though it is too early to be confident that the worst
is over (See Table VI.2 for banking asset quality
indicators).
Non-food credit growth led by services, personal
loans
II.3.13 The y-o-y credit growth to the industrial
sector moderated during 2013-14 to 13.1 per cent
as compared to 15.1 per cent in the previous year.
Deceleration in credit growth was observed
particularly in mining, chemicals, cement and
textiles. However, credit flow was higher in
construction, rubber and plastic, leather and paper.
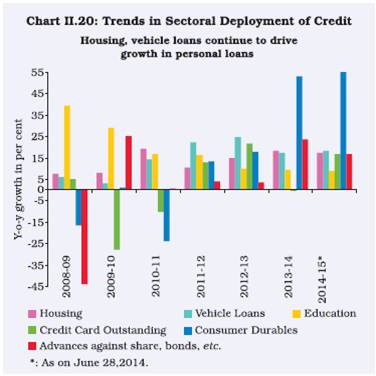
II.3.14 The y-o-y credit growth in services and
personal loans was at around 16 per cent. While
personal loans continued to be led by housing and
vehicles there was a significant pick-up in consumer durables and advances to individuals against
shares and bonds (Chart II.20).
  II.3.15 Monetary and liquidity policies in 2013-14
were shaped by twin risks emanating from external
vulnerability and domestic inflation pressures amid
downward sticky inflation expectations. While the
monetary policy measures along with external
sector measures helped in containing external
sector risks in the near-term, inflation remains a
major threat in achieving sustainable growth and
currency stability. The Reserve Bank increased the
repo rate in January 2014 to control inflation,
anchor inflation expectations and mute their
second round effects in line with the disinflationary
path as recommended by the Expert Committee
to Revise and Strengthen the Monetary Policy
Framework. Further, in pursuance of the committee’s
recommendation to de-emphasise overnight
‘guaranteed-access’ windows for liquidity
management and progressively conducting
liquidity management through term repos, the
Reserve Bank reduced access to overnight repos
under LAF while compensating with a commensurate
expansion of the market’s access to term repos
from the Reserve Bank to improve the transmission
of policy impulses across the interest rate spectrum.
II.4 FINANCIAL MARKETS
Global financial markets continue to be liquidity
driven, withstand the US taper and Ukraine crisis
II.4.1 The year was marked by a spell of sharp
increase in financial market volatility since May
2013 and a subsequent fall since September 2013.
The US taper indication impacted the Indian
financial markets, however, rebuilding buffers by
the time the actual taper and the Ukraine crisis took
place helped contain spillovers. While the
unexpected strife in Iraq appears manageable so
long as geopolitical uncertainties do not extend to
the south of Iraq or the rest of the region, its
ramifications are still unfolding and continued
vigilance is warranted.
II.4.2 Overall, policy rate hikes by emerging
market and developing economies (EMDEs) helped
maintain the large bond interest rate spreads with
advanced economies (AEs), thus helping to stem
outflows. After initial volatility, markets stabilised
both in AEs and EDMEs. In the face of low growth
and inflation and the prevailing easy monetary
conditions in the AEs, the prices of riskier assets
such as equity rose further in 2013-14, while bonds
rallied as fears of imminent exit from accommodative
monetary policies receded.
II.4.3 Although uncertainties about possible
increases in policy rates in AEs, the on-going Iraq
crisis and the slowdown in the Chinese economy
persist, the measured and predictable pace of the
US tapering programme, optimism in developed
markets and policy commitments for supporting
economic growth in the euro area have calmed
financial markets. A number of equity markets
including those in the US, Europe and EMDEs have
recorded historical highs during 2014-15 so far.
Driven by investors’ search for yield, carry trade
flows to EMDEs remained large, but exhibited a
downward trend aided by some unwinding during
May-June 2014 (Chart II.21).
Global asset prices factor low risk premium
II.4.4 The recent surge in global equity markets
has come amidst low global growth and inflation
and slower earnings growth particularly in the US,
suggesting that equity markets are pricing assets
with a very low risk premium. With economic growth
in the US and the UK expected to improve in the
near future, there is a risk that central banks may
start increasing policy interest rates earlier than
what was previously assessed. Irrespective of
whether this happens or not, markets may start
pricing rate hikes, which in turn may lead to
increased uncertainty and higher volatility. Further,
an increase in interest rates in the US may trigger
a reversal in carry trade flows to EMDEs leading to
higher volatility in the forex, equity and bond
markets (Box II.6).
Indian markets price increased risks in H1 followed
by quick risk containment in H2 of 2013-14
II.4.5 During 2013-14, the Indian financial markets
were marked by periods of intense volatility,
particularly during May-August 2013 (accompanying
taper related announcements). As bond yields in
the AEs, particularly the US, rose sharply, the attractiveness of their fixed income securities
vis-à-vis those of the EMDEs improved and
triggered large-scale sell-offs in domestic financial
markets by foreign institutional investors (FIIs),
causing intense volatility. Weak macroeconomic
fundamentals added to the volatility in the Indian
markets, but the impact was largely in line with that
of other EDMEs. Opening of forex swap windows
combined with restrictions on gold imports restored
confidence in the markets immediately. In addition,
exceptional liquidity measures to contain volatility
and their quick withdrawal helped restore stable
market conditions in a sustainable way by September
2013 (see also Section II.3 and Chapter 3).
Money market rates stay firm
II.4.6 Money markets tracked the liquidity
conditions and policy rates adjustments during the
year. The marginal standing facility (MSF) rate
became the effective policy rate after the Reserve
Bank placed a cap on the amount provided under
the repo window of the liquidity adjustment facility
(LAF) as part of the tightening measures to manage
exchange rate volatility during July-September
2013. Thereafter, the call rate generally moved within the corridor set by the reverse repo and MSF
rates as the Reserve Bank introduced auctionbased
variable rate term repo to ensure adequate
liquidity (Chart II.22). The weighted average call
and collateralised borrowing and lending obligation
(CBLO) rates increased to 9.97 per cent and 9.90
per cent respectively in September 2013 from 7.76
per cent and 7.36 per cent respectively in July 2013.
However, a calibrated unwinding of exceptional
monetary measures during September-October
2013 coupled with easing liquidity conditions on the
back of large capital inflows under the forex swap
facilities contributed towards the softening of money market rates and led to the restoration of stable
conditions in the market. During 2014-15 so far, the
money market has remained orderly with the rates
moving within the corridor set by the reverse repo
rate and the MSF rate.
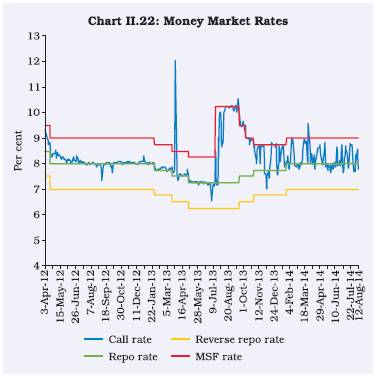 II.4.7 The average fortnightly issuance of
certificate of deposits (CDs) and commercial papers
(CPs) decreased in 2013-14 (Chart II.23). The
weighted average effective interest rate (WAEIR)
of aggregate CD issuances increased to 9.74 per
cent at end-March 2014 from 9.24 per cent at end-
March 2013. The weighted average discount rate
(WADR) of CPs increased to 9.92 per cent at end-
March 2014 from 9.77 per cent at end-March 2013.
However, reflecting easing short term liquidity
conditions, both CD and CP rates decreased to
8.69 per cent in July 2014.
G-sec yields rose during 2013-14, while the yield
curve remained flat with inversions at few maturities
II.4.8 G-sec yields softened in the early part of
the year reflecting some moderation in domestic
inflation and easing of global commodity prices.
The 10-year generic yield touched a low of 7.12
per cent on May 24, 2013 compared with 7.99 per
cent at end-March 2013. However, following the
tapering indication by the US Federal Reserve (Fed)
and the subsequent monetary and liquidity
tightening measures announced by the Reserve
Bank, the yields firmed up. The 10-year generic yield peaked at 9.27 per cent on August 19, 2013.
However, yields softened thereafter on the back of
open market operation (OMO) purchases in August
2013 and on gradual unwinding of exceptional
measures to tighten liquidity. Subsequently,
relatively higher government borrowings and
continued monetary tightening with a view to
containing inflation capped the downward
movement. The 10-year generic yield closed the
fiscal year higher at 8.84 per cent.
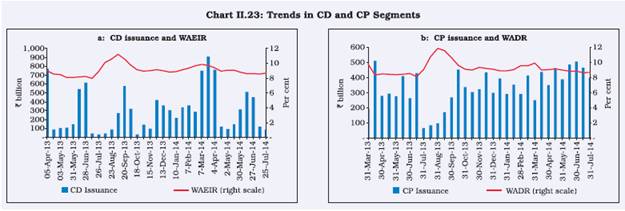
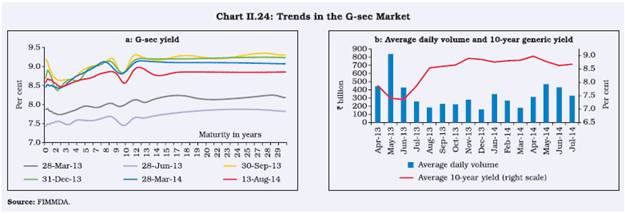 II.4.9 Yields have softened during 2014-15 so far
reflecting easing of the US treasury yields, active
buying by institutional investors, moderation in
inflation, improvement in the fiscal situation and
growing positive market expectations about
government policy after the general elections. The
gains had, however, been negated to an extent in
June 2014 due to growing geopolitical tension in
the Gulf region. The 10-year generic yield stood
lower at 8.55 per cent on August 13, 2014 vis-a-vis
its level at end-March 2014. The yield curve
flattened at the longer end as compared to the
previous year and the average volume generally
varied inversely with the movement of the 10-year
G-sec yield (Chart II.24).
Liquidity in the secondary market has improved in
recent years
II.4.10 Liquidity in the secondary market for G-secs
has improved considerably in recent years. The annualised turnover ratio of outright transactions in
the central G-secs has increased. The issuance
strategy during the past focused on building
volumes under benchmark maturities with a view
to improving secondary market liquidity. The
Reserve Bank has developed an interest rate
derivative market for making the debt market more
vibrant and liquid. The re-launch of interest rate
futures (IRFs) on a cash settled basis in December
2013 will further augment secondary market activity.
Exchange rate pressures contained in the year,
recent appreciation reflects market optimism,
stronger fundamentals
II.4.11 The Rupee came under severe pressure
after the signalling of tapering of quantitative easing
by the US Fed in May 2013, reaching an all-time
low of `68.36 (RBI reference rate) against the US$
as on August 28, 2013. The Rupee began its
recovery thereafter responding to the measures
taken by the Reserve Bank and the government
and a contraction in current account deficit (CAD).
It moved in a range of `60.1 to `63.0 during Q4 of
2013-14 and appreciated further in Q1 of 2014-15.
A cross-country comparison shows that the Rupee
performed better than some other peer economies
(Table II.6).
FII flows into India remain volatile
II.4.12 During 2013-14, capital inflows through
foreign institutions remained highly volatile. The tapering announcement by the US Fed in May 2013
led to heavy outflows by FIIs from equity and debt
markets, aggregating to around US$ 13 billion till
August 2013 (Box II.6). However, flows to the equity
segment turned positive in September following
policy initiatives, and remained positive thereafter,
boosting equity indices, except for a marginal
outflow in January 2014 when the US Fed actually
commenced a reduction in asset purchases. FII
flows in the debt segment, however, continued to
remain volatile (Chart II.25).
Table II.6: Movements in Cross-Country
Exchange Rates against the US dollar |
(Per cent) |
|
End-Aug
2013 over
end-Jun
2013 |
End-Dec
2013* over
end-Aug
2013 |
Aug 12, 2014
over
end-Dec
2013* |
1 |
2 |
3 |
4 |
Argentine Peso |
-5.0 |
-13.1 |
-21.1 |
Brazilian Real |
-7.3 |
0.2 |
3.3 |
Chinese Yuan |
0.1 |
1.1 |
-0.8 |
Euro |
1.2 |
4.1 |
-3.2 |
Indian Rupee |
-10.3 |
7.4 |
1.3 |
Indonesian Rupiah |
-9.1 |
-10.6 |
4.5 |
Malaysian Ringgit |
-3.7 |
0.2 |
3.1 |
Mexican Peso |
-2.4 |
2.1 |
-0.6 |
Russian Rouble |
-1.6 |
1.6 |
-9.3 |
South African Rand |
-3.1 |
-1.6 |
-1.6 |
South Korean Won |
3.5 |
5.2 |
2.4 |
Thai Baht |
-3.0 |
-2.3 |
2.3 |
Turkish Lira |
-5.3 |
-4.1 |
-1.6 |
| *: Data for end-December 2013 pertain to December 30, 2013. |
Domestic equity market indicators improved; some
sector-specific indices outperformed the broader
indices
II.4.13 The equity market remained subdued during
May-August 2013, but started recovering following
a number of reform measures announced since
September 2013. During H2 of 2013-14, the BSE
Sensex and the NSE Nifty recorded gains of 20.2 per cent and 22.5 per cent, respectively on
expectations of formation of a stable government
after the Lok Sabha elections in May 2014. Better than expected earnings results of some blue chip
companies, revival of FII inflows and announcement
by the US Fed to maintain adequate liquidity in the
system also aided market sentiment. Except for a
brief spell in January 2014, when the domestic
equity market recorded correction amidst the US
Fed’s reduction of asset purchases and eruption of
a political crisis in Ukraine, the markets continued
their upward trend. Among the sectoral indices,
BSE capital goods, BSE auto, BSE IT, BSE
healthcare and BSE teck outperformed the
benchmark index during 2013-14, while broader
indices such as BSE 100 and BSE 500 underperformed
(Chart II.26).
Box II.6
Understanding Foreign Institutional Investor Debt and Equity Flows in India
Concerns about portfolio flows from foreign institutional
investors (FIIs) centre around the destabilising effects of ‘hot’
money inflows during boom periods followed by retrenchment
in crises. These concerns have led policy makers around the
world to consider restrictions on FII flows, especially in times
of macroeconomic stress. A recent Centre for Advanced
Financial Research and Learning (CAFRAL)-Reserve Bank
study on FII flows into the debt and equity segments of the
Indian capital market during 2006 to 2014 has found that:
there is moderate correlation between flows into equity
and debt and the correlation is indistinguishable from zero when purged of common economic drivers. Flows in the two
segments share relatively few common co-determinants
apart from past exchange rate movements. Neither equity
nor debt flows Granger cause the other.
Past depreciation of the Rupee and other emerging market
flows explain equity flows while domestic monetary variables
such as interest rates and term spreads, besides Rupee
depreciation drive debt flows (Chart 1 and 2). Impulse
response functions suggest that most economic effects on
equity flows decay within 1-3 months in a roughly exponential fashion. For debt markets, positive shocks to domestic term
spreads and past bond returns result in FII inflows, while
positive shocks to inflation and other emerging market flows
lead to FII outflow.
Past stock market returns were found to be the main drivers
of sharp spikes in flows, especially reversals in equity
markets. Few variables explain surges, while negative
stock returns, higher treasury bill yields and a more upward
sloping term structure influence equity reversals.
Spikes in FII flows in the debt market are influenced
by domestic interest rates, term structure and partly by
exchange rates, indicating that even domestic monetary
variables matter for debt market inflows (see also
para II.3.4). Sharp retractions in flows, particularly debt
flows, followed the US talk of tapering of quantitative easing.
The results suggest that the US monetary policy spillover is
transmitted internationally and one channel is through the
markets for sovereign debt.
II.4.14 During 2014-15 so far (up to August 13,
2014), both the BSE Sensex and the S&P CNX
Nifty have increased by 15.8 and 15.4 per cent,
respectively on account of buying by FIIs following
the formation of a stable government at the centre
and initiation of various economic reforms, good quarterly earnings results by major companies,
improvement in macroeconomic indicators and
positive global cues due to easing of geopolitical
tensions and crude oil prices.
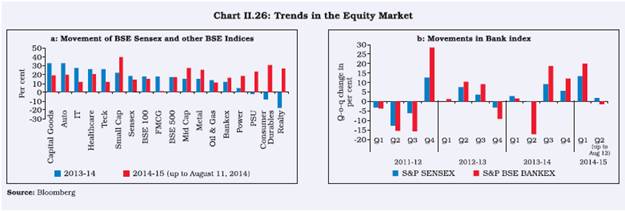 II.4.15 Concerns over the asset quality of banks
and corporate governance arising from ownership
structures of public sector banks, amongst other
things have contributed to the low performance of
the BSE Bankex since end-March 2013. However,
recent regulatory initiatives and reform measures
have helped its recovery and it has continued to outperform the benchmark index since H2 of 2013-
14. The global crisis highlighted the risks of
contagion from bank balance sheets across
countries and called for higher standards in
regulation to check system-wide stability issues
with particular attention to the banking industry.
Taking a cue from the crisis, regulatory capital has
been beefed up across countries including in India.
Nonetheless, the dynamic global developments call
for a more robust institutional structure for the
banking industry (Box II.7).
Box II.7
Structure of the Banking Industry – A Global Perspective
It is important to review the banking structure in India with a
view to enabling it to cater to the needs of a growing and
globalising economy as well as furthering financial inclusion.
The global financial crisis of 2008 prompted many economies
to review their banking structures.
Recently, based on its own research, the World Bank (2013)
espoused a balanced view on the debate on state
involvement in financial sector in the aftermath of the crisis.
It argued that evidence suggests that the state needs to
encourage contestability through healthy entry of wellcapitalised
institutions and timely exit of insolvent ones.
While the crisis may have fuelled criticisms of ‘too much
competition’ in the financial sector, leading to instability,
research suggests that factors such as a poor regulatory
environment and distorted risk taking incentives promote
instability rather than competition itself.
Other empirical studies suggest that the banking structure in
a country evolves in response to the quantum and types of
demand for banking services. These demands, in turn,
depend on the country’s economic, demographic and
geographical features.
In this backdrop, it is important to consider India’s banking
structure with a cross-country comparison based on some
banking indicators (Table 1). These indicators capture size,
inclusiveness, ownership pattern, concentration and
soundness.
While the Indian banking sector compares favourably in
terms of a low concentration ratio and the reasonable
soundness indicators, it has some distance to cover in terms
of inclusiveness, efficiency, size and ownership. The public
sector owns a disproportionately large share of the total banking industry, thus diluting the advantage of low
concentration. NIMs are also high in the face of low
competition and come in the way of efficiency.
Table 1: Structure of banking industries across select economies |
Country |
Advanced economies |
Emerging market and developing economies |
Denmark |
France |
Germany |
Italy |
UK |
USA |
Brazil |
China |
India |
Russia |
South Africa |
1. No. of banks (per 100,000 persons) |
2.2 |
1.1 |
2.3 |
1.3 |
0.5 |
2.1 |
0.1 |
0.02 |
0.01 |
0.7 |
0.1 |
2. Banking assets as per cent of GDP |
245.0 |
368.0 |
124.0 |
204.0 |
607.0 |
84.0 |
105.0 |
189.0 |
80.0 |
75.0 |
130.0 |
3. No. of bank branches (per 100,000 adults) |
38.7 |
41.3 |
15.5 |
66.0 |
24.2 |
35.2 |
45.5 |
- |
10.5 |
36.8 |
10.5 |
4. % of public sector in banking assets |
1.0 |
2.0 |
32.0 |
0.1 |
26.0 |
0.0 |
44.0 |
- |
74.0 |
41.0 |
0.1 |
5. % of foreign entities in banking assets |
21.0 |
12.0 |
12.0 |
18.0 |
18.0 |
- |
18.0 |
- |
7.0 |
18.0 |
28.0 |
6. Concentration ratio (per cent) |
81.9 |
62.7 |
78.1 |
63.1 |
57.6 |
35.4 |
62.6 |
50.8 |
28.9 |
31.7 |
77.7 |
7. NIM (per cent) |
1.1 |
1.0 |
0.8 |
1.4 |
1.5 |
3.6 |
5.0 |
2.9 |
3.1 |
4.0 |
2.8 |
8. Credit/deposit ratio (per cent) |
- |
131.6 |
90.0 |
141.7 |
- |
63.4 |
115.7 |
251.4 |
75.8 |
110.5 |
110.1 |
9. CRAR (per cent) |
17.2 |
12.3 |
16.4 |
12.7 |
15.7 |
14.7 |
16.3 |
12.7 |
13.1 |
14.7 |
15.1 |
Note: 1. Data relate to 2011.
2. Concentration ratio refers to the share of top three banking institutions in total assets of the banking industry.
3. NIM – Net interest margin; CRAR - Capital to risk weighted assets ratio.
Source: Financial Structure Database, World Bank; Financial Access Survey, IMF; Barth et al., 2013; Financial Soundness Indicators, IMF; BankScope Database.
|
This underscores the need for increasing the number of
banking institutions, especially in the private sector. The
discussion paper on ‘Banking Structure in India - The Way
Forward’ released by the Reserve Bank in August 2013,
advocated fresh bank licensing on a ‘continuous
authorisation’ basis rather than a ‘stop and go’ licensing
policy, though with stringent entry norms to encourage only
well-qualified entities. It also spelt out a reoriented tiered
banking structure for India having a few large banks with
domestic and international presence, several mid-sized
niche banks, regionally focused urban cooperative and
regional rural banks and a large number of small privately
owned local banks. The committee on Comprehensive
Financial Services for Small Businesses and Low Income
Households (Chairman: Dr Nachiket Mor) submitted its
report in January 2014 and recommended a vertically
differentiated banking structure in which banks specialise in
one or more of 3 functions - payments, credit delivery and
retail deposit taking. The committee, thus, recommended
the licensing of new categories of specialised banks
including payments banks and wholesale banks. Although
regionally focussed small banks continue to have a strong
appeal for inclusion, the committee noted that they may
have low demonstrated stability in the Indian context. The
committee also recommended the development of robust
solutions vis-à-vis regulation, supervision, risk management and governance of the existing regionally focussed banks
before any new ones are created (also see Box VI.4).
As part of reorienting India’s banking structure, the Reserve
Bank undertook a mammoth exercise that culminated in
granting ‘in-principle’ approval to 2 applicants: IDFC Limited
and Bandhan Financial Services Private Limited, to set up
banks under the Guidelines on Licensing of New Banks in
the Private Sector issued on February 22, 2013. These two
applicants were also recommended as suitable for grant of
‘in-principle’ approval by the High Level Advisory Committee
(HLAC) (Chairman: Dr Bimal Jalan), set up by the Reserve
Bank. HLAC’s recommendation that the application of the
Department of Posts be considered separately in
consultation with the Government of India has also been
accepted by the Reserve Bank. Going forward, more regular
licences, i.e., virtually ‘on tap’, would be provided.
References:
Barth, James R., Gerard Caprio, Jr., Ross Levine (2013),
‘Bank Regulation and Supervision in 180 Countries from
1999 to 2011’.
Reserve Bank of India (2013), Discussion Paper on ‘Banking
Structure in India - The Way Forward.’
Reserve Bank of India (2014), ‘Committee on Comprehensive
Financial Services for Small Businesses and Low Income
Households.’
The World Bank (2013), ‘Rethinking the Role of State in
Finance’, Global Financial Development Report.
Subdued primary market in 2013-14, but may
improve ahead
II.4.16 During 2013-14, the initial public offering
(IPO) segment had only one mega issue by Just
Dial. Resource mobilisation through the primary
market segment remained subdued due to sluggish
investment activity and higher volatility in the
secondary market. Private placements of nonconvertible
debentures (NCDs) also declined.
However, public issues of debt increased by 150
per cent to a record high of `424 billion in 2013-14
mainly on account of higher resource mobilisation
by public sector entities through tax free bonds
(Table II.7, Appendix Table 4). Going forward, in 2014-15, the primary equity market may improve
backed by an already buoyant secondary market.
In order to revive the primary market, the Securities
and Exchange Board of India (SEBI) announced a
slew of measures related to IPOs and offer-for-sale
including 25 per cent public shareholding norms for
public sector undertakings as also issued guidelines
for Real Estate Investment Trusts (REITs) and
Infrastructure Investment Trusts.
Housing prices rose at a moderate pace
II.4.17 Housing pr ices as captured by the
Reserve Bank’s House Price Index had been
growing at an average rate of over 20 per cent (y-o-y) in the past 3 years. However, the pace of
growth slowed in 2013-14 with an average growth
in the all-India index at 12.6 per cent reflecting a
correction in trends on the back of subdued
demand (Chart II.27).
Table II.7: Primary Capital Market Mobilisation
Shows Some Improvement |
(` billion) |
Category |
2012-13 |
2013-14 |
2013-14* |
2014-15* |
1 |
2 |
3 |
4 |
5 |
a.Public Issues (i)+ (ii) |
219.2 |
510.8 |
10.8 |
15.9 |
i) Public issues (Equity) |
49.4 |
86.9 |
9.4 |
2.4 |
of which |
|
|
|
|
IPOs |
49.4 |
12.4 |
9.4 |
2.4 |
FPOs |
0.0 |
74.6 |
0.0 |
0.0 |
ii) Public issues (Debt) |
169.8 |
423.8 |
1.3 |
13.4 |
b. Rights issue |
89.4 |
45.76 |
4.2 |
7.3 |
Total Equity Issues (i +b) |
138.8 |
132.7 |
13.6 |
9.7 |
c. ADR / GDR |
10.4 |
1.2 |
1.2 |
0.0 |
d. Mutual fund mobilisation (net) |
765.4 |
537.8 |
956.1 |
863.7 |
1. Private sector |
637.9 |
488.4 |
773.8 |
780.0 |
2. Public sector |
127.5 |
49.4 |
182.3 |
83.7 |
e. Private placement in corporate debt market |
3,614.6 |
2,760.5 |
509.7 |
1,107.8 |
f. QIP |
160.0 |
136.6 |
42.9 |
71.6 |
*: April-June.
Source: SEBI.
|
II.5 GOVERNMENT FINANCES
Continuation of fiscal consolidation in 2013-14 as
reflected in improvement in key deficit indicators
II.5.1 Fiscal consolidation is key for maintaining
both internal and external stability. The twin deficit
risks that loomed large during H1 of 2012-13 were
brought under control by lowering the fiscal gap
since H2 of 2012-13. Recognising the spillover of
high fiscal deficit into larger CAD was an important
motivation for the central government to continue
the fiscal consolidation process in 2013-14, even
though this was also needed from the perspective
of aggregate demand management and its
inflationary implications. Notable gains in
containment of key deficit indicators in 2013-14 are
apparent in the provisional accounts (PA) (Chart
II.28). In terms of ratio of GDP, revenue deficit (RD),
gross fiscal deficit (GFD) and primary deficit (PD)
were placed lower at 3.2 per cent, 4.5 per cent and
1.2 per cent, respectively (Appendix Table 5).
Quality of fiscal consolidation and transparency in
fiscal accounting remain a concern
II.5.2 Notwithstanding the progress in achieving
deficit targets, there are concerns regarding the quality of fiscal consolidation and transparency in
fiscal accounting. Fiscal consolidation in 2013-14
vis-à-vis budget estimates (BE) was mainly
achieved through reduction in capital expenditure
and plan revenue expenditure, necessitated by a
significant shor tfall in tax revenues and
disinvestment proceeds. Gross tax revenues
suffered a shortfall of 7.9 per cent from the
budgeted level in 2013-14, primarily due to lower
indirect tax collections which were affected by
industrial slowdown, deceleration in services
sector growth and lower imports. Non-tax revenues
exceeded the budgetary targets, aided in large part
by ad hoc dividend receipts from various public
sector enterprises (Table II.8).
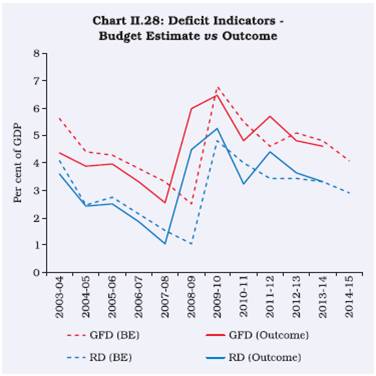 II.5.3 Both capital expenditure and capital outlay,
as per cent of GDP, were lower in 2013-14 (PA)
than their budgeted levels. Non-defence capital
outlay during 2013-14 was lower at 0.8 per cent of GDP than 1.1 per cent budgeted for the year.
Cutback in capital expenditure has potential
adverse implications for growth prospects in the
medium term.
Table II.8: Fiscal Performance of the
Central Government |
(Per cent of GDP) |
Variables |
2004-08 (Avg) |
2007-08 |
2008-10 (Avg) |
2010-2014 (Avg) |
2013-14 (PA) |
1 |
2 |
3 |
4 |
5 |
6 |
Non debt receipts |
10.4 |
11.1 |
9.5 |
9.5 |
9.3 |
Tax revenue |
7.8 |
8.8 |
7.5 |
7.2 |
7.2 |
Non-tax revenue |
2.1 |
2.1 |
1.8 |
1.8 |
1.8 |
Non debt Capital Receipts |
0.4 |
0.2 |
0.3 |
0.4 |
0.4 |
Total Expenditure |
13.8 |
13.6 |
15.8 |
14.4 |
13.8 |
Revenue Expenditure |
11.9 |
11.9 |
14.1 |
12.7 |
12.1 |
Capital Expenditure |
1.9 |
1.7 |
1.7 |
1.8 |
1.7 |
Gross Fiscal Deficit |
3.4 |
2.5 |
6.2 |
5.0 |
4.5 |
Adjusted GFD* |
3.9 |
3.1 |
7.2 |
5.0 |
4.5 |
*: GFD adjusted for bonds issued in lieu of subsidies.
Avg: Average.
Note: Total expenditure, capital expenditure and non-debt capital
receipts have been adjusted for pre-payment to National Small
Savings Fund in 2004-05 and transactions relating to transfer
of Reserve Bank's stake in State Bank of India (SBI) to the
Government in 2007-08. |
II.5.4 Curtailment of expenditures through
unpaid/deferred subsidies also helped to meet the
deficit targets in 2013-14. This practice shifts the
expenditure burden to subsequent years leading
to fiscal imbalances over time. There is, therefore,
a need for improving fiscal accounting and
transparency.
Further fiscal consolidation needed over the
medium-term based on both expenditure cutting
and revenue augmentation
II.5.5 Further strides are needed on the fiscal
consolidation front despite recent gains. Scope
exists for expenditure reorientation by curtailing
subsidies and increasing public investment.
Subsidies accounted for nearly 23 per cent of the
total non-plan spending during 2013-14.
Notwithstanding some progress over the last 2
years in bringing subsidy expenditure under
control, further expenditure reduction can be
achieved through better targeting of subsidies,
more frequent price revisions in domestic LPG and
controlled fertilisers and by considerably limiting
interest subventions. Of the remaining expenditure,
it is important to preserve and increase expenditure
on human and physical capital in order to improve
the economy’s growth potential (Table II.9).
II.5.6 Given that compressing expenditure alone
may not deliver the targets set under the amended
Fiscal Responsibility and Budget Management
(FRBM) Act and could, beyond a point, hamper
growth prospects, the fiscal strategy in the coming
years has to accord greater focus to revenue
augmentation. There has hardly been any
improvement in the gross tax revenue-GDP ratio
of the central government, notwithstanding the
gradual withdrawal of fiscal stimulus. Barring
personal income tax and service tax, all the major taxes as a percentage of GDP were significantly
lower in 2013-14 than the level achieved in the
pre-crisis year of 2007-08 (Table II.10). It is,
therefore, imperative to improve the gross tax-GDP
ratio through tax reforms, widening of the tax base and better tax administration, to make further
progress in fiscal consolidation. A more effective
strategy for disinvestment that takes into account
evolving market conditions and proper pricing of
natural resources will also help to augment the
resources of the government.
Table II.9: Select Items of Expenditure of the
Central Government |
(Per cent of GDP) |
Components |
2004-08 (Avg) |
2007-08 |
2008-10 (Avg) |
2010-14 (Avg) |
2013-14 (RE) |
1 |
2 |
3 |
4 |
5 |
6 |
Committed Expenditure# |
4.7 |
4.4 |
4.9 |
4.4 |
4.6 |
Defence |
2.1 |
1.8 |
2.1 |
1.9 |
1.8 |
Subsidies@ |
1.9 |
2.0 |
3.2 |
2.4 |
2.3 |
Non-Plan Grants to States |
0.7 |
0.7 |
0.7 |
0.6 |
0.5 |
Expenditure on physical and human capital* |
2.0 |
2.6 |
2.9 |
2.2 |
2.0 |
Of which: |
|
|
|
|
|
Human Capital |
1.2 |
1.2 |
1.9 |
1.4 |
1.2 |
Physical Capital |
0.8 |
1.4 |
1.0 |
0.8 |
0.8 |
#: Indicates expenditure on interest payments, pension and pay
and allowances.
@: Includes special securities issued in lieu of subsidies.
*: Indicates capital outlay and expenditure on education, health and
rural development.
|
Table II.10: Gross Tax Revenue Raised by
Central Government |
(Per cent of GDP) |
Components |
2004-08 (Avg) |
2007-08 |
2008-10 (Avg) |
2010-14 (Avg) |
2013-14 (PA) |
1 |
2 |
3 |
4 |
5 |
6 |
Gross Tax Revenue |
10.6 |
11.9 |
10.2 |
10.1 |
10.0 |
Corporation Tax |
3.1 |
3.9 |
3.8 |
3.6 |
3.5 |
Income Tax |
1.7 |
2.1 |
1.9 |
1.9 |
2.1 |
Customs Duty |
1.9 |
2.1 |
1.5 |
1.6 |
1.5 |
Union Excise Duty |
2.8 |
2.5 |
1.8 |
1.7 |
1.5 |
Service Tax |
0.7 |
1.0 |
1.0 |
1.2 |
1.4 |
Union Budget 2014-15 relies on buoyant tax
revenues and higher disinvestment to reduce the
fiscal gap
II.5.7 The Union Budget for 2014-15 has
envisaged further reduction in key deficit indicators
relative to GDP through higher non-debt receipts-
GDP ratio which would more than offset a marginal
increase in total expenditure-GDP ratio. With the
expected growth of 19.8 per cent in overall tax
revenues2, the gross tax revenue-GDP ratio is
budgeted to improve by 0.6 percentage points to
10.6 per cent during 2014-15. Non-debt capital
receipts are budgeted to increase by 84.6 per cent
in 2014-15 mainly due to a sharp growth in
disinvestment proceeds.
Non-plan expenditure to moderate in 2014-15
through containment of subsidies; capital
expenditure budgeted to increase
II.5.8 Total expenditure is budgeted to increase
by 14.8 per cent in 2014-15. Non-plan expenditure-
GDP ratio is budgeted to decline by 0.3 percentage
points to 9.5 per cent in 2014-15, mainly by
containing subsidies. Among the other major nonplan
expenditure items, while growth rates in
interest payments and grants to states are
envisaged to decelerate sharply in 2014-15, growth
in defence expenditure is budgeted to show a
moderate increase. Although plan expenditure is
budgeted to increase at a significantly faster pace
than non-plan expenditure, it will still remain less
than one-third of the total expenditure.3
II.5.9 Capital expenditure as per cent of GDP is
budgeted to increase marginally to 1.8 per cent in
2014-15, still below 2 per cent attained in 2010-11
(Chart II.29).
States performed better in the second phase of
fiscal consolidation
II.5.10 States resumed their fiscal consolidation in
2010-11 consequent to the amendments in their
FRBM Acts in line with the targets set by the
Thirteenth Finance Commission (FC-XIII) (Chart
II.30). Fiscal consolidation during 2010-13 was
largely revenue-led, with significant increases in
both own tax revenue as well as current transfers
from the Centre, the latter reflecting the
enhancements recommended by FC-XIII. The
aggregate expenditure-GDP ratio was higher than
that in the earlier high growth period of 2004-08
mainly on account of a sharp increase in
development expenditure, particularly social sector
expenditure.
Some deterioration in state government finances
was seen in 2013-14, while improvement is
budgeted in 2014-15
II.5.11 The consolidated fiscal position of state
governments4 indicates an increase in the GFDGDP
ratio to 2.4 per cent in 2013-14 (RE) from 1.9
per cent in 2012-13 due to an increase in aggregate
expenditure, which more than off-set the increase
in revenue receipts. Revenue surplus during the
year was negligible as against a surplus of 0.2 per
cent of GDP in 2012-13. The capital outlay-GDP
ratio during 2013-14 (RE) increased by 0.4
percentage points over that in the previous year.
II.5.12 The BE for 2014-15 indicates a decline in
the GFD-GDP ratio by 0.1 percentage point over
2013-14 (RE) mainly due to an increase in revenue
receipts through higher current transfers from the
Centre. The expenditure pattern shows that the
committed expenditure-GDP ratio (comprising
interest payments, administrative services and pension) will broadly remain unchanged during
2014-15 (BE), while overall expenditure as a ratio
to GDP is budgeted to increase.
Combined fiscal deficit shows deterioration in
2013-14
II.5.13 The combined gross fiscal deficit of the
Centre and the states is placed higher at 7.0 per
cent of GDP in 2013-14 (RE) as compared to 6.8
per cent in 2012-13. The decline in the fiscal deficit
of the central government by 0.2 percentage points
during 2013-14 (RE) was more than off-set by the
sharp increase in the fiscal deficit of states by 0.5
percentage points. In 2014-15 (BE), the combined
fiscal position is, however, budgeted to improve,
reflecting the process of fiscal consolidation, both
at the Centre as well as state levels. The combined
fiscal deficit in 2014-15 (BE) is placed lower at 6.4
per cent of GDP (Appendix Table 6). Adherence to
this target will be important as high fiscal deficit
financed through debt issuances and the resultant
public debt accumulation have an adverse impact
on the economy, both in the short-run as well as
the long-run.
II.6 EXTERNAL SECTOR
II.6.1 India’s external sector underwent a major
adjustment in 2013-14. After widening to a historical
annual high of 4.7 per cent of GDP during 2012-13,
the current account deficit (CAD) narrowed sharply
in 2013-14 aided by a lower trade deficit. A modest
recovery in exports and a sharp fall in imports,
particularly gold imports, helped in improving India’s
trade balance. Following a lower trade deficit
accompanied by robust growth in services export
and stable flows of remittances, CAD declined to
1.7 per cent of GDP in 2013-14 (Chart II.31,
Appendix Table 1). Various proactive policy
measures undertaken by policy authorities helped
in mitigating external sector vulnerabilities and
containing CAD within sustainable limits.
Modest recovery in exports albeit underperformance
of some major sectors
II.6.2 Reflecting the lagged impact of rupee
depreciation and modest recovery in some trade
partner economies, India’s exports started
improving in July 2013. However, the uptrend in
exports was halted in February-March 2014 before
it resumed in Q1 of 2014-15. Exports mainly
benefitted from greater demand from Saudi
Arabia, Iran, China, the US, EU countries and Japan
(Table II.11). Although export demand in a majority
of the sectors witnessed an upturn, exports in the
gems and jewellery sector declined both due to a
fall in international prices of gold and silver and
lower demand in select economies such as UAE.
In fact, the robust trend in demand for gems and
jewellery from major destinations, viz., the US,
Hong Kong and Belgium was nullified by a sharp
decline in exports to UAE. Similarly, broadly
reflecting a fall in gross refinery margins in the first
three quarters of 2013-14, India’s exports of
petroleum products to Singapore, UAE and the
Netherlands moderated significantly.
Table II.11: Major Destinations of Export Growth in 2013-14 |
Country |
Exports
(US$ billion) |
Contribution to Export
Growth (%) |
Major Commodities |
2012-13 |
2013-14 |
2012-13 |
2013-14 |
|
1 |
2 |
3 |
4 |
5 |
6 |
US |
36.2 |
39.1 |
-25.6 |
24.3 |
Gems and jewellery, petroleum products and marine products |
Saudi Arabia |
9.8 |
12.2 |
-73.8 |
19.8 |
Petroleum products, rice and transport equipments |
Iran |
3.4 |
4.9 |
-17.1 |
12.8 |
Rice basmati, oil meals and primary and semi-finished iron and steel |
China |
13.6 |
15.0 |
85.1 |
11.9 |
Cotton fabric, petroleum products and transport equipment |
EU |
50.4 |
51.7 |
38.4 |
10.5 |
Readymade garments, chemicals, leather and gems and jewellery |
Tanzania |
2.2 |
3.5 |
-9.9 |
10.6 |
Petroleum products |
| Source: DGCI&S. |
Lower imports largely reflective of domestic
economic slowdown and policy measures
II.6.3 Imports moderated significantly in 2013-14
reflecting the impact of the domestic economic
slowdown, policy measures and fall in international
prices of key import commodities. For instance,
various policy measures and fall in international
prices stemmed the import of gold in 2013-14. With
a significant fall in natural gas prices in 2013, the
international prices of fertilisers also eased, which
limited the growth of India’s fertiliser import bill.
India’s lower demand for imports of iron and steel
items was attributed to various factors such as
depreciation of the rupee and improved domestic
supply. The slowdown in domestic economic activity
and the delay in the implementation of various
infrastructure projects probably reduced the
demand for capital goods imports (Table II.12).
Notwithstanding that international crude oil prices
fluctuated due to geopolitical concerns and output
disruptions (in Libya and Nigeria) on the supply
side and changing growth prospects in major
economies on the demand side, the average crude
oil price (Indian basket) fell by 2.3 per cent, keeping
India’s oil import bill relatively contained in 2013-14.
Lower CAD but no complacency as risks may
resurface
II.6.4 The recent upturn in exports and resumption
of FII flows augur well for India’s overall balance of payments in 2014-15. As per provisional estimate
for Q1 of 2014-15, India’s net export of services
stayed almost stable at the level of Q1 of 2013-14.
However, going forward, certain upside risks to
CAD, that had fallen significantly in 2013-14, cannot
be ruled out. Potential risks to India’s balance of
payments could emanate from both domestic and
global factors. First, as economic slack diminishes
with recovery in the domestic economy, the upturn
in the investment cycle will require higher non-oil
non-gold imports, which already seem to be
underway since May 2014. Second, speedy easing
of norms for gold imports could lead to a widening
of CAD in 2014-15. In fact, growth in gold imports
turned positive in June 2014 after a span of 11 months. Third, even though international crude oil
prices were earlier projected to stay low with
gradual easing of the supply side, the re-emergence
of geopolitical risks, particularly in Iraq and Russia’s
on-going tensions with Ukraine, may keep oil prices
relatively firm and thus have implications for India’s
oil import bill. This may pose upward risks to India’s
CAD. Fourth, notwithstanding a modest recovery
in exports on the back of stronger global demand
and adjustment of the rupee exchange rate in 2013-
14, downside risks continue due to uncertainty
about the global growth outlook. Lastly, some sector
specific issues, particularly relating to drugs and
pharmaceuticals, iron ore and coal need redressal
to ensure a better trade balance.
Table II.12: Sector-wise Decline in Imports |
Sector |
Imports
(US$ billion) |
Relative
Contribution
to Import Decline (%) |
2012-13 |
2013-14 |
1 |
2 |
3 |
4 |
Gold and Silver |
55.7 |
32.1 |
58.0 |
Edible Oils |
11.2 |
9.3 |
4.7 |
Fertilisers |
9.1 |
6.5 |
6.3 |
Iron and steel |
11.0 |
7.9 |
7.5 |
Machinery |
27.6 |
23.6 |
9.8 |
Transport Equipment |
17.2 |
15.0 |
5.4 |
Project goods |
6.6 |
4.5 |
5.0 |
| Total Imports |
490.7 |
450.1 |
|
| Source: DGCI&S. |
Net FII flows turned positive since December 2013
II.6.5 Quantitative easing (QE) by advanced
countries in recent years boosted foreign portfolio
inflows significantly in India mainly reflecting higher
growth and interest rate differentials. After the US
Fed’s indication on QE tapering in May 2013, net
FII flows retreated largely from the debt segment
during June to November 2013. However, since the
actual tapering of QE announced in December
2013, FII flows have remained broadly intact. This
essentially reflects considerable improvement in
India’s external sector with CAD falling below a
sustainable level, a build-up of forex reserves owing
to special swap schemes offered by the Reserve
Bank (during September-November 2013) and
stability in the rupee exchange rate. Further,
growing prospects of a better policy environment
with a stable central government in place may also
have boosted the confidence of foreign investors.
However, going forward, FII flows may remain prone
to volatility with expected tightening of monetary
policy in the U.S., if domestic fundamentals do not
improve and/or external sector risks re-emerge.
BRICS-CRA to help in managing short-term BoP
pressures
II.6.6 On July 15, 2014 Brazil, Russia, India,
China and South Africa signed an international
treaty establishing the BRICS Contingent Reserve Arrangement (CRA), in Fortaleza, Brazil. The
initiative to implement the CRA was officially
launched in June 2012 by the BRICS leaders at the
sidelines of the G-20 Summit that took place in Los
Cabos, Mexico. The CRA complements and
reinforces the global financial safety net, which
comprises the IMF, regional financial arrangements
and bilateral swap agreements between central
banks, in addition to the countries’ own international
reserves. The initial total committed resources
under the CRA will be US$100 billion. The CRA will
become effective only after fulfilling all the legal
requirements for its entry into force. It will then
provide support through liquidity and precautionary
instruments.
Increase in India’s external debt in 2013-14, but not
an immediate challenge
II.6.7 India’s external debt as at end March 2014
increased by US$ 31.2 billion over the year, mainly
led by the special swap scheme introduced by the
Reserve Bank for commercial banks to mobilise
FCNR(B) and overseas borrowings. The borrowings
under the Swap Scheme in combination with a
decline in CAD and revival in equity flows helped
in building up foreign exchange reserves (Appendix
Table 2). In line with greater recourse to debt
creating flows, India’s external debt and net external
liabilities have risen in recent years (Table II.13 and
Chart II.32). However, since the incremental
external debt during 2013-14 was mainly long-term
in nature, it does not pose an immediate concern
for India’s external vulnerability. Moreover, with
increase in foreign exchange reserves in H2 of
2013-14, most external sector vulnerability
indicators have improved.
Rupee in real terms continues to be above base
year level
II.6.8 Following indications of QE tapering by the
US Fed coinciding with growing concerns about
high CAD, the rupee depreciated sharply during
June to August 2013. Subsequent policy actions
undertaken both by the Reserve Bank and the government, however, augured well for rupee
stabilisation. The appreciating trend in the nominal
value of the rupee was reflected in the real effective
exchange rate too as inflation (CPI) remained
higher in India compared to its trading partners
(Box II.8). Rupee, in terms of both 6 and 36 currency
baskets, continued to be above the base level in
2004-05 (Chart II.33).
Table II.13: External Sector
Vulnerability Indicators |
(per cent) |
Indicator |
End-Mar 2011 |
End-Mar 2012 |
End-Mar 2013 |
End-Mar 2014 |
1 |
2 |
3 |
4 |
5 |
1. External Debt to GDP |
18.2 |
20.5 |
22.0 |
23.3 |
2. Ratio of Short-term to Total Debt (Original Maturity) |
20.4 |
21.7 |
23.6 |
20.3 |
3. Ratio of Short-term to Total Debt (Residual maturity)# |
40.6 |
40.9 |
42.1 |
39.6 |
4. Ratio of Concessional Debt to Total Debt |
14.9 |
13.3 |
11.1 |
10.5 |
5. Ratio of Reserves to Total Debt |
95.9 |
81.6 |
71.3 |
69.0 |
6. Ratio of Short-term Debt to Reserves |
21.3 |
26.6 |
33.1 |
29.3 |
7. Ratio of Short-term Debt (Residual maturity) to Reserves# |
42.3 |
50.1 |
59.0 |
57.4 |
8. Reserves Cover of Imports (in months) |
9.5 |
7.1 |
7.0 |
7.8 |
9. Debt Service Ratio (Debt Service Payments to Current Receipts) |
4.4 |
6.0 |
5.9 |
5.9 |
10. External Debt (US$ billion) |
317.9 |
360.8 |
409.4 |
440.6 |
11. International Investment Position (IIP) (US$ billion) |
-207.0 |
-264.7 |
-326.7 |
-331.6 |
12. IIP/GDP ratio |
-11.9 |
-14.8 |
-17.6 |
-17.6 |
13. CAD/GDP ratio |
2.8 |
4.2 |
4.7 |
1.7 |
| #: RBI estimate. |
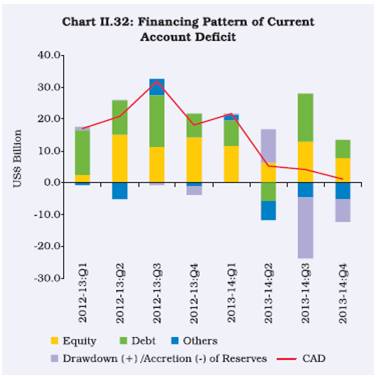 Box II.8
Information Content from the CPI-based REER
In order to ensure better comparability of India’s external
competitiveness vis-à-vis its trading partners, the Reserve
Bank released the CPI based real effective exchange rate
(REER) in April 2014. REER is a summary indicator for
assessing the real value of a country’s currency against
the basket of trading partners of the country. REER is a
frequently used variable in both theoretical and applied
economic research and policy analysis for assessing
the equilibrium value of a currency, change in external
competitiveness, responsiveness of trade flows to price
changes and incentives for reallocating production between
the tradable and non-tradable sectors. In literature, there are
a number of alternative measures of real exchange rates. For
computation of relative prices, indices based on consumer
prices, producer prices, GDP deflator and unit labour costs
are often used. Each of these measures of relative prices
has its own pros and cons.
Till recently, in the absence of a representative consumer
price index (CPI) for India, the Reserve Bank was providing
the REER index (6 and 36 currencies) using the wholesale
price index (WPI) and consumer price indices (CPI) for
partner countries. However, with the availability of an all
India CPI index, the Reserve Bank began computing and
releasing data on REER using this new CPI (combined)
for India. With greater focus on CPI inflation as the primary
objective of domestic monetary policy, it is pertinent to have
an alternative index of REER based on CPI.
The methodology used to construct the CPI based REER
index (both trade and export weights) is discussed in RBI
(2014).
In line with the fall in the nominal value of the rupee,
CPI based REER has also shown depreciation since 2011-12 (Table 1 and Chart 1). However, given that the
CPI based inflation differential with trade partner countries
continues to be high, the REER of rupee is still above the
base year level. Further, the REER based on the 6 currency
basket is higher than that based on the 36 currency basket.
This is mainly due to the CPI based inflation differential
being higher with the former group of countries (mainly advanced economies in the 6 currency basket) than with the
latter group of economies (36 currency basket) which also
includes emerging and developing economies.
Table 1: CPI based REER (Trade weighted) |
|
CPI-36 Currency Basket |
CPI-6 Currency Basket |
` per US Dollar |
CPI Inflation (%) |
1 |
2 |
3 |
4 |
5 |
2004-05 |
100.0 |
100.0 |
44.9 |
4.0 |
2005-06 |
102.4 |
104.4 |
44.3 |
3.7 |
2006-07 |
100.8 |
103.8 |
45.3 |
6.8 |
2007-08 |
109.2 |
113.4 |
40.2 |
5.9 |
2008-09 |
99.7 |
103.9 |
45.9 |
9.2 |
2009-10 |
103.9 |
110.7 |
47.4 |
10.6 |
2010-11 |
112.7 |
124.5 |
45.6 |
9.5 |
2011-12 |
110.3 |
121.2 |
47.9 |
9.5 |
2012-13 |
105.6 |
117.1 |
54.4 |
10.2 |
2013-14 |
103.3 |
112.4 |
60.5 |
9.5 |
2014-15Q1 |
106.1 |
116.2 |
59.8 |
8.1 |
References:
Reserve Bank of India (2014), ‘Real Effective Exchange
Rate based on CPI as Price Index for India’, RBI Monthly
Bulletin, April.
Key policy priorities for managing external sector
risks
II.6.9 Lower CAD, surge in foreign exchange
reserves and exchange rate stability are signs of a more resilient external sector. A modest improvement
in external sector indicators, however, does not
warrant any policy complacency. Spillovers from
renewed external pressures through the trade
channel and/or financial channel may resurface and
thus pose a challenge for India’s external sector.
The policy focus should be on improving domestic
macroeconomic fundamentals so as to minimise
such spillovers. In particular, policy attention is
required for (i) redressal of sector-specific structural
issues impeding exports, (ii) low inflation for
supporting the stability of the rupee and to enhance
external competitiveness, and to reduce investment
demand for gold, (iii) easing of binding supply
constraints in certain sectors (for example, POL,
coal and fertilisers) that are critical for the domestic
economy and can induce a surge in total imports,
(iv) a conducive business environment to ensure a
better mix of capital flows for CAD financing by
attracting stable non-debt creating flows, and (v)
improved governance.
|