This article presents monthly seasonal factors for 76 macroeconomic variables covering five broad sectors (viz., money and banking, price, industrial production, merchandise trade and services). Indicators of industrial production, monetary/banking and services sector indicators recorded a seasonal peak in March while the majority of price indicators recorded a seasonal trough in March-May. Structural breaks in monetary and banking aggregates as a consequence of demonetisation and in wholesale prices and industrial production indices due to base year revisions, were treated suitably for generating seasonal factors. Adjustments for seasonal variations in macroeconomic variables (i.e., the removal of seasonal effects in variables) enables a true reading of underlying sequential changes and understanding inter-relationships. Accordingly, seasonal factors, which provide a quantitative measure of seasonality, are published as an annual article in the Reserve Bank of India Bulletin since 19801. 2. Coverage and Methodology Seasonal factors for select 76 monthly macroeconomic variables presented in this article are grouped into five categories: (i) monetary and banking Indicators (14 series); (ii) price indices [consumer price index (CPI): 21 series; and wholesale price index (WPI): 9 series]; (iii) industrial production (23 series); (iv) service sector indicators (6 series); and (v) merchandise trade (3 series). In respect of some indicators, the coverage has changed substantially due to (a) the introduction of the CPI-Combined (base: 2012=100); (b) release of the revised series of index of industrial production (IIP) (base: 2011-12=100); and (c) release of the revised WPI series (base: 2011-12=100). Furthermore, there was a major shift in monetary and banking aggregates due to the withdrawal of specified bank notes (SBNs) announced on November 8, 2016 and the subsequent remonetisation (please see the Annex for methodological issues in the context of structural breaks). Most of the indicators have a long history of monthly data and accordingly, the past 12 years’ data have been used to generate seasonal factors. In case of the CPI-Combined and its components, however, data are available since January 2011 only. Seasonal factors have been estimated by using the X-13-ARIMA software, developed by the US Census Bureau2, after suitably configuring the package to suit Indian conditions, e.g., incorporating Diwali. The package was also customised to include Indian trading day effects3. 3. Salient Findings Monetary and Banking Indicators: Of the 14 major monetary and banking indicators considered, 11 recorded seasonal peaks during March-April (i.e., around the financial year closing) whereas a seasonal trough for the majority of these series was traced during August-December (Chart 1). Demand deposits of scheduled commercial banks (SCBs) exhibited the highest seasonal variation [Average seasonal factor (SF) range: 9.3] followed by reserve money or M0 (Average SF range: 6.4), cash in hand and SCBs’ balances with the RBI (Average SF range: 6.2). Time deposits of SCBs exhibited the smallest seasonal variation (Average SF range: 1.7). For most of these series, considerable moderation in seasonality has occurred over the last 10 years (Table 2).  Consumer Price Index (CPI): The range for the average seasonal factor for the aggregate CPI series [CPI-Combined, CPI for Industrial Workers (CPI-IW), CPI for Agricultural Labourers (CPI-AL) and CPI for Rural Labourers (CPI-RL)] was 2.1–2.5. The majority of the CPI series recorded peak seasonality in September-December while 13 out of the 18 CPI-combined series displayed seasonal troughs during March-May. Perishability remains a key determinant of seasonality in vegetable prices and headline CPI. CPI-Vegetables showed the highest seasonal variation (six-year average SF range: 22.5). Within vegetables, tomatoes, onions and potatoes recorded an average SF range of 63.1, 49.2 and 37.5, respectively. The average SF range for Pulses and products increased significantly to 5.5 from the five-year average of 3.7. Prices of non-alcoholic beverages did not reflect any seasonality (average SF range: 0.3). 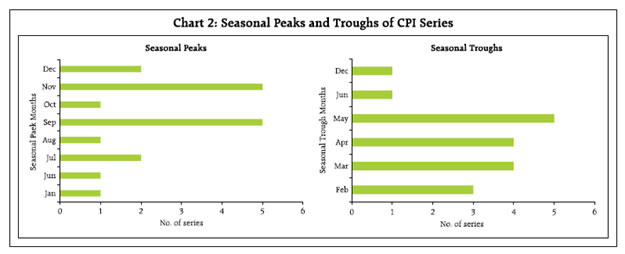
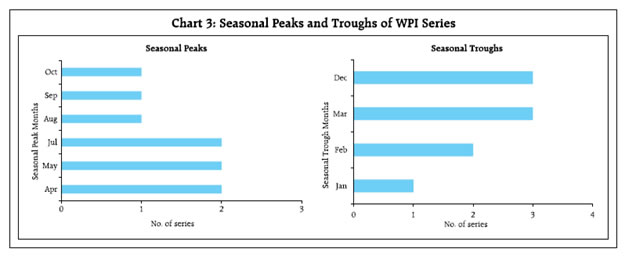 Wholesale Price Index (WPI): Seasonal fluctuations in the WPI-all commodities was largely driven by primary articles, especially food articles and consequentially, the SF range of WPI – all commodities has been increasing since 2011-12. The SF range for WPI – manufactured products came down further to 0.9 in 2016-17 from 1.5 a decade ago. WPI – fuel & power typically peaks in July. Industrial Production: Industrial Production is highly seasonal with peaks in March and troughs in February4 or April (Chart 4). Within the IIP, the average SF range for sectoral and used-based groups was 10.2-38.0, where capital goods and intermediate goods exhibited highest and lowest seasonality, respectively. Among the core industries, production of coal, cement and steel are highly seasonal. Service Sector Indicators: Four of the six services sector indicators recorded seasonal peaks in March (Chart 5). Production and sales of commercial motor vehicles remained highly seasonal and more pronounced in the latter. By contrast, seasonality in respect of both cargo handled at major ports and railway freight traffic came down. Passenger air traffic also remained highly seasonal, though the seasonality in domestic passenger traffic has come down and is comparable to its international counterpart. The seasonal peaks for domestic and international passenger traffic coincided with holiday seasons in May and January, respectively.
Merchandise Trade: The seasonal peaks for merchandise exports and imports (including non-oil non-gold import) remained unchanged in March and October, respectively. The seasonality of external trade indicators has been rising during recent years. (Chart 6 & Table 2).
3.1 Changing Seasonality Pattern over the Last Decade A regression-based test5 indicates that seasonal fluctuations have moderated for 42 series while 20 series exhibited increased volatility of their seasonal components and the remaining 14 series maintained broadly similar seasonal behaviour over the years (Chart 7). Seasonal fluctuations in monetary and banking aggregates moderated or remained broadly unchanged whereas in the IIP categories, seasonal variation increased for mining, primary goods, infrastructure/construction goods and electricity. Among CPI items, the seasonality of pulses and products increased significantly. 3.2 Change in Seasonal Peak and Trough Months Across the 76 series, seasonal variation in 2016-17 has remained broadly close to the previous five years’ average (Chart 8). Peak and trough months for 46 of the 76 selected series remained unchanged in 2016-17 when compared with the previous five years’ average (2011-12 to 2015-16). For the remaining series, the shift in seasonal peaks/troughs was by one to two months of which, five series (viz., narrow money, time deposits, WPI-manufactured products, CPI-milk and products and CPI–miscellaneous) recorded simultaneous shifts of peak and trough months (Chart 9). The peak / trough months remained unaltered for the three old-base aggregate CPIs (i.e., CPI-IW, CPI-AL and CPI-RL).
Annex Estimation of Seasonal Factors and Treatment of Outliers – A Retrospective from Demonetisation experience in India Outliers often disrupt the data generating process (DGP) and influence model specification, causing bias in parameter estimates. In turn this can produce imprecise forecasts (Kaiser and Maravall, 1999). The X-13-ARIMA method of the US Census Bureau is commonly used to estimate seasonality. It can detect outliers automatically and treat them suitably. The outlier specification of the package enables identification of (a) additive outlier (AO) which impacts only one observation in the series, (b) temporary change (TC) outlier, which resembles a spike-like peak in the time series that takes longer to subside and (c) level-shift (LS) outlier, which shifts the observations into a new level (US Census Bureau, 2011; 2017). Recent shocks to currency in circulation (CIC) and other monetary and banking aggregates have created changes in the DGP that are compatible with the LS outlier specification of X-13-ARIMA package (e.g., with revised CIC being lower than pre-demonetisation in the levels and an upward level shift in aggregate deposits). Therefore, the analysis of seasonality of monetary and banking indicators was carried out using X-13-ARIMA under the automatic outlier detection approach. In addition, the coded outlier approach (manual detection) was also used with a level shift during November 2016 as the X-13-ARIMA was unable to identify November 2016 as LS outlier. The coded outlier was found to be statistically significant with expected sign. The estimated seasonal factors of the series were found to vary marginally under these two approaches (automatic and coded) with no drift observed in the seasonal peak and trough (Chart 10). References: Kaiser, Regina and Agustin Maravall (1999): “Seasonal Outliers in Time Series”, Documento de Trabajo No. 9915, Banco de Espana, US Census Bureau (2011): “X-12-ARIMA Reference Manual”, version 0.3 US Census Bureau (2017): “X-13ARIMA-SEATS Reference Manual”, version 0.1 | Table 1: Average Monthly Seasonal Factors of Selected Economic Time Series (Contd.) | | Series/Month | Apr | May | Jun | Jul | Aug | Sep | Oct | Nov | Dec | Jan | Feb | Mar | | 1 | 2 | 3 | 4 | 5 | 6 | 7 | 8 | 9 | 10 | 11 | 12 | 13 | | A.1.1 Broad Money (M3) | 101.4 | 100.9 | 100.1 | 100.2 | 99.8 | 99.4 | 99.7 | 99.5 | 99.1 | 99.5 | 99.8 | 100.6 | | A.1.1.1 Net Bank Credit to Government | 101.0 | 101.0 | 100.6 | 101.6 | 100.9 | 99.6 | 99.9 | 100.0 | 98.0 | 99.1 | 99.2 | 99.4 | | A.1.1.2 Bank Credit to Commercial Sector | 100.9 | 100.1 | 100.0 | 99.3 | 98.9 | 99.4 | 99.5 | 99.3 | 99.7 | 100.2 | 100.5 | 102.1 | | A.1.2 Narrow Money (M1) | 102.3 | 101.4 | 100.7 | 99.3 | 98.9 | 99.0 | 98.6 | 98.7 | 99.3 | 98.8 | 100.0 | 102.9 | | A.1.3 Reserve Money (RM) | 102.3 | 101.7 | 101.0 | 99.6 | 98.8 | 98.1 | 98.5 | 99.2 | 98.6 | 98.7 | 99.2 | 104.5 | | A.1.3.1 Currency in Circulation | 102.8 | 103.2 | 101.8 | 99.4 | 98.6 | 97.6 | 98.3 | 98.9 | 99.1 | 99.6 | 100.2 | 100.5 | | A.2.1 Aggregate Deposits (SCBs) | 101.0 | 100.4 | 99.6 | 100.4 | 100.0 | 99.8 | 100.2 | 99.7 | 99.3 | 99.5 | 99.6 | 100.6 | | A.2.1.1 Demand Deposits (SCBs) | 101.1 | 99.1 | 98.0 | 98.6 | 98.5 | 100.8 | 99.6 | 98.9 | 99.9 | 98.7 | 99.7 | 106.5 | | A.2.1.2 Time Deposits (SCBs) | 100.8 | 100.6 | 99.8 | 100.6 | 100.1 | 99.5 | 100.4 | 100.0 | 99.3 | 99.6 | 99.6 | 99.8 | | A.3.1 Cash in Hand and Balances with RBI (SCBs) | 101.8 | 99.3 | 100.3 | 101.2 | 100.6 | 101.1 | 99.8 | 101.1 | 100.0 | 97.4 | 98.4 | 99.4 | | A.3.2 Bank Credit (SCBs) | 101.1 | 100.3 | 100.2 | 99.6 | 99.0 | 99.4 | 99.2 | 99.0 | 99.7 | 99.8 | 100.3 | 102.3 | | A.3.2.1 Loans, Cash, Credits and Overdrafts (SCBs) | 100.5 | 100.1 | 100.3 | 99.1 | 98.8 | 100.5 | 99.2 | 99.0 | 99.6 | 99.7 | 100.1 | 103.1 | | A.3.2.2 Non-Food Credit (SCBs) | 101.2 | 100.1 | 100.0 | 99.6 | 99.0 | 99.5 | 99.3 | 99.0 | 99.7 | 99.8 | 100.2 | 102.4 | | A.3.3 Investments (SCBs) | 100.3 | 100.4 | 100.0 | 101.1 | 101.7 | 100.9 | 100.8 | 100.5 | 98.8 | 99.1 | 99.0 | 97.6 | | B. CPI (Base: 2012 = 100) All Commodities | 99.2 | 99.4 | 100.0 | 100.7 | 100.9 | 101.0 | 101.0 | 100.7 | 99.9 | 99.4 | 99.0 | 98.9 | | B.1 CPI - Food and beverages | 98.2 | 98.8 | 100.1 | 101.6 | 102.1 | 102.0 | 102.0 | 101.3 | 99.6 | 98.6 | 98.0 | 97.7 | | B.1.1 CPI - Cereals and products | 99.7 | 99.6 | 99.7 | 99.9 | 100.1 | 100.2 | 100.3 | 100.3 | 100.1 | 100.2 | 100.2 | 100.0 | | B.1.2 CPI - Meat and fish | 99.8 | 100.4 | 101.8 | 101.7 | 101.1 | 100.2 | 99.6 | 98.7 | 98.6 | 99.3 | 99.3 | 99.4 | | B.1.3 CPI - Egg | 96.7 | 96.5 | 98.2 | 99.9 | 99.0 | 99.0 | 99.3 | 101.7 | 103.6 | 104.1 | 102.1 | 99.5 | | B.1.4 CPI - Milk and products | 99.6 | 99.9 | 100.0 | 100.2 | 100.3 | 100.3 | 100.2 | 100.3 | 100.0 | 99.8 | 99.8 | 99.6 | | B.1.5 CPI - Fruits | 102.6 | 102.8 | 102.9 | 103.5 | 102.3 | 98.8 | 98.9 | 98.5 | 97.4 | 97.1 | 97.0 | 98.3 | | B.1.6 CPI - Vegetables | 90.7 | 94.1 | 100.4 | 107.3 | 110.9 | 111.1 | 110.5 | 106.7 | 97.9 | 92.3 | 89.5 | 88.5 | | B.1.6.1 CPI - Potato | 85.7 | 94.5 | 101.5 | 108.7 | 113.3 | 114.6 | 116.7 | 116.8 | 102.3 | 86.5 | 79.4 | 80.2 | | B.1.6.2 CPI - Onion | 78.9 | 77.3 | 82.9 | 95.4 | 117.3 | 126.5 | 125.0 | 120.1 | 104.9 | 96.7 | 90.9 | 82.8 | | B.1.6.3 CPI - Tomato | 80.5 | 92.7 | 110.8 | 136.6 | 117.8 | 109.2 | 109.2 | 118.8 | 93.4 | 80.8 | 73.6 | 76.4 | | B.1.7 CPI - Pulses and products | 98.1 | 98.7 | 99.1 | 99.8 | 100.3 | 101.1 | 101.7 | 102.1 | 101.4 | 100.4 | 99.2 | 98.3 | | B.1.8 CPI - Spices | 99.2 | 99.3 | 99.6 | 100.0 | 100.3 | 100.5 | 100.5 | 100.5 | 100.5 | 100.2 | 99.9 | 99.5 | | B.1.9 CPI - Non-alcoholic beverages | 99.9 | 100.0 | 100.1 | 100.0 | 100.1 | 100.1 | 100.1 | 100.1 | 100.0 | 100.0 | 99.9 | 99.8 | | B.1.10 CPI - Prepared meals, snacks, sweets etc. | 99.8 | 99.7 | 99.8 | 99.9 | 100.0 | 100.1 | 100.1 | 100.3 | 100.3 | 100.1 | 100.1 | 99.9 | | B.2 CPI - Clothing and footwear | 99.9 | 99.8 | 99.8 | 99.8 | 99.9 | 100.0 | 100.1 | 100.2 | 100.3 | 100.2 | 100.1 | 100.0 | | B.3 CPI - Housing | 100.2 | 100.1 | 99.3 | 99.5 | 100.0 | 100.0 | 100.2 | 100.3 | 99.6 | 100.2 | 100.3 | 100.2 | | B.4 CPI - Miscellaneous | 99.6 | 99.8 | 99.9 | 100.2 | 100.2 | 100.3 | 100.3 | 100.2 | 100.0 | 99.9 | 99.8 | 99.7 | | C.1 Consumer Price Index for Industrial Workers (Base: 2001=100) | 98.9 | 99.2 | 99.6 | 100.3 | 100.7 | 100.9 | 101.1 | 101.0 | 100.4 | 99.8 | 99.3 | 98.8 | | C.2 Consumer Price Index for Agricultural Labourers (Base: 1986-87=100) | 99.3 | 99.3 | 99.7 | 100.8 | 100.8 | 100.7 | 101.0 | 100.8 | 99.9 | 99.6 | 99.1 | 98.8 | | C.3 Consumer Price Index for Rural Labourers (Base: 1986- 87=100) | 98.8 | 99.1 | 99.6 | 100.3 | 100.8 | 101.0 | 101.2 | 101.1 | 100.3 | 99.7 | 99.2 | 98.8 | | D. WPI (Base: 2011-12=100) All Commodities | 99.9 | 100.2 | 100.2 | 100.7 | 100.6 | 100.7 | 100.6 | 100.1 | 99.3 | 99.4 | 99.0 | 99.2 | | D.1 WPI - Primary Articles | 99.0 | 99.7 | 100.9 | 101.5 | 102.0 | 101.4 | 101.1 | 101.3 | 99.1 | 98.5 | 97.8 | 97.6 | | D.1.1 WPI - Food Articles | 99.0 | 99.3 | 100.4 | 101.6 | 102.0 | 102.0 | 102.3 | 101.9 | 98.7 | 98.6 | 97.2 | 96.8 | | D.2 WPI - FUEL & POWER | 99.2 | 100.1 | 99.8 | 101.5 | 100.9 | 101.1 | 100.9 | 100.3 | 99.5 | 99.1 | 98.8 | 98.9 | | D.3 WPI - Manufactured Products | 100.4 | 100.4 | 100.3 | 100.3 | 100.2 | 100.2 | 100.1 | 99.7 | 99.4 | 99.7 | 99.6 | 99.8 | | D.3.1 WPI - Manufacture of Food Products | 100.1 | 100.0 | 99.9 | 100.5 | 100.6 | 100.8 | 100.3 | 99.9 | 99.7 | 99.8 | 99.5 | 98.9 | | D.3.2 WPI - Manufacture of Chemicals & Chemical Products | 100.1 | 100.4 | 100.3 | 100.4 | 100.4 | 100.2 | 100.1 | 99.7 | 99.5 | 99.5 | 99.6 | 99.7 | | D.3.3 WPI - Manufacture of Basic Metals Alloys & Metals Products | 101.2 | 101.1 | 100.7 | 100.0 | 99.5 | 99.7 | 99.9 | 99.6 | 99.1 | 99.4 | 99.5 | 100.4 | | D.3.4 WPI - Manufacture of Machinery & Machine Tools | 100.3 | 100.3 | 100.3 | 100.0 | 99.9 | 100.0 | 99.9 | 99.9 | 99.8 | 99.7 | 99.9 | 100.1 | | E. IIP (Base 2011-12 = 100) General Index | 96.6 | 99.5 | 98.5 | 98.2 | 96.5 | 97.9 | 99.5 | 97.9 | 103.7 | 103.4 | 98.6 | 109.5 | | E.1.1 IIP - Primary goods | 97.1 | 102.2 | 99.1 | 97.8 | 97.7 | 95.0 | 100.6 | 98.2 | 104.2 | 104.0 | 96.0 | 108.1 |
| Table 1: Average Monthly Seasonal Factors of Selected Economic Time Series (Concld.) | | Series/Month | Apr | May | Jun | Jul | Aug | Sep | Oct | Nov | Dec | Jan | Feb | Mar | | 1 | 2 | 3 | 4 | 5 | 6 | 7 | 8 | 9 | 10 | 11 | 12 | 13 | | E.1.2 IIP - Capital goods | 89.7 | 96.9 | 100.9 | 95.4 | 96.2 | 102.4 | 94.9 | 97.9 | 100.1 | 95.8 | 102.2 | 127.7 | | E.1.3 IIP - Intermediate goods | 99.6 | 100.2 | 99.4 | 101.2 | 100.4 | 100.3 | 98.5 | 97.1 | 100.2 | 100.0 | 96.5 | 106.7 | | E.1.4 IIP - Infrastructure/ construction goods | 99.9 | 105.1 | 101.8 | 101.5 | 97.7 | 97.0 | 97.2 | 92.3 | 99.8 | 103.6 | 97.9 | 106.0 | | E.1.5 IIP - Consumer goods | 95.6 | 98.1 | 96.5 | 97.7 | 96.4 | 99.9 | 101.8 | 99.6 | 104.0 | 102.7 | 100.1 | 107.3 | | E.1.5.1 IIP - Consumer durables | 94.3 | 97.2 | 97.3 | 98.2 | 96.8 | 106.2 | 107.4 | 101.7 | 98.8 | 99.0 | 96.6 | 106.1 | | E.1.5.2 IIP - Consumer non-durables | 95.3 | 98.9 | 96.6 | 97.9 | 96.3 | 95.7 | 95.8 | 98.3 | 108.3 | 105.8 | 102.5 | 108.5 | | E.2.1 IIP - Mining | 98.3 | 100.8 | 95.6 | 92.3 | 90.9 | 89.4 | 97.8 | 99.7 | 106.9 | 108.6 | 102.4 | 117.8 | | E.2.2 IIP - Manufacturing | 96.0 | 99.1 | 98.6 | 98.8 | 97.1 | 99.0 | 99.4 | 97.7 | 103.7 | 102.9 | 98.8 | 108.5 | | E.2.2.1 IIP - Manufacture of food products | 94.8 | 87.5 | 86.0 | 90.7 | 88.2 | 88.8 | 94.9 | 101.9 | 122.5 | 120.3 | 113.3 | 111.0 | | E.2.2.2 IIP - Manufacture of beverages | 123.0 | 134.9 | 108.5 | 88.2 | 83.1 | 88.5 | 90.8 | 84.3 | 88.7 | 92.3 | 98.3 | 120.3 | | E.2.2.3 IIP - Manufacture of textiles | 97.1 | 98.5 | 97.8 | 101.5 | 103.6 | 102.0 | 101.8 | 98.7 | 100.7 | 100.8 | 95.6 | 101.9 | | E.2.2.4 IIP - Manufacture of chemicals and chemical products | 93.5 | 100.9 | 100.6 | 104.7 | 102.8 | 101.3 | 100.6 | 98.4 | 100.8 | 99.7 | 93.9 | 102.7 | | E.2.2.5 IIP - Manufacture of motor vehicles, trailers and semi-trailers | 100.5 | 102.0 | 98.1 | 100.2 | 98.8 | 100.8 | 100.6 | 100.8 | 94.1 | 98.6 | 99.6 | 105.4 | | E.2.3 IIP - Electricity | 99.8 | 104.2 | 99.7 | 101.7 | 101.2 | 98.7 | 102.7 | 95.7 | 98.9 | 100.2 | 93.4 | 103.3 | | E.3 Cement Production | 104.3 | 103.4 | 99.4 | 97.0 | 90.2 | 91.4 | 99.0 | 92.2 | 102.3 | 106.3 | 101.1 | 113.6 | | E.4 Steel Production | 98.4 | 103.9 | 98.5 | 100.3 | 99.2 | 96.8 | 99.2 | 95.3 | 100.5 | 104.1 | 97.9 | 105.3 | | E.5 Coal Production | 91.3 | 93.5 | 89.0 | 83.8 | 83.0 | 82.3 | 97.3 | 104.4 | 113.4 | 116.8 | 110.8 | 134.6 | | E.6 Crude Oil Production | 98.9 | 101.4 | 99.2 | 101.5 | 101.2 | 97.8 | 101.9 | 99.2 | 102.1 | 101.7 | 92.5 | 102.5 | | E.7 Petroleum Refinery Production | 96.0 | 100.0 | 99.6 | 101.6 | 100.9 | 95.7 | 101.3 | 98.2 | 103.3 | 102.8 | 95.7 | 105.1 | | E.8 Fertiliser Production | 81.7 | 95.9 | 98.6 | 105.5 | 105.9 | 104.2 | 107.7 | 105.2 | 106.3 | 102.8 | 93.2 | 92.7 | | E.9 Natural Gas Production | 97.6 | 101.6 | 98.6 | 102.1 | 101.5 | 98.5 | 102.5 | 99.7 | 102.5 | 101.8 | 91.5 | 102.0 | | F.1 Production of Commercial Motor Vehicles | 95.0 | 95.8 | 90.9 | 96.5 | 98.1 | 99.0 | 99.7 | 100.6 | 94.0 | 105.9 | 106.1 | 117.6 | | F.2 Cargo handled at Major Ports | 99.9 | 103.9 | 96.5 | 99.1 | 98.2 | 93.0 | 98.6 | 99.1 | 102.6 | 104.1 | 95.5 | 108.7 | | F.3 Railway Freight Traffic | 97.4 | 100.7 | 96.5 | 97.9 | 95.4 | 93.4 | 98.8 | 98.6 | 103.8 | 106.6 | 97.9 | 112.7 | | F.4 Sales of Commercial Motor Vehicles | 86.1 | 90.9 | 96.9 | 94.2 | 95.5 | 106.4 | 99.7 | 94.0 | 98.0 | 103.6 | 104.3 | 129.1 | | F.5 Passenger flown (Km) - Domestic | 101.2 | 112.0 | 103.5 | 96.4 | 94.2 | 89.3 | 98.6 | 99.7 | 107.9 | 102.9 | 95.9 | 98.5 | | F.6 Passenger flown (Km) - International | 96.2 | 101.0 | 100.7 | 106.0 | 104.0 | 93.4 | 93.3 | 95.2 | 105.8 | 109.0 | 93.9 | 101.8 | | G.1 Exports | 97.2 | 100.7 | 100.5 | 100.2 | 97.8 | 101.6 | 97.7 | 92.4 | 101.5 | 99.3 | 96.1 | 115.1 | | G.2 Imports | 99.3 | 104.9 | 100.2 | 103.7 | 98.8 | 102.4 | 106.0 | 98.8 | 98.4 | 97.0 | 90.9 | 100.9 | | G.3 Non-Oil Non-Gold Imports | 94.6 | 99.1 | 100.6 | 102.2 | 98.8 | 100.6 | 105.1 | 103.0 | 104.1 | 100.1 | 93.1 | 98.4 | 1 Seasonal factors: Deviation from 100 indicates presence of seasonality. For instance, seasonal factor of WPI- fruits & vegetables increases during Oct(107.6) and decreases during Mar (89.8) indicating that fruits and vegetables exert price pressure in wholesale market during October and eases during March due to seasonal fluctuations. Note 2: For all CPI indices, the average monthly seasonal factors have been computed on the basis of last 6 years (i.e., April 2011 to March 2017). Further average linking factor has been used to compute the back series of IIP (Overall, mining, manufacturing and electricity) and WPI series. The average linking factor was calculated based on IIP/ WPI series for the common period from Apr 2012 to Mar 2017. The back series of IIP, however, was not compiled at further disaggregated level (use based and NIC-2 digit level) due to major changes in coverage. | Table 2: Range (Difference Between Peak and Trough) of Seasonal Factors (Contd.) | | Series \ Year | 2007-08 | 2008-09 | 2009-10 | 2010-11 | 2011-12 | 2012-13 | 2013-14 | 2014-15 | 2015-16 | 2016-17 | Average Range | | 1 | 2 | 3 | 4 | 5 | 6 | 7 | 8 | 9 | 10 | 11 | 12 | | A.1.1 Broad Money (M3) | 3.0 | 3.0 | 2.8 | 2.6 | 2.3 | 2.1 | 2.0 | 2.0 | 1.9 | 1.9 | 2.4 | | A.1.1.1 Net Bank Credit to Government | 5.3 | 5.3 | 4.9 | 4.4 | 4.0 | 3.5 | 3.0 | 2.9 | 3.0 | 3.1 | 3.9 | | A.1.1.2 Bank Credit to Commercial Sector | 4.2 | 4.3 | 4.2 | 3.8 | 3.2 | 2.7 | 2.4 | 2.4 | 2.5 | 2.6 | 3.2 | | A.1.2 Narrow Money (M1) | 6.2 | 6.0 | 5.4 | 4.9 | 4.5 | 4.0 | 3.7 | 4.2 | 4.7 | 5.1 | 4.9 | | A.1.3 Reserve Money (RM) | 6.3 | 6.5 | 6.7 | 6.6 | 6.5 | 6.4 | 6.3 | 6.2 | 6.3 | 6.4 | 6.4 | | A.1.3.1 Currency in Circulation | 6.8 | 6.6 | 6.3 | 5.9 | 5.6 | 5.3 | 5.1 | 5.0 | 5.1 | 5.1 | 5.7 | | A.2.1 Aggregate Deposits (SCBs) | 2.5 | 2.5 | 2.3 | 2.1 | 1.9 | 1.7 | 1.6 | 1.5 | 1.4 | 1.4 | 1.9 | | A.2.1.1 Demand Deposits (SCBs) | 14.5 | 14.3 | 13.0 | 11.1 | 8.6 | 6.2 | 5.4 | 5.8 | 6.6 | 7.3 | 9.3 | | A.2.1.2 Time Deposits (SCBs) | 2.2 | 2.2 | 2.3 | 2.2 | 2.0 | 1.6 | 1.3 | 1.1 | 1.2 | 1.3 | 1.7 | | A.3.1 Cash in Hand and Balances with RBI (SCBs) | 11.2 | 9.8 | 7.7 | 5.6 | 4.5 | 3.5 | 4.2 | 4.6 | 5.1 | 5.7 | 6.2 | | A.3.2 Bank Credit (SCBs) | 4.1 | 4.3 | 4.2 | 3.9 | 3.5 | 3.1 | 2.8 | 2.6 | 2.5 | 2.5 | 3.4 | | A.3.2.1 Loans, Cash, Credits and Overdrafts (SCBs) | 4.8 | 4.5 | 4.3 | 4.2 | 4.2 | 4.2 | 4.2 | 4.2 | 4.1 | 4.2 | 4.3 | | A.3.2.2 Non-Food Credit (SCBs) | 4.2 | 4.5 | 4.5 | 4.1 | 3.6 | 3.1 | 2.8 | 2.7 | 2.8 | 2.9 | 3.5 | | A.3.3 Investments (SCBs) | 4.1 | 4.5 | 4.7 | 4.8 | 4.6 | 4.4 | 4.0 | 3.7 | 3.4 | 3.3 | 4.1 | | B. CPI (Base: 2012 = 100) All Commodities | | | | | 2.2 | 2.2 | 2.2 | 2.1 | 2.1 | 2.1 | 2.1 | | B.1 CPI - Food and beverages | | | | | 4.3 | 4.3 | 4.4 | 4.5 | 4.6 | 4.6 | 4.4 | | B.1.1 CPI - Cereals and products | | | | | 1.0 | 0.9 | 0.8 | 0.7 | 0.6 | 0.6 | 0.8 | | B.1.2 CPI - Meat and fish | | | | | 3.1 | 3.1 | 3.2 | 3.3 | 3.4 | 3.5 | 3.3 | | B.1.3 CPI - Egg | | | | | 8.6 | 8.2 | 7.8 | 7.4 | 7.3 | 7.1 | 7.7 | | B.1.4 CPI - Milk and products | | | | | 0.9 | 0.9 | 0.8 | 0.7 | 0.7 | 0.7 | 0.8 | | B.1.5 CPI - Fruits | | | | | 6.5 | 6.5 | 6.5 | 6.5 | 6.6 | 6.5 | 6.5 | | B.1.6 CPI - Vegetables | | | | | 22.6 | 22.6 | 22.4 | 22.4 | 22.5 | 22.7 | 22.5 | | B.1.6.1 CPI - Potato | | | | | 36.9 | 37.0 | 37.1 | 37.8 | 38.2 | 38.2 | 37.5 | | B.1.6.2 CPI - Onion | | | | | 47.8 | 48.5 | 49.0 | 50.3 | 50.0 | 49.6 | 49.2 | | B.1.6.3 CPI - Tomato | | | | | 62.7 | 62.8 | 63.1 | 63.0 | 63.0 | 63.6 | 63.1 | | B.1.7 CPI - Pulses and products | | | | | 2.9 | 3.1 | 3.6 | 4.2 | 4.9 | 5.5 | 4.0 | | B.1.8 CPI - Spices | | | | | 1.7 | 1.6 | 1.4 | 1.3 | 1.2 | 1.1 | 1.4 | | B.1.9 CPI - Non-alcoholic beverages | | | | | 0.3 | 0.3 | 0.3 | 0.3 | 0.3 | 0.3 | 0.3 | | B.1.10 CPI - Prepared meals, snacks, sweets etc. | | | | | 0.8 | 0.8 | 0.7 | 0.6 | 0.5 | 0.4 | 0.6 | | B.2 CPI - Clothing and footwear | | | | | 0.7 | 0.7 | 0.6 | 0.5 | 0.4 | 0.3 | 0.5 | | B.3 CPI - Housing | | | | | 1.3 | 1.2 | 1.0 | 1.0 | 1.0 | 1.0 | 1.1 | | B.4 CPI - Miscellaneous | | | | | 0.8 | 0.8 | 0.7 | 0.7 | 0.6 | 0.6 | 0.7 | | C.1 Consumer Price Index for Industrial Workers (Base: 2001=100) | 2.1 | 2.1 | 2.1 | 2.1 | 2.2 | 2.3 | 2.4 | 2.5 | 2.5 | 2.4 | 2.3 | | C.2 Consumer Price Index for Agricultural Labourers (Base: 1986-87=100) | 2.2 | 2.1 | 2.0 | 2.0 | 2.1 | 2.2 | 2.2 | 2.3 | 2.3 | 2.4 | 2.2 | | C.3 Consumer Price Index for Rural Labourers (Base: 1986-87=100) | 2.4 | 2.4 | 2.4 | 2.4 | 2.4 | 2.5 | 2.5 | 2.6 | 2.6 | 2.6 | 2.5 | | D. WPI (Base: 2011-12=100) All Commodities | 2.0 | 1.9 | 1.7 | 1.4 | 1.4 | 1.6 | 1.9 | 2.0 | 2.1 | 2.2 | 1.8 | | D.1 WPI - Primary Articles | 4.1 | 3.9 | 3.6 | 3.5 | 3.9 | 4.3 | 4.8 | 5.2 | 5.4 | 5.3 | 4.4 | | D.1.1 WPI - Food Articles | 5.8 | 5.9 | 5.8 | 5.6 | 5.5 | 5.5 | 5.7 | 5.8 | 5.8 | 5.7 | 5.7 | | D.2 WPI - Fuel & Power | 3.5 | 3.4 | 2.9 | 2.3 | 2.0 | 2.0 | 2.7 | 3.7 | 4.5 | 5.1 | 3.2 | | D.3 WPI - Manufactured Products | 1.5 | 1.4 | 1.3 | 1.1 | 1.0 | 0.9 | 0.8 | 0.9 | 0.9 | 0.9 | 1.1 | | D.3.1 WPI - Manufacture of Food Products | 1.6 | 1.7 | 1.9 | 2.0 | 2.1 | 2.1 | 2.0 | 1.9 | 1.8 | 1.8 | 1.9 | | D.3.2 WPI - Manufacture of Chemicals & Chemical Products | 1.0 | 1.0 | 1.0 | 1.0 | 1.0 | 0.9 | 1.0 | 1.1 | 1.3 | 1.4 | 1.1 | | D.3.3 WPI - Manufacture of Basic Metals Alloys & Metals Products | 3.4 | 2.8 | 2.2 | 1.7 | 1.4 | 1.2 | 1.4 | 1.8 | 2.3 | 2.7 | 2.1 | | D.3.4 WPI - Manufacture of Machinery & Machine Tools | 0.9 | 0.7 | 0.6 | 0.6 | 0.6 | 0.7 | 0.7 | 0.6 | 0.7 | 0.7 | 0.7 | | E. IIP (Base 2011-12 = 100) General Index | 13.8 | 14.1 | 14.3 | 14.3 | 14.0 | 13.3 | 12.5 | 12.4 | 12.5 | 12.6 | 13.4 | | E.1.1 IIP - Primary goods | | | | | | 12.7 | 12.9 | 13.1 | 13.2 | 13.3 | 13.0 |
| Table 2: Range (Difference Between Peak and Trough) of Seasonal Factors (Concld.) | | Series \ Year | 2007-08 | 2008-09 | 2009-10 | 2010-11 | 2011-12 | 2012-13 | 2013-14 | 2014-15 | 2015-16 | 2016-17 | Average Range | | 1 | 2 | 3 | 4 | 5 | 6 | 7 | 8 | 9 | 10 | 11 | 12 | | E.1.2 IIP - Capital goods | | | | | | 37.9 | 38.0 | 37.8 | 38.2 | 38.2 | 38.0 | | E.1.3 IIP - Intermediate goods | | | | | | 10.3 | 10.2 | 10.2 | 10.1 | 10.2 | 10.2 | | E.1.4 IIP - Infrastructure/ construction goods | | | | | | 12.4 | 12.9 | 13.6 | 14.4 | 15.2 | 13.7 | | E.1.5 IIP - Consumer goods | | | | | | 12.0 | 11.8 | 11.6 | 11.5 | 11.3 | 11.6 | | E.1.5.1 IIP - Consumer durables | | | | | | 14.0 | 13.8 | 13.3 | 12.7 | 12.2 | 13.2 | | E.1.5.2 IIP - Consumer non-durables | | | | | | 14.4 | 13.8 | 13.1 | 13.3 | 13.6 | 13.6 | | E.2.1 IIP - Mining | 25.1 | 26.1 | 27.0 | 27.8 | 28.8 | 29.4 | 29.8 | 30.0 | 30.1 | 29.9 | 28.4 | | E.2.2 IIP - Manufacturing | 14.2 | 13.4 | 12.9 | 12.5 | 12.1 | 11.9 | 12.1 | 12.2 | 12.4 | 12.4 | 12.6 | | E.2.2.1 IIP - Manufacture of food products | | | | | | 36.6 | 36.6 | 36.5 | 36.5 | 36.5 | 36.5 | | E.2.2.2 IIP - Manufacture of beverages | | | | | | 54.5 | 53.7 | 52.0 | 50.0 | 48.5 | 51.7 | | E.2.2.3 IIP - Manufacture of textiles | | | | | | 9.2 | 8.7 | 8.1 | 7.4 | 6.7 | 8.0 | | E.2.2.4 IIP - Manufacture of chemicals and chemical products | | | | | | 11.4 | 11.4 | 11.3 | 11.1 | 10.8 | 11.2 | | E.2.2.5 IIP - Manufacture of motor vehicles, trailers and semi-trailers | | | | | | 12.0 | 11.8 | 11.4 | 11.0 | 10.3 | 11.3 | | E.2.3 IIP - Electricity | 10.3 | 10.7 | 11.3 | 11.2 | 10.7 | 10.8 | 11.4 | 12.1 | 12.5 | 12.8 | 11.4 | | E.3 Cement Production | 21.6 | 22.1 | 23.1 | 23.7 | 24.4 | 24.4 | 24.4 | 23.8 | 23.6 | 23.3 | 23.5 | | E.4 Steel Production | 12.3 | 10.7 | 10.7 | 10.4 | 10.2 | 10.7 | 10.9 | 10.9 | 10.9 | 11.0 | 10.9 | | E.5 Coal Production | 49.3 | 51.5 | 53.3 | 54.5 | 55.0 | 54.3 | 53.0 | 51.9 | 51.3 | 51.0 | 52.5 | | E.6 Crude Oil Production | 10.1 | 10.1 | 10.2 | 10.2 | 10.2 | 10.1 | 10.1 | 9.9 | 9.8 | 9.6 | 10.0 | | E.7 Petroleum Refinery Production | 8.7 | 8.7 | 9.1 | 9.4 | 10.1 | 10.5 | 10.7 | 10.6 | 10.3 | 10.2 | 9.8 | | E.8 Fertiliser Production | 27.3 | 26.3 | 25.6 | 26.2 | 26.8 | 27.3 | 27.3 | 26.5 | 25.3 | 24.1 | 26.3 | | E.9 Natural Gas Production | 12.2 | 12.0 | 11.3 | 11.0 | 10.8 | 10.8 | 10.9 | 10.9 | 11.1 | 11.3 | 11.2 | | F.1 Production of Commercial Motor Vehicles | 28.7 | 29.0 | 29.3 | 28.8 | 27.5 | 26.0 | 25.2 | 25.1 | 26.9 | 27.5 | 27.4 | | F.2 Cargo handled at Major Ports | 17.6 | 17.2 | 16.7 | 16.0 | 15.3 | 14.8 | 14.6 | 14.6 | 15.1 | 15.4 | 15.7 | | F.3 Railway Freight Traffic | 21.6 | 21.4 | 21.1 | 20.6 | 20.0 | 19.1 | 18.3 | 17.4 | 16.8 | 16.4 | 19.3 | | F.4 Sales of Commercial Motor Vehicles | 47.6 | 45.2 | 43.3 | 41.8 | 40.9 | 40.8 | 41.6 | 42.3 | 42.9 | 43.3 | 43.0 | | F.5 Passenger flown (Km) - Domestic | 22.7 | 23.9 | 25.3 | 25.8 | 25.7 | 24.3 | 22.4 | 20.3 | 18.6 | 17.6 | 22.7 | | F.6 Passenger flown (Km) - International | 17.1 | 17.9 | 17.7 | 16.1 | 14.7 | 16.3 | 17.9 | 18.3 | 18.2 | 17.7 | 17.2 | | G.1 Exports | 20.1 | 19.7 | 20.5 | 22.1 | 23.6 | 24.3 | 24.5 | 24.2 | 24.0 | 23.6 | 22.6 | | G.2 Imports | 22.1 | 20.4 | 17.4 | 14.7 | 13.2 | 12.3 | 12.7 | 13.4 | 14.3 | 14.4 | 15.5 | | G.3 Non-Oil Non-Gold Imports | 17.1 | 16.1 | 14.5 | 13.2 | 12.0 | 10.8 | 10.7 | 10.9 | 11.2 | 11.4 | 12.8 | * *Seasonal adjustment for these series is based on 10 years data depending on availability. Guidelines of both the Office of National Statistics (ONS), UK, and the US Census Bureau, however, suggest using more than ten years data for estimating stable monthly seasonal factors. | Table 3: Change in seasonal variation in 2016-17 vis-à-vis previous 5-years (2011-12 to 2015-16) | | Name of Variable | 2016-17 | Average Range* | Change | Name of Variable | 2016-17 | Average Range* | Change | | 1 | 2 | 3 | 4 | 1 | 2 | 3 | 4 | | A.1.1 Broad Money (M3) | 1.9 | 2.1 | -0.2 | D.2 WPI - Fuel & Power | 5.1 | 3.0 | 2.1 | | A.1.1.1 Net Bank Credit to Government | 3.1 | 3.3 | -0.2 | D.3 WPI - Manufactured Products | 0.9 | 0.9 | 0.0 | | A.1.1.2 Bank Credit to Commercial Sector | 2.6 | 2.6 | 0.0 | D.3.1 WPI - Manufacture of Food Products | 1.8 | 2.0 | -0.2 | | A.1.2 Narrow Money (M1) | 5.1 | 4.2 | 0.8 | D.3.2 WPI - Manufacture of Chemicals & Chemical Products | 1.4 | 1.1 | 0.4 | | A.1.3 Reserve Money (RM) | 6.4 | 6.3 | 0.0 | D.3.3 WPI - Manufacture of Basic Metals Alloys & Metals Products | 2.7 | 1.6 | 1.1 | | A.1.3.1 Currency in Circulation | 5.1 | 5.2 | -0.1 | D.3.4 WPI - Manufacture of Machinery & Machine Tools | 0.7 | 0.7 | 0.0 | | A.2.1 Aggregate Deposits (SCBs) | 1.4 | 1.6 | -0.3 | E. IIP (Base 2011-12 = 100) General Index | 12.6 | 12.9 | -0.4 | | A.2.1.1 Demand Deposits (SCBs) | 7.3 | 6.5 | 0.7 | E.1.1 IIP - Primary goods | 13.3 | 13.0 | 0.3 | | A.2.1.2 Time Deposits (SCBs) | 1.3 | 1.4 | -0.2 | E.1.2 IIP - Capital goods | 38.2 | 38.0 | 0.2 | | A.3.1 Cash in Hand and Balances with RBI (SCBs) | 5.7 | 4.4 | 1.3 | E.1.3 IIP - Intermediate goods | 10.2 | 10.2 | 0.0 | | A.3.2 Bank Credit (SCBs) | 2.5 | 2.9 | -0.4 | E.1.4 IIP - Infrastructure/ construction goods | 15.2 | 13.3 | 1.9 | | A.3.2.1 Loans, Cash, Credits and Overdrafts (SCBs) | 4.2 | 4.2 | 0.0 | E.1.5 IIP - Consumer goods | 11.3 | 11.7 | -0.4 | | A.3.2.2 Non-Food Credit (SCBs) | 2.9 | 3.0 | -0.1 | E.1.5.1 IIP - Consumer durables | 12.2 | 13.4 | -1.3 | | A.3.3 Investments (SCBs) | 3.3 | 4.0 | -0.7 | E.1.5.2 IIP - Consumer non-durables | 13.6 | 13.6 | 0.0 | | B. CPI (Base: 2012 = 100) All Commodities | 2.1 | 2.2 | -0.1 | E.2.1 IIP - Mining | 29.9 | 29.6 | 0.3 | | B.1 CPI - Food and beverages | 4.6 | 4.4 | 0.2 | E.2.2 IIP - Manufacturing | 12.4 | 12.1 | 0.2 | | B.1.1 CPI - Cereals and products | 0.6 | 0.8 | -0.2 | E.2.2.1 IIP - Manufacture of food products | 36.5 | 36.5 | -0.1 | | B.1.2 CPI - Meat and fish | 3.5 | 3.2 | 0.2 | E.2.2.2 IIP - Manufacture of beverages | 48.5 | 52.6 | -4.1 | | B.1.3 CPI - Egg | 7.1 | 7.9 | -0.8 | E.2.2.3 IIP - Manufacture of textiles | 6.7 | 8.3 | -1.7 | | B.1.4 CPI - Milk and products | 0.7 | 0.8 | -0.1 | E.2.2.4IIP-Manufactureofchemicalsandchemicalproducts | 10.8 | 11.3 | -0.5 | | B.1.5 CPI - Fruits | 6.5 | 6.5 | 0.0 | E.2.2.5 IIP - Manufacture of motor vehicles, trailers and semi-trailers | 10.3 | 11.5 | -1.2 | | B.1.6 CPI - Vegetables | 22.7 | 22.5 | 0.2 | E.2.3 IIP - Electricity | 12.8 | 11.5 | 1.3 | | B.1.6.1 CPI - Potato | 38.2 | 37.4 | 0.8 | E.3 Cement Production | 23.3 | 24.1 | -0.8 | | B.1.6.2 CPI - Onion | 49.6 | 49.1 | 0.5 | E.4 Steel Production | 11.0 | 10.7 | 0.3 | | B.1.6.3 CPI - Tomato | 63.6 | 62.9 | 0.7 | E.5 Coal Production | 51.0 | 53.1 | -2.2 | | B.1.7 CPI - Pulses and products | 5.5 | 3.7 | 1.7 | E.6 Crude Oil Production | 9.6 | 10.0 | -0.4 | | B.1.8 CPI - Spices | 1.1 | 1.4 | -0.3 | E.7 Petroleum Refinery Production | 10.2 | 10.4 | -0.2 | | B.1.9 CPI - Non-alcoholic beverages | 0.3 | 0.3 | 0.0 | E.8 Fertiliser Production | 24.1 | 26.6 | -2.5 | | B.1.10 CPI - Prepared meals, snacks, sweets etc. | 0.4 | 0.7 | -0.3 | E.9 Natural Gas Production | 11.3 | 10.9 | 0.4 | | B.2 CPI - Clothing and footwear | 0.3 | 0.6 | -0.2 | F.1 Production of Commercial Motor Vehicles | 27.5 | 26.2 | 1.3 | | B.3 CPI - Housing | 1.0 | 1.1 | -0.1 | F.2 Cargo handled at Major Ports | 15.4 | 14.9 | 0.5 | | B.4 CPI - Miscellaneous | 0.6 | 0.7 | -0.1 | F.3 Railway Freight Traffic | 16.4 | 18.3 | -2.0 | | C.1 Consumer Price Index for Industrial Workers (Base: 2001=100) | 2.4 | 2.4 | 0.1 | F.4 Sales of Commercial Motor Vehicles | 43.3 | 41.7 | 1.6 | | C.2 Consumer Price Index for Agricultural Labourers (Base: 1986-87=100) | 2.4 | 2.2 | 0.2 | F.5 Passenger flown (Km) - Domestic | 17.6 | 22.3 | -4.7 | | C.3 Consumer Price Index for Rural Labourers (Base: 1986-87=100) | 2.6 | 2.5 | 0.0 | F.6 Passenger flown (Km) - International | 17.7 | 17.1 | 0.7 | | D. WPI (Base: 2011-12=100) All Commodities | 2.2 | 1.8 | 0.4 | G.1 Exports | 23.6 | 24.1 | -0.5 | | D.1 WPI - Primary Articles | 5.3 | 4.7 | 0.6 | G.2 Imports | 14.4 | 13.2 | 1.2 | | D.1.1 WPI - Food Articles | 5.7 | 5.7 | 0.1 | G.3 Non-Oil Non-Gold Imports | 11.4 | 11.1 | 0.3 | *Average Range of Monthly Seasonal Factors for the last 5-years (2010-11 to 2014-15) Note 2: For all IIP series (excluding Mining, Manufacturing, Electricity and IIP-General), previous 4-years average range of monthly seasonal factors have been considered. | Table 4: List of Top-Twenty and Bottom-Twenty Series based on Average Range of Monthly Seasonal Factors during Last Five Years (2012-13 to 2016-17) and corresponding Peak and Trough Months | | Name of Top-Twenty Series | Average Range | Peak Month | Trough Month | Name of Bottom-Twenty Series | Average Range | Peak Month | Trough Month | | 1 | 2 | 3 | 4 | 5 | 6 | 7 | 8 | | B.1.6.3 CPI - Tomato | 63.1 | Jul | Feb | C.1 Consumer Price Index for Industrial Workers (Base: 2001=100) | 2.4 | Oct | Mar | | E.5 Coal Production | 52.3 | Mar | Aug | C.2 Consumer Price Index for Agricultural Labourers (Base: 1986-87=100) | 2.3 | Oct | Mar | | E.2.2.2 IIP - Manufacture of beverages | 51.7 | May | Aug | B. CPI (Base: 2012 = 100) All Commodities | 2.1 | Sep | Mar | | B.1.6.2 CPI - Onion | 49.5 | Sep | May | A.1.1 Broad Money (M3) | 2.0 | Apr | Sep | | F.4 Sales of Commercial Motor Vehicles | 42.1 | Mar | Apr | D. WPI (Base: 2011-12=100) All Commodities | 2.0 | Sep | Feb | | E.1.2 IIP - Capital goods | 38.0 | Mar | Apr | D.3.1 WPI - Manufacture of Food Products | 1.9 | Sep | Mar | | B.1.6.1 CPI - Potato | 37.7 | Nov | Feb | D.3.3 WPI - Manufacture of Basic Metals Alloys & Metals Products | 1.9 | Apr | Dec | | E.2.2.1 IIP - Manufacture of food products | 36.5 | Dec | Jun | A.2.1 Aggregate Deposits (SCBs) | 1.5 | Apr | Feb | | E.2.1 IIP - Mining | 29.8 | Mar | Sep | A.2.1.2 Time Deposits (SCBs) | 1.3 | Apr | Feb | | F.1 Production of Commercial Motor Vehicles | 26.1 | Mar | Dec | B.1.8 CPI - Spices | 1.3 | Dec | Apr | | E.8 Fertiliser Production | 26.1 | Oct | Apr | D.3.2 WPI - Manufacture of Chemicals & Chemical Products | 1.1 | Jul | Jan | | G.1 Exports | 24.1 | Mar | Nov | B.3 CPI - Housing | 1.1 | Nov | Jun | | E.3 Cement Production | 23.9 | Mar | Aug | D.3 WPI - Manufactured Products | 0.9 | May | Dec | | B.1.6 CPI - Vegetables | 22.5 | Sep | Mar | B.1.4 CPI - Milk and products | 0.7 | Sep | Apr | | F.5 Passenger flown (Km) - Domestic | 20.6 | May | Sep | B.1.1 CPI - Cereals and products | 0.7 | Oct | May | | F.6 Passenger flown (Km) - International | 17.7 | Jan | Sep | B.4 CPI - Miscellaneous | 0.7 | Sep | Apr | | F.3 Railway Freight Traffic | 17.6 | Mar | Sep | D.3.4 WPI - Manufacture of Machinery & Machine Tools | 0.7 | Apr | Jan | | F.2 Cargo handled at Major Ports | 14.9 | Mar | Sep | B.1.10 CPI - Prepared meals, snacks, sweets etc. | 0.6 | Nov | May | | E.1.4 IIP - Infrastructure/ construction goods | 13.7 | Mar | Nov | B.2 CPI - Clothing and footwear | 0.5 | Dec | May | | E.1.5.2 IIP - Consumer non-durables | 13.6 | Mar | Apr | B.1.9 CPI - Non-alcoholic beverages | 0.3 | Sep | Mar |
| Table 5: Regression estimates | | Name of Variable | Co-efficient estimate | p-value | Name of Variable | Co-efficient estimate | p-value | | 1 | 2 | 3 | 1 | 2 | 3 | | A.1.1 Broad Money (M3) | -0.140 | 0.000 | D.2 WPI - FUEL & POWER | 0.163 | 0.163 | | A.1.1.1 Net Bank Credit to Government | -0.308 | 0.000 | D.3 WPI - MANUFACTURED PRODUCTS | -0.078 | 0.000 | | A.1.1.2 Bank Credit to Commercial Sector | -0.247 | 0.000 | D.3.1 WPI - Manufacture of Food Products | 0.019 | 0.318 | | A.1.2 Narrow Money (M1) | -0.178 | 0.037 | D.3.2 WPI - Manufacture of Chemicals & Chemical Products | 0.033 | 0.055 | | A.1.3 Reserve Money (RM) | -0.028 | 0.109 | D.3.3 WPI - Manufacture of Basic Metals Alloys & Metals Products | -0.076 | 0.358 | | A.1.3.1 Currency in Circulation | -0.208 | 0.000 | D.3.4 WPI - Manufacture of Machinery & Machine Tools | -0.014 | 0.098 | | A.2.1 Aggregate Deposits (SCBs) | -0.143 | 0.000 | E. IIP (Base 2011-12 = 100) General Index | -0.232 | 0.002 | | A.2.1.1 Demand Deposits (SCBs) | -1.060 | 0.001 | E.1.1 IIP - Primary goods | 0.154 | 0.001 | | A.2.1.2 Time Deposits (SCBs) | -0.148 | 0.000 | E.1.2 IIP - Capital goods | 0.091 | 0.098 | | A.3.1 Cash in Hand and Balances with RBI (SCBs) | -0.627 | 0.014 | E.1.3 IIP - Intermediate goods | -0.037 | 0.086 | | A.3.2 Bank Credit (SCBs) | -0.233 | 0.000 | E.1.4 IIP - Infrastructure/ construction goods | 0.714 | 0.000 | | A.3.2.1 Loans, Cash, Credits and Overdrafts (SCBs) | -0.054 | 0.002 | E.1.5 IIP - Consumer goods | -0.178 | 0.001 | | A.3.2.2 Non-Food Credit (SCBs) | -0.228 | 0.000 | E.1.5.1 IIP - Consumer durables | -0.472 | 0.002 | | A.3.3 Investments (SCBs) | -0.134 | 0.010 | E.1.5.2 IIP - Consumer non-durables | -0.208 | 0.243 | | B. CPI (Base: 2012 = 100) All Commodities | -0.030 | 0.001 | E.2.1 IIP - Mining | 0.562 | 0.000 | | B.1 CPI - Food and beverages | 0.071 | 0.000 | E.2.2 IIP - Manufacturing | -0.170 | 0.017 | | B.1.1 CPI - Cereals and products | -0.086 | 0.001 | E.2.2.1 IIP - Manufacture of food products | -0.044 | 0.101 | | B.1.2 CPI - Meat and fish | 0.072 | 0.001 | E.2.2.2 IIP - Manufacture of beverages | -1.573 | 0.001 | | B.1.3 CPI - Egg | -0.309 | 0.001 | E.2.2.3 IIP - Manufacture of textiles | -0.633 | 0.000 | | B.1.4 CPI - Milk and products | -0.044 | 0.008 | E.2.2.4 IIP - Manufacture of chemicals and chemical products | -0.150 | 0.011 | | B.1.5 CPI - Fruits | 0.019 | 0.031 | E.2.2.5 IIP - Manufacture of motor vehicles, trailers and semi- trailers | -0.412 | 0.002 | | B.1.6 CPI - Vegetables | 0.008 | 0.820 | E.2.3 IIP - Electricity | 0.240 | 0.001 | | B.1.6.1 CPI - Potato | 0.307 | 0.003 | E.3 Cement Production | 0.186 | 0.071 | | B.1.6.2 CPI - Onion | 0.425 | 0.035 | E.4 Steel Production | -0.046 | 0.479 | | B.1.6.3 CPI - Tomato | 0.147 | 0.038 | E.5 Coal Production | 0.015 | 0.946 | | B.1.7 CPI - Pulses and products | 0.537 | 0.000 | E.6 Crude Oil Production | -0.048 | 0.011 | | B.1.8 CPI - Spices | -0.122 | 0.000 | E.7 Petroleum Refinery Production | 0.221 | 0.001 | | B.1.9 CPI - Non-alcoholic beverages | -0.003 | 0.027 | E.8 Fertiliser Production | -0.169 | 0.146 | | B.1.10 CPI - Prepared meals, snacks, sweets etc. | -0.090 | 0.000 | E.9 Natural Gas Production | -0.101 | 0.052 | | B.2 CPI - Clothing and footwear | -0.081 | 0.000 | F.1 Production of Commercial Motor Vehicles | -0.358 | 0.027 | | B.3 CPI - Housing | -0.048 | 0.032 | F.2 Cargo handled at Major Ports | -0.306 | 0.002 | | B.4 CPI - Miscellaneous | -0.058 | 0.001 | F.3 Railway Freight Traffic | -0.641 | 0.000 | | C.1 Consumer Price Index for Industrial Workers (Base: 2001=100) | 0.048 | 0.000 | F.4 Sales of Commercial Motor Vehicles | -0.375 | 0.108 | | C.2 Consumer Price Index for Agricultural Labourers (Base: 1986-87=100) | 0.039 | 0.003 | F.5 Passenger flown (Km) - Domestic | -0.726 | 0.013 | | C.3 Consumer Price Index for Rural Labourers (Base: 1986-87=100) | 0.027 | 0.000 | F.6 Passenger flown (Km) - International | 0.110 | 0.420 | | D. WPI (Base: 2011-12=100) All Commodities | 0.040 | 0.235 | G.1 Exports | 0.536 | 0.002 | | D.1 WPI - PRIMARY ARTICLES | 0.206 | 0.001 | G.2 Imports | -0.845 | 0.011 | | D.1.1 WPI - Food Articles | -0.004 | 0.806 | G.3 Non-Oil Non-Gold Imports | -0.682 | 0.001 |
|