Exploring the investment intentions and project implementation plans of private companies and joint business sectors juxtaposed with the cost of projects sanctioned by banks/financial institutions and other sources, this article finds that envisaged capital expenditure (capex) marginally improved in 2018-19. It also examines the underlying relationship between envisaged capex and realised capex in the national income accounts. Introduction Capital expenditure of the private corporate sector is a key driver of the investment climate in the economy and an indication of the ‘animal spirits’ that influence entrepreneurial energies and business sentiment. As information on capex from published annual accounts of companies is available with a considerable time lag, a cross-country best practice is to generate corporate investment forecasts on the basis of surveys of investment intentions and other relevant factors such as capacity utilisation and demand indicators (Barnes and Ellis, 2005; Aurizio and Stefano, 2011; Osterholm, 2013). India has also been a forerunner in this international experience, with surveys attempted since the late 1980s to assess and forecast investment intentions. Since 1978, the Reserve Bank of India has been providing an outlook on investment intentions. In essence, data on investment intentions are obtained from the financiers’ side – the banking sector and financial institutions (FIs)1 as well as external commercial borrowings (ECBs)2, foreign currency convertible bonds (FCCBs) and initial public offerings (IPOs), follow-on public offerings (FPOs), and rights issues for a year. The short term (one year ahead) forecasting of capex based on time phasing of corporate projects financed by financial institutions was pioneered by Dr. C. Rangarajan in 1970. Under this methodology, an estimate of the likely level of capex that would have been made during the year is obtained, based on ex ante phasing plans furnished by the companies at the time of appraisal, It is ensured that each project enters the information set only once even if it is financed through more than one channel. Projects not financed through any of the above-mentioned channels or of a size lower than ₹100 million are not covered. Projects with private ownership below 51 per cent or undertaken by trusts, Central and State Governments, and educational institutions are also excluded. A caveat to be noted is that it is assumed that companies adhere to their ex ante expenditure plans. Consequently, there is the possibility that some ex ante intentions do not fructify into realised investment. This article extends the tradition by estimating capex by the private corporate sector during 2017-18 and 2018-19. In doing so, it also explores the relationship between envisaged capex (based on project plans) and the realised capex (as available in the national accounts). As a cross-check, envisaged capex is compared with actual investment reported under the first revised estimates of national income for 2017-18 that were released by the Central Statistics Office (CSO) on January 31, 2019. The rest of the article is structured into four sections. Section II addresses the projects sanctioned or financed during the period of review, funding thereof, distributional aspects in terms of regions and industries and growth of corporate investment. Section III presents private placements and foreign direct investment. Section IV provides a time-series analysis of envisaged investment. Section V concludes the study. II. Projects Sanctioned / Financed Proposals of 490 projects with a total cost of ₹1,728 billion were sanctioned by banks and FIs during 2017-18. In addition, ECBs/ FCCBs to the tune of ₹247 billion were contracted by 292 companies in that year. Furthermore, 51 companies did not avail of financing from banks and FIs, but raised ₹16 billion for their capex needs through domestic equity issues. Altogether, 833 companies made investment plans during 2017-18, aggregating ₹1,991 billion, as against 916 companies with investment intentions totalling ₹2,028 billion in 2016-17 (Annex Tables 1-4). Industry-wise, chemical and chemical products industries accounted for 11 per cent of the total cost of projects in 2017-18, a significant rise over its quinquennial average (during 2012-13 to 2016-17) of 1.7 per cent. The share of the construction sector decreased to 5.1 per cent in 2017-18 from 12 per cent in 2016-17, indicating lacklustre activity in the sector. Within the infrastructure sector, the power sector continued to dominate, although its share dipped from 2016-17 (45.4 per cent) and quinquennial average (43.8 per cent) levels. The lower number of power sector projects sanctioned in 2017-18 also led to a contraction in its share in the total cost of projects (Chart 1 and Annex Table 5). The total cost of projects sanctioned in a year tends to be driven by the presence of mega projects which generally run over a longer span of time, as reflected in their phasing profile. There were 44 high value projects (₹10 billion - ₹50 billion), with a share of 44.1 per cent in the total project cost. The size-wise distribution of the projects accorded financial sanction by banks/FIs shows a decrease (from five in 2016-17 to three in 2017-18) in the number of mega projects (₹50 billion and above); however, there was a marginal increase in their share in total project cost (from 17.4 per cent in 2016-17 to 18.6 per cent in 2017-18). The ticket size (average cost of project) of mega projects rose in 2016-17 and 2017-18 from a trough in 2015-16 (Annex Table 6). 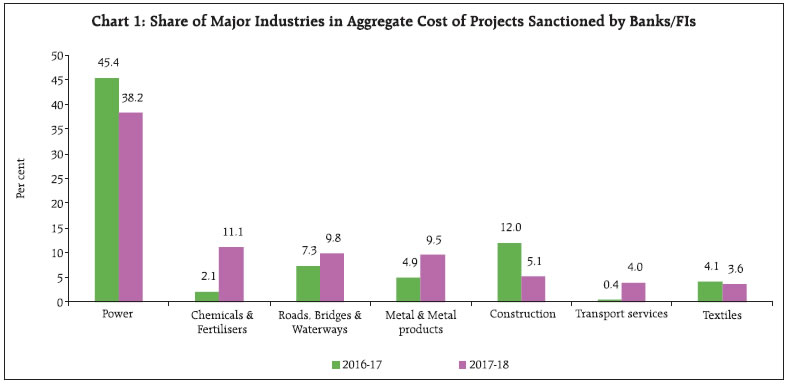 The location of a project is typically selected on the basis of factors such as accessibility of raw materials, availability of skilled labour, adequate infrastructure, market size, and growth prospects. Over the last five years (2013-14 to 2017-18), 68 per cent of the projects were taken up in Maharashtra, Gujarat, Andhra Pradesh, Karnataka, Odisha, Chhattisgarh, Tamil Nadu and Madhya Pradesh (Chart 2). Maharashtra also accounted for the highest share (22.6 per cent) in terms of total cost of projects sanctioned by banks/FIs in 2017-18 followed by Karnataka, Andhra Pradesh, Gujarat, Tamil Nadu, Rajasthan and Chhattisgarh in that order. Gujarat recorded a fall in its share from the previous year. The share of ‘multi-state’ projects has declined in the recent period, probably reflecting the bottlenecks in obtaining clearances from multiple authorities (Chart 3 and Annex Table 7). Investment in new projects occupied the largest share (89.3 per cent) in the total cost of projects sanctioned by banks and FIs. Expansion and modernisation constituted 9.2 per cent of the total project cost (Annex Table 8). The phasing profile of capex of projects sanctioned by banks/FIs indicate that around 38 per cent (₹650 billion) of the total proposed expenditure would be spent in 2017-18, 24 per cent (₹419 billion) in 2018-19 and 21 per cent (₹368 billion) in the year beyond. Around 17 per cent of total cost of projects sanctioned in 2017-18 was spent during 2014-15 to 2016-17. From the planned expenditure, the aggregate capex envisaged in 2017-18 showed a marginal decrease over the previous year partly due to decrease in sanctions by banks/FIs. In 2017-18, capex planned to be incurred from resources raised from international bond markets declined by 7 per cent from its level a year ago. The capital market (equity route) enabled financing of envisaged capex of ₹19 billion in 2017-18, which was significantly lower than in the previous year. 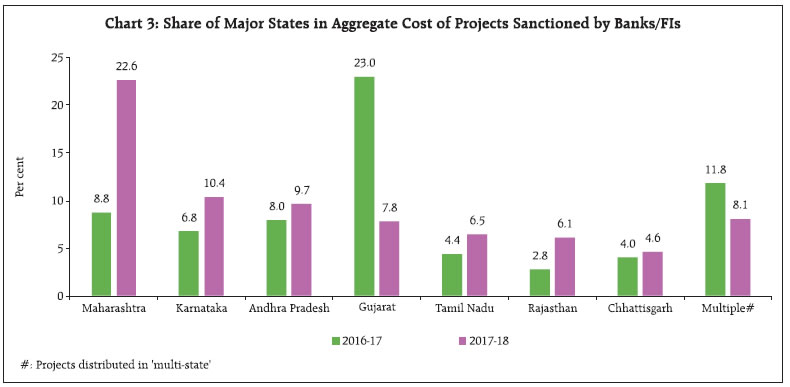 In sum, it is assessed that a total capex of ₹1,487 billion would have been incurred by the private corporate sector in 2017-18, of which ₹802 billion was from fresh sanctions during the year. The year marked the seventh successive annual contraction in the private corporate sector’s capex plans. However, the envisaged capex from the pipeline projects3 already undertaken showed an improvement over the previous year’s pipeline. On the basis of the pipeline projects sanctioned in preceding years, the planned capex could amount to ₹792 billion in 2018-19, marking an improvement over the previous year (₹685 billion). Going forward, the level of corporate investment in 2018-19 from the new cohort of projects getting sanctioned in 2018-19 will also influence the aggregate capex for this year. In the first half of 2018-19, 190 projects with a total cost of ₹914 billion were sanctioned by banks/FIs. A total of 451 investment proposals aggregating ₹1,158 billion were sanctioned through the three channels of finance (viz. Banks/FIs, ECBs/FCCBs/RDBs and IPOs) (Table 1). III. Corporate Investment Financed by Private Placements and Foreign Direct Investment In recent years, debt instruments like bonds and debentures and foreign direct investment (FDI) have assumed prominence as alternative sources of capex financing. Mobilisation of funds through private placement of debt (bonds and debentures) rose substantially during the period from 2013-14 to 2016-17, but moderated in 2017-18 and H1:2018-19. | Table 1: Phasing of Capex of Projects Funded Through Banks/FIs/ECBs/FCCBs/RDBs/IPOs in H1:2018-19* | | | No. of Projects | Amount sanctioned/ contracted in ₹ billion | 2015-16 | 2016-17 | 2017-18 | 2018-19 | 2019-20 | Beyond 2019-20 | | Banks/FIs | 190 | 914 | 6 | 51 | 46 | 399 | 225 | 187 | | ECBs/FCCBs/RDBs | 176 | 239 | | | | 233 | 6 | | | IPOs | 85 | 5 | | | | 4 | 1 | | | Total | 451 | 1,158 | 6 | 51 | 46 | 636 | 232 | 187 | | *: Provisional data. |
| Table 2: Private Placements and FDI (in ₹ billion) | | Period | Debt-Private Placements* | Foreign Direct Investment** | | 2011-12 | 270 | 1,651 | | 2012-13 | 591 | 1,219 | | 2013-14 | 560 | 1,475 | | 2014-15 | 974 | 1,891 | | 2015-16# | 1,175 | 2,623 | | 2016-17# | 1,544 | 2,917 | | 2017-18# | 1,299 | 2,889 | | H1:2018-19# | 549 | 1,551 | | (H1:2017-18)# | (584) | (1,625) | *: only for the manufacturing and services companies in the private sector.
**: FDI inflows includes equity capital only.
#: Provisional data.
Source: Prime Database and Government of India. | Similarly, FDI inflows, which witnessed consistent increase during the period, dipped marginally in 2017-18 and H1:2018-19 (Table 2). IV. A Time Series Analysis of Envisaged Investment Is there a relationship between envisaged capex and actual realisations? The one-year ahead forecasts of envisaged capex4 and realised investment in terms of gross fixed capital formation (GFCF) of the private sector in the national account statistics for the period 1991-92 to 2017-18 exhibit divergence for select periods, particularly in some recent years. However, there appears to be a co-movement in these two series in the longer horizon (Chart 4). 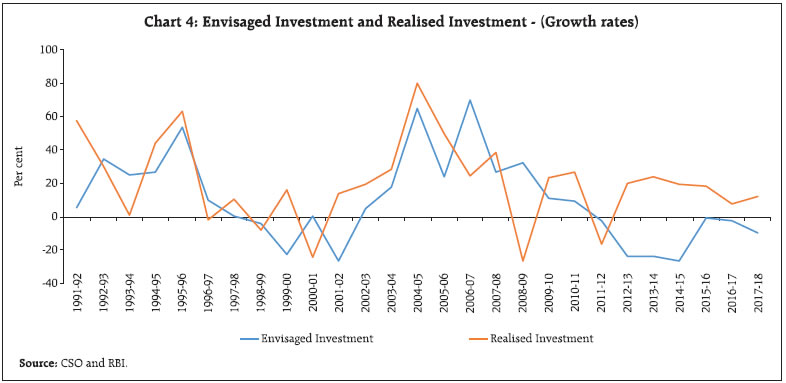 The Augmented Dickey-Fuller (ADF) unit root test shows that both the series (envisaged investment and realised investment) are stationary in first difference, viz. I(1) although, envisaged investment is not unambiguously I(1) in view of different results thrown up by ADF and Phillips-Perron (PP) unit root tests. The relationship is examined in an autoregressive distributed lag (ARDL) framework which produces robust estimates of the long run relationship and the error correction process with small samples (Pesaran et al, 2001). It also enables determination of the precise direction of causation underlying the long run relationship. The appropriate ARDL model, viz. ARDL (1, 2) was selected on the basis of the akaike information criterion (AIC). The coefficients obtained from selected ARDL model are statistically significant with expected signs. Moreover, error correction model (ECM) has the expected negative sign on the ECM term, with statistically significant short run adjustment parameters. The signs on the short run dynamic impact are consistent with long run coefficients (Table 3). | Table 3: ARDL (1, 2) model Estimates | | Variables | Coefficients | t-Statistic | Probability | | Long run coefficients | | | | | Envisaged Investment | 0.345 | 2.116 | 0.047 | | Constant | 15.897 | 4.052 | 0.000 | | Short run coefficients | | | | | D (Envisaged Investment) | 0.651 | 3.184 | 0.004 | | D (Envisaged Investment (-1)) | 0.439 | 2.299 | 0.032 | | Error correction term | -1.235 | -6.102 | 0.000 | Dependent variable: Realised Investment,
Independent Variable: Envisaged Investment.
Adjusted R-square = 0.60, Durbin-Watson Statistic = 2.102. | The model reveals a long run relationship between envisaged investment and realised investment of the private corporate sector (Table 4), which is consistent with the evidence in literature (Satyanarayana and Savalkar, 2003). V. Conclusion The analysis presented in this article points to a long term association between envisaged capex obtained from project implementation plans and realised investment. Thus, these investment intentions provide useful insights into the overall direction of capex. The projects sanctioned in the first half of 2018-19, together with the pipeline projects already undertaken, show some recovery in the capex cycle. Going forward, investment activity is expected to gather pace, benefitting from the pipeline projects lined up by private corporates. A revival in the investment cycle could be underway in the medium term, as revealed in these investment plans. Recent efforts to strengthen balance sheets of both corporates and the banking sector should provide a conducive environment for a pick-up in capital formation. Improved capacity utilisation and business expectations in the first quarter of 2018-19 polled by various surveys are providing lead indication of a reinvigoration of investment activity in the Indian economy in the period ahead. | Table 4: Bounds Test | | Test Statistic | Value | Significance (%) | Lower Bound | Upper Bound | | F-statistic | 11.286 | 10.0 | 3.02 | 3.51 | | k | 1 | 5.0 | 3.62 | 4.16 | | | | 2.5 | 4.18 | 4.79 | | | | 1.0 | 4.94 | 5.58 | References Aurizio, L. D. and Stefano, I. (2011), “Investment Forecasting with Business Survey Data”, Working Paper Number 832, November, Bank of Italy. Barnes, S. and Ellis, C. (2005), “Indicators of short-term Movements in Business Investment”, Bank of England Quarterly Bulletin, Spring, 30-38. Osterholm, P. (2013), “Forecasting Business Investment in the Short Term Using Survey Data”, Working Paper Number 131, November, National Institute of Economic Research. Pesaran, M. H. Smith, R. J. and Shin, Y. (2001), “Bounds Testing Approaches to the Analysis of Level Relationships, Journal of Applied Econometrics, 16, 289-326. Rangarajan, C. (1970), “Forecasting Capital Expenditure in the Corporate Sector”, Economic and Political Weekly, December 19. Satyanarayana, R and Savalkar, S. V. (2003), “Short-term Forecast of Corporate Investment since 1970’s - Three Decades in Retrospect”, Reserve Bank of India Occasional Papers, 24 (1 & 2), Summer and Monsoon.
Annex | Table 1: Phasing of Capex of Projects Sanctioned by Banks/FIs | | Year of sanction ↓ | No. of Projects | Project Cost in the Year of Sanction
(in ₹ billion) | Project Cost due to Revision/ Cancellation@
(in ₹ billion) | 2009-10 | 2010-11 | 2011-12 | 2012-13 | 2013-14 | 2014-15 | 2015-16 | 2016-17 | 2017-18 | 2018-19 | Beyond 2018-19 | | | 1 | 2 | 3 | 4 | 5 | 6 | 7 | 8 | 9 | 10 | 11 | 12 | 13 | 14 | | up to 2009-10 | 3,350 | 15,446 | 12,257 (43.9) | 2,736 | 2065 | 1191 | 445 | 123 | 34 | | | | | | | 2010-11 | 697 | 4,603 | 3,752 (18.5) | 286 | 1,071 | 1,046 | 788 | 464 | 85 | 1 | 9 | | | | | 2011-12 | 636 | 2,120 | 1,916 (9.6) | 57 | 230 | 669 | 554 | 282 | 95 | 29 | - | | | | | 2012-13 | 414 | 1,963 | 1,895 (3.5) | | 1 | 367 | 567 | 490 | 273 | 112 | 65 | 20 | | | | 2013-14 | 472 | 1,340 | 1,273 (5.0) | | | 13 | 151 | 348 | 449 | 199 | 71 | 42 | | | | 2014-15 | 326 | 876 | 873 (0.4) | | | | 1 | 148 | 346 | 259 | 95 | 24 | | | | 2015-16 | 346 | 954 | 918 (3.7) | | | | | 38 | 74 | 375 | 286 | 81 | 50 | 14 | | 2016-17 | 541 | 1,828 | 1,792 (2.0) | | | | | 13 | 39 | 254 | 712 | 411 | 216 | 147 | | 2017-18 | 490 | 1,728 | | | | | | | 6 | 162 | 123 | 650 | 419 | 368 | | Grand Total# | | | | 3,079 | 3,367 | 3,286 | 2,506 | 1,906 | 1,401 | 1,391 | 1,361 | 1,228 | 685 | 529 | | Percentage change | | | | | 9.4 | -2.4 | -23.7 | -23.9 | -26.5 | -0.7 | -2.2 | -9.8 | * | | #: Column totals indicate envisaged capex in a particular year covering the projects which received financial assistance in various years. The estimate is ex ante, incorporating only envisaged investment, they are different from those actually realised/utilised.
*: Per cent change for 2018-19 is not worked out as capex from proposals that are likely to be sanctioned in 2018-19 is not available.
@: Figures in bracket are percentage of cancellation. |
| Table 2: Phasing of Capex of Projects* Funded through ECBs/ FCCBs/RDBs** | | Loans contracted in ↓ | No. of Companies | Total loan contracted
(in ₹ billion) | 2009-10 | 2010-11 | 2011-12 | 2012-13 | 2013-14 | 2014-15 | 2015-16 | 2016-17 | 2017-18 | 2018-19 | Beyond 2018-19 | | | 1 | 2 | 3 | 4 | 5 | 6 | 7 | 8 | 9 | 10 | 11 | 12 | 13 | | up to 2009-10 | 2,230 | 2,063 | 288 | 144 | 22 | 2 | | | | | | | | | 2010-11 | 302 | 316 | | 174 | 109 | 27 | 5 | | | | | | | | 2011-12 | 438 | 379 | | | 252 | 128 | 19 | 1 | | | | | | | 2012-13 | 519 | 660 | | | | 378 | 203 | 63 | 13 | | | | | | 2013-14 | 563 | 803 | | | | | 562 | 210 | 31 | 3 | | | | | 2014-15 | 478 | 572 | | | | | | 368 | 168 | 32 | 6 | | | | 2015-16 | 314 | 388 | | | | | | | 290 | 73 | 26 | | | | 2016-17 | 346 | 224 | | | | | | | | 150 | 60 | 12 | 2 | | 2017-18 | 292 | 247 | | | | | | | | | 148 | 88 | 11 | | Total& | 5,482 | 5,653 | 288 | 318 | 383 | 534 | 788 | 642 | 502 | 258 | 240 | 100 | 13 | | Percentage change | | | | 10.5 | 20.5 | 39.4 | 47.5 | -18.6 | -21.8 | -48.6 | -7.0 | # | | *: Projects which did not receive assistance from banks/FIs.
**: Rupee Denominated Bonds (RDBs) have been included since 2016-17.
#: Per cent change for 2018-19 is not worked out as capex from proposals that are likely to be drawn in 2018-19 is not available.
&: The estimate is ex ante, incorporating only envisaged investment, they are different from those realised/utilised. |
| Table 3: Phasing of Capex of Projects Funded through Equity Issues* | | Equity issued during ↓ | No. of Companies | Capex Envisaged
(₹ billion) | 2009-10 | 2010-11 | 2011-12 | 2012-13 | 2013-14 | 2014-15 | 2015-16 | 2016-17 | 2017-18 | 2018-19 | Beyond 2018-19 | | | 1 | 2 | 3 | 4 | 5 | 6 | 7 | 8 | 9 | 10 | 11 | 12 | 13 | | up to 2009-10 | 198 | 232 | 14 | 7 | 1 | | | | | | | | | | 2010-11 | 30 | 21 | 1 | 12 | 6 | 2 | | | | | | | | | 2011-12 | 21 | 10 | | 2 | 5 | 3 | | | | | | | | | 2012-13 | 25 | 11 | | | | 5 | 5 | 1 | | | | | | | 2013-14 | 21 | 5 | | | | | | 4 | 1 | | | | | | 2014-15 | 24 | 11 | | | | | | 2 | 6 | 3 | | | | | 2015-16 | 40 | 45 | | | | | | | 6 | 28 | 11 | | | | 2016-17 | 29 | 12 | | | | | | | | 5 | 4 | 3 | | | 2017-18 | 51 | 16 | | | | | | | | | 4 | 4 | 8 | | Total& | 439 | 363 | 15 | 21 | 12 | 10 | 5 | 7 | 13 | 36 | 19 | 7 | 8 | | Percentage change | | | | 40.0 | -42.9 | -16.7 | -50.0 | 40.0 | 85.7 | 176.9 | -47.2 | # | | *: Projects which did not receive assistance from banks/FIs/ECBs/FCCBs/RDBs.
#: Per cent change for 2018-19 is not worked out as capex from proposals that are likely to be implemented in 2018-19 is not available.
&: The estimate is ex ante, incorporating only envisaged investment, they are different from those realised /utilised. |
| Table 4: Phasing of Capex of Projects Funded Through Banks/FIs/ECBs/FCCBs/RDBs*/IPOs | | Year of sanction ↓ | No. of Companies | Project Cost
(₹ billion) | 2009-10 | 2010-11 | 2011-12 | 2012-13 | 2013-14 | 2014-15 | 2015-16 | 2016-17 | 2017-18 | 2018-19 | Beyond 2018-19 | | Banks/ FIs, ECBs/ FCCBs/ RDBs/ IPOs | | | 1 | 2 | 3 | 4 | 5 | 6 | 7 | 8 | 9 | 10 | 11 | 12 | 13 | | up to 2009-10 | 7,310 | 5,864 | 3,038 | 2,216 | 1,214 | 447 | 123 | 34 | - | - | - | - | - | | 2010-11 | 1,029 | 4,089 | 287 | 1,257 | 1,161 | 817 | 469 | 85 | 1 | 9 | - | - | - | | 2011-12 | 1,095 | 2,305 | 57 | 232 | 926 | 685 | 301 | 96 | 29 | - | - | - | - | | 2012-13 | 958 | 2,566 | - | 1 | 367 | 950 | 698 | 337 | 125 | 65 | 20 | - | - | | 2013-14 | 1,056 | 2,081 | - | - | 13 | 151 | 910 | 663 | 231 | 74 | 42 | - | - | | 2014-15 | 828 | 1,456 | - | - | - | 1 | 148 | 716 | 433 | 130 | 30 | - | - | | 2015-16 | 700 | 1,351 | - | - | - | - | 38 | 74 | 671 | 387 | 118 | 50 | 13 | | 2016-17 | 916 | 2,028 | - | - | - | - | 13 | 39 | 254 | 867 | 475 | 231 | 149 | | 2017-18 | 833 | 1,991 | - | - | - | - | - | 6 | 162 | 123 | 802 | 511 | 387 | | Total# | | | 3,382 | 3,706 | 3,681 | 3,051 | 2,699 | 2,050 | 1,906 | 1,655 | 1,487 | 792 | 549 | | Percentage change | | | | 9.6 | -0.7 | -17.1 | -11.5 | -24.1 | -7.0 | -13.2 | -10.2 | @ | | *: RDBs are captured since 2016-17.
@: Per cent change for 2018-19 is not worked out as capex from proposals that are likely to be sanctioned in 2018-19 is not available.
#: The estimate is ex ante, incorporating only envisaged investment, they are different from those realised/ utilised. |
| Table 5: Industry-wise Distribution of Projects Sanctioned by Banks/FIs: 2008-09 to 2017-18 | | Industry | 2008-09 | 2009-10 | 2010-11 | 2011-12 | 2012-13 | 2013-14 | 2014-15 | 2015-16 | 2016-17 | 2017-18 | | Num ber of Pro jects | Per cent Share | Num ber of Pro jects | Per cent Share | Num ber of Pro jects | Per cent Share | Num ber of Pro jects | Per cent Share | Num ber of Pro jects | Per cent Share | Num ber of Pro jects | Per cent Share | Num ber of Pro jects | Per cent Share | Num ber of Pro jects | Per cent Share | Num ber of Pro jects | Per cent Share | Num ber of Pro jects | Per cent Share | | Infrastructure | 97 | 45.0 | 100 | 49.0 | 120 | 53.7 | 107 | 47.4 | 82 | 47.8 | 87 | 39.7 | 74 | 48.9 | 109 | 72.0 | 204 | 62.5 | 147 | 52.9 | | i) Power | 54 | 27.9 | 75 | 30.7 | 104 | 46.2 | 82 | 42.4 | 71 | 39.4 | 70 | 35.1 | 65 | 42.2 | 93 | 57.2 | 170 | 45.4 | 122 | 38.2 | | ii) Telecom | 6 | 10.9 | 6 | 16.4 | 2 | 5.7 | 1 | 0.0 | 2 | 5.6 | 1 | - | 1 | 4.9 | 1 | 0.2 | 1 | - | - | - | | iii) Ports & Airports | 4 | 2.8 | 2 | 0.3 | 1 | 0.7 | 1 | 1.3 | 1 | 1.9 | 1 | 0.8 | - | - | 3 | 2.4 | 8 | 5.7 | 6 | 3 | | iv) Storage & Water Management | 2 | - | 2 | 0.9 | 1 | 0.0 | 12 | 0.5 | - | - | 5 | 1.1 | 2 | 0.6 | 4 | 4.2 | 6 | 3.7 | 2 | 0.3 | | v) SEZ, Industrial, Biotech and IT Park | 28 | 3.2 | 15 | 0.6 | 12 | 1.1 | 11 | 3.2 | 8 | 0.9 | 8 | 1.5 | 3 | 0.9 | 1 | 0.4 | 2 | 0.4 | 1 | 1.6 | | vi) Roads & Bridges | 3 | 0.1 | - | - | - | - | - | - | - | - | 2 | 1.2 | 3 | 0.3 | 7 | 7.6 | 17 | 7.3 | 16 | 9.8 | | Chemicals & Pesticides | 27 | 1.7 | 28 | 0.8 | 27 | 1.3 | 17 | 3.5 | 19 | 1.1 | 15 | 1.0 | 7 | 2.6 | 11 | 1.6 | 10 | 2.1 | 23 | 11.1 | | Metal & Metal Products | 97 | 17.7 | 134 | 18.1 | 113 | 21.1 | 73 | 16.3 | 51 | 28.9 | 44 | 17.0 | 17 | 17.4 | 14 | 1.5 | 23 | 4.9 | 21 | 9.5 | | Construction | 30 | 10.8 | 20 | 11.5 | 18 | 3.3 | 22 | 1.7 | 20 | 2.8 | 27 | 2.1 | 29 | 4.0 | 26 | 1.8 | 60 | 12 | 39 | 5.1 | | Transport Services | 14 | 1.0 | 22 | 1.4 | 14 | 0.6 | 19 | 2.7 | 16 | 1.7 | 15 | 0.5 | 5 | 0.6 | 10 | 1.2 | 12 | 0.4 | 16 | 4 | | Textiles | 45 | 1.2 | 77 | 2.2 | 77 | 2.9 | 94 | 7.0 | 31 | 1.9 | 58 | 10.3 | 50 | 4.1 | 49 | 4.8 | 57 | 4.1 | 54 | 3.6 | | Hotel & Restaurants | 57 | 2.8 | 56 | 2.6 | 63 | 3.5 | 51 | 4.6 | 31 | 3.1 | 29 | 2.7 | 15 | 1.1 | 16 | 1.1 | 12 | 0.8 | 29 | 2.8 | | Food Products | 50 | 1.0 | 41 | 0.5 | 39 | 0.7 | 41 | 1.5 | 36 | 0.9 | 43 | 1.8 | 34 | 2.9 | 26 | 1.8 | 38 | 0.9 | 47 | 2.7 | | Hospitals & Health services | 16 | 0.5 | 23 | 0.9 | 22 | 0.6 | 9 | 0.3 | 17 | 1.4 | 10 | 0.7 | 2 | 0.1 | 1 | 0.0 | 22 | 1.1 | 18 | 1.7 | | Glass & Pottery | 6 | 0.3 | 9 | 0.2 | 6 | 0.4 | 10 | 1.3 | 3 | - | 11 | 0.3 | 19 | 0.7 | 8 | 0.5 | 19 | 0.6 | 20 | 0.8 | | Cement | 28 | 6.0 | 29 | 2.8 | 14 | 2.4 | 9 | 2.0 | 11 | 3.9 | 12 | 7.1 | 7 | 3.8 | 5 | 1.9 | 5 | 2.3 | 3 | 0.6 | | Mining & Quarrying | 7 | 0.6 | 10 | 2.5 | 1 | 0.2 | 4 | 0.2 | 2 | 0.1 | 1 | 0.6 | 2 | 0.1 | 10 | 2.7 | 4 | 0.4 | 1 | 0.4 | | Petroleum Products | 4 | 0.1 | 2 | 1.3 | 3 | 2.6 | 3 | 1.2 | - | - | 1 | 0.5 | 1 | 3.4 | 2 | 2.0 | 2 | 0.5 | 1 | 0.3 | | Transport Equipment & Parts | 30 | 3.0 | 25 | 1.3 | 28 | 0.8 | 26 | 2.6 | 17 | 0.9 | 16 | 1.2 | 7 | 5.3 | 4 | 2.5 | 9 | 3.6 | 10 | 0.3 | | Electrical Equipment | 17 | 1.3 | 16 | 0.2 | 24 | 2.0 | 12 | 0.3 | 10 | 1.9 | 9 | 2.0 | 7 | 0.2 | 3 | 0.2 | 9 | 0.2 | 6 | 0.2 | | Sugar | 21 | 1.2 | 21 | 0.8 | 21 | 0.8 | 12 | 1.1 | 5 | 0.5 | 8 | 0.8 | 6 | 1.3 | 5 | 0.4 | 2 | 0.1 | 1 | 0.1 | | Others* | 162 | 5.9 | 116 | 4.0 | 107 | 3.1 | 127 | 6.3 | 63 | 3.1 | 86 | 11.7 | 44 | 3.5 | 47 | 4.0 | 53 | 3.5 | 54 | 3.9 | | Total | 708 | 100 | 729 | 100 | 697 | 100 | 636 | 100 | 414 | 100 | 472 | 100 | 326 | 100 | 346 | 100 | 541 | 100 | 490 | 100 | | Total project cost in billion | 3,111 | 4,095 | 3,752 | 1,916 | 1,895 | 1,273 | 873 | 918 | 1,792 | 1,728 | *: Comprise industries like Pharmaceuticals & Drugs, Agricultural & related activities, Paper & Paper products, Printing & Publishing, Rubber, IT Software, Communication, and Trading of services, Entertainments, etc.
-: Nil/Negligible. |
| Table 6: Size-wise Distribution of Projects Sanctioned by Banks/FIs: 2008-09 to 2017-18 | | Period | Number and Share of Projects | Less than
₹1 billion | ₹1 billion to
₹5 billion | ₹5 billion to
₹10 billion | ₹10 billion to
₹50 billion | ₹50 billion & above | TOTAL | | 2008-09 | No. of Projects | 420 | 194 | 35 | 48 | 11 | 708 | | Per cent Share | 5.1 | 14.1 | 7.5 | 29.7 | 43.7 | 100 (3,111) | | 2009-10 | No. of Projects | 439 | 189 | 40 | 39 | 22 | 729 | | Per cent Share | 3.8 | 11.0 | 6.8 | 20.8 | 57.5 | 100 (4,095) | | 2010-11 | No. of Projects | 412 | 172 | 42 | 51 | 20 | 697 | | Per cent Share | 4.4 | 10.2 | 8.6 | 29.3 | 47.5 | 100 (3,752) | | 2011-12 | No. of Projects | 420 | 145 | 36 | 26 | 9 | 636 | | Per cent Share | 8.3 | 17.0 | 13.7 | 27.6 | 33.4 | 100 (1,916) | | 2012-13 | No. of Projects | 245 | 119 | 20 | 23 | 7 | 414 | | Per cent Share | 4.8 | 14.6 | 7.3 | 26.8 | 46.4 | 100 (1,895) | | 2013-14 | No. of Projects | 306 | 115 | 25 | 21 | 5 | 472 | | Per cent Share | 8.3 | 20.0 | 13.9 | 29.1 | 28.7 | 100 (1,273) | | 2014-15 | No. of Projects | 223 | 65 | 18 | 19 | 1 | 326 | | Per cent Share | 9.0 | 16.6 | 14.6 | 47.8 | 12.0 | 100 (873) | | 2015-16 | No. of Projects | 214 | 76 | 34 | 21 | 1 | 352 | | Per cent Share | 8.6 | 20.9 | 26.0 | 38.5 | 5.9 | 100 (918) | | 2016-17 | No. of Projects | 287 | 180 | 29 | 40 | 5 | 541 | | Per cent Share | 5.8 | 23.3 | 11.9 | 41.7 | 17.4 | 100 (1,792) | | 2017-18 | No. of Projects | 263 | 149 | 31 | 44 | 3 | 490 | | Per cent Share | 5.1 | 20.5 | 11.7 | 44.1 | 18.6 | 100 (1,728) | Note: i. Figures in brackets are total cost of projects in ₹ billion.
ii. Per cent share is the share in total cost of projects. |
| Table 7: State-wise Distribution of Projects Sanctioned by Banks/FIs: 2008-09 to 2017-18 | | State | 2008-09 | 2009-10 | 2010-11 | 2011-12 | 2012-13 | 2013-14 | 2014-15 | 2015-16 | 2016-17 | 2017-18 | | Num ber of Pro jects | Per cent Share | Num ber of Proj ects | Per cent Share | Num ber of Pro jects | Per cent Share | Num ber of Pro jects | Per cent Share | Num ber of Pro jects | Per cent Share | Num ber of Pro jects | Per cent Share | Num ber of Pro jects | Per cent Share | Num ber of Pro jects | Per cent Share | Num ber of Pro jects | Per cent Share | Num ber of Pro jects | Per cent Share | | Maharashtra | 110 | 18.1 | 117 | 10.0 | 71 | 7.4 | 86 | 19.1 | 67 | 10.7 | 76 | 19.7 | 38 | 14.8 | 36 | 9.4 | 57 | 8.8 | 65 | 22.6 | | Karnataka | 44 | 2.4 | 42 | 1.4 | 40 | 7.2 | 39 | 12.0 | 20 | 1.6 | 39 | 6.2 | 27 | 5.4 | 21 | 6.2 | 52 | 6.8 | 66 | 10.4 | | Andhra Pradesh | 74 | 7.6 | 73 | 7.1 | 65 | 11.4 | 52 | 5.1 | 35 | 5.7 | 37 | 4.0 | 24 | 8.1 | 33 | 12.3 | 47 | 8.0 | 22 | 9.7 | | Gujarat | 75 | 18.4 | 69 | 3.2 | 65 | 9.6 | 75 | 9.0 | 58 | 5.6 | 66 | 14.5 | 71 | 9.5 | 61 | 15.1 | 102 | 23.0 | 71 | 7.8 | | Tamil Nadu | 63 | 2.3 | 66 | 5.5 | 93 | 6.1 | 58 | 5.7 | 22 | 1.8 | 33 | 5.4 | 27 | 2.9 | 26 | 9.3 | 22 | 4.4 | 28 | 6.5 | | Rajasthan | 22 | 0.6 | 23 | 2.9 | 28 | 0.8 | 49 | 4.9 | 41 | 5.3 | 24 | 1.4 | 29 | 11.1 | 10 | 0.9 | 23 | 2.8 | 33 | 6.1 | | Chhatisgarh | 16 | 2.3 | 23 | 6.0 | 31 | 12.1 | 11 | 2.4 | 9 | 4.1 | 16 | 10.7 | 8 | 7.4 | 8 | 4.7 | 15 | 4.0 | 7 | 4.6 | | Odisha | 15 | 9.0 | 25 | 13.9 | 25 | 7.4 | 15 | 6.3 | 10 | 26.8 | 10 | 11.7 | 5 | 15.9 | 6 | 3.1 | 6 | 3.1 | 5 | 2.9 | | Uttar Pradesh | 32 | 3.1 | 27 | 0.4 | 32 | 4.6 | 42 | 7.8 | 26 | 4.4 | 21 | 1.1 | 20 | 5.4 | 15 | 2.3 | 22 | 3.7 | 30 | 2.4 | | Himachal Pradesh | 18 | 0.5 | 19 | 0.6 | 13 | 0.8 | 7 | 0.5 | 5 | 0.3 | 3 | 1.8 | 3 | 0.1 | 8 | 1.4 | 1 | 0.0 | 8 | 2.2 | | Punjab | 23 | 0.7 | 23 | 0.4 | 38 | 1.1 | 37 | 1.7 | 12 | 10.9 | 28 | 1.5 | 6 | 0.3 | 11 | 1.7 | 29 | 2.1 | 36 | 2.1 | | Jammu & Kashmir | - | - | 2 | 0.1 | 3 | 0.1 | 5 | 0.2 | 10 | 0.2 | 10 | 5.2 | 2 | 0.1 | 9 | 0.2 | 3 | 0.1 | 8 | 1.9 | | Telungana | - | - | - | - | - | - | - | - | - | - | - | - | - | - | 10 | 3.8 | 52 | 6.8 | 17 | 1.8 | | West Bengal | 43 | 3.0 | 33 | 2.6 | 29 | 3.3 | 19 | 4.9 | 13 | 1.0 | 12 | 1.2 | 9 | 1.3 | 14 | 3.1 | 18 | 1.7 | 14 | 1.8 | | Madhya Pradesh | 20 | 7.2 | 23 | 4.2 | 21 | 5.2 | 16 | 5.6 | 13 | 3.9 | 30 | 6.1 | 14 | 3.9 | 21 | 6.9 | 18 | 7.5 | 12 | 1.5 | | Multiple# | 55 | 19.0 | 45 | 29.0 | 48 | 16.2 | 34 | 4.5 | 15 | 7.7 | 21 | 6.9 | 10 | 9.5 | 13 | 13.5 | 17 | 11.8 | 17 | 8.1 | | Others* | 98 | 5.8 | 119 | 12.7 | 95 | 6.7 | 91 | 10.3 | 58 | 10.0 | 46 | 2.6 | 33 | 4.3 | 44 | 6.1 | 57 | 5.4 | 51 | 7.6 | | Total | 708 | 100 | 729 | 100 | 697 | 100 | 636 | 100 | 414 | 100 | 472 | 100 | 326 | 100 | 346 | 100 | 541 | 100 | 490 | 100 | | Total Cost of Projects (₹ in billion) | 3,111 | 4,095 | 3,752 | 1,916 | 1,895 | 1,273 | 873 | 918 | 1,792 | 1,728 | #: Comprise projects over several States.
*: Comprise remaining States / Union Territories.
‘ -’: information not available
Note: Per cent share is the share in total project cost. |
| Table 8: Purpose-wise Distribution of Projects Sanctioned by Banks/FIs: 2010-11 to 2017-18 | | Period | Number and Share of Projects | New | Expansion & Modernisation | Diversification | Others | Total* | | 2010-11 | No. of Projects | 454 | 224 | 6 | 13 | 697 | | Percent Share | 66.8 | 30.9 | 1.8 | 0.5 | 100 (3,752) | | 2011-12 | No. of Projects | 449 | 172 | 5 | 10 | 636 | | Percent Share | 70.6 | 23.1 | 0.1 | 6.3 | 100 (1,916) | | 2012-13 | No. of Projects | 303 | 107 | - | 4 | 414 | | Percent Share | 84.2 | 14.7 | - | 1.1 | 100 (1,895) | | 2013-14 | No. of Projects | 361 | 95 | 2 | 14 | 472 | | Percent Share | 65.2 | 20.1 | - | 14.7 | 100 (1,273) | | 2014-15 | No. of Projects | 203 | 92 | 2 | 29 | 326 | | Percent Share | 39.4 | 14.7 | 0.2 | 45.7 | 100 (873) | | 2015-16 | No. of Projects | 260 | 64 | 3 | 19 | 346 | | Percent Share | 73.6 | 14.3 | 0.1 | 12 | 100 (918) | | 2016-17 | No. of Projects | 429 | 97 | 4 | 11 | 541 | | Percent Share | 78.6 | 9.9 | 0.1 | 11.3 | 100 (1,792) | | 2017-18 | No. of Projects | 401 | 80 | 2 | 7 | 490 | | Percent Share | 89.3 | 9.2 | 0.1 | 1.4 | 100 (1,728) | Note: i. Figures in brackets are total cost of projects in ₹ billion.
ii. - : Nil/ Negligible. |
|