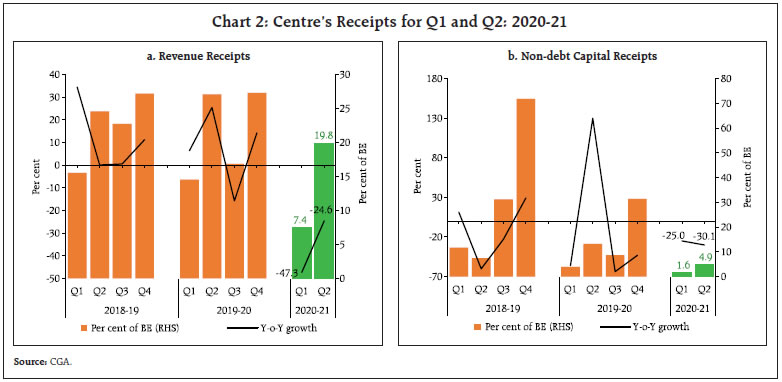
This article, third in the series of half-yearly reviews of government finances, examines the fiscal arithmetic behind government budgets and explains the impact of contraction in economic activity and the fiscal response to COVID-19 on key fiscal parameters in the first half of 2020-21. The build-up of combined fiscal deficit in H1:2020-21 is sharper, but attributable mostly to the developments in Q1. Going forward, with the severest impact of COVID-19 on government finances already realised in Q1, there is scope for Centre and states to continue with the counter-cyclical fiscal support, which is necessary to sustain the momentum of recovery. Introduction The Union Budget for 2020-21, presented before the COVID-19 related lockdown, aimed at providing a counter-cyclical fiscal support to the slowing economy. This fiscal stance, however, necessitated taking recourse to the escape clause [Section 4(2)] of the Fiscal Responsibility and Budget Management (FRBM) Act allowing additional fiscal deficit of 0.5 per cent of Gross Domestic Product (GDP). As a result, the fiscal consolidation goal of achieving Gross Fiscal Deficit to Gross Domestic Product (GFD-GDP) ratio of 3.0 per cent in 2020-21 was shifted to 2022-23 (3.1 per cent). Unlike the Centre, states have largely adhered to the fiscal deficit targets in recent years, mostly achieved by cutbacks in expenditure, with associated adverse implications on growth. For all states taken together, GFD is budgeted at 2.8 per cent of GDP in 2020-21, though there is a marked difference between states that presented their budgets before the COVID-19 lockdown [2.4 per cent of their combined Gross State Domestic Product (GSDP)] and those that presented after (4.6 per cent of their combined GSDP). The fight against COVID-19 necessitated severe restrictions on normal life and economic activity, which has had a devastating impact on government finances. Global general government fiscal deficit as a per cent of global GDP is projected to increase to 12.7 per cent in 2020 from 3.9 per cent in 2019, due to combined impact of increase in deficit balance and reduction in world output (IMF 2020a). For India, the International Monetary Fund (IMF) projects the general government fiscal deficit to increase from 8.2 per cent of GDP to 13.1 per cent of GDP. The debilitating effects of the contraction in economic activity on government finances could be evident from the asymmetric responses of revenues and expenditure, with revenue flows linked to the economic cycle while expenditure is largely sticky. Counter-cyclical stimulus in the form of higher expenditure and lower taxes can further amplify the size of the fiscal deficit beyond the endogenous impact of economic cycle. High-frequency data on government finances for India show that while revenues have collapsed with the contraction in GDP, government expenditure has been held up on the back of stimulus adjusted for efforts at deferment / curtailment of non-essential expenditure, leading to widening of the fiscal deficit and resultant unprecedented levels of government borrowing. This article, the third in the series of half-yearly reviews of government finances, examines some of the key fiscal challenges in an unprecedented year, informs on the fiscal response to COVID-19 and the resultant impact on key fiscal parameters. First, it attempts to quantify the impact of the stimulus package on growth and its various components for the current and next fiscal year. Second, the likely general government fiscal balance for 2020-21 has been projected keeping in view the outcomes so far. The article is structured as follows. Section II analyses the receipts and expenditure outcomes for the Centre and all states taken together at quarterly frequency for the first half of 2020-21. Section III deals with the outcomes in terms of key deficit indicators and their financing. Market borrowings by the Centre and state governments are covered in Section IV. Section V presents estimates on General Government finances for Q1 and Q2:2020-21 along with projections for the second half of 2020-21. Section VI concludes and sets out the near-term fiscal outlook. II. Quarterly Outcomes: Q1 and Q2 of 2020-21 Over 40 per cent of the total receipts of Central government is generally collected in the first half of the financial year, while around 55 per cent of total expenditure is incurred during the same period. Marking a departure from this pattern, only 25.2 per cent of the budgeted total receipts could be garnered during H1:2020-21, while spending in H1 was correspondingly constrained to less than half of the budgeted expenditure for the year. In H1:2020-21, states1 could collect only 30.6 per cent of their budgeted receipts and their expenditure was also lower vis-à-vis the usual pattern of 40 per cent each of the annual receipts and expenditure in H1 (Chart 1). a. Receipts Revenue receipts of Central government were severely affected on account of the pandemic-induced lockdown in Q1:2020-21, registering a contraction of 47.3 per cent during the period. With the gradual resumption in economic activity since June 2020, revenue receipts recovered, but partially, and recorded a lower contraction of 24.6 per cent in Q2:2020-21. Non-debt capital receipts also registered negative growth during the period as disinvestments have largely not fructified with only a little over ₹6,000 crore being raised through offer for sale (OFS) and initial public offering (IPO) (Chart 2). 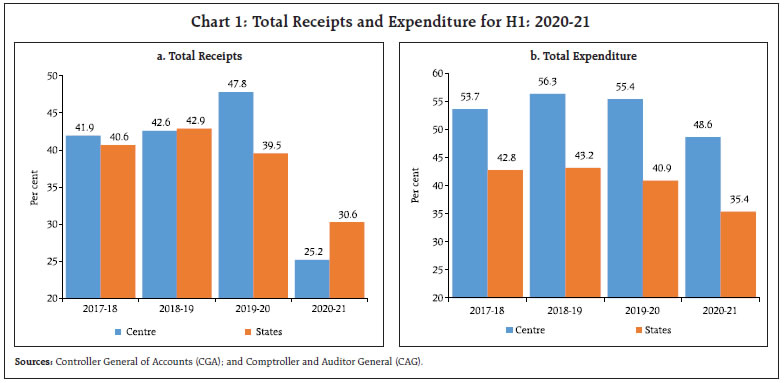
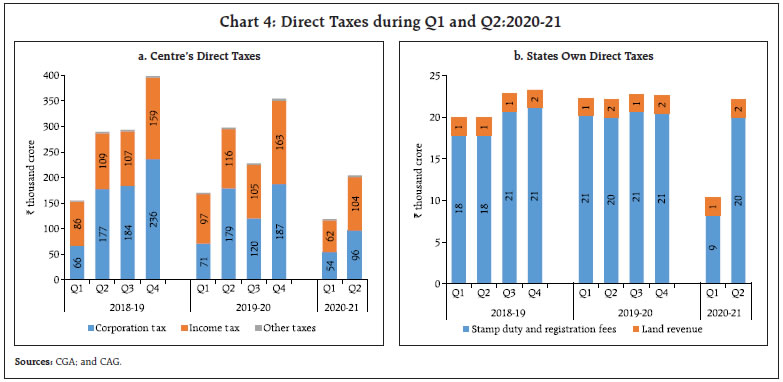
 States also witnessed a broadly similar pattern, with their revenue receipts registering a negative year-on-year (y-o-y) growth of 18.6 per cent in Q1: 2020-21, albeit with a moderation in contraction in Q2. Non-debt capital receipts for states, which exhibit considerable volatility, also recorded a contraction in Q1 and Q2:2020-21, resulting in lower non-debt capital receipts (as per cent of BE) in H1: 2020-21 than the average of preceding two years (Chart 3). Centre’s direct tax collections, both income tax and corporation tax, recorded large declines during H1:2020-21, partly on account of the cyclical contraction in economic activity and partly because of the discretionary policy actions of the government relating to various relaxations for filing tax returns. Both of these are likely to have provided counter-cyclical support to growth2, even as they have had an adverse effect on Central government finances. For states, stamp duties which account for more than 85 per cent of own direct tax revenues, witnessed a sharp fall of 57.2 per cent in Q1:2020-21 on y-o-y basis due to contraction in construction activity. With the gradual reopening of the economy, stamp duty collections recovered sharply in Q2:2020-21, registering only a marginal y-o-y contraction of less than 1 per cent (Chart 4). 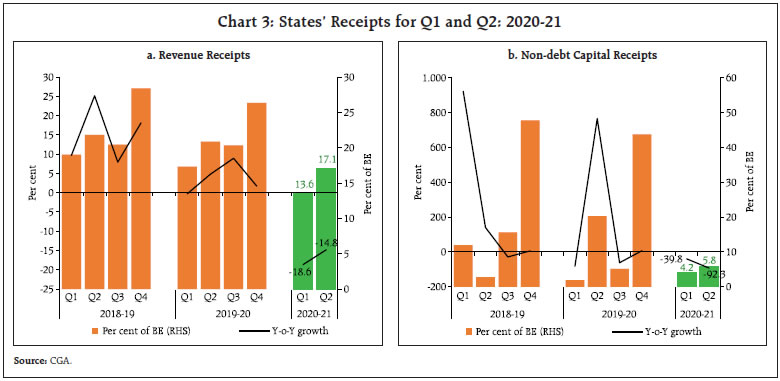
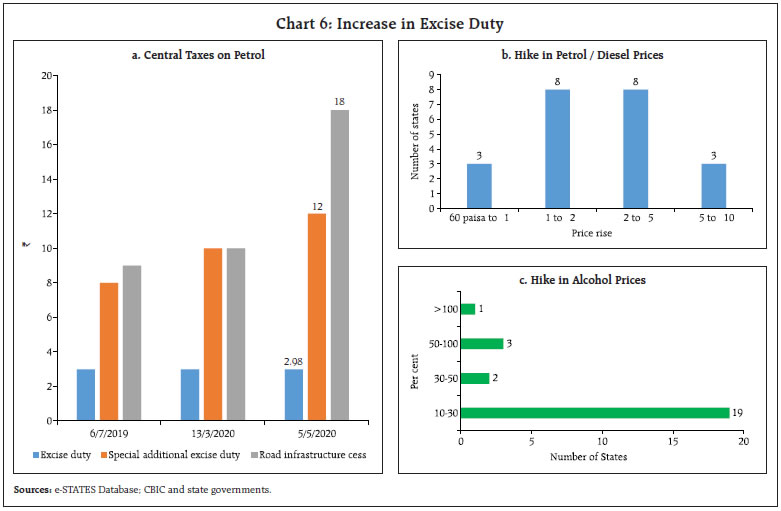
 Centre’s indirect tax collections also registered a contraction during the period, albeit, of a lesser magnitude compared to direct taxes, on the back of buoyant Goods and Service Tax (GST) revenues post re-opening of economic activities and supported by growth in union excise duty collections. GST collections (both Centre and states) took a severe hit in Q1:2020-21 on account of the lockdown but recovered quickly during June-November 2020 as consumption spending revived, backed by pent-up demand and festive spending. GST compensation cess collections during H1:2020-21 at 31.6 per cent of BE have, however, been inadequate to meet the requirement of GST compensation to states. Accordingly, the Central government has operationalised a Special Window, under which the Government of India (GoI) will borrow an estimated shortfall in GST cess collections of ₹1.1 lakh crore (assuming all states join) in appropriate tranches, which will be passed on to the states as a back-to-back loan in lieu of the GST compensation cess release (Chart 5). As of now, all states and all 3 union territories with Legislative Assembly, have decided in favour of this option. The GoI has already borrowed an amount of ₹36,000 crore on behalf of the states and passed it on to the states and union territories that chose this option (as on December 9, 2020). In order to garner some additional revenues during these unprecedented times, the Centre increased the special additional excise duty and Road Infrastructure Cess on petrol and diesel twice during March-May 2020, as a result of which union excise duty collections grew by 34.2 per cent in H1:2020-21. 22 states/UTs have also hiked their duties on petrol and diesel, mostly in the range of ₹1 to 5 while 25 states/UTs have hiked duty on alcohol, mostly in the range of 10-30 per cent, on an average basis. Although duty hikes during recessions can be considered as pro-cyclical, the price inelastic nature of these goods may have made it a useful tool for revenue augmentation even though consumption may have fallen initially during the lock down period (Chart 6). 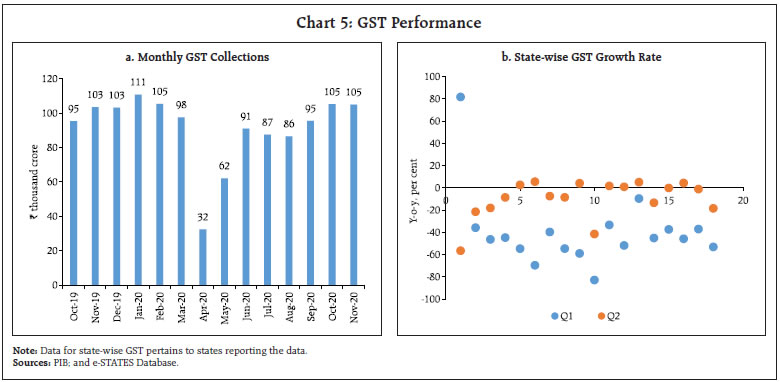
 Apart from taxation, the Centre also relies significantly on non-tax sources for its revenue, which registered a steep decline during H1:2020-21, primarily on account of shortfall in revenue budgeted from spectrum sales. With regard to non-debt capital receipts, the realisation of government’s budgeted disinvestment target of ₹2.1 lakh crore for 2020-21 has been thrown off-track by the crisis even though stock markets are currently witnessing buoyancy. Although the government has recently taken some steps to facilitate the disinvestment process, including an agreement with the World Bank to provide advisory services for asset monetisation, these are unlikely to bear results before the next fiscal year (Chart 7). While central tax transfers to states did not see any material fall in Q1 – with transfers being done mostly based on budget estimates, the decline was prominent in Q2: 2020-21 (Chart 8), probably reflecting the shortfall in Centre’s direct tax collections during Q1, which forms a part of the divisible pool3 (it gets reflected in states’ receipts with at least about a quarter lag).
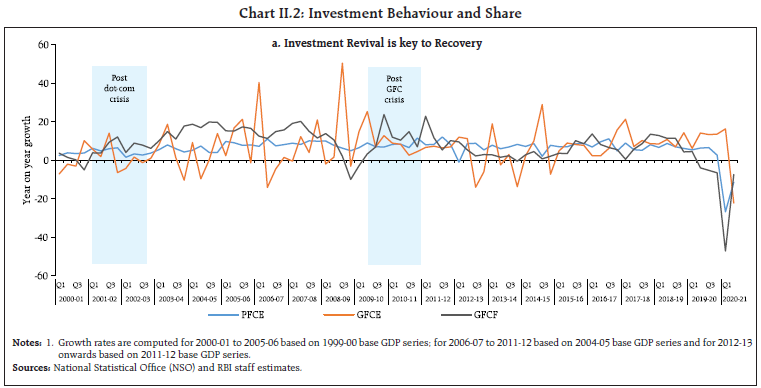
b. Expenditure Central government undertook several expenditure measures in the aftermath of the COVID-19 crisis, initially to provide socio-economic assistance to the poor and vulnerable sections through targeted cash transfers, distribution of free foodgrains, medical insurance to health workers, etc. and subsequently, more comprehensive measures under the various tranches of Aatma Nirbhar Bharat package to stimulate economic recovery. The size and composition of the stimulus coupled with its calibrated shift in focus from consumption to liquidity to investment suggest that it is growth giving, more via investment revival channel, with a large part of the impact expected to accrue in the second half of the year (Box I). While some of these measures led to an additional expenditure over and above the budgeted amount, others pertaining to front-loading of expenditure and liquidity measures did not carry any additional fiscal burden. Box I: Impact of Fiscal Stimulus on Growth In response to the pandemic induced unprecedented shock, governments across the globe have provided massive economic stimulus. In India, the government has taken a calibrated approach towards providing fiscal stimulus that included social assistance to the poor in the initial stage which was broadened with a comprehensive package (Aatma Nirbhar Bharat) to provide support to the various sectors of the economy (Table I.1 and Appendix Table 7). An attempt has been made to estimate the impact of fiscal stimulus measures on growth based on the size and composition of the above-the-line expenditure measures and the corresponding multiplier size. Towards this end, a one-to-one mapping of each of the stimulus measures as provided under the Pradhan Mantri Garib Kalyan Yojana (PMGKY) and Aatma Nirbhar 1.0, 2.0 and 3.0 is undertaken with the corresponding demand-side components of GDP – Government Final Consumption Expenditure (GFCE), Private Final Consumption Expenditure (PFCE) and Gross Fixed Capital Formation (GFCF). These were then interacted with the respective fiscal multipliers to obtain the impact on growth as the type of expenditure generally determines the impact of any fiscal stimulus on economic growth. Fiscal multiplier, defined as a ratio of a change in output to an exogenous change in a fiscal variable (viz., government expenditure/taxation or both), measures the immediate impact of discretionary fiscal policy on output. Multipliers being unobservable, they are gauged by estimated parameters, even while there is significant uncertainty about the correct size of fiscal multipliers. Empirical estimates suggest that fiscal multipliers vary over time depending on the state of the business cycle and monetary policy stance among others (IMF, 2020a). | Table I.1: Summary of Stimulus Measures Announced (till November 30, 2020) | | Sl. No. | Item | ₹ Crore | | 1. | Pradhan Mantri Garib Kalyan Package (PMGKP) + | 1,92,800 | | 2. | Atmanirbhar Bharat Abhiyaan 1.0 | 11,02,650 | | 3. | PMGKP Anna Yojana – extended till November | 82,911 | | 4. | Atmanirbhar Bharat Abhiyaan 2.0 | 73,000 | | 5. | Atmanirbhar Bharat Abhiyaan 3.0 | 2,65,080 | | 6. | RBI measures announced till October 31, 2020 | 12,71,200 | | Total | 29,87,641 | | Source: Press Information Bureau (PIB) India. | | In the Indian context, it is important to note that revenue expenditure multipliers for the government are less than unity. When revenue expenditure is increased by one rupee, while GFCE increases by one rupee, capital expenditure often contracts offsetting some of the desired increase in the output and eventually increasing output only by 45 paise in period t and about 10 paise in period t+1. In contrast, the capital expenditure multiplier is well above unity for the central and state governments - for the central government, it is 2.45 in period t and 3.14 in period t+1, while for state governments it is close to 2 (RBI, 2019). This indicates that an increase in capital expenditure by the central and state governments by one rupee each crowds in private investment, induces a more than proportionate increase in investment in the economy with benefits accruing over a few years4. Using these multipliers and based on the fiscal stimulus measures announced so far, it is estimated that government expenditure will add 159 bps and 158 bps to growth in 2020-21 and 2021-22, respectively. Here again, the impact of government stimulus measures is likely to pan out in H2 of the current financial year, operating mainly through the investment revival channel (Chart I.1). Empirical estimates suggest that public investment can have a powerful impact on GDP growth and employment during periods of high uncertainty (Rachel and Summers, 2019; Eggertsson et al., 2019), which is a prominent feature of the current crisis. In India also, it is investment growth which has played a bigger role than consumption during the revival phase in 2000s, particularly during mid-2001 to 2003 and again in the immediate post-Global Financial Crisis (GFC) period (Chart II.2a). Towards this end, the government focus on investment revival is a timely step, although the share of general government investment (including PSEs) on total GFCF has been about 24 per cent (Chart II.2b). There are a few uncertainties, both on the upside as well as downside, associated with these estimated impacts of the stimulus on growth. First, given that the multipliers used have been computed for normal times, the actual impact could be different in the current pandemic situation. While the economic downturn and the highly accommodative monetary policy stance as being witnessed now suggest that the multipliers could be relatively high, supply constraints related to the pandemic may have contributed in the opposite direction (IMF, 2020a)5. Second, the liquidity support given by the Centre backed by guarantees, which are essentially below-the-line measures providing supply-side support, will also provide a positive push in addition to the demand-side measures, particularly for some of the badly hit sectors like Micro, Small and Medium Enterprises (MSMEs). Third, there is also a view point that the likely push to private consumption via subsidies and direct benefit transfers may be offset by the higher indirect taxes levied, though the actual impact will depend on the differential marginal propensity to consume. Fourth, any likely capex cut by states, as witnessed during the previous episodes, may also dampen some of the expansionary impact of the stimulus. 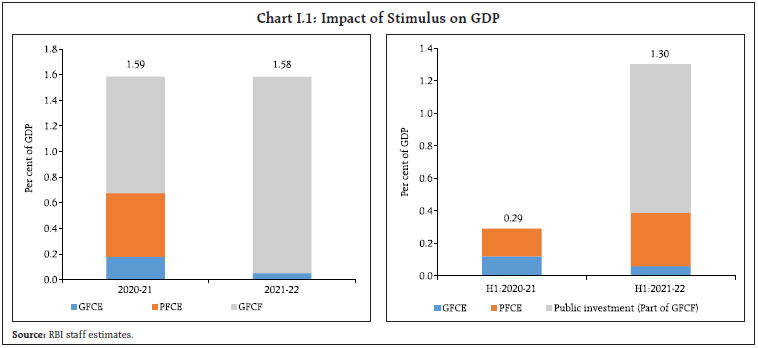
| b. General Government (including PSEs) Capex | | | 2012-13 | 2013-14 | 2014-15 | 2015-16 | 2016-17 | 2017-18 | 2018-19 | 2019-20 E | | Share in Total GFCF | 20.5 | 22.1 | 23.0 | 25.7 | 24.3 | 23.4 | 23.7 | 23.5 | | Growth Rate (In per cent) | 2.1 | 9.2 | 6.9 | 19.0 | 2.9 | 3.1 | 11.2 | -3.7 | | E: estimated. | References: Baker, S., R. A. Farrokhnia, M. Pagel, S. Meyer, and C. Yannelis. 2020. “Income, Liquidity, and the Consumption Response to the COVID-19 Pandemic and Economic Stimulus Payments.” VoxEU (blog), Centre for Economic Policy Research, June 17. Eggertsson, G. B., N. R. Mehrotra, and J. A. Robbins. 2019. “A Model of Secular Stagnation: Theory and Quantitative Evaluation.” American Economic Journal: Macroeconomics 11 (1): 1–48 IMF Fiscal Monitor. 2020a, International Monetary Fund, October. Rachel, L., and L. H. Summers. 2019. “On Falling Neutral Real Rates, Fiscal Policy, and the Risk of Secular Stagnation.” Brookings Papers on Economic Activity (Spring): 1–76. | A part of the additional expenditure requirement has been met by re-allocation of funds from other heads of expenditure. The government also undertook expenditure rationalisation measures during Q1-Q3:2020-21 to target spending in priority areas over avoidable outgoes (these expenditure curbs on various Central ministries and departments have now been relaxed)6. As a result, total expenditure remained contained at 48.6 per cent of BE during H1:2020-21, as against 53.4 per cent during the same period of last year, despite pandemic related expansionary measures. In absolute terms, revenue spending during H1:2020-21 was almost at last year’s levels, recording a modest growth of 1.0 per cent over the previous year, despite collapse in receipts, with Q1 registering a sharp pick up reflecting pandemic related revenue expenditure thrust coupled with its front-loading and Q2 witnessing a sharp fall. Capital expenditure, on the other hand, contracted by 11.6 per cent during H1:2020-21, deterrents being lockdown in Q1 and monsoon in Q2 (Chart 9).
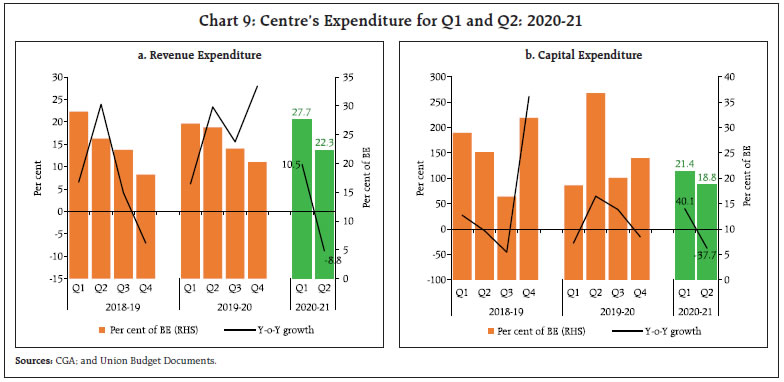
 The subsidy pay-out for the Central government was lower in Q1:2020-21 compared to the corresponding period of last year but has been higher in Q2:2020-21 on account of higher food and petroleum subsidy (as per cent of BE) relative to Q2:2019-20 (Chart 10). Revenue expenditure of states has also not witnessed any sharp upturn in H1:2020-21 compared with previous years despite the fact that states have been at the forefront in the fight against the pandemic, primarily attributed to re-prioritisation of expenditure through ways like Dearness Allowance (DA) freeze, deferment of part or full salary, rationalisation of travel and vehicle expenses (RBI, 2020). Across quarters though, there has been a switch in revenue spending from Q2 to Q1. As regards capital expenditure, it registered a sharp fall in Q1:2020-21, which moderated slightly in Q2:2020-21 on Y-o-Y basis. Capital expenditure of state governments in H1: 2020-21 is a significantly lower proportion of the budget estimates than the previous two years (Chart 11). Looking at capital expenditure from a long-term perspective shows that both union and states have resorted to capex cuts in 17 and 16 years, respectively, over the last two decades. However, in the last few years, while the centre has broadly maintained its capex vis-à-vis BE, cuts have been particularly pronounced for states (Chart 12 a). Along with the increased capex announced by the union government for several ministries for 2020-21 under the Aatma Nirbhar Bharat 2.0 and 3.0, it is also reviewing the capital expenditure of Central Public Sector Enterprises (CPSEs) and has urged them to meet 75 per cent of their capital expenditure target by the third quarter of this fiscal. There are, however, strong indications that states, which constitute around 60 per cent of the general government capex with a fiscal multiplier above 2, may resort to a cut in capex in 2020-21, which may act as a drag on revival of investment and overall growth (Chart 12 b).
A comparison of general government capital expenditure as a proportion to its fiscal balance, a broad indicator of extent of borrowing going towards financing capex, across emerging market economies shows that this proportion in India is lower than many of its peers (Chart 13). III. Fiscal Deficit and its Financing a. Fiscal Deficit Central Government With the Central government overshooting the GFD-GDP target of 3.3 per cent in 2019-20, government had budgeted a slightly higher fiscal deficit ratio of 3.5 per cent for 2020-21, with the aim of providing counter-cyclical support to growth while adhering to the FRBM Act prescribed targets. This fiscal arithmetic has, however, been altered by the steep erosion in revenues on the back of sharp contraction in economic activity. In Q1 and Q2 of 2020-21, the fiscal deficits at 17.4 per cent and 5.3 per cent of quarterly GDP respectively, were much higher compared to previous years (Chart 14).
State Governments While states have budgeted a GFD-GDP ratio of 2.8 per cent for 2020-21, this number is poised for substantial upward revision as most of the states presented their budgets before the onset of COVID-19 pandemic. This is evident from the fact that average GFD for the states that made post-outbreak budget presentation is 4.6 per cent of GSDP vis-a-vis 2.4 per cent for states presenting their budget before the outbreak of the pandemic (RBI, 2020). In Q1 and Q2 of 2020-21, the fiscal deficit for states was at 5.0 per cent and 2.5 per cent of quarterly GDP, respectively, much higher compared to previous years (Chart 15). 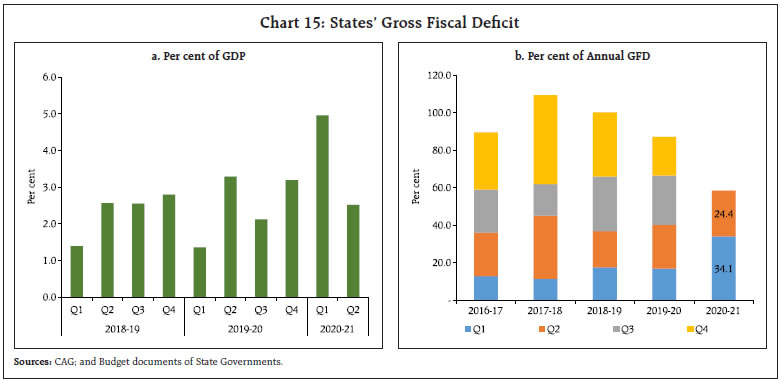
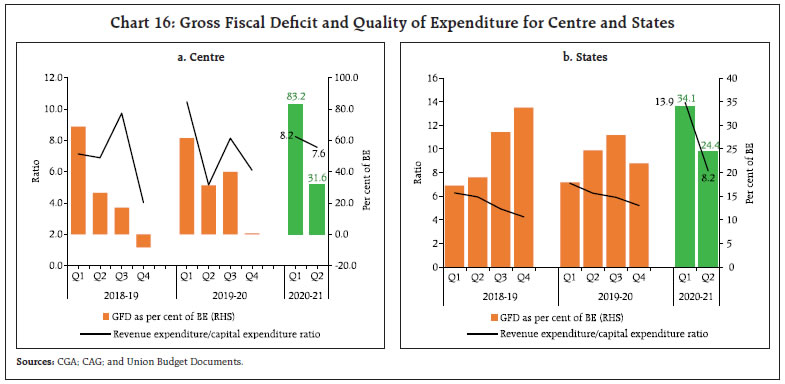 The fiscal slippage has been accompanied by a deterioration in the quality of expenditure, with the revenue expenditure to capital expenditure ratio rising for Centre and states in H1:2020-21, relative to the corresponding period of the previous year (Chart 16). More than a third of the total revenue expenditure during H1:2020-21 by Centre was incurred by the Ministries of Agriculture, Rural Development, Defence, and Consumer Affairs, Food and Public Distribution (Table 1). Ministry-wise, the Ministries of Defence, Railways, and Road Transport accounted for more than 75 per cent of the total capital expenditure incurred during the period (Table 2). | Table 1: Ministry-wise Revenue Expenditure of Central Government in H1 | | Item | ₹ Thousand crores | Per cent of Total Revenue Expenditure | | 2018-19 | 2019-20 | 2020-21 | 2018-19 | 2019-20 | 2020-21 | | 1 | 3 | 4 | 5 | 6 | 7 | 8 | | Ministry of Defence | 175 | 195 | 175 | 15.4 | 15.0 | 13.3 | | Ministry of Rural Development | 74 | 72 | 125 | 6.5 | 5.5 | 9.5 | | Ministry of Consumer Affairs, Food and Public Distribution | 131 | 126 | 88 | 11.5 | 9.7 | 6.7 | | Ministries of Agriculture, Fisheries, Animal Husbandry & Dairying | 37 | 56 | 72 | 3.2 | 4.3 | 5.5 | | Source: CGA. |
| Table 2: Ministry-wise Capital Expenditure of Central Government in H1 | | Item | ₹ Thousand crores | Per cent of Total Capital Expenditure | | 2018-19 | 2019-20 | 2020-21 | 2018-19 | 2019-20 | 2020-21 | | 1 | 3 | 4 | 5 | 6 | 7 | 8 | | Ministry of Defence | 55 | 67 | 58 | 33.9 | 35.8 | 34.8 | | Ministry of Road Transport and Highways | 44 | 45 | 41 | 27.4 | 24.1 | 24.5 | | Ministry of Railways | 29 | 35 | 29 | 17.7 | 18.5 | 17.2 | | Ministry of Consumer Affairs, Food and Public Distribution | 0 | 0 | 11 | 0.1 | 0.0 | 6.7 | | Source: CGA. |
| Table 3: Financing of Gross Fiscal Deficit of Central Government | | Per cent of H1 GDP at current price | | Component | April- September 2015-16 | April- September 2016-17 | April- September 2017-18 | April- September 2018-19 | April- September 2019-20 | April- September 2020-21 | | External Financing | 0.0 | 0.1 | 0.1 | -0.1 | 0.0 | 0.4 | | Market Borrowings | 4.0 | 4.0 | 4.3 | 3.6 | 4.9 | 13.0 | | Securities Against Small Savings | 0.0 | -0.0 | 0.2 | 0.3 | 0.6 | 0.6 | | National Small Savings Fund | 0.6 | 0.8 | 0.7 | 0.7 | 0.5 | 0.9 | | Cash Balance {Decrease(+)/Increase(-)} | 0.1 | -0.0 | 0.1 | 0.0 | 0.1 | 0.1 | | Investment (-) / Disinvestment (+) of Surplus Cash | 1.4 | 2.0 | 0.8 | 1.8 | 0.9 | -3.0 | | Ways & Means Advances | - | - | - | 0.3 | - | - | | Others | -0.4 | -0.7 | -0.1 | -0.1 | -0.4 | -1.3 | | Total GFD / Financing | 5.7 | 6.1 | 6.1 | 6.5 | 6.6 | 10.7 | | Sources: CGA; Ministry of Statistics and Programme Implementation (MOSPI); and RBI. | b. Financing of Fiscal Deficit The financing pattern of the GFD of Centre has changed significantly in H1: 2020-21, with a higher share of market borrowings compared to previous years, particularly to compensate for the shortfall in receipts. In fact, market borrowings (13.0 per cent of GDP) are significantly higher than GFD (10.7 per cent of GDP), which is available as surplus cash balance that could potentially moderate additional borrowing requirement for meeting expenditure in H2 (Table 3). IV. Market Borrowings Market borrowings for both Centre and states have risen to unprecedented levels in 2020-21 in the wake of the devastating impact of COVID-19 on the economy and government finances (Table 4). In view of the pandemic, while Centre’s borrowing calendar has been revised upwards twice in the fiscal year so far, states were allowed increased borrowing limits by an additional 2 per cent of GSDP (partly conditional and partly unconditional) as part of Aatma Nirbhar Bharat programme in May 2020. An analysis at the state level shows a generalised increase in the first half market borrowings as a per cent of full year GFD in 2020-21 compared to the levels in 2019-20. All states except Uttar Pradesh (lying above the no change line across years) have registered an increase, and with a few exceptions, a strong correlation between the levels in 2020-21 and 2019-20 is found suggesting that the increase has been broadly similar across states. The spatial dimension of COVID-19 outbreak on state government finances is evident from the quantum of increase in market borrowings – three states that have registered the highest increases (Maharashtra, Karnataka and Tamil Nadu) are also three of the four states with the highest COVID-19 caseload (Chart 17). | Table 4: Market Borrowings of Central and State Governments | | (In ₹ crore) | | Item | 2020-21 (April1 - November 13, 2020) | 2019-20 (April 1 - November 15, 2019) | 2020-21 H1 (April - October 2,
2020) | 2019-20 H1 (April - September
2019) | | Central Government | | | | | | Gross Market Borrowings | 9,05,000 | 5,22,000 | 7,66,000 | 4,42,000 | | | (116.0) | (73.5) | (98.2) | (62.3) | | Net Market Borrowings | 7,74,428 | 4,20,972 | 6,35,428 | 3,40,972 | | | (142.1) | (89.0 ) | (116.6) | (72.1) | | State Governments | | | | | | Gross Market Borrowings | 4,64,132 | 3,07,306 | 3,53,596 | 2,25,445 | | | (65.6) | (49.3) | (50.0) | (36.2 ) | | Net Market Borrowings | 3,81,077 | 2,18,254 | 2,98,989 | 1,56,447 | | | (68.0) | (44.9 ) | (53.3) | (32.2) | Note: Figures in parentheses are per cent to BE.
Source: Weekly Statistical Supplement, RBI. | Financial accommodations availed by states under various facilities available with the Reserve Bank have risen significantly higher in H1:2020-21 compared to the same period in previous years, particularly for Ways and Means Advances (WMA) and Special Drawing Facility (SDF) (which acts like a special WMA over the normal WMA) (Chart 18a). During the year, as a measure to ease financial pressure and smoothen the borrowing calendar for states, the Reserve Bank increased the WMA limit available with states by 60 per cent. During April - September 2020, thirteen states resorted to WMA, while six states availed the overdraft facility. State-wise, Andhra Pradesh, Jammu and Kashmir, Himachal Pradesh, Kerala, Nagaland and Telangana showed the highest increase in WMA utilisation as a per cent of the limit available, while Manipur, Punjab and West Bengal registered a decline (Chart 18b).
V. General Government Finances The Bulletin article on “Government Finances 2019-20: A Half-Yearly Review” published in December 2019, took the first step towards compiling and reporting general government finances data on a quarterly basis, in order to meet India’s commitments towards the G-20 Data Gaps Initiative. In continuation of this effort to provide timely fiscal data, general government finances have been compiled on a quarterly basis till Q2:2020-21 (Appendix Table 5). The analysis shows that combined GFD performance deteriorated in H1:2020-21, as GFD as per cent of GDP shot up sharply in Q1:2020-21, primarily due to a shortfall in general government receipts and front-loading of the expenditures coupled with contraction in GDP (Chart 19 a). Going forward, in the second half of 2020-21, while the fisc is likely to benefit from better receipts in line with normalisation of economic activity, the push given through various expenditure measures by the Government, essentially on-budget ones through Aatma Nirbhar 2.0 and 3.0 is likely to materialise. Taking into account these developments and assuming major expenditure push – partly in Q3 and mostly in Q4, based on GDP growth as projected in the Reserve Bank’s December 2020 monetary policy review, the Q3 and Q4 combined fiscal deficit are projected at 8.3 and 12.4 per cent of GDP, respectively, with corresponding 50 per cent confidence interval estimated at 7.8-8.8 per cent and 11.6-12.9 per cent (Chart 19 b). Accordingly, GFD-GDP ratio is likely to moderate from 14.5 per cent of GDP in H1: 2020-21 to 10.4 per cent of GDP in H2:2020-21. VI. Way Forward The GFD for the Union Government in 2020-21 crossed 100 per cent of the budgeted amount by the fourth month of the financial year (i.e., July 2020), and stood at 119.7 per cent of the budgeted amount by October 2020. The revenue deficit stood at 126.7 per cent of the budgeted amount by October 2020, suggesting a deterioration in the quality of expenditure. While seasonality has played a part in this front-loading of deficit for the central government, the sharper than usual build up in fiscal deficit this year is due to the collapse in revenues (especially in Q1 resulting from 22.6 per cent contraction in nominal GDP). For states, H1:2020-21 GFD stood at 58.4 per cent of budgeted amount, significantly higher than the 35-40 per cent observed in a normal year. With deterioration in fiscal balances at both levels of government, the combined GFD (centre plus states) in H1:2020-21 stood at 85.9 per cent of BE, significantly higher than 70.0 per cent in H1:2019-20. Half-yearly trends mask the inter-quarter differences in the evolution of fiscal balances as the higher GFD in H1:2020-21 is entirely attributable to Q1:2020-21, while GFD (as a per cent to BE) in Q2:2020-21 remained at similar levels of the previous two years. GFD being a derived figure, it depends on movements in both receipts and expenditure. In Q1:2020-21, while revenue receipts collapsed, expenditure levels were only marginally lower than the previous year, resulting in a widening of the GFD. While the revenue gap remained, albeit to a lesser extent, in Q2, prudent spending allowed correction in the GFD. As such there was reversion of Q2:2020-21 GFD to its normal level (as a per cent of BE) with substantial recovery in revenue receipts along with rationalisation of expenditure. The expenditure rationalisation, however, has been achieved with a cut-down in capital expenditure at both levels of government, which may dampen the recovery in growth. Given the seasonality and the reversion of GFD to its normal levels in Q2:2020-21, the combined GFD is likely to see lower accretion going forward. Notwithstanding the severe impact of COVID-19 on government finances already realised in H1, it is imperative for centre and states to continue with the counter-cyclical fiscal measures to sustain the momentum of the recovery. Revenue expenditure measures undertaken to enhance social protections to the underprivileged and to address labour market dislocations might need to continue as the recovery is likely to be uneven across sectors. Capital expenditure, which collapsed in H1:2020-21, will need to be scaled up as a priority. Public investment in healthcare, social housing, education and environmental protection is the need of the hour to build a more resilient and inclusive economy. Governments will have to effectively balance between continued fiscal support for the fragile recovery process and addressing the medium-term debt-deficit imbalances, while ensuring good house-keeping and adequate transparency in the fiscal reporting. References Baker, S., Farrokhnia, R. A., Pagel, M., Meyer, S., and Yannelis, C. 2020. “Income, Liquidity, and the Consumption Response to the 2020 Economic Stimulus Payments.” National Bureau of Economic Research Working Paper Series, No. 27097. Eggertsson, G. B., Mehrotra, N. R., and Robbins, J. A. 2019. “A Model of Secular Stagnation: Theory and Quantitative Evaluation.” American Economic Journal: Macroeconomics 11 (1): 1–48. IMF (2020a). IMF Fiscal Monitor. 2020, International Monetary Fund, October 2020. IMF (2020b). “Challenges in Forecasting Tax revenue.” IMF Special Series on COVID-19. April 20. Misra, S. and Trivedi P. (2016). Structural fiscal balance: An empirical investigation for India. RBI Occasional Papers Vols. 35 and 36, Vols. 1 and 2, 2014 and 2015. Rachel, L., and Summers L. H.. 2019. “On Falling Neutral Real Rates, Fiscal Policy, and the Risk of Secular Stagnation.” Brookings Papers on Economic Activity (Spring): 1–76. Reserve Bank of India (2019). “Monetary Policy Report”. April 2019. Reserve Bank of India (2020). “State Finances A Study of Budgets of 2020-21”. Websites The office of the Comptroller and Auditor General of India. https://cag.gov.in/ The Office of Controller General of Accounts. http://www.cga.nic.in/
Appendix Tables | Table 1: Budgetary Position of the Central Government during April-September 2020-21 | | Item | (₹ thousand crore) | (Per cent) | | Actuals | Budget Estimates | Percent of BE | Y-o-Y Growth Rate | | 2020-21 | 2019-20 | 2020-21 | 2019-20 | 2020-21 | 2019-20 | 2020-21 | 2019-20 | | (1) | (2) | (3) | (4) | (5) | (6) | (7) | (8) | (9) | | 1. Revenue Receipts | 550.8 | 816.5 | 2020.9 | 1962.8 | 27.3 | 41.6 | -32.5 | 18.0 | | 1.1. Tax Revenue (Net) | 458.5 | 607.4 | 1635.9 | 1649.6 | 28.0 | 36.8 | -24.5 | 4.2 | | 1.2. Non-Tax Revenue | 92.3 | 209.0 | 385.0 | 313.2 | 24.0 | 66.7 | -55.9 | 91.8 | | 1.3. Interest Receipts | 5.7 | 6.5 | 11.0 | 13.7 | 52.1 | 47.3 | -11.3 | 10.9 | | 2. Capital Receipts | 14.6 | 20.6 | 225.0 | 119.8 | 6.5 | 17.2 | -28.9 | 16.2 | | 2.1. Recovery of Loans | 8.9 | 8.2 | 15.0 | 14.8 | 59.2 | 55.6 | 7.5 | 5.8 | | 2.2. Other Receipts | 5.8 | 12.4 | 210.0 | 105.0 | 2.8 | 11.8 | -53.2 | 24.3 | | 3. Total Receipts (1+2) | 565.4 | 837.1 | 2245.9 | 2082.6 | 25.2 | 40.2 | -32.5 | 18.0 | | 4. Revenue Expenditure | 1313.6 | 1301.1 | 2630.1 | 2447.8 | 49.9 | 53.2 | 1.0 | 14.0 | | of which | | | | | | | | | | (i) Interest Payments | 305.7 | 270.7 | 708.2 | 660.5 | 43.2 | 41.0 | 12.9 | 6.0 | | 5. Capital Expenditure | 165.8 | 187.5 | 412.1 | 338.6 | 40.2 | 55.4 | -11.6 | 15.3 | | of which | | | | | | | | | | (i) Loans and Advances | 17.4 | 14.8 | 31.8 | 27.8 | 54.7 | 53.4 | 17.1 | 40.8 | | 6. Total Expenditure (4+5) | 1479.4 | 1488.6 | 3042.2 | 2786.3 | 48.6 | 53.4 | -0.6 | 14.1 | | 7. Revenue Deficit (4-1) | 762.8 | 484.6 | 609.2 | 485.0 | 125.2 | 99.9 | 57.4 | 7.7 | | 8. Fiscal Deficit (6-3) | 914.0 | 651.6 | 796.3 | 703.8 | 114.8 | 92.6 | 40.3 | 9.6 | | 9. Gross Primary Deficit {8-4 (i)} | 608.3 | 380.9 | 88.1 | 43.3 | 690.2 | 879.8 | 59.7 | 12.2 | | Source: Office of Controller General of Accounts, Ministry of Finance, Government of India. |
| Table 2: Quarterly Position of Central Government Finances | | Item | (₹ thousand crore) | (Per cent) | | Q1 | Q2 | Per cent of Budget Estimates | Y-o-Y Growth Rate | | Q1 | Q2 | 2020-21 | | 2020-21 | 2019-20 | 2020-21 | 2019-20 | 2020-21 | 2019-20 | 2020-21 | 2019-20 | Q1 | Q2 | | (1) | (2) | (3) | (4) | (5) | (6) | (7) | (8) | (9) | (10) | (11) | | 1. Revenue Receipts | 150.0 | 284.9 | 400.8 | 531.6 | 7.4 | 14.5 | 19.8 | 27.1 | -47.3 | -24.6 | | 1.1. Tax Revenue (Net) | 134.8 | 251.4 | 323.7 | 356.0 | 8.2 | 15.2 | 19.8 | 21.6 | -46.4 | -9.1 | | 1.2. Non-Tax Revenue | 15.2 | 33.5 | 77.1 | 175.6 | 3.9 | 10.7 | 20.0 | 56.1 | -54.6 | -56.1 | | 1.3. Interest Receipts | 1.6 | 3.3 | 4.1 | 3.2 | 14.8 | 23.8 | 37.3 | 23.5 | -50.0 | 27.9 | | 2. Capital Receipts | 3.6 | 4.8 | 11.1 | 15.8 | 1.6 | 4.0 | 4.9 | 13.2 | -25.0 | -30.1 | | 2.1. Recovery of Loans | 3.6 | 2.4 | 5.3 | 5.8 | 23.9 | 16.2 | 35.3 | 39.3 | 48.4 | -9.4 | | 2.2. Other Receipts | 0.0 | 2.4 | 5.8 | 10.0 | 0.0 | 2.2 | 2.8 | 9.5 | -100.0 | -42.2 | | 3. Total Receipts (1+2) | 153.6 | 289.7 | 411.8 | 547.4 | 6.8 | 13.9 | 18.3 | 26.3 | -47.0 | -24.8 | | 4. Revenue Expenditure | 727.7 | 658.7 | 585.9 | 642.4 | 27.7 | 26.9 | 22.3 | 26.2 | 10.5 | -8.8 | | of which | | | | | | | | | | | | (i) Interest Payments | 160.5 | 141.8 | 145.2 | 128.9 | 22.7 | 21.5 | 20.5 | 19.5 | 13.2 | 12.6 | | 5. Capital Expenditure | 88.3 | 63.0 | 77.6 | 124.5 | 21.4 | 18.6 | 18.8 | 36.8 | 40.1 | -37.7 | | of which | | | | | | | | | | | | (i) Loans and Advances | 13.9 | 6.0 | 3.4 | 8.8 | 43.9 | 21.7 | 10.8 | 31.7 | 131.4 | -61.1 | | 6. Total Expenditure (4+5) | 815.9 | 721.7 | 663.5 | 766.9 | 26.8 | 25.9 | 21.8 | 27.5 | 13.1 | -13.5 | | 7. Revenue Deficit (4-1) | 577.7 | 373.8 | 185.1 | 110.8 | 94.8 | 77.1 | 30.4 | 22.8 | 54.5 | 67.1 | | 8. Fiscal Deficit (6-3) | 662.4 | 432.1 | 251.6 | 219.5 | 83.2 | 61.4 | 31.6 | 31.2 | 53.3 | 14.6 | | 9. Gross primary Deficit {8-4 (i)} | 501.9 | 290.3 | 106.5 | 90.6 | 569.4 | 670.6 | 120.8 | 209.2 | 72.9 | 17.6 | | Source: Office of Controller General of Accounts, Ministry of Finance, Government of India. |
| Table 3: Budgetary Position of the State Governments during April-September 2020-21 | | Item | (₹ thousand crore) | (Per cent) | | Provisional actuals data | Per cent of BE | Y-o-Y Growth Rate | | 2018-19 | 2019-20 | 2020-21 | 2019-20 | 2020-21 | 2019-20 | 2020-21 | | 1 | 2 | 3 | 4 | 5 | 6 | 7 | 8 | | 1. Revenue Receipts | 834.9 | 855.4 | 713.9 | 38.2 | 30.7 | 2.5 | -16.5 | | 1.1. Tax Revenue | 628.2 | 633.4 | 496.6 | 39.5 | 30.6 | 0.8 | -21.6 | | 1.2. Non-Tax Revenue | 63.6 | 61.8 | 45.8 | 31.2 | 20.9 | -2.8 | -25.9 | | 1.3. Grants-in-aid and Contributions | 143.1 | 160.2 | 171.5 | 36.5 | 35.7 | 12.0 | 7.0 | | 2. Capital Receipts | 6.9 | 12.1 | 1.5 | 22.2 | 10.0 | 76.0 | -87.8 | | 2.1. Recovery of Loans and Advances | 6.8 | 12.1 | 1.4 | 22.8 | 13.0 | 77.4 | -88.2 | | 2.2. Other Receipts | 0.1 | 0.1 | 0.1 | 3.1 | 1.4 | -32.5 | -11.3 | | 3. Revenue Expenditure | 840.8 | 906.7 | 911.5 | 40.1 | 38.3 | 7.8 | 0.5 | | of which | | | | | | | | | (i) Interest Payments | 84.7 | 103.8 | 113.9 | 40.1 | 39.6 | 22.6 | 9.8 | | 4. Capital Expenditure | 137.8 | 137.2 | 88.9 | 30.8 | 20.0 | -0.4 | -35.2 | | 4.1. Capital Outlay | 122.6 | 119.6 | 80.1 | 29.1 | 19.7 | -2.4 | -33.1 | | 4.2. Loans and Advances Disbursed | 15.3 | 17.6 | 8.8 | 52.1 | 22.6 | 15.3 | -49.8 | | 5. Fiscal Deficit [(3+4) - (1+2)] | 136.8 | 176.4 | 285.0 | 42.6 | 58.4 | 29.0 | 61.6 | | 6. Revenue Deficit (3-1) | 5.9 | 51.3 | 197.6 | 212.7 | 340.9 | 775.8 | 285.1 | Source: Comptroller and Auditor General of India. |
| Table 4: Quarterly Position of State Government Finances | | Item | (₹ thousand crore) | (Per cent) | | Provisional (actuals) data | Per cent of Budget Estimates | Y-o-Y
Growth Rate | | Q1 | Q2 | Q1 | Q2 | 2020-21 | | 2020-21 | 2019-20 | 2020-21 | 2019-20 | 2020-21 | 2019-20 | 2020-21 | 2019-20 | Q1 | Q2 | | 1. Revenue Receipts | 315.6 | 388.0 | 398.2 | 467.4 | 13.6 | 17.3 | 17.1 | 20.9 | -18.6 | -14.8 | | 1.1. Tax Revenue | 200.9 | 299.3 | 295.7 | 334.1 | 12.4 | 18.7 | 18.2 | 20.8 | -32.9 | -11.5 | | 1.2. Non-Tax Revenue | 19.8 | 28.4 | 26.0 | 33.4 | 9.0 | 14.4 | 11.8 | 16.9 | -30.3 | -22.1 | | 1.3. Grants-in-aid and Contributions | 94.9 | 60.3 | 76.6 | 99.9 | 19.8 | 13.7 | 16.0 | 22.8 | 57.4 | -23.4 | | 2. Capital Receipts | 0.6 | 1.0 | 0.9 | 11.1 | 4.2 | 1.9 | 5.8 | 20.3 | -39.8 | -92.3 | | 2.1. Recovery of Loans and Advances | 0.6 | 1.0 | 0.8 | 11.1 | 5.5 | 1.9 | 7.5 | 21.0 | -39.6 | -92.6 | | 2.2. Other Receipts | 0.0 | 0.0 | 0.0 | 0.0 | 0.5 | 1.6 | 0.9 | 1.5 | -44.2 | 25.0 | | 3. Revenue Expenditure | 450.1 | 405.8 | 461.3 | 500.9 | 18.9 | 17.9 | 19.4 | 22.1 | 10.9 | -7.9 | | of which | | | | | | | | | | | | (i) Interest Payments | 51.7 | 42.8 | 62.2 | 61.0 | 18.0 | 16.5 | 21.6 | 23.6 | 20.9 | 2.0 | | 4. Capital Expenditure | 32.3 | 57.2 | 56.6 | 80.0 | 7.3 | 12.8 | 12.7 | 18.0 | -43.5 | -29.3 | | 4.1. Capital Outlay | 29.8 | 52.8 | 50.3 | 67.1 | 7.4 | 12.9 | 12.4 | 16.3 | -43.6 | -25.1 | | 4.2. Loans and Advances Disbursed | 2.5 | 4.7 | 6.3 | 12.9 | 6.5 | 13.9 | 16.2 | 38.3 | -46.1 | -51.2 | | 5. Fiscal Deficit [(3+4)-(1+2)] | 166.2 | 74.0 | 118.9 | 102.4 | 34.1 | 17.9 | 24.4 | 24.7 | 124.6 | 16.0 | | 6. Revenue Deficit (3-1) | 134.5 | 17.8 | 63.1 | 33.5 | 232.0 | 74.0 | 108.9 | 138.8 | 653.8 | 88.6 | Source: Comptroller and Auditor General of India. |
| Table 5: Combined Government Finances (as per cent of GDP) | | Item | 2019-20 | 2020-21 | 2019-20 | 2020-21 | | Q1 | Q2 | Q3 | Q4 | Q1 | Q2 | H1 | H1 | | Tax Revenue | 13.1 | 16.0 | 14.9 | 17.5 | 9.9 | 13.1 | 14.6 | 11.7 | | Non-Tax Revenue | 3.0 | 7.1 | 4.0 | 6.4 | 3.9 | 3.8 | 5.0 | 3.9 | | Capital Receipts | 0.1 | 0.6 | 0.3 | 1.2 | 0.1 | 0.3 | 0.3 | 0.2 | | Total Receipts | 16.1 | 23.7 | 19.2 | 25.1 | 14.0 | 17.2 | 19.9 | 15.7 | | Total Expenditure | 26.2 | 31.3 | 26.6 | 28.2 | 36.0 | 24.9 | 28.7 | 29.9 | | Revenue Expenditure | 23.7 | 26.9 | 23.4 | 23.9 | 33.1 | 22.2 | 25.3 | 27.1 | | Capital Expenditure | 2.5 | 4.4 | 3.2 | 4.3 | 2.9 | 2.8 | 3.4 | 2.8 | | Gross Fiscal Deficit | 10.0 | 7.6 | 7.4 | 3.2 | 22.0 | 7.8 | 8.8 | 14.1 | | Revenue Deficit | 7.6 | 3.8 | 4.5 | 0.0 | 19.2 | 5.3 | 5.7 | 11.5 | Note: Data is as per Provisional Accounts of the Union and the State Government finances.
Data pertains to Union Government and broadly 27 states for 2019-20, 24 states for Q1:2020-21, 21 states for Q2:2020-21. |
| Table 6: Chronology of Major Policy Announcements to Mitigate the Impact of COVID-19 | | Date of Announcement | Policy Announcements by the Government of India | | March 14, 2020 | Norms for assistance from State Disaster Response Fund (SDRF) were issued. | | March 24, 2020 | -
Relaxations in statutory and compliance matters were made, such as, extension of deadline for filing income tax/ Goods and Services Tax (GST) returns, payments under Vivad se Vishwas scheme, various corporate matters etc. Bank charges for digital trade transactions for trade finance consumers were reduced. Threshold of default under Section 4 of the Insolvency and Bankruptcy Code (IBC) was raised from ₹1 lakh to ₹1 crore to prevent triggering of insolvency proceedings against micro, small and medium enterprises (MSMEs) which are going through a phase of financial distress. | March 26, 2020
(Pradhan Mantri Garib Kalyan Yojana) | 5 kg wheat/rice per member and 1 kg of pulses per family per month would be provided free of cost for 3 months. Jan Dhan women account-holders would be given an ex-gratia of ₹500 per month for three months. Direct Benefit Transfers (DBT) would be made to poor Divyang, widows and senior citizens. Mahatma Gandhi National Rural Employment Guarantee Act (MGNREGA) wages would be increased by ₹20. Gas cylinders would be provided free of cost for 3 months to poor families. Medical insurance would be provided to health workers fighting COVID-19. The first instalment of ₹2,000 due in 2020-21 under the Pradhan Mantri Kisan Samman Nidhi (PM-KISAN) will be front-loaded in April 2020. State governments will be directed to utilize funds available under District Mineral Fund for COVID-19 health response. State governments will be directed to utilize Welfare Fund for Building and Other Construction Workers to provide support to construction workers. Collateral free lending limit for Women Self Help Groups would be increased from ₹10 lakhs to ₹20 lakhs. Mandatory Employee Provident Fund (EPF) contribution, on the part of both employee and employer, shall be borne by government for three months for low wage earners in businesses with less than 100 workers. EPF Regulations will be amended to include pandemic as the reason to allow non-refundable advance of 75 percent of the amount or three months of wages, whichever is lower, from accounts. | | March 30, 2020 | Benefit of 2 per cent interest subvention to banks and 3 per cent prompt repayment incentive for all farmers was extended up to May 31, 2020 for all crop loans up to ₹3 lakh given by banks, due between March 01 and May 31, 2020. | | March 31, 2020 | The Taxation and Other Laws (Relaxations of Certain Provisions) Ordinance, 2020 provided relaxation in compliance and enforcement of a plethora of economic laws. Foreign Trade Policy, 2015-20 was extended for a year and other relaxations and exemptions were granted in the field of exports and imports procedures. | | April 03, 2020 | Advance release of central government’s first instalment of State Disaster Risk Management Fund for the year 2020-21, amounting to ₹11,092 crore, with a view to augment funds available with the state governments. | | April 08, 2020 | It was announced that all pending income-tax refunds up to ₹5 lakh, and all pending GST and custom refunds would be issued immediately, amounting to total refund of ₹18,000 crore. | | April 09, 2020 | ₹15,000 crore was approved for ‘India COVID-19 Emergency Response and Health System Preparedness Package'. | | April 18, 2020 | The extant Foreign Direct Investment (FDI) policy was amended for curbing opportunistic takeovers/acquisitions of Indian companies due to COVID-19 pandemic. | May 13, 2020
(Aatma Nirbhar Bharat 1.0– Part I) | ₹3 lakh crore collateral free loans with 100 per cent credit guarantee cover would be extended to standard businesses/MSMEs. ₹20,000 crore subordinate debt with partial credit guarantee support would be extended to non-performing asset (NPA)/stressed MSMEs. Fund of funds with corpus of ₹10,000 crores would be created for equity funding of MSMEs with growth potential and viability. Definition of MSMEs would be revised to extend benefits to larger number of firms. Global tenders for government procurement would be disallowed up to ₹200 crores to support Make in India and e-market linkages for MSMEs will be promoted. MSME receivables from Government/Central Public Sector Enterprises (CPSEs) will be released in 45 days. ₹2,500 crore EPF support for eligible businesses and workers will be extended for 3 more months (June to August 2020). For other businesses and workers, EPF contribution will be reduced to 10 per cent each, for 3 months-will provide liquidity of ₹6,750 crore. ₹30,000 crore special liquidity scheme will be launched for nonbank financial companies (NBFCs)/housing finance companies (HFCs)/microfinance institutions (MFIs). The partial credit guarantee scheme will be extended to cover borrowings of NBFCs, HFCs, and MFIs. Electricity distribution companies (DISCOMs) will be infused with ₹90,000 crore liquidity. Central Public Sector Generation Companies will give rebate to DISCOMS, which shall be passed on to the final consumers (industries). Measures to de-stress real estate and construction will be taken, contracts will be extended by 6 months by government agencies. Tax Deducted at Source (TDS)/ Tax Collected at Source (TCS) rates will be reduced by 25 per cent for remaining period of 2020-21. Dates for filing of income tax return and payment under Vivad se Vishwas scheme were further extended. | May 14, 2020
(Aatma Nirbhar Bharat Abhiyan 1.0– Part II) | Free food grains will be provided to migrants who are not beneficiaries of National Food Security Act (NFSA)/State Card, for 2 months. 83 per cent of Public Distribution System (PDS) population will be covered under One Nation One Ration Card scheme by August 2020 for national portability of PDS benefits (100 per cent by March 2021). Affordable Rental Housing Complexes (ARHC) will be developed and incentivized for migrant workers/urban poor. Interest subvention of 2 per cent will be provided for prompt payees of MUDRA-Shishu loans for a period of 12 months. ₹5,000 crore special credit facility will be extended to street vendors. Credit linked subsidy scheme for middle income group under Pradhan Mantri Awas Yojana (PMAY)-Urban will be extended up to March 2021 to provide ₹70,000 crore boost to housing sector. Compensatory Afforestation Fund Management and Planning Authority (CAMPA) funds will be utilized for afforestation and plantation works to create job opportunities. ₹30,000 crores additional emergency working capital funding will be provided to farmers through NABARD. ₹2 lakh crore concessional credit will be extended to 2.5 crore farmers through Kisan Credit Cards. | May 15, 2020:
(Aatma Nirbhar Bharat Abhiyan 1.0- Part III) | Financing facility of ₹1,00,000 crore will be provided for funding agriculture infrastructure projects at farm-gate and aggregation points. ₹10,000 crores scheme will be launched for formalisation of Micro Food Enterprises (MFE). ₹20,000 crores will be allocated for development of fisheries through Pradhan Mantri Matsya Sampada Yojana (PMMSY). Animal Husbandry Infrastructure Development Fund of ₹15,000 crore will be set-up to support private investment in dairy. Herbal cultivation and beekeeping initiatives will be promoted. Operation Greens will be extended from Tomatoes, Onion and Potatoes (TOP) to all fruits and vegetables. Essential Commodities Act, 1955 will be amended to deregulate certain food items. Central law will be formulated for barrier free inter-state trade. Facilitative legal framework that includes risk mitigation, assured returns, and quality standardization will be framed to enable farmers to engage with processors/aggregators/large retailers. | May 16, 2020:
(Aatma Nirbhar Bharat Abhiyan 1.0- Part IV) | Private sector participation in commercial coal production and exploration will be permitted; coal gasification/liquefaction will be incentivized; ease of doing business measures will be undertaken; coal bed methane extraction rights will be auctioned from Coal India Limited’s (CIL’s) coal mines; concessions in commercial terms will be given to CIL’s consumers. Infrastructure development of ₹50,000 crore will be undertaken in coal sector. Seamless composite exploration-cum-mining cum-production regime will be introduced for enhancing private investments in the mineral sector; 500 mining blocks will be offered; bauxite and coal mineral blocks will be jointly auctioned; distinction between captive and non-captive mines will be removed; Mineral Index for different minerals is being developed; stamp duty payable for mining lease will be rationalized. A list of weapons/platforms with ban on imports will be notified; imported spares will be indigenized; Ordnance Factory Board will be corporatised; foreign direct investment limit in defence manufacturing under automatic route will be raised to 74 per cent; time-bound defence procurement process will be ushered in. Air-space will be managed efficiently leading to reduction in flying cost by ₹1,000 crore per year; world-class airports will be developed through public-private partnership (PPP). PPP will be encouraged for establishment of research reactors for production of medical isotopes, irradiation technology for food preservation; Technology Development cum Incubation Centres will be set up. Quantum of viability gap funding for private sector investment in social infrastructure projects will be enhanced with outlay of ₹8,100 crore. New tariff policy for power sector will be released and power utilities in union territories will be privatized. Private sector will be allowed to use ISRO facilities to improve their capacities; liberal geo-spatial data policy will provide remote-sensing data to tech-entrepreneurs; planetary exploration and outer space travel will be opened for private sector. | May 17, 2020:
(Aatma Nirbhar Bharat Abhiyan 1.0- Part V) | Health and wellness centres in rural and urban areas will be ramped up; infectious diseases hospital blocks will be set up in all districts; lab and surveillance network will be strengthened; and National Digital Health Blueprint will be implemented under the National Digital Health Mission. PM e-VIDYA programme, Manodarpan for psycho-social support, new National Curriculum and Pedagogical framework, and National Foundational Literacy and Numeracy Mission will be launched. Special insolvency resolution framework for MSMEs will be notified; fresh initiation of insolvency proceedings will be suspended up to one year; COVID-19 related debt will be excluded from the definition of “default” under IBC for the purpose of triggering insolvency proceedings; private companies which list Non-Convertible Debentures (NCDs) on stock exchanges will not be regarded as listed; penalties for all defaults for small companies/one-person companies/producer companies/start-ups will be lowered. Offences (involving minor technical and procedural defaults) under Companies Act will be decriminalized. List of strategic sectors requiring presence of Public Sector Enterprises (PSEs) in public interest would be notified; in strategic sectors, at least one enterprise will remain in the public sector but private sector will also be allowed; in other sectors, PSEs would be privatized; and to minimise wasteful administrative costs, number of enterprises in strategic sectors will be only one to four. Borrowing limits of states will be increased to 5 per cent of Gross State Domestic Product (GSDP) for 2020-21, partly linked to specific reforms, leading to extra resources of ₹4.28 lakh crore. MGNREGA allocation for 2020-21 will be increased by ₹40,000 crore. | | June 12, 2020 | GST relaxations will be provided to small taxpayers through reduction in late fee, and one-time extension in period for seeking revocation of cancellation of registration. | | June 30, 2020 | Free provision of food-grains under Pradhan Mantri Garib Kalyan Anna Yojana was extended till November 2020. | | August 6, 2020 | The second instalment of the COVID-19 Emergency Response and Health System Preparedness Package amounting to ₹890.3 crore was released by the Government of India to 22 states/union territories. | October 12, 2020
(Aatma Nirbhar Bharat Abhiyan 2.0) | Leave Travel Concession (LTC) Cash Voucher Scheme and Special Festival Advance Scheme to be provided to government employees. A special interest-free 50-year loan of ₹12,000 crore to be issued by Central Government to States for capital expenditure. Additional budget of ₹25,000 crore to be allocated for capital expenditure on roads, defence, water supply, urban development and domestically produced capital equipment. | | October 23, 2020 | Ex-gratia payment of difference between compound interest and simple interest was granted for six months to borrowers in specified loan accounts. | November 12, 2020
(Aatma Nirbhar Bharat Abhiyan 3.0) | Aatma Nirbhar Bharat Rozgar Yojana was launched to incentivize job creation during COVID-19 recovery. Emergency Credit Line Guarantee Scheme for MSMEs, businesses, MUDRA borrowers, and individuals (loans for business purposes), was extended till March 31, 2021. 10 more Champion Sectors will be covered under the Production Linked Incentives Scheme to help boost competitiveness of domestic manufacturing. ₹18,000 crore additional outlay was provided for PM Awaas Yojana – Urban. Relaxation of Earnest Deposit Money and Performance Security on government tenders was provided to support ease of doing business and for relief to contractors. Income tax relief was provided for developers & home buyers. ₹6,000 crore equity investment will be infused in debt platform of National Investment and Infrastructure Fund (NIIF). ₹65,000 crore will be provided to ensure increased supply of subsidised fertilisers. - Additional outlay of ₹10,000 crore will be provided for PM Garib Kalyan Rozgar Yojana to provide rural employment.
₹3,000 crore boost will be provided to EXIM Bank for promoting project exports under Indian Development and Economic Assistance Scheme (IDEAS Scheme). ₹10,200 crore additional budget stimulus will be provided for capital and industrial expenditure on domestic defence equipment, industrial infrastructure and green energy. ₹900 crore will be provided to Department of Biotechnology for Research and Development of Indian COVID Vaccine. |
|