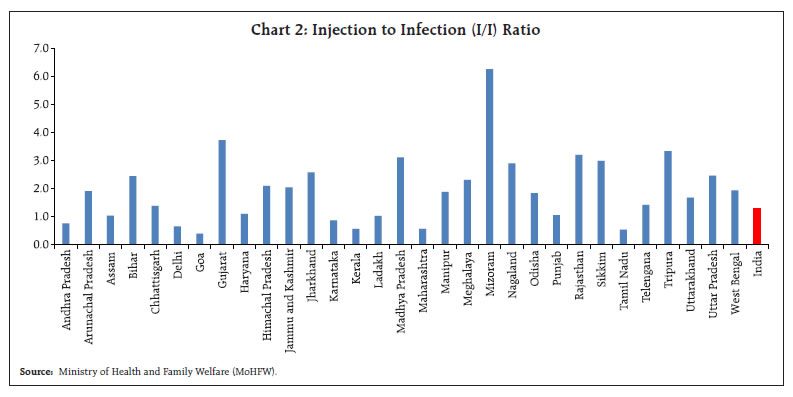
In India, economic activity is gaining steam as COVID-19 incidence recedes and the ongoing vaccine rollout releases pent-up optimism. All engines of aggregate demand are starting to fire; only private investment is missing in action and the time is apposite for it to come alive. Broader measures of liquidity reflect easing of monetary and financial conditions in the system. A race is on upon the tracks of time – infections versus injections; vaccinations versus mutations. So far, like the mythical Grecian huntress Atalanta who offered to marry anyone who could outrun her but those whom she overtook she speared, infections are running ahead. By the end of February 2021, global infections closed on to 114 million across 192 countries, according to the Johns Hopkins University Coronavirus Resource Center. Yet, injections are gaining ground. In total, more than 50 million people have been fully vaccinated in 64 countries around the world. The pace of vaccinations continues to increase, at roughly 6.17 million doses a day (Bloomberg). On the darker side, a COVID-19 mutation that likely confers partial resistance to the antibodies produced by vaccines is now in the U.S., spurring scientists to probe new ways to battle a virus that is constantly changing and could remain active for years. The South African variant has already spread quickly across the African continent and has been seen in at least 24 countries outside Africa. The U.K. mutation first seen in Colorado on December 29, 2020 was detected in 29 U.S. states in less than a month. Both variants are considered more contagious than the original strain. Late-stage trials on vaccines show an unequivocal drop-off in efficacy. Vaccine makers must now shift gears mid-course to work on either booster shots or a new adjusted vaccine that can work better against mutations. It is a wake-up call to be nimble: the virus will mutate and challenge us – with more than 100 million people infected, there are 100 million chances for mutation. India is taking the road less travelled by in at least three important ways. First, the surging tide of COVID-19 patients that peaked in mid-September 2020 at 100,000 new confirmed daily infections, has dropped precipitously to average around 12,500 a day in February 2021, offering doctors, healthcare workers and other frontline warriors an unexpected respite. Health surveys now reveal that exposure to the virus was much higher than previously realised, leading to the view gaining ground that India’s crowded cities and towns may be in the early stages of herd immunity ahead of the availability of the vaccine. Or at least, hope that the worst is over, vindicating the prognosis made in the December 2020 issue of this article1. Youth is on our side – close to 95 per cent of the population is aged below 65 years. Moreover, India has been there, done it. Scientists ascribe the high proportion of asymptomatic infections in India to prior exposure to other pathogens; our fight against polio and measles is standing in good stead in our ambitious vaccination drive that aims to inoculate 300 million by end-August. India is only behind the US and the UK in terms of vaccine doses delivered, being the fastest to reach the 500,000 mark (21 days). Despite starting its own vaccination drive only on January 16, India is utilising its pharmaceutical manufacturing capacity to supply vaccines to 70 per cent of the world, with 15 countries so far supplied and another 25 countries are in the queue, including donations to neighbours - a virtuous demonstration of soft power. In terms of nominal GDP, 96 per cent of pre-pandemic economic activity has been restored, assuming that the National Statistical Office’s first advance estimates hold (Chart 1). Early corporate results for Q3:2020-21 indicate that sales continue to improve as they rise out of contraction; combined with a fall in raw material costs and saving on account of lower interest expenses, there has been a jump in operating profits. Pro-cyclical industries in the non-financial sector - auto, steel and cement - registered a sharp rebound in volumes, increases in output prices in a strong pricing environment and adopted cost cutting measures. The information technology (IT) sector has clearly demonstrated pandemic-proofing, notching up among its strongest quarterly sales growth in several years. To illustrate, stock prices of IT major Tata Consultancy Services briefly surpassed those of Accenture to become the world’s most valued IT company in terms of market capitalisation. On the other hand, sales growth of fast moving consumer goods (FMCG) and pharmaceutical companies exhibited moderation during the quarter, tempering profits growth. Across India, more children have to get back to school, more workers and professionals to their workplaces, and more among the elderly outdoors. As the injection to infection (I to I) ratio shows (Chart 2), a long and arduous journey lies ahead with fingers crossed and no room for complacency. 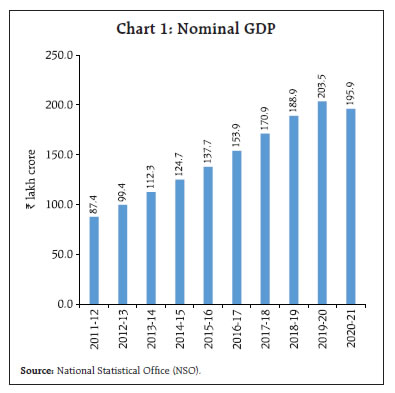
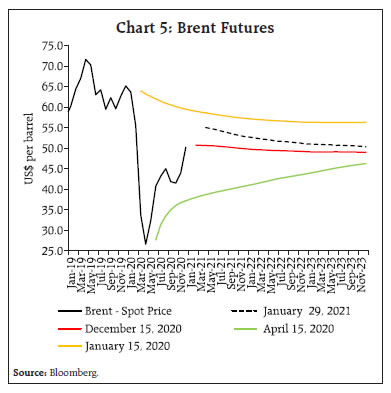
 Second, policy makers in India are wresting the initiative from the virus to convert adversity into opportunity. On February 1, 2021 the Finance Minister unveiled India’s budget of “trust and hope”. Saying no to austerity, the Union Budget will go down in history for balancing boldness and optimism with transparency and pragmatic prudence. No new taxes, ease of compliance and, in fact, tax buoyancy from compliance, new ways to deal with loan delinquencies and yet with the largest capital outlay budget ever at ₹5.54 lakh crore, it is not surprising that in a rare response, financial markets serenaded a budget. Bravo! As Aristotle wrote in his Politika in 350 B.C.E., “well begun is half done.” Third, with fiscal policy reprioritising spending towards growth but within an envelope that also envisages the wind-down of pandemic borrowings – the gross fiscal deficit (GFD) is budgeted to go down from 9.5 per cent of GDP to 6.8 per cent - monetary policy became the sheet anchor of the economy in its last bi-monthly announcement for the year 2020-21. Judging that the easing of inflation in its December reading provided scope to support growth, the monetary policy committee left the policy rate unchanged on February 5 and maintained its time-contingent stance of being accommodative through the current fiscal year and into the next. Fortune favours the brave – in its January 2021 print, inflation came in at 4.06 per cent, just 6 basis points shy of the target on the way down. At the same time, the Reserve Bank pulled out all stops to ensure the smooth completion of the borrowing programme of the central government, reckoning the orderly evolution of the yield curve and ensuing financial stability to be non-rivalrous and non-excludable for the use of all members of society. First, it brought a new and most dependable investor into the gilt market – the Indian saver, the aam aadmi – who can now hold a gilt securities account with the Reserve Bank itself. It is worthwhile to note that the Indian household was the only lender to the rest of the economy in 2019-20, the latest year for which full information is available. Second, it extended a dispensation of holding to maturity new securities purchased by banks. As a result, holdings of securities up to a level of ₹4 lakh crore will be insulated from interest rate fluctuations and hence banks will be protected from ‘mark-to-market’ losses. Third, for the first time, the Governor of the Reserve Bank provided forward guidance on liquidity and it is worthwhile to draw on it: “The stance of liquidity management continues to be accommodative and completely in consonance with the stance of monetary policy. The RBI stands committed to ensure the availability of ample liquidity in the system and thereby foster congenial financial conditions for the recovery to gain traction….the CRR normalisation opens up space for a variety of market operations to inject additional liquidity. The underlying theme of our endeavour in these areas would be to flexibly use all instruments in our arsenal appropriately without jeopardising financial stability, which is at the core of RBI’s policy objectives. As the government’s debt manager and banker, the Reserve Bank will ensure the orderly completion of the market borrowing programme in a non-disruptive manner. In this context, we look forward to the continuance of the common understanding and cooperative approach between market players and the RBI…” The message given is unambiguous: liquidity will remain ample [total absorption under the liquidity adjustment facility (LAF) was ₹7.1 lakh crore on February 25, 2021]; the Reserve Bank will ensure ample liquidity (up to February 19, 2021, the Reserve Bank has conducted open market purchases to the tune of ₹3.0 lakh crore while forex operations had expanded domestic liquidity by ₹5.4 lakh crore in 2020-21). The Reserve Bank will replenish the liquidity withdrawn via normalisation of the cash reserve ratio (CRR), roughly equivalent of ₹1.6 lakh crore; and the Reserve Bank will complete the borrowing programme of the government in an orderly manner. A pity that these stark messages were lost to naïve adventurism by some bond traders! The Reserve Bank’s announcements were not intended to move earth and heaven, but that which we are, we are – one equal temper of heroic hearts2. II. The Global Setting A strong rebound in global economic activity in Q3:2020, powered by pent-up consumption demand and adjustments to work-away-from-office logistics, tapered off in Q4 as surges of second/third waves of infections, especially of newer and more contagious strains and tighter lockdowns took their toll (Chart 3). 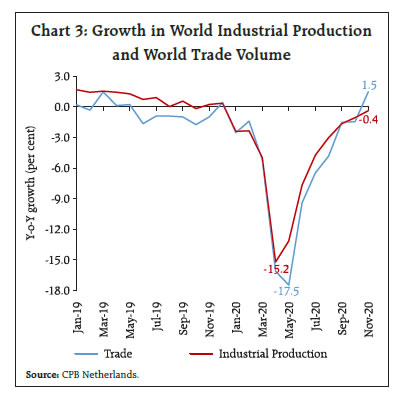 Vaccine approvals, the launch of vaccinations and announcements of additional policy stimulus in some countries infuse hope that the global economy will regain momentum towards the close of Q1 and in Q2. This has brightened the outlook for 2021. On the assumption of vaccine availability across most countries over the course of 2021-22, the International Monetary Fund (IMF) has revised global GDP projections for 2021 to 5.5 per cent in its January 2021 update of the World Economic Outlook (WEO) from 5.2 per cent projected in the October release (Table 1). Advanced economies (AEs) are likely to gain an edge from stockpiling of vaccine doses and additional policy support, with favourable spillovers to trading partners and capital flow spillovers to emerging market economies (EMEs) as risk appetite intensifies. The strength and pace of recovery can, therefore, be expected to remain uneven and divergent across countries. On a sinister note in this context, the World Health Organization (WHO) has indicated that if the pandemic continues to spread unabated in developing economies due to vaccine delays and if vaccine distribution is inequitable, it could lead to an erosion of US$ 4.4 trillion in world output in 2021 or about 5.7 per cent of pre-pandemic global output3. AEs are expected to bear the brunt of this loss: consequent disruptions in global supply chains and trading activity could result in an output loss of up to US$ 2.4 trillion or 3.5 per cent of their annual GDP recorded before the pandemic. The IMF’s January 2021 update of the Global Financial Stability Report (GFSR) also echoes this premonition – uneven access to vaccines could exacerbate risks of financial instability. 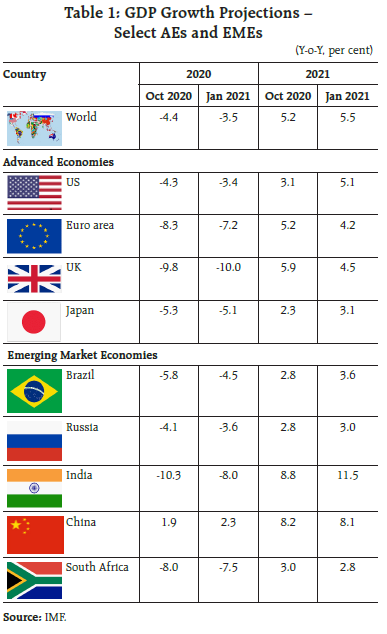 The global composite purchasing managers’ index (PMI) moderated for the third consecutive month in January 2021 as both manufacturing and services activity lost steam at the outset of the year (Chart 4). The global manufacturing PMI fell to a three-month low of 53.5, while the services PMI slipped to a six-month low of 51.6 as growth of output and new orders moderated with new export orders sliding into near-stagnation. Global supply chains remain severely stretched, with vendor lead time lengthening to the highest in the PMI survey’s history. In the wake of supply disruptions, purchase prices have surged, as manifested in high output charges, while input price pressures continue to build. International crude oil prices continued to harden in early 2021, spurred by stimulus announcements and vaccine rollouts. Tightening supplies amidst falling crude inventories in the US have added further upsides. Saudi Arabia’s announcement to cut production by 1 million barrels per day in February and March lifted both sentiments and prices - at an average of US$ 54.5 per barrel, Brent Crude was 9.4 per cent dearer in January (Chart 5). Furthermore, crude oil futures moved into backwardation since December 2020, reflecting tightening of the crude oil markets. Expectations of a substantial improvement in demand in the second half of the year, the organization of the petroleum exporting countries (OPEC) plus supply cuts along with hefty inventories draw down in a scenario where shale output response is likely to stay muted, are keeping prices supported. 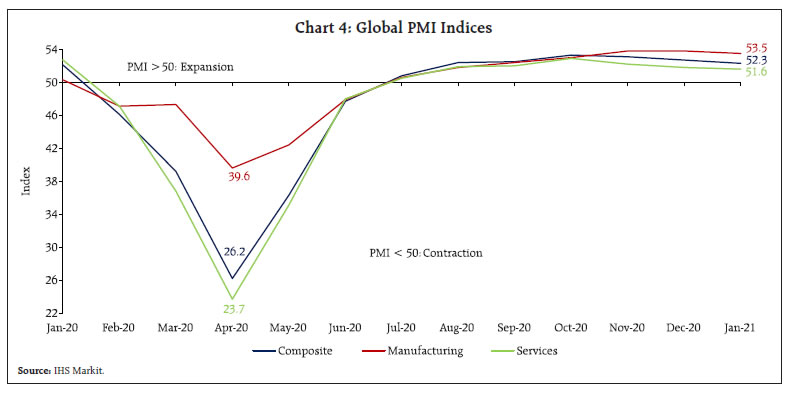
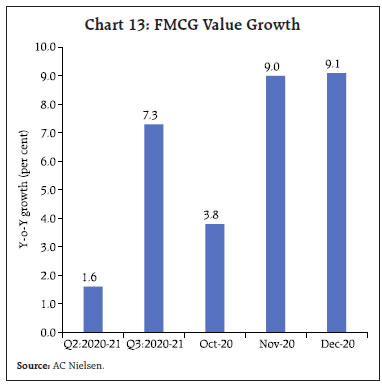
 Gold lost its winning streak in 2021, with prices correcting by 2.7 per cent (Chart 6). The strengthening US dollar, rising US bond yields and strong risk-on sentiments reduced the sheen of the yellow metal. On the other hand, China’s recovery and traction in factory activity, as mirrored in global manufacturing PMI, further boosted the prices of base metals. On the trade front, the latest release dated January 26, 2021, by the World Trade Organization (WTO) reported contraction in global commercial services trade by 24 per cent year-on-year (y-o-y) in Q3:2020, moderating from a decline of 30 per cent in the preceding quarter. The decline in goods trade was relatively moderate – by 5.6 per cent. The slowdown in services trade is expected to persist as preliminary estimates for November predict services trade to be 16 per cent below 2019 levels. Most sub-sectors remain in contraction zone, with travel sector being the worst hit – down by 68 per cent globally in Q3:2020. Goods trade, on the other hand, posted a sequential improvement in value by 4 per cent in November 2020, as compared to their 2019 levels. Two factors primarily aided this recovery, viz., deferred purchases in the early part of the year and a favourable base effect. 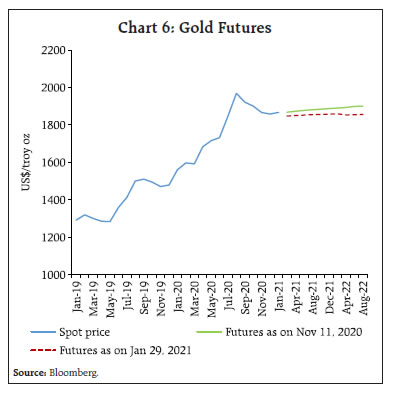 Global foreign direct investment (FDI) recorded a precipitous decline, plunging by 42 per cent to an estimated US$ 859 billion in 2020 from US$ 1.5 trillion a year ago, according to the Investment Trends Monitor of the United Nations Conference on Trade and Development (UNCTAD) released on January 24, 2021. Differential impacts were visible as developed countries remained the hardest hit, with flows plummeting by 69 per cent to an estimated US$ 229 billion, while developing economies saw a more moderate retrenchment by 12 per cent to US$ 616 billion. Despite the decline, FDI flows to developing countries accounted for 72 per cent of the total global FDI flows – the highest share on record – with China and India emerging as the largest recipients in 2020. Nevertheless, downside risks to the outlook of FDI flows remain in 2021 due to persistent uncertainty clouding the course of the virus. Financial markets forged ahead, with some corrections in the last week of January reversing the early gains. The correction was due to a confluence of factors, viz., rising concerns over patchy vaccine deployment amidst rapid spread of more contagious variants; weak economic data for European economies; and actions undertaken by retail investors in the US stock markets that overwhelmed some hedge funds. Overall, the Morgan Stanley Capital International (MSCI) stock indices for AEs ended the month in red, while for the emerging markets, the MSCI stock indices closed the month with net gains (Chart 7). With waning demand for safe haven assets, bond yields across major economies hardened, pushing the 10-year US treasury bond yield above 1.0 per cent in January 2021, for the first time since March 2020. On the other hand, bond yields in emerging market economies (EMEs) exhibited mixed movements, reflecting country-specific factors. In the currency markets, the US dollar which had weakened considerably in 2020, strengthened against major AE currencies in January, marking 0.7 per cent in gains. Concomitantly, the MSCI Emerging Markets (MSCI-EM) index depreciated by 0.1 per cent in January, though the Indian rupee and the Chinese yuan strengthened due to capital inflows.  On the monetary policy front, central banks across the world remain highly accommodative, with major economies holding status quo on interest rates in January 2021 (Chart 8). Turkey, the sole exception, raised rates by a cumulative 875 basis points in three steps since September 2020, before maintaining a pause in January 2021. The central bank of Brazil in its January meeting maintained a pause but withdrew the forward guidance that it had given in August 2020 as inflation expectations and projections inched closer to the target. The central bank, however, forewarned that the removal of the forward guidance does not imply interest rate increases, as the current uncertainties regarding growth required an extraordinarily strong monetary stimulus. On the fiscal front, total fiscal support offered globally till end-December 2020 amounted to US$ 14 trillion (IMF, Fiscal monitor update) or 13.5 per cent of global GDP, out of which 7.4 per cent was in the form of revenue foregone and additional spending, and 6.1 per cent in the form of liquidity support, including loans, guarantees, and equity injections by the public sector. 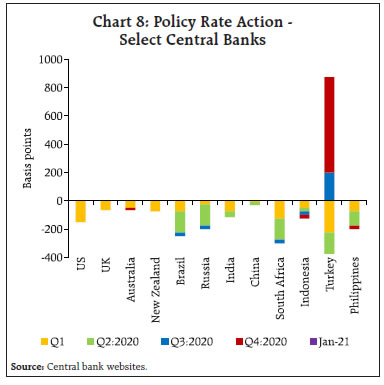 III. Domestic Developments In India, economic activity is gaining steam as COVID-19 incidence recedes and the ongoing vaccine rollout releases pent-up optimism. Information pouring in from a host of indicators attests to a quickening pace of normalisation. By January 31, 2021 India’s weekly COVID-19 fatalities fell below 1000, the lowest in the last 8 months. With the doubling rate4 decreasing to 578.3 days, active cases accounted for just 1.4 per cent of the total cases. In fact, on January 31, 2021 the number of active cases had dropped below 1.7 lakh. The number of people that have recovered has surged to 1,05,34,505, pushing the recovery rate to over 97.0 per cent. Since mid-February, however, there has been a surge in COVID-19 cases, thereby resulting in the doubling rate falling below 600 days and active cases surging past the 1.6 lakh mark as on February 27, 2021. It is feared that new strains in India could be highly transmissible, with the possibility of causing re-infections in people who have already developed anti-bodies to the virus. As the pace of vaccination gains traction across the world, the total number of COVID-19 vaccinations has crossed the total number of confirmed cases globally (Chart 9a), including in India. With India being the global leader in vaccine manufacturing, many domestic vaccine manufacturers have entered into supply agreements with a number of countries/ agencies by leveraging on existing infrastructure, foreign collaboration and a skilled labour force (Chart 9b). Under the “Vaccine Maitri” initiative, vaccines have been supplied to neighbouring countries free of cost, with plans to extend the initiative to other developing countries. A number of other countries have indicated their willingness to import vaccines from Indian pharma firms, given the comparative advantage in producing a large number of doses in a cost-effective manner. 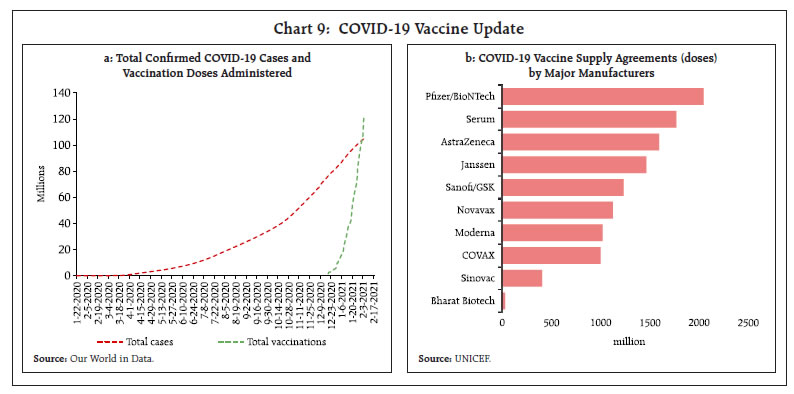 Mobility indicators show that movement of people across all major cities in January and February 2021 was comparable to pre-pandemic levels (Chart 10). While mobility around groceries and pharmacies has risen above January 2020 levels, mobility around transit stations has been tempered by holidays and harsh winter conditions prevailing in some parts of the country. Footfalls at offices reached 84 per cent of pre-pandemic levels in February 2021 from 82 per cent in the previous month (Mint-tracker). Alongside, goods movement expanded considerably, with E-way bills growing by 10.5 per cent y-o-y in January and by 12.5 per cent in February – intra-state by 13.0 per cent and 15.1 per cent: inter-state by 6.8 per cent and 8.8 per cent, respectively. With product and factor mobility catching up with pre-pandemic levels rapidly, the stage is set for an enduring revival of demand in the economy. Aggregate Demand Aggregate demand conditions are on an upswing. Peak power demand touched a new high, hitting 189.6 gigawatts on January 30 and surpassing all previous records. Electricity consumption continued to expand through January and February 2021 for the fifth and sixth successive months, growing at 4.8 per cent and 7.3 per cent, respectively (Chart 11a). As per the Stated Policies Scenario (STEPS) of the International Energy Agency (IEA), that assumes the pandemic to be gradually brought under control in 2021, India’s total energy demand is going to increase by 124.7 per cent from 2010 to 2040 (Chart 11b).  Collections under the goods and services tax (GST) remained above the ₹1 lakh crore mark for the fourth straight month in January 2021 at ₹1,19,847 crore. With a growth of 8.1 per cent, the GST recorded the highest monthly collection in the series (Chart 12). This is reflective of growing business and trading turnover going beyond the festival season, apart from better tax compliance. Disaggregated intra-state and inter-state analysis suggests that the best performing states are Telangana, West Bengal and Tamil Nadu, while activity remains in catch-up mode in the mainland belt comprising Rajasthan, Delhi, U.P and Haryana (Table 2).  Turning to consumption demand, the optimism surrounding the roll out of vaccination is captured in January 2021 round of the Reserve Bank’s consumer confidence survey. Perceptions have improved significantly over all preceding rounds conducted since September 2020. For the year ahead, consumers expect an overall improvement in the general economic situation and in employment conditions. While there is abiding comfort on spending on essentials, lingering uncertainty continues to prevail about non-essential spending. Fast moving consumer goods (FMCG) companies are reporting a surge in demand on the back of increasing mobility, resumption of economic activity, consumer-relevant innovations and investments in market development (Chart 13). Most companies have also experienced revival in discretionary spending, signalling increase in demand for non-durables. According to Nielsen India, new launches have been made in the health and hygiene basket, with immunity being the focus in a ‘new normal’, including categories like hand sanitisers, floor cleaners, toilet cleaners, and antiseptic liquids. These new launches contributed 37 per cent in value terms to all new launches in the COVID-19 period. Advertising/ promotional spending of large FMCG companies exceeded pre-pandemic levels. In respect of passenger vehicles, wholesale sales registered a growth of 11.1 per cent in January 2021 as against 13.6 per cent in the preceding month. The rural sector has exhibited resilience, reflected in buoyant sales of tractors since June 2020. After remaining in contraction for 19 consecutive months, motorcycle sales entered expansion territory in August 2020 and have remained steadfast since then, registering a growth of 5.1 per cent in January 2021. Freight cargo carried by railway expanded by 8.7 per cent in January 2021, while earnings from freight grew by 5.9 per cent, underscoring the sustained spatial expansion of the rebound in demand. There has also been a perceptible shift among consumers towards shopping online. According to a Unicommerce-Kearney report, the last quarter of 2020 (October – December) saw a growth of 36 per cent and 30 per cent in terms of order volume and gross merchandise value (GMV), respectively. The biggest beneficiaries were personal care, beauty and wellness products. 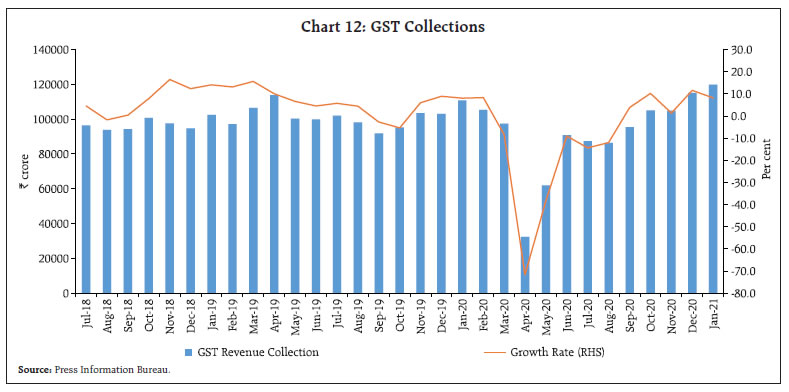

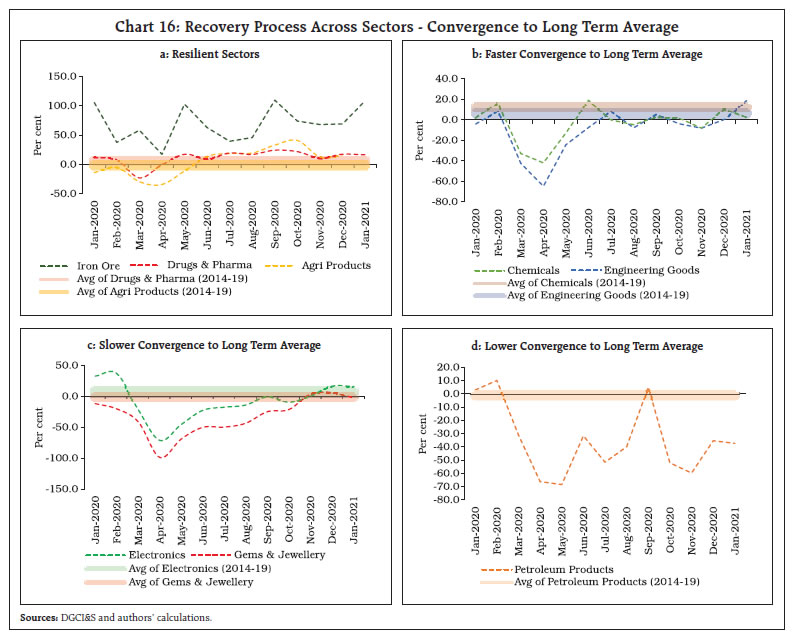
 The household survey of the Centre for Monitoring Indian Economy (CMIE) finds that employment conditions improved through January 2021, with the average employment rate inching up to 37.9 per cent from 36.9 per cent a month ago. Sectors like real estate, construction and services, which suffered employment losses during the lockdown, have evidently recovered to pre-COVID levels. Consequently, the average unemployment rate declined to 6.5 per cent in January 2021 from 9.1 per cent in December 2020 (Chart 14). The pace of improvement was stronger in the case of rural employment than in urban areas, which suggests that India’s rural economy is quickly shredding the debilitating restraints of COVID-19. In fact, the rural unemployment rate at 5.8 per cent is the lowest since July 2018. Although lagging, urban employment is picking up. Employment under the Mahatma Gandhi National Rural Employment Guarantee Act (MGNREGA) proved to be a boon for people during the pandemic. More recently, however, the demand for jobs under MGNREGA has registered a huge drop, with y-o-y growth down from 56.5 per cent in December to 37.3 per cent in January and 18.8 per cent in February (so far) indicating improved employment avenues in other activities. According to the Xpheno’s recent active job outlook survey, the total job openings in January rose by around 50 per cent over a month ago. Entry level jobs and the technology sector have contributed the most to these job openings. 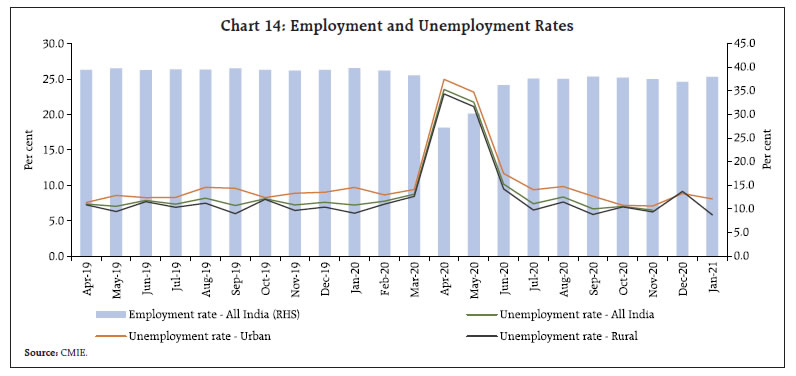 Defying the anaemic external environment, Indian merchandise exports held on to their upward trajectory, growing by 6.2 per cent (y-o-y) in January 2021 - the second consecutive month of expansion. The pick-up in exports has been broad-based, backed by the robust performance of drugs and pharmaceuticals, agriculture, and iron ore exports. A heartening development is that non-oil exports grew by 11.5 per cent, marking the fifth consecutive month of expansion (Chart 15a). Overall, 22 out of 30 major commodities or 71.3 per cent of the export basket led the overall export growth (Chart 16). In recent months, India has joined Asian peers in a broadening swathe that has lifted the region above others in terms of post-pandemic export recovery. India’s merchandise imports grew for the second consecutive month by 2.0 per cent in January 2021, testifying to the growing strength of underlying growth impulses in the domestic economy that are taking root (Chart 15b). The rebound in imports out of a prolonged contraction has also been broad-based with 18 out of 30 major commodities or 60.7 per cent of total imports registering an expansion. While oil imports remained subdued due to softer crude oil prices on a y-o-y basis, non-oil non-gold imports grew by 7.5 per cent. Gold, electronic goods, pearls and precious stones were the top three high growth importables, essentially intermediates in domestic final production and exportables. 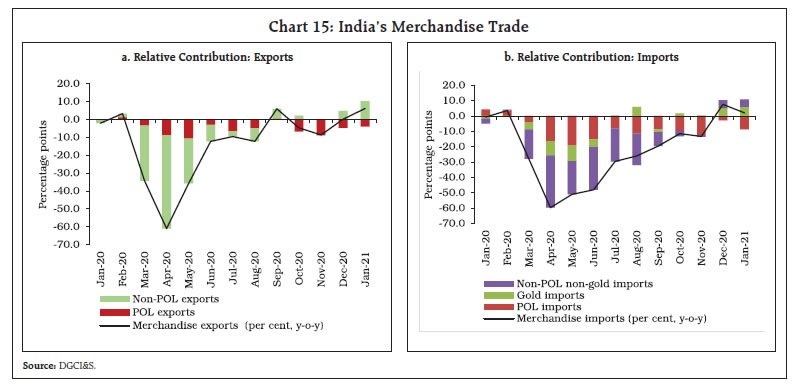
 India’s agricultural exports have grown impressively over the last eight months, i.e., consecutively since May 2020 in spite of COVID-19, with cereal exports turning in a stellar performance. India has emerged as the largest exporter of rice in the world, especially of the non-basmati varieties. While international demand has been strong due to stocking of rice by households in European countries to combat COVID-19 induced lockdowns, other major exporters including Vietnam and Thailand have been affected by supply side disruptions. As regards wheat, the US Department of Agriculture (USDA) has revised its forecast of Indian wheat exports for 2020-21 (July-June) to 1.8 million tonnes (MT) on January 14, 2021, over its earlier estimate of 1 MT, with industry representatives forecasting export potential of up to 3-4 MT in 2020-21. If realised, that would be the highest ever exports of wheat in the last six years. Food processing is a sunrise export sector with strong linkages with agriculture and it is covered under the production-linked incentive (PLI) scheme. Food processing industry can transform our export profile from low-value raw material exports concentration to higher-value processed goods exports specialisation. As food processing is a capital-intensive industry, encouraging foreign direct investment (FDI) in this sector may be a game changer. Besides a moribund international trading environment and a rising tide of protectionism, India’s foreign trade is currently facing formidable logistical challenges. The continuing surge in container freight prices following COVID-19 induced disruptions and reported hoarding of containers have imposed unduly high costs on exporters (Chart 17a). Currently, India is ranked 18th globally in terms of ownership of shipping fleets (Chart 17b). The Union Budget for 2021-22 has proposed a scheme to support Indian shipping companies with the aim of enhancing their share in global shipping. The proposal is expected to reduce the dependence of Indian traders on foreign operated shipping companies and ease container availability. Going forward, the Union Budget 2021-22 proposals on rationalisation of customs duty structure, improving trade facilitation measures, and its focus on enhancing ease of doing business (EoDB) coupled with a big push to infrastructure are expected to boost exports by unlocking the potential of Indian manufacturing. The Union Budget has imparted a distinct pro-investment focus to the revival strategy by taking forward the theme of Aatma Nirbhar Bharat within a major reprioritisation of expenditure. Capital expenditure is slated to increase to 2.5 per cent of GDP in 2021-22 from an average of 1.7 per cent during 2010-20, even as the revenue expenditure is set to contract as a proportion to GDP from its level in 2020-21 (RE) (Table 3). | Table 3: Key Fiscal Indicators (per cent of GDP) | | | 2019-20 | 2020-21 | 2021-22 | | Actual | BE | RE | BE | | 1. Gross Fiscal Deficit | 4.6 | 3.5 | 9.5 | 6.8 | | 2. Revenue Deficit | 3.3 | 2.7 | 7.5 | 5.1 | | 3. Primary Deficit | 1.6 | 0.4 | 5.9 | 3.1 | | 4. Gross Tax Revenue | 9.9 | 10.8 | 9.8 | 9.9 | | 5. Non-Tax Revenue | 1.6 | 1.7 | 1.1 | 1.1 | | 6. Revenue Expenditure | 11.6 | 11.7 | 15.5 | 13.1 | | 7. Capital Expenditure | 1.6 | 1.8 | 2.3 | 2.5 | | 8. Central Government Debt | 52.3 | 50.6 | 64.3 | 62.5 | | Source: Union Budget. | Quarterly movements in general government consumption expenditure in 2020-21 reveal that there has been a renewed thrust on revenue expenditure in Q3, which is expected to increase further in Q4 as states incur higher expenditure in the last quarter of the fiscal year. For the centre, a revenue expenditure growth of around 110 per cent is envisaged in Q4. However, a significant proportion of this increase is due to on-budgeting of subsidies/clearance of past dues; hence revenue expenditure less interest payments and major subsidies, a better indicator of government final consumption expenditure, is estimated to grow by 33.6 per cent in Q4 (Chart 18).  The fiscal push to investment is sought to be achieved by (i) increasing the buoyancy of tax revenues through improved compliance; and (ii) by mobilising receipts from monetisation of assets, including Central Public Sector Enterprises (CPSEs) and surplus land with the Government ministries/departments. Moreover, receipts from disinvestment are budgeted at ₹1.75 lakh crore, which includes privatisation of two public sector banks and one general insurance company. Overall, the Union Budget is expected to remain anti-inflationary. A significant part of the increase in expenditure is due to on-budgeting of outstanding loans availed in lieu of subsidies by the Food Corporation of India (FCI) from the National Small Saving Fund (NSSF), a practice that has been followed since 2016-17 (Chart 19). In fact, total expenditure is estimated to expand by only 1 per cent, with revenue expenditure budgeted to decline by 2.7 per cent. The inflationary impact of the new Agricultural Infrastructure Development Cess (AIDC) is largely offset by the reduction/rationalisation of customs duties on imported items and union excise duties in the case of petrol and diesel. In the event, both gross and net market borrowings of the centre are budgeted to be lower in terms of GDP than a year ago (Chart 20). Aggregate Supply Aggregate supply conditions improved through January 2021. With the rabi sowing season nearing completion, crop sowing has been completed across 684.6 lakh hectares - 2.9 per cent higher than last year and 10.4 per cent over the full season normal acreage (5-year average) (Table 4). This is the highest ever sown area since independence, boding well for another record output. The coverage under wheat has been impressive, with area sown turning out to be the highest ever – 14.1 per cent above the normal acreage. The commitment to continue with minimum support prices (MSPs), adequate irrigation and favourable soil moisture conditions augur well for the agricultural outlook (Chart 21). In the interregnum, the stock of cereals has gone up to 3.9 times the buffer norms. 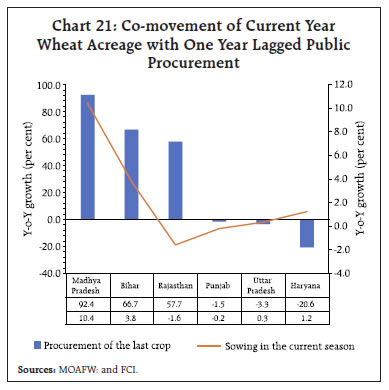
| Table 4: All India Crop Situation - Rabi (2020-21) as on January 29, 2021 | | (In Lakh hectares) | | Crop Name | Normal area for the full season | Sowing as on date | Percentage variation over normal full season | | This year (2021) | Last year (2020) | | 1. Wheat | 303.3 | 346.4 | 336.4 | 14.2 | | 2. Rice | 41.8 | 35.2 | 30.2 | -15.7 | | 3. Coarse Cereals | 57.1 | 51.7 | 56.1 | -9.6 | | a. Jowar | 33.4 | 27.2 | 30.2 | -18.6 | | b. Barley | 6.4 | 6.8 | 7.8 | 7.3 | | c. Maize | 17.4 | 16.9 | 17.5 | -2.5 | | 4. Total Pulses | 144.9 | 167.4 | 162.9 | 15.5 | | a. Gram | 92.8 | 112.0 | 107.3 | 20.7 | | b. Lentil | 14.2 | 16.5 | 16.1 | 16.2 | | c. Peas | 8.8 | 10.7 | 11.0 | 21.7 | | d. Kulthi (Horse Gram) | 2.2 | 3.9 | 5.2 | 79.7 | | e. Urad | 8.9 | 8.1 | 7.5 | -9.4 | | f. Moong | 9.9 | 6.6 | 6.7 | -33.1 | | g. Lathyrus | 4.0 | 3.1 | 3.3 | -21.8 | | I. Total Foodgrains (1+2+3+4) | 547.1 | 600.6 | 585.6 | 9.8 | | 5. Oilseeds | 73.2 | 84.0 | 80.0 | 14.7 | | a. Rapeseed & Mustard | 59.4 | 73.9 | 69.1 | 24.4 | | b. Groundnut | 7.3 | 4.8 | 4.8 | -34.6 | | c. Sunflower | 2.4 | 1.0 | 1.0 | -56.9 | | d. Sesame | 0.0 | 0.5 | 0.6 | 0.0 | | e. Safflower | 1.2 | 0.6 | 0.6 | -50.6 | | f. Linseed | 2.7 | 2.9 | 3.5 | 6.9 | | All- Crops (1+2+3+4+5) | 620.3 | 684.6 | 665.6 | 10.4 | Note: Area figures are as per eye assessment of state Agriculture Departments.
Normal Area: Average area during the period of 2014-15 to 2018-19.
Source: Ministry of Agriculture and Farmer’s Welfare (MOAFW). | Among oilseeds, mustard and rapeseed registered a record acreage this year - up by 14.7 per cent over the normal area. An increase in area under pulses also indicates a better output this year, reducing dependence on imports. The Union Budget’s focus on infrastructure development in agriculture and rural areas, a big push to fisheries and seaweed cultivation alongside enhancing credit flow to allied sectors could bolster agricultural growth even further by enhancing employment and creating opportunities for additional income for farmers. The Budget’s proposal to expand ‘Operation Green’ from 3 crops covered currently (onion, tomato and potato) to 22 perishable commodities is expected to improve supply chains, reduce excessive price oscillations and boost perishable agricultural exports. The extension of the agriculture infrastructure fund to Agricultural Produce Market Committees (APMCs) and integration of additional 1,000 APMC mandis with e-NAM5 on top of 1,000 mandis already onboarded could boost marketing efficiency, thereby benefiting farmers with better access and remunerative returns in the years to come. The increase in the cap of FDI in insurance should help to expand the market for start-ups to be able to bring more customised insurance options for farmers and rural markets. The headline manufacturing PMI expanded to 57.7 in January 2021 from 56.4 a month ago, led by new orders and output, supported by upturn in sales in consumer and capital goods sectors (Chart 22). Respondents to the 92nd round of the Reserve Bank’s industrial outlook survey (IOS) conducted in Q3:2020-21 exuded optimism, with the business expectations index emerging out of two consecutive quarters of contraction. Manufacturers see further strengthening of production, order books and employment in the months ahead, driven by the unlock and re-commencement of businesses. Their sentiments on availability of finance through banks and internal resources improved. Over the next three quarters, i.e., Q4:2020-21 and Q1 and Q2 of 2021-22, firms are upbeat on demand conditions and employment. 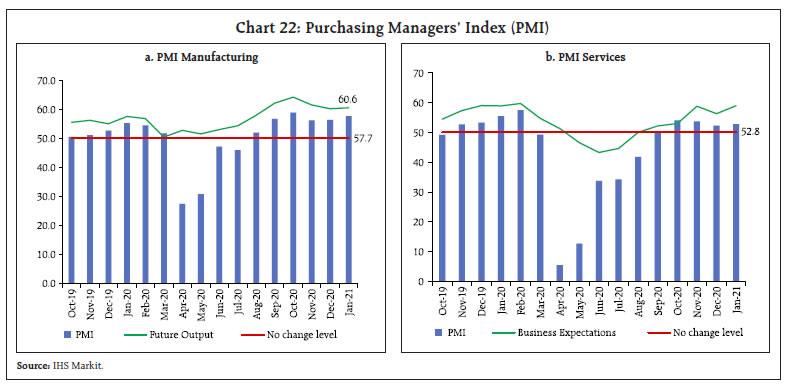 In the services sector, the recovery appears to be broad-based. PMI services expanded for the fourth consecutive month in January 2021 to 52.8 (from 52.3 a month ago), supported by new work and increased business activity. Price discounts, marketing strategies, and reopening of some outlets alongside pick up in overall demand spurred sales. In the light of the immunisation drive, business expectations improved to an eleven-month high at 59.0 in January 2021. The improvement was also reflected in the 27th round of the Reserve Bank’s services and infrastructure outlook survey (SIOS) conducted in Q3:2020-21: firms expect further advancement in turnover in Q4:2020-21. The rise in selling prices will likely offset the increase in input costs, thereby pushing up profit margins. Among specific categories of services, construction activity is gaining pace, as evident in rising steel consumption, which registered a growth of 5.8 per cent in January 2021. Data from the Ministry of Road Transport and Highways reveal daily road construction at 28.16 kilometres during 2020-21 (April-January 15), up from 26.11 kilometres a year ago. The length of award of national highways at 7,573 kilometres also doubled during the same period. During the week ending January 15, a record length of 534 kilometres of national highways was constructed. The pace of construction is expected to increase beyond the target of 11,000 kilometres by March 31, with the remaining months of the current financial year being conducive for construction activity. A comparison of national highways awarded and constructed lengths indicate that both awarded length as well as length constructed recorded an increase in spite of the nationwide lockdown in the initial months6 (Chart 23). 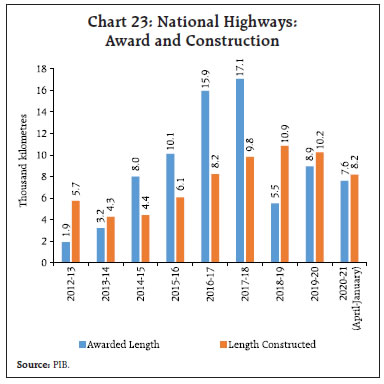 In the real estate sector, the latest release for the quarter ending December 20207 indicates that housing launches registered growth for the first time in eight quarters, boosting market sentiments to a three-year high8. The real estate sentiments index, which had plunged to an all-time low in Q2:2020, surged into optimism zone in Q4:2020, supported by a pick-up in demand for both residential units and office space. The near-term outlook reflects optimism across regions and stakeholders, with the western part of the country witnessing the sharpest jump in the future sentiment index. The Knight Frank-Ficci-Naredco Real Estate Sentiment Index survey released on January 27 indicated that the real estate sector is set to grow faster in the next six months and “sentiment” is much higher in east, south and west India than in north India (Chart 24). Measures such as reduced stamp duty in Maharashtra and Karnataka have also helped boost demand for housing. State wise monthly stamp and registration revenue receipts also corroborate a steady pick-up in the real estate sector (Chart 25).
Inflation Consumer price index (CPI) inflation continued to soften in January 2021, easing to 4.1 per cent from 4.6 per cent a month ago. Underlying this welcome development was a sharp retrenchment of food inflation – by 120 basis points (bps) from 3.9 per cent in December (Chart 26a). Deflation in prices of vegetables and sugar, alongside a decline in the rate of inflation of cereals, eggs, meat, fish, milk, pulses and spices, contributed to this substantial easing. Fuel inflation edged up, however, to 3.9 per cent from 2.9 per cent in December, primarily on account of a pick-up in LPG inflation. CPI excluding food and fuel at 5.5 per cent remained elevated, displaying persistence on account of price pressures in health, petrol, diesel, motor vehicles, transportation fares and recreation services. Double-digit inflation continued in prices of personal care due to gold, pan, tobacco and intoxicants, the latter reflecting indirect taxes post-lockdown. While inflation picked up in respect of clothing, it remained muted in respect of housing, household goods and services, and education. CPI excluding food and fuel (with a weight of 47.3 per cent) contributed 63 per cent of overall headline inflation (Chart 26b). 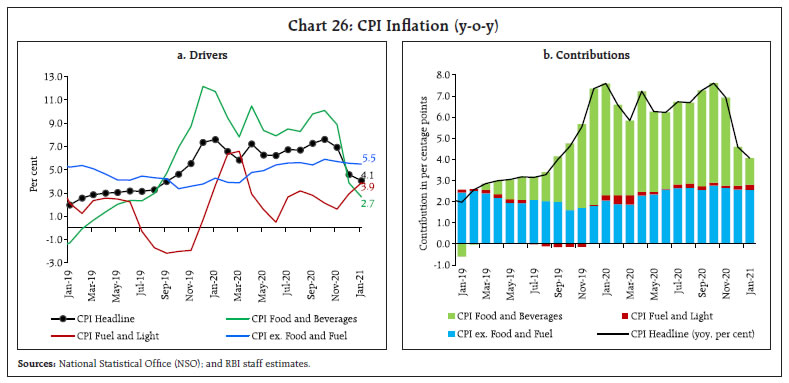 High frequency food price data from the Ministry of Consumer Affairs, Food and Public Distribution (Department of Consumer Affairs) for February so far (February 1-12) indicate month-on-month softening of price pressures in respect of cereals and vegetables. Pulses prices have also registered some softening across the board, although at still elevated levels. Among vegetables, potato and tomato prices remain in seasonal fall; however, onion prices have picked up on account of unseasonal rains. Edible oil prices edged up further in February (Chart 27). 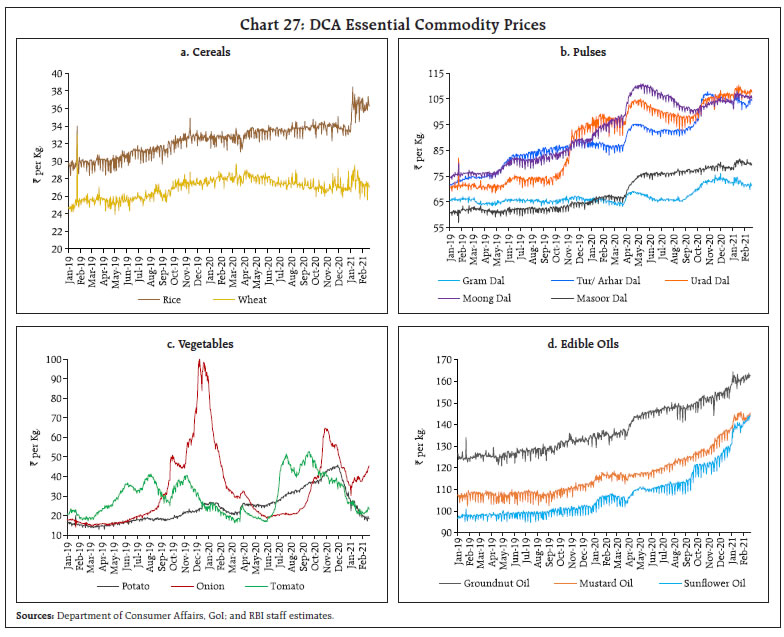 Indian basket crude oil prices firmed up, averaging US$ 59 per barrel in February so far (February 1-12) from US$ 55 per barrel in January. Mirroring the pick-up in global crude oil prices, pump prices for petrol and diesel increased by around ₹2 per litre in February so far from the January levels, to around ₹90 per litre and ₹81 per litre, respectively. This is a historic high for domestic pump prices – emanating mainly from hikes in indirect taxes. Domestic kerosene and LPG prices also registered an increase in February 2021 (Table 5). | Table 5: Petroleum Product Prices (Average of Four Major Metros) | | Item | Unit | Domestic Prices | Month-over-month (per cent) | | Feb-20 | Jan-21 | Feb-21^ | Jan-21 | Feb-21 | | Petrol | ₹/litre | 75.01 | 87.57 | 89.60 | 1.5 | 2.3 | | Diesel | ₹/litre | 67.35 | 78.97 | 81.11 | 1.8 | 2.7 | | Kerosene | ₹/litre | 29.51 | 25.83 | 27.36 | 11.3 | 5.9 | | LPG | ₹/cylinder | 866.25 | 704.63 | 729.63 | 0.0 | 3.5 | ^: For the period February 1 -12, 2021
Note: Average of prices charged by Indian Oil Corporation Limited (IOCL) in four major metros (Chennai, Delhi, Mumbai and Kolkata).
Sources: IOCL; Petroleum Planning and Analysis Cell (PPAC); and RBI staff estimates. | Crude oil prices dropped from around US$ 110 per barrel in mid-2014 to a low of about US$ 20 per barrel in April 2020 before correcting and firming up to US$ 55 per barrel in January 2021 (Chart 28a). During this period, international petrol prices in rupee terms (after accounting for exchange rate movements9 and shipping cost) also declined by around ₹19 per litre. Pump prices of petrol (represented by Delhi price), however, registered an increase from around ₹74 per litre in July 2014 to ₹86 per litre in early-February 2021, an increase of around ₹12 per litre, coming from sharp increases in central taxes on petrol by ₹23 per litre and State VAT (Delhi) by ₹8 per litre (Chart 28b). The share of excise and VAT in petrol pump prices (Delhi) saw an increase from around 30 per cent in July 2014 to 60 per cent in early- February 2021. As a result, over time, high levels of domestic petrol pump price have started to correspond to lower and lower levels of international crude oil prices. A petrol pump price of ₹80 per litre, which was consistent with a crude oil price of around US$ 110 per barrel in September 2013 has since then been consistent with US$ 73 per barrel during June-August 2018 and with US$ 41 per barrel in June 2020. The direct contribution of CPI petrol (with a weight of 2.2 per cent in CPI) to headline inflation jumped from 1.6 per cent in July 2014 to 4.8 per cent in January 2021. 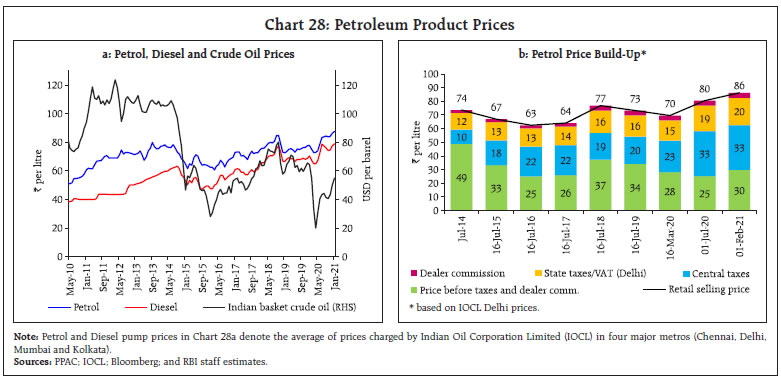 Going forward, with prospects for rabi harvest getting buoyant on top of a bumper kharif crop, cereal inflation could remain contained. Onion prices may also start ebbing with rabi crop arrivals setting in. However, price pressures seen in edible oil are contingent upon softening of international prices. Core inflation pressures are likely to persist as cost-push pressures have further intensified. With petrol and diesel prices at record levels and broad-based increases in the cost of industrial raw-materials and intermediates, the risk of firms passing on input price increases to final goods and services remain, especially as the economic recovery gathers further traction and activity normalises to pre-COVID levels. In a cross-country perspective, India had seen the least pass-through in the second half of the 2010s when crude oil prices had softened considerably. Due to additional taxes post lockdown, the wedge with international gasoline prices has increased and the pump prices paid by Indian consumer are among the highest in the world (Chart 29). IV. Financial Conditions System liquidity moved in a zone of large surplus with the daily net liquidity absorption under the LAF ranging around ₹5.95 lakh crore in January 2021 and ₹6.40 lakh crore in February 2021 (up to February 25). As part of the gradual normalisation of liquidity management operations, the Reserve Bank conducted another variable rate reverse repo auction for an amount of ₹2 lakh crore on January 29, 2021 following up on an identical operation conducted on January 15 to commence the normalisation. The second auction was well received, with bidding offers exceeding 1.5 times the notified amount of ₹2 lakh crore. Two more such auctions were conducted on February 12 and 26, 2021, which elicited a similar response. Since January 15, 2021 liquidity absorbed through the fixed rate reverse repo has steadily increased from a fortnightly average of ₹4.33 lakh crore during January 16-29, 2021 to ₹5.21 lakh crore during January 30-February 25 (Chart 30).  Adhering to its commitment to maintain ample liquidity in the system, the Reserve Bank conducted one open market operation (OMO) purchase auction on January 21, 2021 thereby injecting durable liquidity of ₹10,000 crore. It also conducted two special OMOs (Operation Twist) involving simultaneous purchase and sale of securities on January 7 and 14, 2021. In addition, the Reserve Bank undertook additional liquidity measures on February 5, 2021, which included (i) allowing lending by banks to non-banking financial companies (NBFCs) under the targeted long term repo operations (TLTRO) on Tap scheme for incremental lending to specified stressed sectors; (ii) gradual restoration of the cash reserve ratio (CRR) in two phases in a non-disruptive manner to 3.5 per cent effective from March 27, 2021 and 4.0 per cent effective from May 22, 2021; and (iii) extension of the facility for availing funds under the marginal standing facility (MSF) by dipping into the statutory liquidity ratio (SLR) up to 3.0 per cent of net demand and time liabilities (NDTL) until September 30, 2021. The Reserve Bank also conducted an OMO purchase auction for an enhanced amount of ₹20,000 crore on February 10, and a special OMO (Operation Twist) on February 25, 2021 to foster congenial financial conditions. Mirroring surplus liquidity, overnight money market rates, i.e., the weighted average call rate (WACR), the tri-party repo rate and the market repo rate continued to trail below the reverse repo rate, on an average, by 16 bps, 22 bps and 23 bps, respectively, in January and by 12 bps, 35 bps and 50 bps, respectively, in February (up to February 25, 2021). The rates on 3-month commercial paper (CP) issued by non-bank financial companies (NBFC), 3-month T-bills and 3-month certificates of deposit (CDs) inched above the reverse repo rate after a gap of two months in January 2021 (Chart 31). These rates, except CP (NBFC) rate, receded below the reverse repo rate in February 2021, reflecting surplus liquidity. 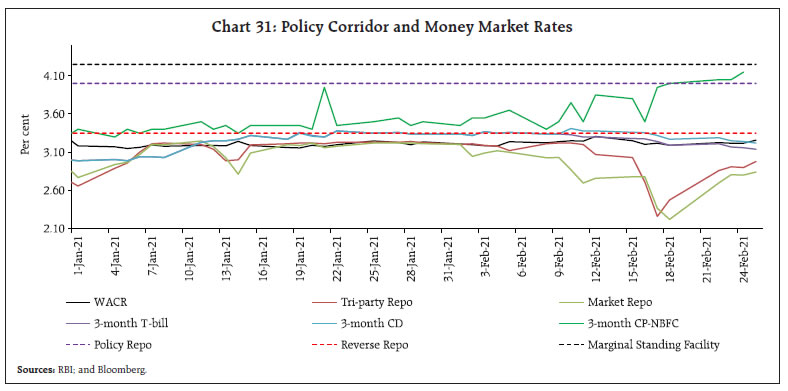 Corporate bond yields remained stable and spreads narrowed across the rating spectrum and issuer categories, reflecting waning risk premia and the congenial policy environment. The average spread of 3-year AAA rated corporate bonds over the G-sec yields of corresponding maturity issued by (i) public sector undertakings (PSUs), banks and financial institutions (FIs), (ii) corporates and (iii) NBFCs declined by 17 bps, 14 bps and 21 bps, respectively, in January. Even spreads on 3-year BBB- rated bonds - the lowest rated investment grade bonds - issued by these entities narrowed by 25 bps, 12 bps and 19 bps, respectively, reflecting reduced risk aversion and a system flush with liquidity (Table 6). | Table 6: Corporate Bond Yield and Spread | | Issuer | Yield | Spread | | Rating | Dec-20 | Jan-21 | Variation | Dec-20 | Jan-21 | Variation | | (Per cent) | (bps) | (bps) | | PSU, Banks and FIs | AAA | 4.89 | 4.96 | 7 | 43 | 26 | -17 | | AA | 5.56 | 5.62 | 6 | 114 | 92 | -22 | | BBB- | 8.76 | 8.75 | -1 | 430 | 405 | -25 | | Corporates | AAA | 4.76 | 4.85 | 9 | 30 | 16 | -14 | | AA | 5.62 | 5.74 | 12 | 116 | 105 | -11 | | BBB- | 9.57 | 9.69 | 12 | 512 | 500 | -12 | | NBFCs | AAA | 4.94 | 4.96 | 2 | 48 | 27 | -21 | | AA | 6.28 | 6.34 | 6 | 182 | 164 | -22 | | BBB- | 10.56 | 10.62 | 6 | 611 | 592 | -19 | Note: Yields and spreads are average of the month.
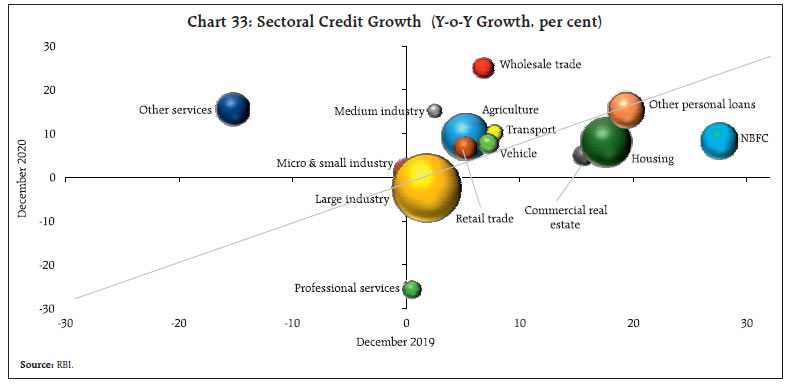
Source: FIMMDA. | Broader measures of liquidity also reflected the easing of monetary and credit conditions in the system. Reserve money (RM) adjusted for the first-round impact of changes in the cash reserve ratio (CRR) increased by 18.6 per cent on a y-o-y basis (February 19, 2021) (Chart 32), mainly driven by a growth of 20.3 per cent (11.9 per cent a year ago) in currency in circulation (CiC). With aggregate deposits growing at 11.1 per cent (February 12, 2021) alongside the high currency expansion, money supply (M3) expanded by 12.6 per cent on a y-o-y basis (9.5 per cent a year ago). Scheduled commercial banks’ (SCBs’) credit to the commercial sector recorded a growth of 6.6 per cent on February 12, 2021 (6.4 per cent a year ago). Within the gradual, yet steady recovery in overall credit growth, some bright spots are emerging. In December 2020, credit to agriculture, micro, small and medium industries, transport services, wholesale trade, retail trade and other services, and personal loans for purchase of vehicles, constituting 35 per cent of total credit, grew at a faster pace. Other personal loans10, the second largest component in the personal loan segment, grew at a robust pace of 15 per cent in December 2020. Bank credit to large industries remained in contraction, however; several of these borrowers, particularly those with high ratings, are raising funds through bonds, debentures and other market-based instruments to take advantage of the prevailing low interest rate regime and also to retire past high cost debt. Loans for professional services were also in contraction. Growth in bank credit to non-bank finance companies (NBFC) slumped to 8 per cent in December 2020 as against a robust growth of 28 per cent a year ago (Chart 33). The recent initiative to allow banks to lend to NBFCs under TLTRO on tap scheme is expected to boost credit to stressed sectors, going forward. 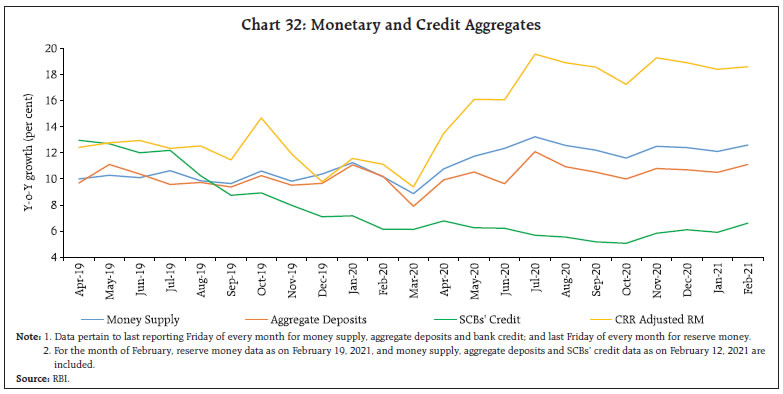
 In the credit market, the 1-year median marginal cost of funds based lending rate (MCLR) of SCBs declined by 91 bps (from March 2020 up to January 2021). The median term deposit rate also moderated by 146 bps. The reduction in the cost of funds augurs well for transmission to lending rates (Table 7). | Table 7: Transmission from the Repo Rate to Banks’ Deposit and Lending Rates | | (Basis points) | | Period | Repo Rate | Term Deposit rates | Lending rates | | Median Term Deposit Rate | WADTDR | 1 - Yr. Median MCLR | WALR - Outstanding Rupee Loans | WALR - Fresh Rupee Loans | | Feb 2019 - Sep 2019 | -110 | -9 | -7 | -30 | 2 | -40 | | Oct 2019 – Jan 2021* | -140 | -175 | -127 | -118 | -91 | -144 | | Mar 2020 - Jan 2021* | -115 | -146 | -88 | -91 | -73 | -113 | | Feb 2019 – Jan 2021* | -250 | -209 | -134 | -145 | -89 | -184 | *: Latest data on WALRs and WADTDR pertain to December 2020.
WALR: Weighted Average Lending Rate. WADTDR: Weighted Average Domestic Term Deposit Rate;
MCLR: Marginal Cost of Funds-based Lending Rate.
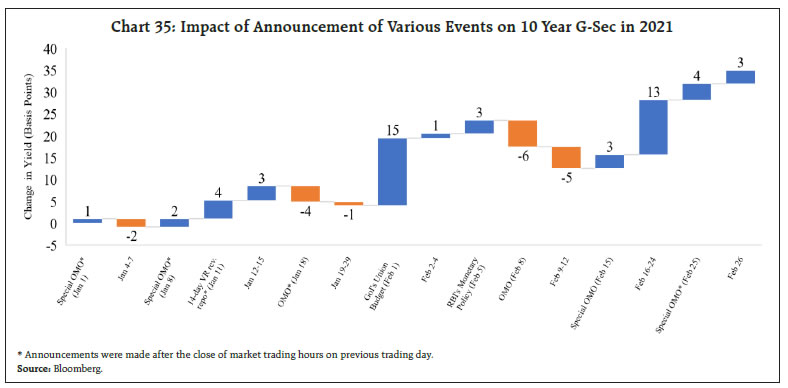
Source: RBI. | The yield on government securities (G-sec) continued to trade at decadal low levels aided by surplus liquidity and a host of measures taken by the Reserve Bank in the wake of COVID-19. The yield on the new 10-year G-sec benchmark (5.85 GS 2030) as well as the old 10-year G-sec benchmark (5.77 GS 2030), however, came under transitory pressure, closing at 5.91 per cent and 5.95 per cent, respectively, at end-January 2021. Bond market sentiment was weighed down by hardening US Treasury yields, the rise in crude oil prices during the month and the announcement of the centre’s gross market borrowing plan of ₹12 lakh crore for 2021-22 along with an additional borrowing of ₹80,000 crore for the remaining period of 2020-21 in the Union Budget. Yields softened subsequently, aided by (i) the announcement and conduct of OMO purchases by the Reserve Bank for an enhanced amount of ₹20,000 crore on February 10, 2021 with the bulk of purchases in the 10-year segment alone; (ii) extension of the dispensation of enhanced Held to Maturity (HTM) of 22 per cent of NDTL up to March 31, 2023; (iii) providing retail investors with online access to the government securities market – both primary and secondary – directly through the Reserve Bank (‘Retail Direct’), which could lower the cost of borrowing of the government through widening of investor base and tapping of household savings; and (iv) explicit forward guidance on the provision of ample liquidity to foster congenial financing conditions. Enthused by these measures, the new and the old 10-year benchmark yields softened by 17 bps and 13 bps, respectively, as on February 11, 2021, from the post Union Budget spike (Chart 34 and 35). Subsequently, these benchmark yields, however, firmed up to 6.23 per cent and 6.32 per cent, respectively, at end-February 2021 mainly driven by global factors such as hardening US yields and rising crude oil prices. As mentioned earlier in this article, the RBI conducted a special OMO (operation twist) of ₹10,000 crore on February, 25 which received a strong response with the bid-cover ratio of 4.9 on the purchase side and 3.3 on the sale side of the operation. In continuation of its measures, another such operation is scheduled for March 4, 2021 for an enhanced amount of ₹15,000 crore. 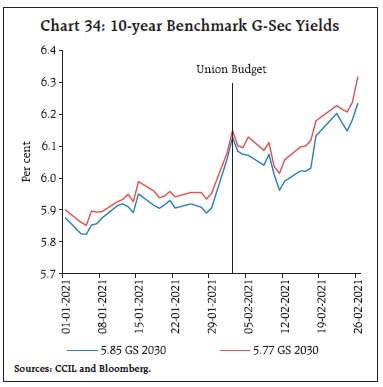
 The Indian equity market scaled fresh highs in January 2021, with the BSE Sensex briefly crossing the historical 50,000 mark in intra-day trade (on January 21, 2021), before paring all the gains and registering losses towards the end of the month. Initially, the equity market soared on good news - expansion in manufacturing PMI for December 2020; Government’s approval for two vaccines and their subsequent roll-out in the country; and optimism over corporate earnings results for Q3:2020-21. The momentum was reversed as markets turned volatile towards the close of the month on weak global cues triggered by the fallout of speculative trading by retailers in the US and sell-offs by foreign portfolio investors (FPIs). Nevertheless, it is noteworthy that India’s benchmark stock index registered its sharpest post Union Budget rally ever (in absolute terms) as the Finance Minister announced a slew of measures to invigorate the economic revival and encourage spending across sectors without any major change in taxes. The Sensex gained by 2,315 points (5 per cent) to close at 48,601 on February 1, 2021 (Chart 36). Investor sentiment was boosted by a number of schemes introduced in healthcare, infrastructure and the agriculture sector, including formation of an asset reconstruction company for management of non-performing assets (NPAs), strategic disinvestment of PSUs, privatisation of two public sector banks and one general insurance company, and increase in the foreign direct investment (FDI) limit to 74 per cent in the insurance sector. A sharp increase in capital expenditure also buoyed overall sentiment. The market capitalisation of BSE-listed companies crossed the historic ₹200 lakh crore mark for the first time in February 2021, reflecting accretion of significant wealth for investors, driven by continuous rallies. The country’s market capitalisation to GDP ratio is more than 100 per cent. In fact, since January 2021, India’s equity markets gained the most, next only to Hong Kong among the world’s top 10 markets. India’s stock market has now become the eighth largest in the world, in terms of market value. Earnings results declared by Indian listed corporates for Q3:2020-21 provide further evidence of a strong rebound in economic activity. For the 3,014 non-financial listed companies declaring results, net sales growth remained in contraction in Q311 although at a moderate pace relative to the preceding three quarters. Nevertheless, the fall in raw material costs and cost savings on account of lower interest expenses caused expenditures to fall faster than sales and operating profits rose (Chart 37).
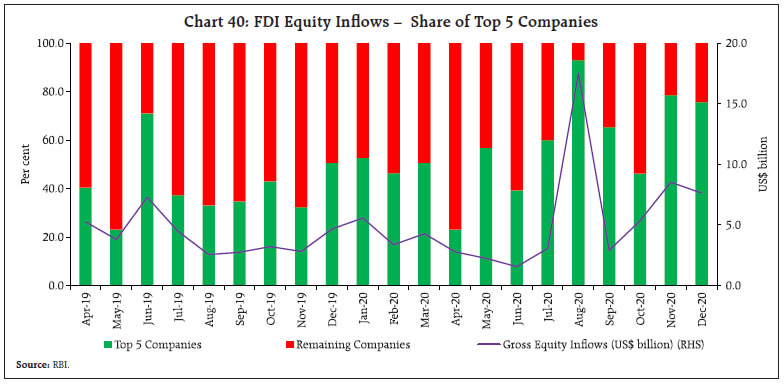
A disaggregated analysis of the non-financial sector indicates that the economically sensitive sectors such as auto, steel and cement registered an impressive performance during Q3:2020-21, as stated earlier (Table 8). Furthermore, the information technology (IT) sector companies have accelerated their sales growth, recording the strongest quarterly performance during Q3:2020-21 in past several years. 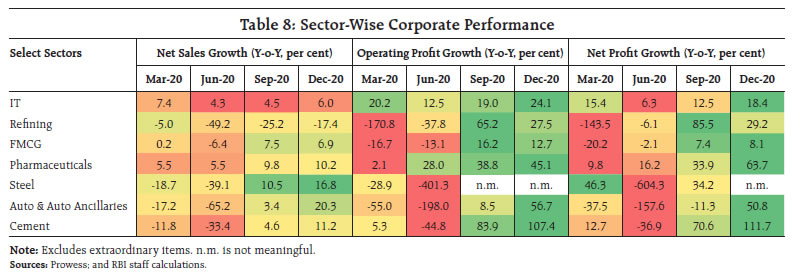 Similarly, earnings results of 853 listed banking and financial sector companies in India indicate a robust performance during Q3:2020-21 (Chart 38). Net sales, which primarily include interest income, registered a healthy increase while other income, which included flows like profit/ loss from sale of assets and investments, picked up as capital markets remained buoyant during the quarter. Total expenditure growth increased on account of rise in employee costs, leading to a moderate rise in operating profits. Furthermore, a sharp fall in provisioning on loans and advances due to favourable base effects on account of huge provisioning by private banks in Q3:2019-20 resulted in a sharp increase in net profits. 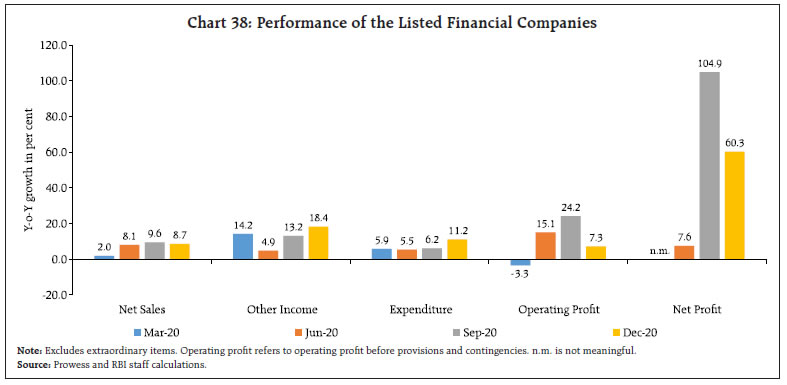 India remained the bright spot in an otherwise shadowy year for foreign direct investment (FDI), as global inflows plunged by 42 per cent y-o-y in 2020 (US$ 859 billion), the lowest level since the 1990s, according to UNCTAD’s ‘Investment Trends Monitor’ released on January 24. India clocked a 13 per cent (US$ 57 billion) y-o-y rise, the highest growth among nations, boosted by flows into the digital sector. Net FDI flows remained strong in December 2020, following a surge through August-November 2020. Consequently, net FDI increased to US$ 40.5 billion in April-December 2020 from US$ 31.1 billion a year ago (Chart 39). A surge in FDI equity inflows in August-December 2020 was largely driven by a few mega deals in digital services (Chart 40). FPIs continued as steady net buyers in the domestic capital market in January 2021, though on a modest scale compared to a month ago. Although better-than-expected earnings, signs of economic revival, declining COVID infections and the ongoing vaccination drive continued to enthuse FPIs, they reduced their exposure mainly due to pre-budget profit booking. While net FPI inflows of US$ 1.2 billion were largely driven by equity purchases of US$ 2.0 billion, they remained net sellers in the debt segment (Chart 41). While pre-budget volatility in FPI flows was observed in January 2021, pro-reform budget with greater focus on capital expenditure and privatisation of PSUs boosted FPI inflows in February 2021. Cumulatively, FPIs net investment in equities hit US$ 36.1 billion so far in 2020-21, the highest ever since 2012-13. 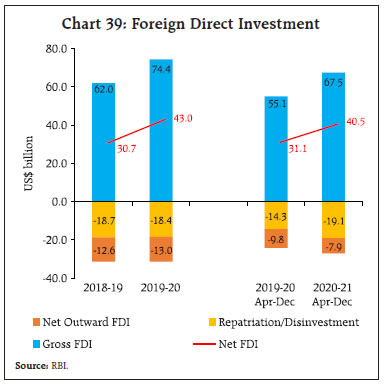
 The recent Union Budget’s proposal to allow debt financing by FPIs in real estate investment trusts (REITs) and infrastructure investment trusts (InvITs) would open up alternate sources of funds for these entities, besides bringing down the cost of funds, and providing foreign investors a relatively secure debt investment option in India. With the Union Government indicating a big push to capex, foreign investors have evinced greater interest in green bond offerings from India for financing roads, ports and other infrastructure projects in the country than before. Foreign exchange reserves touched an all-time high of US$ 590.2 billion on January 29, 2021 and were at US$ 583.9 billion on February 19, 2021 (Chart 42).
In the foreign exchange market, the Indian rupee (INR) continued to strengthen and was 0.5 per cent higher against the US dollar in February 2021 over its level a month ago, riding high on the back of robust foreign investments, weakening of the US dollar and the vaccination roll out. As at end-February 2021, the INR appreciated by 3.2 per cent over its level at end-March 2020, and reached ₹73.04 against the US dollar, a level last seen in the beginning of September 2020. In terms of the 40-currency real effective exchange rate index, the INR appreciated by 2.5 per cent in February 2021 over its level in March 2020 (Chart 43). Payment System India’s digital ecosystem demonstrated its commitment to serve as a catalyst in the economic revival. Accordingly, it sustained growth momentum in both wholesale and retail segments in January 2021 on top of a spectacular performance in the preceding month. Market estimates predict that by 2025, digital payments in India could grow three-fold to over ₹7,000 trillion on account of the policies for ushering in financial inclusion and the rapid digitisation of merchants12. Coursing through January 2021, wholesale transactions via the Real Time Gross Settlement (RTGS) system continued to post double digit growth of 14.1 per cent (y-o-y) in volume, over and above 20.2 per cent in the month gone by (Table 9). In the retail segment, the volume and value of transactions through the National Electronic Funds Transfer (NEFT) increased by 10.3 per cent and 12.3 per cent, respectively, on top of the high growth recorded in the preceding two months. Estimates for February indicate acceleration in growth for both RTGS and NEFT. Transactions through the Immediate Payment Service (IMPS) recorded growth in volume and value at 33.5 per cent and 33.1 per cent, respectively, on top of 38.7 and 38.6 per cent growth registered in the previous month. Unified Payments Interface (UPI) transaction volume accelerated to 76.5 per cent - a jump of 6 percentage points over December 2020, while value growth was steady at an impressive 99.4 per cent. Recent transaction volume caps enforced on Third Party App Providers (TPAPs) on the UPI by the National Payments Corporation of India (NPCI) are likely to promote competition in this space, further bolstering innovation, accessibility and customer convenience. | Table 9: Transaction Values in 2020-21 | | (in ₹ crore) | | | RTGS | NEFT | UPI | IMPS | | Apr-20 | 64,43,653 | 13,06,406 | 1,51,141 | 1,21,141 | | May-20 | 70,41,869 | 14,81,750 | 2,18,392 | 1,69,402 | | Jun-20 | 86,51,978 | 19,06,586 | 2,61,835 | 2,06,951 | | Jul-20 | 83,35,279 | 19,63,113 | 2,90,538 | 2,25,775 | | Aug-20 | 72,92,380 | 19,30,552 | 2,98,308 | 2,35,137 | | Sep-20 | 94,89,066 | 21,65,515 | 3,29,032 | 2,48,662 | | Oct-20 | 84,96,046 | 22,35,389 | 3,86,107 | 2,74,645 | | Nov-20 | 79,87,655 | 22,18,252 | 3,90,999 | 2,76,459 | | Dec-20 | 1,06,59,120 | 25,58,304 | 4,16,176 | 2,92,325 | | Jan-21 | 91,70,162 | 21,65,869 | 4,31,182 | 2,88,538 | | Source: RBI. | There was an uptick in bill payments through the Bharat Bill Payment System (BBPS), with a growth of 84 per cent in volume (86.2 per cent last month) and 106 per cent in value (97.9 per cent last month). BBPS activity has been buoyed by increasing consumer affinity for digital modes and the swift response of billers by on-boarding on to the system. Reflecting vehicular movement in tandem with the economic revival, the growth of National Electronic Toll Collection (NETC) displayed sequential improvement at 60.4 per cent in volume and 48.1 per cent in value on top of 115.2 per cent and 83.3 per cent, respectively, in the previous month. The turnover in Aadhaar Enabled Payments System (AePS) and National Automated Clearing House (NACH) reveal a boost in demand from the countryside, owing to the disbursal of funds under the PM Kisan Samman Nidhi. It is worthwhile to note that NACH growth accelerated in the months of April, August and December in 2020 on account of the disbursal of funds to beneficiary farmers’ accounts in the form of triennial instalments under the scheme. Mirroring these credits, upticks were witnessed in cash withdrawals through the AePS in these months or the months immediately thereafter; 89.1 per cent in volume and 92.3 per cent in value in January 2021. Rural India could turn out to be the inflection point of digital payments in the near future, with the penetration of payment alternatives like Quick Response (QR) codes, AePS and offline payments, for which the Reserve Bank is striving to provide an enabling policy environment aimed at promoting digital inclusion. The month of January 2021 was also packed with significant actions on the regulatory front. Taking cognisance of unfair lending practices being adopted by certain unauthorised digital lending platforms and mobile apps, the Reserve Bank has constituted a Working Group to study all aspects of digital lending activities among regulated as well as unregulated financial entities to ensure establishment of an appropriate regulatory approach that strikes a balance between financial innovation and consumer protection. In February, the Reserve Bank has issued a “Master Direction on Digital Payment Security Controls” laying down minimum standards for banks and card-issuing entities to ensure safety of digital transactions. As an additional safety measure, the Positive Pay System for cheques has commenced from January 1, 2021, to enhance the safety of cheque-based transactions. Working towards achieving the vision of Digital India, the Reserve Bank has operationalised its Payment Infrastructure Development Fund, effective from January 1, 2021, which is aimed at scaling up digital payments infrastructure in Tier III to VI centres. To ensure speedy grievance redressal, the Reserve Bank will set up a 24X7 digital payment helpline and roll out a “One Nation, One Ombudsman” scheme to integrate the current three ombudsman facilities into one. The major news from the innovation space is the commencement of the test phase of the first cohort of the Regulatory Sandbox with the theme ‘Retail Payments’ and announcement of the second cohort with the theme ‘cross-border payments’. In response to increasing popularity of contactless payments during the pandemic, the Reserve Bank has enhanced the limits for contactless card transactions and e-mandates for recurring transactions through cards (and UPI) from ₹2,000 to ₹5,000 from January 1, 2021. Conclusion The outlook for the global economy is suddenly besieged by surges in new, speedily communicable strains of the virus against which vaccine makers must rapidly adapt. It is in this context that a well-coordinated and swift strategy for deployment of vaccines globally assumes urgency. India, like a few other countries, has rolled out a rapid deployment programme that already involves more than 20 countries in the form of grants and commercial supplies, and more supplies and more vaccines are in the pipeline in spite of a recent surge in infections in a few states and the isolation of an Indian mutation. Considerable uncertainty surrounds the outlook although on balance, the gathering strength of the recovery and its broadening ambit hold out optimism and the will to survive and revive. The second advance estimates of national income released on February 26 by the National Statistical Office confirmed the conviction of this article – real GDP in Q3 shrugged off the contraction of H1 and reclaimed positive territory. The second advance estimates of the Ministry of Agriculture placed 2020-21 foodgrains production at 303 million tonnes, the highest ever, spread across all principal crops and in both rabi and kharif seasons. With this emergence from recession as businesses reopen and consumers venture back to offices and shops, the Indian economy has turned a corner. These developments are all inflation positive. With pulses production 6 per cent higher than a year ago, inflationary pressures on the food front are set to ebb, but core inflation will warrant deft and dogged attention. While disproportionately high excise duties on petroleum products are hostage to the state of public finances, buoyancy in other heads of revenue could loosen this stranglehold, bring down pump prices of petrol, diesel and of cooking gas to more internationally comparable levels, improve the inflation outlook and expand consumer welfare. From an internationally competitive perspective too, it is important for India to recover from being an inflation outlier and turn to structural reforms that reposition the economy to reap the gains of productivity and efficiency. The evolution of financial conditions as 2020-21 draws to a close and the new financial year commences will pose a challenge. Fiscal policy authorities face the ‘rock’ of stimulating the economy and the ‘hard place’ of ensuring sustainable finances. Monetary authorities encounter a similar dilemma of conflicting pulls – ensuring an orderly evolution of the interest rate structure in the face of still enlarged borrowing needs against the need to remain accommodative and support the recovery. While policy authorities exhibit resoluteness in their commitment, markets are assailed by uncertainty and sporadic shifts between hunts for returns and flights to safety. A shared understanding and common expectations will likely be the anchor in this turbulence. Markets have to rely on the track record of authorities during the most trying year in a century – of keeping markets and institutions functioning; of easing borrowing costs and spreads; of keeping finance flowing – in fact, there is very little else to hang a hat on. An orderly evolution of the yield curve serves all. A vibrant and self-sustaining economy will lift all boats and markets can do no better than supporting policy authorities as they struggle to regain that stride. There is little doubt today that a recovery based on a revival of consumption is underway. The jury leans towards such recoveries being shallow and short-lived. The key is to whet the appetite for investment, to rekindle the animal spirits - a spontaneous urge to action rather than inaction, and not as the outcome of a weighted average of quantitative benefits multiplied by quantitative probabilities13. All engines of aggregate demand are starting to fire; only private investment is missing in action. The time is apposite for private investment to come alive. Fiscal policy, with the largest capex budget ever and emphasis on doing business better, has offered to crowd it in. Will Indian industry and entrepreneurship pick up the gauntlet?
|