Using daily data on retail and wholesale prices of 22 food items, this article assesses the impact of COVID-19 on food price mark-ups in India. The results show that mark-ups increased on average during the first nation-wide lockdown period of March-May 2020 and persisted even during the subsequent unlocking phase, driven predominantly by market centres which faced high intensity lockdowns as measured by the mobility indices. During the second wave of COVID-19, however, reflecting less stringent and localised nature of lockdowns as well as better supply chain management, the extent of increase in mark-ups was relatively modest. Introduction The behaviour of food price mark-ups exhibited dramatic shifts following the outbreak of COVID-19 and the associated lockdown measures to contain its spread. Though the movement of essential commodities, including food, was permitted during even the first phase of the lockdown, it has been observed that India’s food markets and supply chains were adversely affected during this period – arrivals in mandis dropped (Mahajan and Tomar, 2020); agri-markets were closed1; and daily movement of trucks collapsed to 10 per cent of normal levels2. Google’s mobility index, which captures movement trends by region and by different categories of places, fell by 87 per cent for the retail and recreation category on April 18, 2020 during the first wave and again by 70 per cent on May 16, 2021 during the second wave3. Several factors can operate through many channels in such conditions to alter price mark-ups. First, a lockdown can affect the transportation of food products (Mahajan and Tomar, 2020) leading to high transaction costs as 92 per cent of all food consumed in India is purchased (Reardon et al., 2020). Second, prices of certain agricultural products may increase because of labour shortages resulting from a decline in the number of migrant workers (Ebrahimy, Igan and Peria, 2020). Third, the uncertainty about the duration and intensity of the lockdown may also prompt consumers to resort to panic buying and hoarding of essential food items, leading to temporary increases in demand during the lockdown period (Ebrahimy, Igan and Peria, 2020; Sukhwani, Deshkar and Shaw, 2020). Further, amidst disruptions in supply, such increases in demand may enable retailers to charge higher margins (or mark-ups)4 on the food items sold to consumers. This article intends to evaluate the above-mentioned channel – a surge in mark-ups on food items induced by the lockdown and the consequent surprises in food inflation as measured by the consumer price index (CPI) in India. With food constituting almost half of the CPI basket, the extent and persistence of these retail price margins have significant implications not only for the food inflation trajectory but also for the headline inflation path, which underscores the need to understand the role of the lockdown and mobility on retail margins across centres and commodities. A number of studies analysing the lockdown impact on food prices in the Indian context have focused mainly on the availability and prices of food commodities. Arrivals of food items in wholesale markets dropped by 62 per cent in the three weeks following the nationwide lockdown in March-April 2020 whereas wholesale prices rose by 8 per cent and this correlation has more to do with state-level lockdown policy variation than local responses of those in the food supply chain (Lowe, Nadhanael and Roth, 2020). The impact of the lockdown differed across non-perishable (wheat) and perishable (tomato and onion) commodities and the extent of adverse shocks are mitigated by the adoption of a greater number of agricultural market reform measures (Varshney, Roy and Meenakshi, 2020). The fall in product availability and quantity of arrivals is larger for items that are cultivated or manufactured farther from the retail centers indicating that long-distance food supply chains have been hit the hardest during the pandemic (Mahajan and Tomar, 2020). Using the daily prices data released by the Department of Consumer Affairs (DCA), Narayanan and Saha (2020) point out that average retail price increases were to the tune of over 6 per cent for several pulses, over 3.5 per cent for most edible oils, 15 per cent for potato and 28 per cent for tomato in the 28 days post-lockdown (March 24-April 21, 2020) compared to the month preceding the lockdown. The paper also constructed aggregate wholesale and retail food price indices and found that the gap between these two increased during the lockdown period which was attributed to higher transcation costs faced by traders primarily due to transport restrictions. Against this backdrop, this article attempts to link lockdown induced changes in mobility, captured by Google mobility index and retail margins to understand food price dynamics. The daily prices data of 22 essential food items for 135 centres across the country (as per information available for May 2021), collected and monitored by the DCA, Ministry of Consumer Affairs, Food and Public Distribution, Government of India (GoI), is used for the empirical analysis. The novelty of this dataset comes from the fact that it reports both retail and wholesale prices across centres, enabling computation of actual retail margins (i.e., the difference between retail and wholesale prices) for each commodity at any given centre. Since margin here is defined for a given commodity-centre pair, it captures the pure mark-up effect, broadly removing the impact of transportation costs due to supply disruptions during the lockdown. The centres from the DCA price data are matched with that of Google mobility indices through extensive manual mapping to gauge the impact of mobility, and therefore the lockdown, on the behaviour of price margins. Google mobility indices report movement trends over time by geography from a baseline and are available at the country, state and city levels5. Using the matched data between centre-wise prices with google mobility indices, this article finds that mark-ups increased on average during the first nationwide lockdown period (March 25 – May 31, 2020) and this increase persisted even in the unlock phase (June-November 2020). Moreover, the increase in mark-ups was predominantly driven by market centres which faced high intensity lockdown (or lower mobility) and that the impact differed considerably across commodities, with pulses, edible oils and potato showing higher mark-ups. However, during the second wave, the impact of lockdown/restrictions on margins was not statistically significant at the aggregate level, even though commodity level differences persisted, suggesting less stringent and localised nature of lockdown (lower fall in google mobility index) as well as better supply chain management of essential food items by the central and state governments as reflected in mandi arrivals, especially of vegetables, and highway toll collections compared to the first lockdown. The rest of the article is organised as follows. Section II presents some stylised facts. Section III discusses the empirical strategy and results. Section IV provides the concluding observations. II. Food Price Inflation in India during COVID-19 Lockdown 1. CPI-WPI Food Inflation Trend Food price inflation witnessed unusual movements during the lockdown period of March-May 2020. CPI food inflation which was softening since December 2019 spiked in April 2020, coinciding with the nationwide lockdown (Chart 1a). Notwithstanding some moderation in May 2020, it remained elevated till November 2020. With the onset of usual winter easing, food inflation started to ease from December 2020. In contrast, food inflation measured by the wholesale price index (WPI) did not show such sharp increases, leading to a widening of the gap between the CPI-WPI food inflation in April 2020, which remained elevated compared to its historical average level even during the unlocking phase (Chart 1b). However, the gap became negative in March-May 2021 as unfavourable base effects (barring in April) pulled up WPI total food inflation. While the gap may reflect the impact of time varying margins, it is not straightforward to extract margins from price indices due to differences in the composition of the food baskets in CPI and WPI, the weights attached to individual items in the two baskets, and the coverage of markets for the price collection, all of which could influence the construction of the aggregate price indices and the corresponding measured inflation. In this regard, the centre-wise daily commodity prices data collected by the DCA at the retail and wholesale level can be used to gauge price margins (i.e., difference between retail and wholesale prices). The food price margins so defined for a given commodity-centre pair, averaged across commodities and centres, show a clear pick-up in April and May 2020, over the previous months and corresponding months of the previous years, indicating the role of the nationwide lockdown in raising mark-ups (Chart 2). Although the margins at the aggregate level moderated slightly in June 2020, they remained elevated throughout 20206.
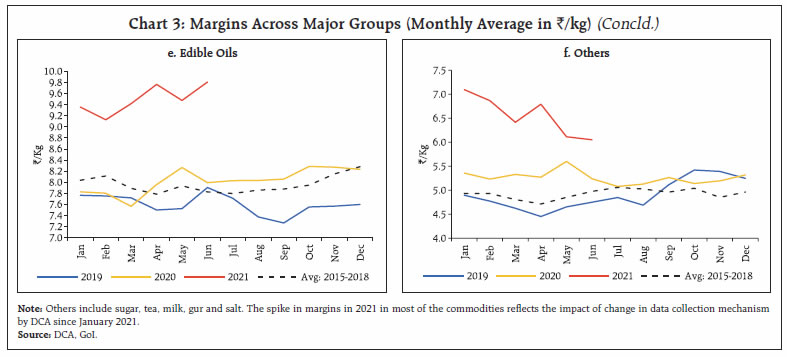
At the sub-group level, the behaviour of margins has been rather heterogeneous. Spikes in margins can be observed in pulses, edible oils and ‘other food’ during April-May 2020 while cereals and vegetables showed a marginal increase in April 2020 before reversing in May 2020 (Chart 3). In 2021, however, margins at the aggregate level and at sub-group levels (except vegetables) showed a sharp pick-up compared to 2020. This trend was observed from January 2021, i.e., before the imposition of localised lockdown/restrictions by the states. This essentially reflected a shift in data collection mechanism by the DCA to a Mobile App on January 1, 2021 to improve the quality of price data reporting from the price reporting centres7. The App is geo-tagged and has inbuilt features to calculate and report the average price, which reduces human errors in calculation and improves the data collection process. The coverage also has been increased from 122 centres in 2020 to 135 centres in 2021 (till May 2021). Thus, the unusual jump in the level of margins as per DCA data during 2021 was largely an outcome of improved data collection process and coverage of markets. Nonetheless, in May 2021 – the peak month of lockdown in the second wave – margins eased in cereals, pulses, edible oils and others, while it increased in vegetables. 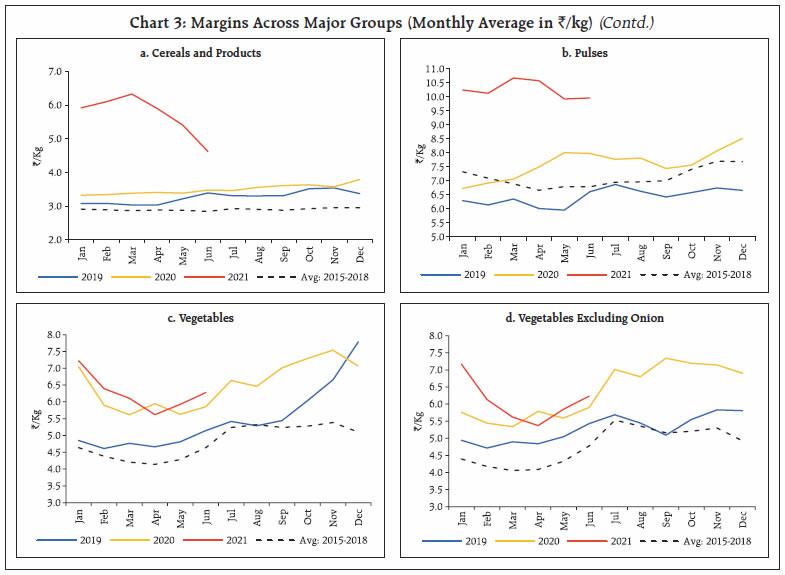
 2. COVID-19 Related Measures and Mobility Indices in India In order to maintain uninterrupted supply of essential goods, specified shops – including ration shops, those dealing with food, groceries, fruits and vegetables, dairy and milk products, meat and fish, animal fodder, seeds and pesticides – were exempted from the nationwide lockdown measures, while mandating them to comply with the standard operating procedures. The lockdown that restricted movement of people, however, turned out to be amongst the most stringent in the world (Chart 4). India’s stringency index reached the maximum value of 100 with the imposition of the nation-wide lockdown beginning March 25, 2020 and stayed at that level till April 19, 20208. The lockdown was extended in three more phases: April 15-May 3 (Phase 2); May 4-May 17 (Phase 3); and May 18-May 31 (Phase 4). This was followed by a gradual unlocking process beginning June 1, 2020. The stringency index started to increase again from April 2021, as States imposed weekend curfews, night curfews, and partial and localised lockdowns to contain the second wave of infections, but the peak reached in May 2021 at 82 was still lower compared to the first wave. Thus, even if the second wave was more severe in terms of number of infected cases and deaths, there was no nation-wide lockdown and the stringency was less severe compared to the first wave. 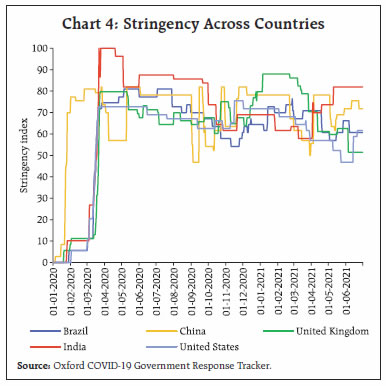 The stringency9 of lockdown resulted in lower mobility across various segments of the economy, with retail and recreation sector hit the hardest during the first lockdown (Chart 5a). Moreover, a clear negative relationship can be observed between mobility and price margins (Chart 5b). These stylised facts motivate our empirical specification and strategy, which is discussed in Section III. Moreover, apart from the localised and less stringent nature of the lockdown, the second wave appears to have been better managed in terms of facilitating movement of essential goods and services in the country. This is reflected in lower fall in toll collections10 – in terms of the decline between immediate pre-lockdown peak and subsequent trough – during the lockdown period of the second wave compared to the first wave (Chart 6a). Concurrently, mandi arrivals also witnessed a lower fall in April 2021 relative to April 2020 for most commodities and in May 2021 for vegetables (Chart 6b). In contrast, arrivals of pulses and oil seeds (key inputs for edible oils) declined sharply in both phases reflecting tight domestic supply conditions.
III. Empirical Analysis 1. Data As mentioned earlier, this article analyses the daily retail and wholesale prices data for 22 essential food items across 135 market centres11 for understanding the behaviour of mark-ups or margins. A further matching of these centres with the Google mobility data12 results in a trimming of the final dataset to 80 centres13. A centre is defined to be less affected by the lockdown (low intensity lockdown centre) during the first wave if its average google mobility index was higher than the median average index in each phase of the lockdown. Similarly, a centre is classified as highly affected if its average google mobility index was less than the median average index even in one of the phases. For the second wave, the classification is based on the distribution of average mobility in April-May 2021 – a centre is classified as less (highly) affected if its average google mobility index was higher (lower) than the median average index. 2. Identification Strategy A two-step approach is followed to estimate the impact of the first lockdown on price margins of essential food items. In the first step, an event study, on daily data for the period January-June 2020 covering all the 122 centres (for which data were available in 2020), is undertaken in the following form to examine the immediate impact of the lockdown, similar to the approach adopted in Mahajan and Tomar (2020):
The first approach as discussed above (specification 1), however, does not take into account the seasonal movement in food prices, which is significant in case of India due to large dependence of agriculture on monsoon. In order to account for such seasonal pattern, therefore, a difference-in-difference specification (Lowe, Nadhanael and Roth, 2020; Varshney, Roy and Meenakshi, 2020) of the following form is used in the second step where margins in 2020 is compared also with that of the corresponding period of 2019: 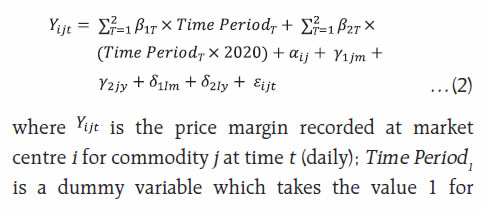
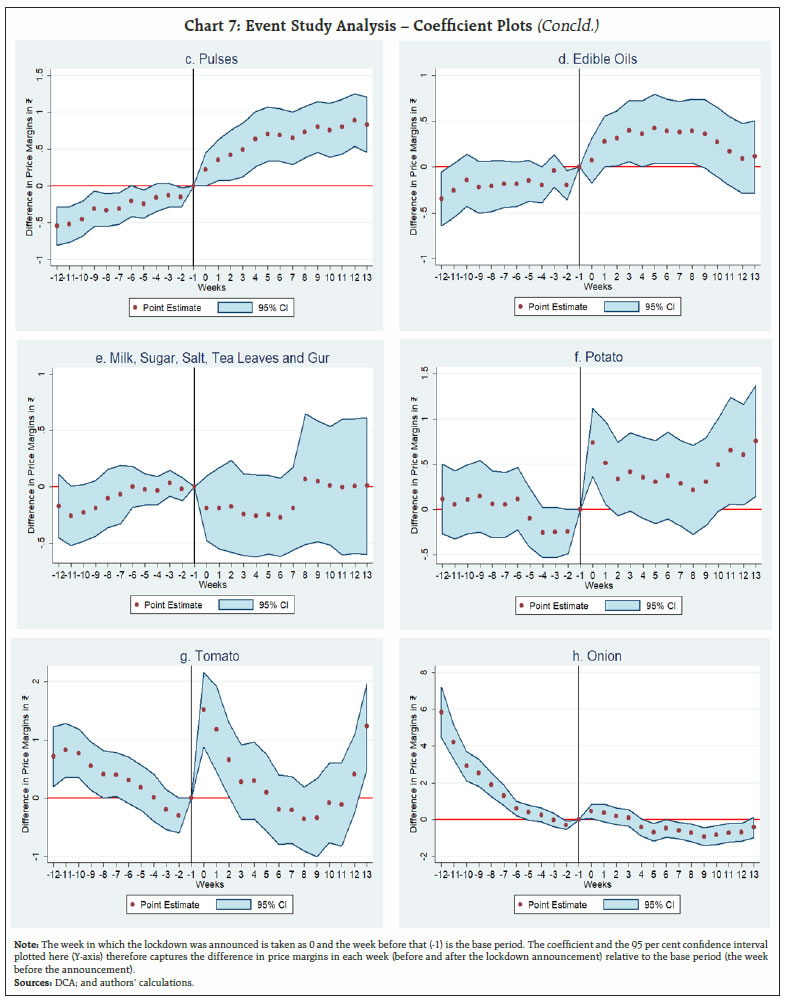
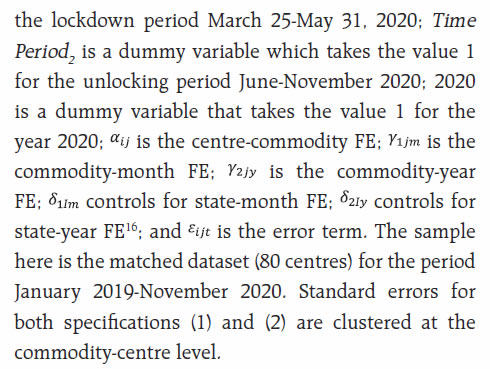 The coefficient of interest is β21. It estimates the difference in price margins between Time Period1 (March 25-May 31) and the reference period (January 1-March 24) for the year 2020 relative to the year 2019. It is assumed that if the event – COVID-19 induced lockdown – had not happened, the price margins in 2020 would have followed the same trend of 2019, ceteris paribus. Similarly, the coefficient β22 evaluates whether the impact of the lockdown persisted even when the unlocking process started in June 202017. The state-by-month (year) and commodity-by-month (year) fixed effects control for time varying state-level or commodity-level shocks (observed or unobserved) non-parametrically. This facilitates within-state or within-commodity comparison of price margins between 2020 and 2019. A similar strategy is employed to evaluate the impact of the lockdown during the second wave using a matched dataset for the period January 2021-May 2021 in which price margins of 2021 are compared with 2019 (January-May 2019). However, as mentioned earlier, there was no nation-wide lockdown during this period; states implemented lockdown-like measures depending on the local spread of the virus and test positivity rates in a staggered fashion18. Therefore, the treatment period differs across states in this specification, starting on April 5, 2021 for Maharashtra, April 19, 2021 for Delhi and so on19.  where 2021 is a dummy variable that takes the value 1 if the year is 2021 and Time Periodit is a dummy variable that takes the value 1 for the relevant time period of lockdown depending on the state to which a centre belongs. The coefficient of interest is β4 which measures the difference in price margins between Time Periodit and the reference period for the year 2021 relative to the year 2019. Equations (2) and (3) are run for sub-samples of the 80 matched centres based on lockdown intensity (high or low intensity) and commodity groups. 3. Results 3.1: Lockdown impact during the first wave The estimates of specification 1 for the entire sample (all 22 commodities) and sub-samples of various groups along with their 95 per cent confidence intervals show that price margins increased on average immediately after the announcement of the first lockdown (Chart 7a). However, this increase was not uniform; it was primarily driven by pulses, edible oils, potato and tomato (Charts 7b-7h)20. The findings of the event study analysis are confirmed by the estimates based on the specification (1). Price margins increased on average by ₹0.44 for all the 22 commodities during March 25-May 31, 2020 compared to the base line in 2020 relative to the same period of 2019. This represents a 7 per cent increase over the baseline average (January-March 24, 2020) of ₹6.26, which persisted in the unlock period (June-November) as well. Moreover, such an increase in margins is predominantly driven by high intensity lockdown centres where it increased by 9.2 per cent compared to the baseline average (Table 1). In contrast, there was no significant change in margins in low intensity centres. 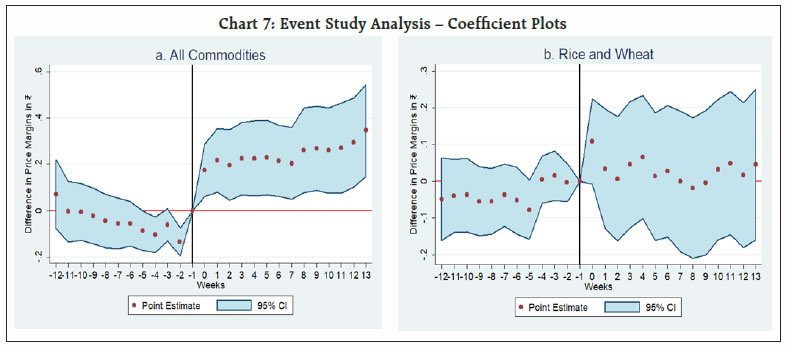
| Table 1: Price Margin Across Centres During the First Wave21 | | | All Centres | High Intensity Lockdown Centres | Low Intensity Lockdown Centres | | (1) | (2) | (3) | | 2020=1 × March 25-May 31=1 # | 0.441*** | 0.602*** | 0.136 | | (0.0914) | (0.116) | (0.142) | | 2020=1 × June-November=1# | 0.312** | 0.372* | 0.228 | | (0.144) | (0.191) | (0.185) | | Baseline Average (January-March 24, 2020) | 6.26 | 6.54 | 5.63 | | Adjusted R2 | 0.779 | 0.776 | 0.800 | | Observations | 834133 | 573750 | 260383 | Notes: Centre × Commodity FE, State × Month FE, State × Year FE, Commodity × Month FE, and Commodity × Year FE are included in all the above specifications. Standard errors are clustered at the commodity-centre level.
# 2020 is a dummy variable which takes the value 1 if the year is 2020. March 25-May 31 and June-November are dummy variables that take the value 1 if the date belongs to those periods, respectively, as mentioned earlier.
Standard errors are in parentheses.
*, ** and *** represent significance at 10 per cent, 5 per cent, and 1 per cent, respectively. | The increase in price margins at the aggregate level was mainly driven by increase in margins in case of pulses, edible oils and potato22, while the lockdown did not have any significant impact on margins for cereals and other food items (Table 2). Margins increased by 19.3 per cent for pulses, 11.2 per cent for edible oils and 12.3 per cent for potato compared to their respective baseline averages. The commodity level differences in terms of the impact of the lockdown on margins highlight the differences in their price elasticities as well as supply chains. Items that are non-perishable in nature such as cereals, pulses and edible oils could have been stocked by consumers leading to higher demand during the pandemic. However, cereals did not exhibit any increase in margins owing to sufficient buffer stocks being maintained by the Government, free distribution of 5 kg of rice or wheat to the poor per month under the Pradhan Mantri Garib Kalyan Anna Yojana (PMGKAY) and timely release of stocks through open market sales. In case of pulses, on the back of a generally tight domestic supply-demand situation, a lower kharif production in 2019-20 reduced availability, while the lockdown led to a sudden increase in demand, pushing up margins. Similarly, in case of edible oils, where a major portion of domestic demand (around 60 per cent) is met especially through palm oil imports, lockdown led to uncertainty about imports reaching the Indian markets, while stocking (precautionary buying) by consumers increased demand, pushing up margins. | Table 2: Price Margins Across Commodities During the First Wave | | | Cereals | Pulses | Edible Oils | Other Food Items | Vegetables | Potato | | (1) | (2) | (3) | (4) | (5) | (6) | | 2020=1 × March 25-May 31=1 | -0.0391 | 1.324*** | 0.732*** | 0.119 | -0.547*** | 0.640** | | (0.108) | (0.191) | (0.195) | (0.227) | (0.190) | (0.242) | | 2020=1 × June-Nov=1 | -0.0842 | 0.861*** | 0.459* | 0.408 | -0.603** | 0.717** | | (0.140) | (0.278) | (0.276) | (0.446) | (0.246) | (0.315) | | Baseline Average (Jan-March 24, 2020) | 3.27 | 6.87 | 6.51 | 7.09 | 6.51 | 5.20 | | Adjusted R2 | 0.638 | 0.699 | 0.733 | 0.832 | 0.684 | 0.738 | | Observations | 119747 | 202747 | 206226 | 183315 | 122098 | 40724 | Notes: Centre × Commodity FE, State × Month FE, State × Year FE, Commodity × Month FE, and Commodity × Year FE are included in all the above specifications. Cereals include atta, wheat, and rice; pulses include gram, masoor, moong, tur and urad; edible oils include groundnut oil, mustard oil, palm oil, soya oil, sunflower oil, and vanaspati oil; other food items include milk, sugar, salt, gur, and tea leaves; Vegetables include potato, tomato and onions. Standard errors are clustered at the commodity-centre level.
Standard errors are in parentheses.
*, ** and *** represent significance at 10 per cent, 5 per cent, and 1 per cent, respectively. | Other non-perishable items covered in the DCA data such as tea leaves, salt, gur and sugar displayed only a small uptick in margins. Margins did not increase much in case of sugar due to excess domestic production, while there was no impact on gur, being a close substitute of sugar. Tea witnessed a small pick-up in margins as its demand increased during the lockdown. For perishable items like onion, tomato, potato and milk, the impact was different. The case of milk is peculiar, as it has a robust supply chain dominated by the cooperative structure of production and distribution in the country. Moreover, formal supply is further augmented by the informal channels of supplies from a large number of small dairies in both urban and rural areas, making India the largest producer of milk in the world. Thus, surplus domestic production together with faster supply response resulted in only a minor impact of the lockdown on milk prices. Among vegetables, onion prices were on a seasonal correction from its peak in December 2019 at the time of the lockdown, while an expected better rabi harvest was arriving in the market, which helped contain price pressures. Tomato prices and margins did show a sudden and big pickup as the lockdown began, but they corrected quickly with rabi crop arriving in the market in abundance and initial hiccups in supply chains being addressed by concerted efforts of the state governments. Margins in potatoes, however, increased and stayed firm during the lockdown despite it coinciding with the rabi arrival period, as crop damage in Uttar Pradesh in March 2020 and further damage in West Bengal due to cyclone in May 2020 – the two major producing states – had led to supply disruptions. At the same time, consumer demand for potatoes also would have increased during the lockdown, as they can be stored for a longer period compared to onions and tomatoes, leading to increase in their margins. 3.2: Lockdown impact during the second wave Extending the analysis into the second wave based on specification (3) indicates that there was no statistically significant increase in margins at the aggregate level during the localised lockdowns in April-May 202123. Even though the coefficient of Time Periodit × 2021 is positive for high intensity lockdown centres, it is not statistically significant (Table 3). At the commodity/sub-group level, however, the impact of lockdown on margins was significantly different during the second wave. Pulses and edible oils registered increase in margins, although of relatively lower magnitude in terms of percentage increase over their baseline (5.3 per cent and 7.9 per cent, respectively, for pulses and edible oils) as compared to the first wave (19.3 per cent and 11.2 per cent, respectively). On the other hand, margins declined in the case of cereals and relatively more for vegetables compared to the first wave, reflecting large buffer stock of food grains and better supply management (Table 4). With these opposing movements in margins offsetting one another, aggregate level margins did not show any increase. Overall, these results indicate that the impact of the lockdown measures on mark-ups was less severe during the second wave compared to the first wave, as expected due to the less stringent and localised nature of the lockdown as well as better supply management by the governments during the lockdown. | Table 3: Price Margin Across Centres During the Second Wave | | | All Centres | High Intensity Lockdown Centres | Low Intensity Lockdown Centres | | (1) | (2) | (3) | | 2021=1 × Second wave=1 | -0.0362 | 0.0900 | -0.151 | | (0.188) | (0.281) | (0.251) | | Baseline Average (State specific) | 9.13 | 10.93 | 7.51 | | Adjusted R2 | 0.694 | 0.699 | 0.706 | | Observations | 335204 | 170153 | 165051 | Notes: Centre × Commodity FE, State × Month FE, State × Year FE, Commodity × Month FE, and Commodity × Year FE are included in all the above specifications. Standard errors are clustered at the commodity-centre level.
Standard errors are in parentheses
*, ** and *** represent significance at 10 per cent, 5 per cent, and 1 per cent, respectively. |
| Table 4: Price Margin Across Commodities During the Second Wave | | | Cereals | Pulses | Edible Oils | Other Food Items | Vegetables | Tomato and Onion | | (1) | (2) | (3) | (4) | (5) | (6) | | 2021=1 × Second wave=1 | -0.557** | 0.540** | 0.742** | -0.693 | -0.785*** | -1.142*** | | (0.235) | (0.261) | (0.372) | (0.643) | (0.220) | (0.260) | | Baseline Average (state specific) | 5.50 | 10.31 | 9.40 | 11.96 | 6.03 | 6.14 | | Adjusted R2 | 0.575 | 0.674 | 0.617 | 0.725 | 0.617 | 0.603 | | Observations | 48562 | 82752 | 80691 | 74241 | 48957 | 32605 | Notes: Centre × Commodity FE, State × Month FE, State × Year FE, Commodity × Month FE, and Commodity × Year FE are included in all the above specifications. Cereals include atta, wheat, and rice; pulses include gram, masoor, moong, tur and urad; edible oils include groundnut oil, mustard oil, palm oil, soya oil, sunflower oil, and vanaspati oil; other food items include milk, sugar, salt, gur, and tea leaves; Vegetables include potato, tomato and onion. Standard errors are clustered at the commodity-centre level.
Standard errors are in parentheses.
*, ** and *** represent significance at 10 per cent, 5 per cent, and 1 per cent, respectively. | IV. Conclusions This article examines the impact of the lockdown during both waves of COVID-19 on price margins in essential food items in India. It employs a difference-in-difference empirical strategy on two dimensions – across centres (which are differentiated on the basis of the intensity of the lockdown) and across food items (which are differentiated on the basis of their supply chains and Government interventions relevant to specific items). The results show that price margins increased on average during the first lockdown period by 7 per cent, which persisted with some moderation in the subsequent unlocking phase. Moreover, the increase in margins was found to be predominantly driven by high intensity lockdown centres, indicating the role of the lockdown. Second, there was considerable heterogeneity in the impact of lockdown on margins across commodities – pulses and edible oils showed sharp increases reflecting tight domestic supply-demand conditions, while cereals and milk did not show any significant impact due to excess supply and robust supply chains. During the second wave, localised lockdowns did not have a significant impact on margins across centres at the aggregate level, although commodity/sub-group level differences persisted. Pulses and edible oils registered an uptick in margins due to continued tight supply-demand conditions, although of relatively lower magnitude, while margins fell in case of cereals and vegetables, reflecting the less stringent nature of lockdown as well as better supply management by the governments during the second wave. References Ebrahimy, E., D. Igan, and S. M. Peria (2020), “The Impact of COVID-19 on Inflation: Potential Drivers and Dynamics”, Special Notes Series on COVID-19, International Monetary Fund. Lowe, M., G. V. Nadhanael, and Benjamin N. Roth (2020). “India’s Food Supply Chain during the Pandemic”, Harward Business School Working Paper 21-070. Mahajan, K., and S. Tomar (2020). “Here Today, Gone Tomorrow: COVID-19 and Supply Chain Disruptions”, Discussion Paper Series in Economics (DP No. 28), Ashoka University. Narayanan, S., and S. Saha (2020), “Urban Food Markets and the Lockdown in India”, Indira Gandhi Institute of Development Research, WP-2020-017. Reardon, T., A. Mishra, Chandra S R Nuthalapati, M. F. Bellemare, and D. Zilberman (2020). “COVID-19’s Disruption of India’s Transformed Food Supply Chains”, Economic & Political Weekly, 18-22. Sukhwani, V., S. Deshkar, and R. Shaw (2020). “COVID-19 Lockdown, Food Systems and Urban–Rural Partnership: Case of Nagpur, India”, International Journal of Environmental Research and Public Health. Varshney, D., D. Roy, and J. V. Meenakshi (2020), “Impact of COVID 19 on Agricultural Markets: Assessing the Roles of Commodity Characteristics, Disease Caseload and Market Reforms.” Indian Economic Review S83–S103.
|