The forecasts of output growth and price inflation for 2019-20 and 2020-21 in the Reserve Bank’s bimonthly survey of professional forecasters (SPF) reflected unprecedentedly high uncertainty in the wake of the Covid-19 pandemic. The SPF panellists revised down their output growth trajectory over successive rounds of the survey and rapidly evolving demand and supply conditions guided the changes in quarterly inflation forecast path. Fluctuations in short-term forecasts stabilised after the gradual easing of the pandemic related restrictions. Even though disagreement in forecasts is not a proxy for uncertainty, empirical analysis suggests that forecasters differ more in uncertain times. Introduction Inflation expectations of economic agents have different perceived real interest rates which are interlinked with consumption and investment decisions, which are central to determining the real effects of central banks’ policy actions. The channels of monetary policy transmission are influenced by the assessment and prognosis of the factors which affect consumption, saving, investment and other financial decisions of households, firms and financial markets. Forward looking monetary policy formulation, therefore, uses forecast of major economic indicators (e.g., output growth, price inflation) to supplement its continuous gauge of state of the economy in the overall policy matrix. The Reserve Bank’s forward-looking surveys of households, firms and professionals in the financial sector provide useful inputs about their perception of the economy, where professional forecasters1 are generally more informed about global and domestic economic developments and are also well-equipped with econometric forecasting tools. Forecasts of twenty-five macroeconomicindicators2 covering national accounts aggregates, inflation, money and banking, public finance andexternal sector are collected in the survey3. In addition to the point forecasts, the questionnaire also includes expected probability distributions of annual output growth (current and next financial years) andquarterly CPI4 based headline inflation (for current and next three quarters). Respondents provide expected probabilities for a given set of intervals for output growth and inflation and these probability distributions help in assessing forecast uncertainty. This article presents an analysis of the SPF forecasts for the years 2019-20 and 2020-21 for the survey rounds conducted during March 2019 to March 2021, wherein the number of responses ranged between 25 and 41. The remainder of the article is divided into four sections. Section II discusses the revisions in median forecast of select macroeconomic indicators, while measures of uncertainty and disagreement are presented in Section III. Section IV presents the association between the disagreement and uncertainty of forecasts. The final section V concludes with some key takeaways. II. Forecast Revisions Even before the onset of the novel coronavirus (Covid-19) pandemic, the Indian economy was witnessing moderation in GDP growth. Subsequently, generating reliable forecasts became a challenge due to the unprecedented massive global economic disruption brought on by the pandemic, but incoming data on high frequency macroeconomic indicators resulted in professional forecasters revising down their forecasts trajectory over successive rounds of the survey. II.1 Annual Forecasts for 2019-20 Forecasters successively revised down the forecasts of GDP and GVA growth for 2019-20 by 230 basis points each during seven rounds of the survey conducted during March 2019 to March 2020, driven by weak global growth and trade coupled with specific domestic factors such as downturn in automobile sector, real estate sectors, distress among micro, small and medium enterprises (MSMEs), and contraction in merchandise export and import (RBI, 2020b). Therevision in forecast of gross domestic saving rate5 for 2019-20 was, however, moderate (Table 1). CPI based headline inflation forecast path for 2019-20 was revised down during May-September 2019 surveys, broadly in line with the softening of inflation in the ‘fuel and light’ and ‘CPI excluding food and beverages and fuel and light and pan, tobacco and intoxicants’ groups (referred to as CPI core inflation in remainder of this article). This coincided with the decline in price of the Indian crude oil basket from US$ 70.0 per barrel in May 2019 to US$ 61.7 per barrel in September 2019. An extended south-west monsoon and unseasonal rain during October-November 2019 (the kharif harvesting season) led to rise in food prices, mostly driven by onion prices (RBI, 2020a). With food inflation continuing at elevated level for the subsequent months, headline inflation forecast path was revised up from 3.5 per cent in September 2019 to 4.8 per cent in March 2020, which turned out to be the realised CPI headline inflation for 2019-20. Forecasters’ initial projection of CPI core inflation gradually moderated on the back of softening of crude oil prices and weakening domestic demand from 4.9 per cent in March 2019 survey round to 4.0 per cent in the surveys conducted since November 2019, which was the realised print. Though the path of food inflation for WPI and CPI moved in tandem, softening in the inflation of WPI for fuel and power and WPI for non-food manufactured products (NFMP), led to downward revision in the WPI headline inflation forecast path. Muted prices in textiles, leather, paper, chemicals, rubber, metals, computers and electrical equipment led to successive downward revision in forecast path of WPI NFMP inflation for 2019-20 from 2.5 per cent in May 2019 survey round to -0.4 per cent in January 2020, which turned out to be the final official estimate. Forecast of central government gross fiscal deficit (GFD, as per cent of GDP at current market prices) for 2019-20 remained around the budget estimate during the surveys conducted up to September 2019 but was gradually revised up to 3.8 per cent in January 2020 survey round. As per the provisional accounts, the realised GFD of the central government turned out to be higher at 4.6 per cent, which partly reflected the fiscal support measures towards the end of the year in wake of the pandemic. The forecasts of the combined GFD of central and state governments for 2019-20 were also gradually revised up to 6.8 per cent in March 2020 survey round. As per the latest estimate for 2019-20, the combined GFD is expected at 6.9 per cent. | Table 1: Forecast (Median) Revision of Macroeconomic Indicators for 2019-20 | | Survey Period | Mar-19 | May-19 | Jul-19 | Sep-19 | Nov-19 | Jan-20 | Mar-20 | | Round Number | 57 | 58 | 59 | 60 | 61 | 62 | 63 | | GDP growth | 7.3 | 7.2 | 6.9 | 6.2 | 5.3 | 5.0 | 5.0 | | PFCE growth | 8.1 | 8.0 | 7.6 | 5.5 | 4.4 | 4.9 | 5.3 | | GFCF growth | 9.4 | 9.2 | 7.6 | 6.0 | 4.9 | 2.3 | -0.6 | | GVA growth | 7.1 | 7.0 | 6.7 | 6.0 | 5.3 | 4.8 | 4.8 | | Gross domestic saving rate | 30.2 | 30.4 | 30.2 | 30.1 | 30.0 | 29.9 | 29.4 | | CPI Headline Inflation | 3.7 | 3.8 | 3.6 | 3.5 | 3.9 | 4.6 | 4.8 | | CPI Core Inflation | 4.9 | 4.7 | 4.1 | 4.2 | 3.9 | 4.0 | 4.0 | | WPI Headline Inflation | 2.5 | 3.1 | 2.4 | 1.8 | 1.6 | 1.8 | 1.8 | | WPI NFMP Inflation | 2.5 | 2.5 | 1.1 | 0.5 | -0.2 | -0.4 | -0.4 | | Current Account Balance (per cent of GDP) | -2.3 | -2.2 | -2.0 | -1.9 | -1.5 | -1.2 | -1.0 | | Central govt. fiscal deficit (per cent of GDP) | 3.4 | 3.4 | 3.3 | 3.3 | 3.6 | 3.8 | 3.8 | | Combined fiscal deficit (per cent of GDP) | 6.3 | 6.2 | 6.1 | 6.1 | 6.5 | 6.6 | 6.8 | | Source: Survey of Professional Forecasters, Reserve Bank of India. | II.2 Annual Forecasts for 2020-21 Forecasts for macroeconomic indicators for 2020-21 were collected since the May 2019 round of the survey. Growth forecast for 2020-21 was revised down by 180 bps to 5.5 per cent in March 2020 from 7.3 per cent in March 2019. With the global spread of coronavirus, the IMF revised down the global GDP growth for 2020 sharply by 630 bps to -3.0 per cent inApril 20206 from the forecast made in January 2020. On the domestic front also, nationwide lockdown imposed during the last week of March 2020, social distancing norms and mass return of migrant workers led to decline in the manufacturing and already stressed construction activities. Subsequently, growth forecast was revised down sharply over the successive survey rounds to -9.1 per cent in September 2020. With gradual reopening of the economy and as indicated by the high frequency indicators, growth forecast was revised up to -7.5 per cent in March 2021 and was broadly in line with the provisional estimate of -7.3 per cent (Table 2). In line with the revisions in GDP growth forecast, real PFCE growth forecast was revised down from 8.0 per cent in May 2019 to -11.0 per cent in September 2020. On the back of muted domestic demand, lower capacity utilisation and large housing overhang, forecast of real GFCF growth, a proxy for investment growth, was also revised down from 9.7 per cent to -21.0 per cent during the same period. With improvement in economic activities, real PFCE and GFCF growth forecasts were revised up over the subsequent rounds of the survey. In tandem with downward revisions in GDP growth forecast, GVA growth forecast was revised down over the successive rounds of the survey, from 7.1 per cent in May 2019 to -8.4 per cent in September 2020, reflecting the weakness in manufacturing and services activities, before revising up to -6.5 per cent in March 2021, 30 basis points lower than the provisional estimate of -6.2 per cent. CPI headline inflation forecast for 2020-21, which remained within the narrow range of 3.9 per cent to 4.2 per cent during the surveys conducted during May 2019 to May 2020, revised up significantly to 6.2per cent in January 20217, reflecting the impact of pandemic led supply disruption, adverse weather in some of the states and imposition of higher tax on petroleum products. Reflecting the weak demand condition andsoftening of Indian basket of crude oil prices8, forecast of CPI core inflation was revised down in successive rounds to 3.5 per cent in May 2020. However, increase in the taxes on petroleum products, increase in gold and silver prices, and sequential increase in input cost led to upward revision in core inflation forecast to 5.3 per cent in September 2020, which remained unchanged in the subsequent four rounds of the survey. The forecast of 5.3 per cent turned out to be same as the actual print. Forecast for WPI headline inflation for 2020-21 was revised down continuously over the successive rounds of the survey till May 2020 and projected to enter into negative territory in July 2020. However, with the improvement in demand conditions, WPI headline inflation was revised up to 1.0 per cent in March 2021. With the softening of commodity prices and weak domestic demand conditions, WPI NFMP inflation forecast was revised down from 4.2 per cent in May 2019 to around 0.0 per cent in May 2020 round and was revised up gradually to 2.0 per cent in March 2021. Current account balance (as per cent of GDP at market price) for 2020-21, which was expected at -0.5 per cent in May 2020, projected to turn into surplus and forecast was revised up successively to 1.2 per cent in November 2020, on the back of the expectation of higher fall in imports than exports due to weak domestic demand, muted international crude oil prices. Due to lower tax collection and an increase in revenue expenditure in the rural, agriculture and defence spending, forecast of central government fiscal deficit for 2020-21 was revised up from 3.6 per cent of GDP in March 2020 to 7.7 per cent in November 2020, primarily reflecting the impact of various measures taken by the government to revive the economy caused by the pandemic. Forecast was revised to 9.5 per cent in March 2021. The combined fiscal deficit forecast was revised up from 6.1 per cent in May 2019 to 14.0 per cent in March 2021. II.3 Revisions in Quarterly GDP Forecasts The quarterly GDP growth forecast for the quarters of the year 2019-20 were revised down successively over the different rounds of the survey(Table 3)9. The forecast path for Q1:2020-21 andQ2:2020-2110 were also revised down sharply by about 29 and 17 percentage points from their initial forecasts over the successive survey rounds. Growth forecasts for Q3:2020-21 and Q4:2020-21 were also revised down till the September 2020 round, though the extent of revisions were relatively small. With the gradual opening of the economy, growth forecast path for Q3:2020-21 and Q4:2020-21 were revised up subsequently. Forecast path for 2021-22 was also revised up from the initial forecast. | Table 2: Forecast (Median) Revision of Macroeconomic Indicators for 2020-21 | | Survey Period | May-19 | Jul-19 | Sep-19 | Nov-19 | Jan-20 | Mar-20 | May-20 | Jul-20 | Sep-20 | Nov-20 | Jan-21 | Mar-21 | | Round Number | 58 | 59 | 60 | 61 | 62 | 63 | 64 | 65 | 66 | 67 | 68 | 69 | | GDP growth | 7.3 | 7.2 | 7.0 | 6.4 | 5.9 | 5.5 | -1.5 | -5.8 | -9.1 | -8.5 | -7.6 | -7.5 | | PFCE growth | 8.0 | 8.0 | 7.0 | 6.4 | 6.1 | 5.5 | -0.5 | -6.0 | -11.0 | -9.7 | -9.4 | -9.0 | | GFCF growth | 9.7 | 9.1 | 7.4 | 6.5 | 5.3 | 2.6 | -6.4 | -9.8 | -21.0 | -19.1 | -14.5 | -12.4 | | GVA growth | 7.1 | 7.1 | 6.7 | 6.3 | 5.7 | 5.3 | -1.7 | -5.8 | -8.4 | -8.2 | -7.3 | -6.5 | | Gross domestic saving rate | 30.7 | 30.5 | 30.5 | 30.3 | 30.0 | 29.5 | 27.1 | 28.0 | 26.0 | 27.1 | 29.0 | 28.9 | | CPI Headline Inflation | 4.1 | 4.0 | 3.9 | 4.0 | 4.2 | 4.2 | 4.0 | 4.4 | 5.6 | 6.3 | 6.2 | 6.2 | | CPI Core Inflation | 4.8 | 4.4 | 4.4 | 4.2 | 4.2 | 4.1 | 3.5 | 4.5 | 5.3 | 5.3 | 5.3 | 5.3 | | WPI Headline Inflation | 3.9 | 3.7 | 2.8 | 2.7 | 3.2 | 2.2 | 0.6 | -0.8 | -0.4 | 0.2 | 0.5 | 1.0 | | WPI NFMP Inflation | 4.2 | 3.3 | 2.1 | 1.4 | 1.2 | 1.0 | 0.0 | 0.1 | 0.5 | 0.7 | 1.7 | 2.0 | | Current Account Balance (per cent of GDP) | -2.3 | -2.1 | -2.0 | -1.8 | -1.5 | -0.7 | -0.5 | 0.4 | 0.5 | 1.2 | 1.2 | 1.0 | | Central govt. fiscal deficit (per cent of GDP) | 3.3 | 3.2 | 3.3 | 3.5 | 3.5 | 3.6 | 6.7 | 7.5 | 7.5 | 7.7 | 7.5 | 9.5 | | Combined fiscal deficit (per cent of GDP) | 6.1 | 6.0 | 6.0 | 6.3 | 6.4 | 6.5 | 10.9 | 12.0 | 12.0 | 12.5 | 11.8 | 14.0 | | Source: Survey of Professional Forecasters, Reserve Bank of India. |
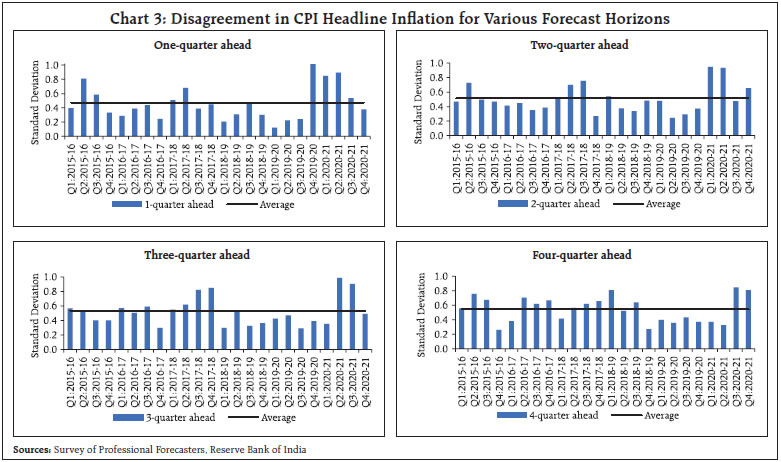
| Table 3: Quarterly Median Forecasts of GDP Growth | | Survey period | Mar-19 | May-19 | Jul-19 | Sep-19 | Nov-19 | Jan-20 | Mar-20 | May-20 | Jul-20 | Sep-20 | Nov-20 | Jan-21 | Mar-21 | | Round number | 57 | 58 | 59 | 60 | 61 | 62 | 63 | 64 | 65 | 66 | 67 | 68 | 69 | | Q1: 2019-20 | 6.8 | 6.6 | 6.1 | | | | | | | | | | | | Q2: 2019-20 | 7.3 | 7.1 | 6.7 | 5.8 | | | | | | | | | | | Q3: 2019-20 | 7.5 | 7.2 | 7.0 | 6.4 | 5.5 | 4.8 | | | | | | | | | Q4: 2019-20 | 7.5 | 7.4 | 7.5 | 7.2 | 6.1 | 5.4 | 4.6 | 2.0 | | | | | | | Q1: 2020-21 | | 7.3 | 7.3 | 7.2 | 6.2 | 5.7 | 4.7 | -14.9 | -21.5 | | | | | | Q2: 2020-21 | | | | 7.0 | 6.6 | 6.0 | 5.3 | 1.2 | -5.0 | -10.0 | | | | | Q3: 2020-21 | | | | | | 6.1 | 5.7 | 3.1 | 0.4 | -3.2 | -2.0 | -0.7 | | | Q4: 2020-21 | | | | | | | 6.1 | 6.2 | 2.9 | 0.6 | 1.0 | 1.7 | 0.8 | | Q1: 2021-22 | | | | | | | | | 16.0 | 17.8 | 21.0 | 24.6 | 26.6 | | Q2: 2021-22 | | | | | | | | | | 8.8 | 9.1 | 8.7 | 9.7 | | Q3: 2021-22 | | | | | | | | | | | | 5.0 | 6.0 | | Q4: 2021-22 | | | | | | | | | | | | | 5.3 | | Source: Survey of Professional Forecasters, Reserve Bank of India | II.4 Revisions in Quarterly Inflation Forecasts The quarterly inflation forecast path for 2019-20 and 2020-21 was revised by incorporating the evolving macroeconomic conditions, demand supply mismatch and incoming economic data (Table 4). The quarterly headline CPI inflation forecast for Q1:2019-20 and Q2:2019-20 turned out to be in line with the realised inflation of 3.1 per cent and 3.5 per cent, respectively. Due to hardening of food inflation on account of excess unseasonal rainfall during October 2019, damaging crops in some major crop producing states, headline inflation forecast for Q3:2019-20 was revised up to 4.7 per cent in November 2019 from 3.7 per cent in the previous round, while forecast for Q4:2019-20 was revised up from 4.5 per cent in November 2019 to 6.7 per cent in March 2020, which was same as the actual print of 6.7 per cent. Headline inflation forecast for Q1:2020-21 remained range bound during May-November 2019 rounds of the survey, and was revised up by 100 bps to 5.1 per cent in January 2020, on the back of elevated food inflation driven by high vegetables inflation. Inflation forecast path for the remaining quarters of 2020-21 was revised up sharply in the range of 170-340 basis points (bps), particularly since July 2020 round, due to lockdown induced supply disruption, increase in retail price margin, hike in taxes in petroleum products, and sequential increase in input cost. Forecast for Q2:2020-21 was revised up to 6.6 per cent in September 2020, and was lower than the actual print of 6.9 per cent. Headline inflation forecast for Q3:2020-21 was revised up to 6.6 per cent in November 2020 and was higher than the realised inflation of 6.4 per cent. | Table 4: Quarterly Median Forecasts of Inflation | | Survey Period | Mar-19 | May-19 | Jul-19 | Sep-19 | Nov-19 | Jan-20 | Mar-20 | May-20 | Jul-20 | Sep-20 | Nov-20 | Jan-21 | Mar-21 | | Survey Round | 57 | 58 | 59 | 60 | 61 | 62 | 63 | 64 | 65 | 66 | 67 | 68 | 69 | | CPI Headline inflation | | Q1: 2019-20 | 2.9 | 3.1 | | | | | | | | | | | | | Q2: 2019-20 | 3.3 | 3.5 | 3.3 | 3.3 | | | | | | | | | | | Q3: 2019-20 | 4.0 | 4.0 | 3.8 | 3.7 | 4.7 | | | | | | | | | | Q4: 2019-20 | 4.2 | 4.2 | 4.0 | 3.9 | 4.5 | 6.3 | 6.7 | | | | | | | | Q1: 2020-21 | | 4.1 | 3.8 | 3.9 | 4.1 | 5.1 | 5.3 | 5.6 | | | | | | | Q2: 2020-21 | | | | 4.0 | 4.0 | 4.9 | 4.8 | 4.9 | 5.2 | 6.6 | | | | | Q3: 2020-21 | | | | | | 3.8 | 3.6 | 3.2 | 3.3 | 4.9 | 6.6 | | | | Q4: 2020-21 | | | | | | | 3.2 | 2.8 | 3.0 | 4.2 | 5.4 | 5.0 | 4.9 | | Q1: 2021-22 | | | | | | | | | 3.3 | 3.9 | 5.0 | 5.0 | 5.0 | | Q2: 2021-22 | | | | | | | | | | 3.8 | 4.5 | 4.6 | 4.9 | | Q3: 2021-22 | | | | | | | | | | | | 4.1 | 4.3 | | Q4: 2021-22 | | | | | | | | | | | | | 5.0 | | CPI ex Food, Fuel, Pan, Tobacco and Intoxicants inflation | | Q1: 2019-20 | 4.8 | 4.5 | | | | | | | | | | | | | Q2: 2019-20 | 4.8 | 4.6 | 4.2 | 4.2 | | | | | | | | | | | Q3: 2019-20 | 4.8 | 4.5 | 3.9 | 3.9 | 3.5 | | | | | | | | | | Q4: 2019-20 | 4.9 | 4.8 | 4.1 | 4.2 | 3.7 | 4.0 | 4.1 | | | | | | | | Q1: 2020-21 | | 5.0 | 4.4 | 4.4 | 4.0 | 4.2 | 4.1 | 3.8 | | | | | | | Q2: 2020-21 | | | | 4.3 | 4.0 | 4.2 | 4.0 | 3.5 | 4.7 | 5.5 | | | | | Q3: 2020-21 | | | | | | 4.4 | 4.2 | 3.4 | 4.6 | 5.6 | 5.4 | | | | Q4: 2020-21 | | | | | | | 4.1 | 3.1 | 4.2 | 5.2 | 5.3 | 5.4 | 5.6 | | Q1: 2021-22 | | | | | | | | | 3.7 | 4.7 | 4.8 | 5.1 | 5.3 | | Q2: 2021-22 | | | | | | | | | | 4.2 | 4.3 | 4.8 | 5.3 | | Q3: 2021-22 | | | | | | | | | | | | 4.9 | 5.3 | | Q4: 2021-22 | | | | | | | | | | | | | 5.1 | | WPI Headline inflation | | Q1: 2019-20 | 2.7 | 3.0 | | | | | | | | | | | | | Q2: 2019-20 | 2.1 | 2.9 | 1.9 | 1.1 | | | | | | | | | | | Q3: 2019-20 | 2.3 | 2.7 | 1.9 | 1.0 | 0.7 | | | | | | | | | | Q4: 2019-20 | 3.6 | 3.8 | 3.0 | 2.2 | 1.7 | 2.7 | 2.4 | | | | | | | | Q1: 2020-21 | | 3.9 | 2.8 | 2.2 | 1.6 | 2.8 | 1.8 | -0.6 | | | | | | | Q2: 2020-21 | | | | 2.8 | 2.6 | 3.5 | 2.5 | 0.5 | -0.6 | 0.0 | | | | | Q3: 2020-21 | | | | | | 3.4 | 2.5 | 0.6 | -1.2 | 0.1 | 1.3 | | | | Q4: 2020-21 | | | | | | | 2.2 | 0.5 | -0.7 | 0.3 | 1.3 | 2.3 | 3.9 | | Q1: 2021-22 | | | | | | | | | 2.5 | 2.5 | 4.1 | 5.7 | 7.5 | | Q2: 2021-22 | | | | | | | | | | 2.1 | 2.6 | 4.2 | 6.0 | | Q3: 2021-22 | | | | | | | | | | | | 3.3 | 4.8 | | Q4: 2021-22 | | | | | | | | | | | | | 3.0 | | WPI Non-food Manufactured Products inflation (NFMP) | | Q1: 2019-20 | 2.4 | 2.0 | | | | | | | | | | | | | Q2: 2019-20 | 2.0 | 1.8 | 0.8 | 0.0 | | | | | | | | | | | Q3: 2019-20 | 2.0 | 1.9 | 0.5 | -0.2 | -1.4 | | | | | | | | | | Q4: 2019-20 | 3.0 | 2.7 | 1.7 | 0.6 | -0.6 | -0.9 | -0.8 | | | | | | | | Q1: 2020-21 | | 3.1 | 2.1 | 1.1 | -0.1 | -0.2 | -0.2 | -0.7 | | | | | | | Q2: 2020-21 | | | | 2.0 | 1.0 | 1.0 | 1.0 | -0.2 | 0.1 | 0.4 | | | | | Q3: 2020-21 | | | | | | 1.5 | 1.8 | 0.7 | 0.9 | 1.3 | 1.8 | | | | Q4: 2020-21 | | | | | | | 1.8 | 0.9 | 0.6 | 1.2 | 1.8 | 4.1 | 5.5 | | Q1: 2021-22 | | | | | | | | | 2.0 | 2.0 | 2.6 | 5.1 | 6.2 | | Q2: 2021-22 | | | | | | | | | | 1.9 | 2.6 | 4.8 | 5.8 | | Q3: 2021-22 | | | | | | | | | | | | 3.5 | 4.3 | | Q4: 2021-22 | | | | | | | | | | | | | 2.6 | | Source: Survey of Professional Forecasters, Reserve Bank of India | Forecast of CPI core inflation for the quarters of the year 2019-20 were revised down successively from March 2019 and were broadly in line with the actualprint at shorter forecast horizon11. With the weakening of the domestic demand conditions, core inflation forecast for the quarters of 2020-21 were revised down from May 2019 to May 2020. Due to increase in the taxes on petrol and diesel, increase in prices of gold and silver and sequential increase in input costs, forecast path was revised up from July 2020. Headline and core inflation forecasts for Q4: 2020-21 to Q3: 2021-22 were revised up from their initial forecasts. III. Disagreement and Uncertainty in Forecasts Forecasts of macroeconomic variables are always associated with inherent risk and uncertainty, reflecting the accuracy of underlying model and related assumptions, validity of structural relationships, evolution of economic conditions, data quality and other related factors. Understanding the nuances of expectation formulation and measurement of forecast uncertainty are, therefore, critical components in policy making process. The twin conundrum of gauging the subjectivity of individual forecaster’s assessment and unavailability of data on economic uncertainty poses a formidable practical challenge in the measurement of uncertainty. Though disagreement and uncertainty appear analogous, they differ significantly in the present context. Irrespective of underlying uncertainty, agents may disagree about the future path of macroeconomic variables for various reasons and the level of disagreement can be measured from the point forecasts provided by forecasters. The survey seeks panellists’ underlying probability distribution for GDP growth and CPI inflations, which can be used to measure the level of uncertainty associated with the individual forecast. Here, we prepare the measures of uncertainty and disagreement for those respondents of SPF who provided information on both point and density forecasts of output growth and inflation. Under the assumption of uniform probability distribution within each interval of density forecast, the forecast uncertainty of the ith respondent is given by: Disagreement Disagreement for one quarter ahead forecast horizon for GDP growth for Q1:2020-21 and Q2:2020-21 were estimated higher than the long-run average (Chart 1). With the gradual resumption of the economy, disagreement for one quarter ahead forecast from Q2:2020-21 moderated. Disagreement was higher than the long run average for other forecast horizons in the recent period. Disagreement for GVA growth forecast mirrored similar pattern as observed in case of GDP growth forecast (Chart 2). 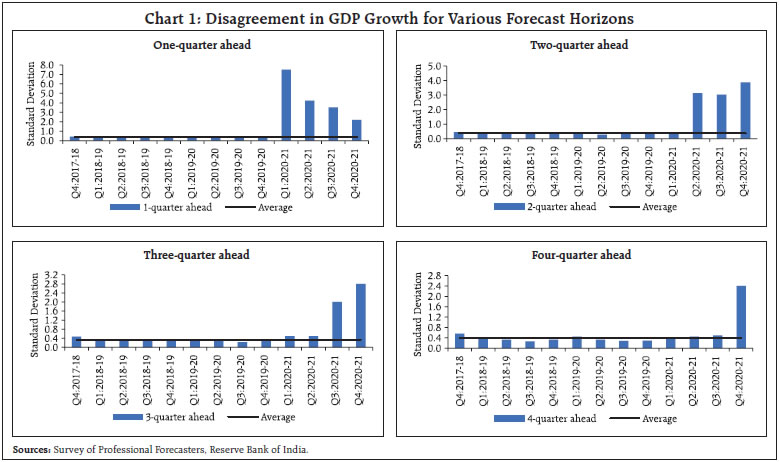 For one quarter ahead forecast horizon, disagreement in headline CPI inflation increased for Q4:2019-20 due to the spike in vegetables prices caused by unseasonal rain in October- November 2019 (Chart 3). Disagreement for headline inflation continued to remain high for the first half of 2020-21 due to lockdown induced supply disruption. With the gradual normalisation of the supply related disruption, disagreement among the forecasters reversed to its long run average in the subsequent two quarters. Disagreement for two and three quarters ahead forecasts reverted to its long-run average in the recent periods. Moderation in disagreement is also observed for the four quarters ahead forecast. 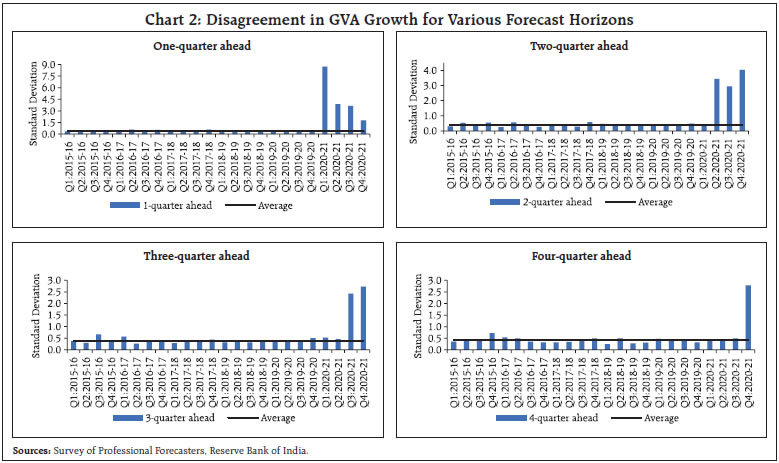
 In case of exclusion-based CPI12 inflation, disagreement among the forecasters increased during the survey rounds conducted towards the start of the year 2020, with the increasing spread of the coronavirus globally and subsequent lockdown announced by the Government of India. Accordingly, disagreement among the forecasters increased for one quarter ahead forecast (Q2: 2020-21), two quarter ahead forecast (Q3:2020-21) and three quarter ahead forecast (Q4:2010-21) (Chart 4). Subsequently, with the availability of new information, disagreement among the forecasters reverted to its long run average. For four quarter ahead forecast horizon, disagreement among the forecasters hovered around its long run average. Uncertainty The quarterly CPI headline inflation forecast uncertainty depicted in the left panel of Chart 5, shows that uncertainty declined as the forecast horizon reduced. The level of inflation forecast uncertainty increased in January 2020, and moderated in March 2020. Subsequently, due to the lockdown in the economy coupled with unavailability of the CPI headline print for April 2020, uncertainty increasedsharply in the survey conducted in May 202013. The uncertainty in GDP growth forecast for 2019-20 decreased gradually as the forecast horizon reduced. Uncertainty in GDP growth forecast for 2020-21 increased in July 2020 and increased further to reach its peak in November 2020. For 2021-22, elevatedlevel of uncertainty was observed during May 2020 to November 202014. With the resumption of economic activities, uncertainty of forecasts for both the years decreased in subsequent rounds. IV. Association between Disagreement and Uncertainty in Forecasts In the previous section, uncertainty and disagreement among the forecasters have been analysed separately. However, it is believed that higher uncertainty leads to higher disagreement among the forecasters about the forecasts on major macro variables. Higher interpersonal differentiation of expectations indicates higher uncertainty (Zarnowitz and Lambros, 1987). Aggregate forecast uncertainty can be expressed as the sum of the disagreement among the forecasters and the perceived variability of future aggregate shocks (Lahiri and Sheng, 2010). Drawing from the literature, one would expect positive correlation between disagreement and uncertainty. The scatter plots of disagreement and uncertainty of GDP growth and CPI headline inflation across differentforecast horizons15 based on the different rounds of the survey suggest existence of a positive correlation between disagreement and uncertainty (Chart 6). The correlation coefficient between disagreement and uncertainty of forecasts is found to be 0.39 for inflation and 0.65 for GDP growth, suggesting existence of co-movement between uncertainty and disagreement. Despite mixed empirical evidences in the literature, disagreement has been often used as a proxy to measure uncertainty. Based on professional forecasters survey conducted by the Federal Reserve Bank of Philadelphia, it was found that disagreement is a good proxy for uncertainty parameter when the variability of aggregate shocks is low (Lahiri and Sheng, 2010). Association between changes in disagreement and uncertainty based on the survey of external forecasters conducted by the Bank of England was reported by Boero et. al. (2015). On the other hand, there are studies that could not establish statistically significant association between disagreement and uncertainty for the survey conducted by the European Central Bank (Rich et. al. 2012). 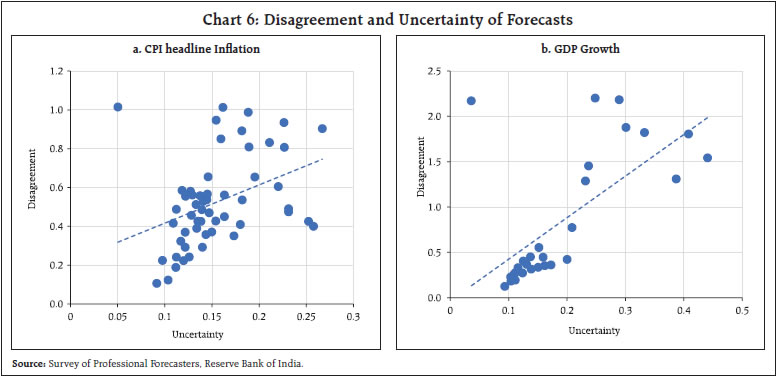 To explore the relationship between disagreement and forecast uncertainty, empirical analysis has been carried out to check whether disagreement can be a useful indicator for uncertainty. Accordingly, the following regression model has been used to assess the association between uncertainty and disagreement, For annual GDP growth forecast, the coefficient of disagreement is estimated at 0.093, which is statistically significant, with R2 estimated at 0.36 (Table 5). In case of quarterly CPI headline inflation forecast, the coefficient of disagreement is estimated at 0.090, which is statistically significant, with R2 of 0.14. Both the results indicate existence of moderate but significant association between uncertainty and disagreement. As such, though disagreement contains some information on uncertainty, it may not be a reliable proxy for uncertainty. | Table 5: Regression Estimates of Uncertainty on Disagreement | | | α | β | R2 | | Annual GDP growth | 0.344 (0.00) | 0.093 (0.00) | 0.36 | | Quarterly CPI headline inflation | 0.342 (0.00) | 0.090 (0.01) | 0.14 | | Note: Figures reported inside the parentheses are the p-values. | V. Conclusion The forecast revisions in successive survey rounds by professional forecasters reflect new information flows and changes in level of confidence on the evolution of economic conditions. The massive disruption in global as well as domestic economies due to the coronavirus pandemic and the uncertainty about its future path led to large swings in forecasts. Large forecast revisions, for both GDP growth and inflation, could be attributed to the impact of the nationwide and subsequent localised lockdowns, the changes in nature and scale of consumption, and the diversity of impact on various economic activities, as the pandemic induced shock made traditional models less efficient in many cases. Reflecting on this uncertainty coupled with pre-pandemic slowdown, the professional forecasters revised down their growth trajectory for both 2019-20 and 2020-21, over successive rounds of the survey. The supply chain challenges during the pandemic and persistently high CPI inflation prints since December 2019 led to upward revisions in the CPI inflation trajectory, particularly for 2020-21. Measures of disagreement and uncertainty among the forecasters were derived from the reported point and density forecasts, for both inflation and growth. With the onset of the global pandemic, disagreement among the forecasters rose significantly. In tandem, uncertainty of inflation and growth forecasts followed a similar pattern and declined with the reduction in the forecast horizon. Empirical analysis suggests existence of association between uncertainty and disagreement. Regression estimates indicate that uncertainty displays a significant relationship with disagreement. However, the analysis provides little support in favour of using disagreement as a proxy for uncertainty. References: Abel J., Rich R., Joseph S. and Joseph T. (2016). The Measurement and Behavior of Uncertainty: Evidence from the ECB Survey of Professional Forecasters, Journal of Applied Econometrics, 31, 533–550. Boero, G., Smith, J. and Wallis, K. F. (2015), The Measurement and Characteristics of Professional Forecasters’ Uncertainty, Journal of Applied Econometrics, 30, 1029-1046. Bordoloi, S., Kavediya, R., Roy, S. and Goyal, A. (2019). Changes in Macroeconomic Perceptions: Evidence from the Survey of Professional Forecasters, Reserve Bank of India Bulletin, November 2019, LXXIII (11), 15-26. IMF, (2018). World Economic Outlook: Challenges to Steady Growth, October 2018. IMF, (2020). World Economic Outlook: The Great Lockdown, April 2020. Reserve Bank of India (2020a). Monetary Policy Report, April 2020. Reserve Bank of India (2020b). Annual Report 2019-20, August 2020. Rich, R., Song, J. and Tracy, J. (2012), The Measurement and Behavior of Uncertainty: Evidence from the ECB Survey of Professional Forecasters, Federal Reserve Bank of New York Staff Reports, no. 588. Lahiri, K. and Sheng, X. (2010). Measuring forecast uncertainty by disagreement: The missing link, Journal of Applied Economics, Vol 25, Issue 4, 514-535. Zarnowitz, V. and Lambros, L. A. (1987). Consensus and uncertainty in economic prediction, Journal of Political Economy, 95, 591–621.
|