India has traditionally enjoyed comparative advantage in the textiles sector, especially apparels manufacturing. Apparel exports are a major component of India’s export basket and play a crucial role in the domestic economy as well. However, in recent years there has been a stagnation in apparel exports, partly due to increasing competition from countries like Bangladesh and Vietnam. This article analyses the role of tariff regimes of the destination country in directing the exports of apparels from major suppliers including India. The findings suggest that preferential tariff treatments have been a major contributory factor for rapid growth in apparel exports from developing countries including Bangladesh and Vietnam. These policies have also enabled countries like Cambodia, which were a marginal supplier until recently to benefit from reduced tariffs along with relaxation in rules of origin norms. The article concludes with policy suggestions to unlock the potential of this sector. Introduction India’s apparel industry finds its traces even in the earliest historical records of the Indian sub-continent, i.e., Indus Valley Civilisation. Globally also, apparel is one of the oldest and largest export industry in the world. Apparel production is a springboard for national development, and often is the typical starter industry for countries engaged in export-oriented industrialisation due to its low fixed costs and emphasis on labour-intensive manufacturing (Adhikari & Weeratunge, 2006; Gereffi, 1999). Apparel manufacturing is an integral component of the broad textile industry, and is estimated to account for more than two-third of the total textile industry. Further, apparel industry has strong backward linkages with the rest of textile industry. The finished apparel is an end-product of the three stage value chain: the first stage of converting raw fibres to yarns; the second stage of converting yarns into fabric; and the final stage of dyeing/printing, stitching and finishing of fabric into an apparel (Habib, 2009). The success of apparel industry also depends on how efficient and competitive are these backward linkages that operate in the broad textile industry. If an apparel manufacturer has effective control over supply of raw fabrics and ancillary products, then the production process is expected to not only be efficient and reliable but may also be a source of additional price competitiveness (Siddiqi, 2005). Thus, the prospects and performance of the apparel industry has a strong bearing on the performance of the overall textile sector and vice-versa. India has traditionally enjoyed a comparative advantage in the textile sector, due to a variety of factors. Textile sector accounts for more than two per cent of the total GDP, thereby accounting for 12-14 per cent of the manufacturing sector GDP. In addition, textile sector being highly labour intensive is a major source of employment particularly for unskilled and semi-skilled labour force. The textile sector also derives significance from the fact that it constitutes a major chunk of India’s export basket. However, over the last few years, the share of textile exports in India’s total exports has been declining. Moreover, India’s textile exports are facing increasing competition from countries like Bangladesh and Vietnam. Though India’s textile sector is a much researched topic, in recent times however, there have not been many studies examining the underlying factors driving the near stagnation in India’s textile exports, particularly the apparel exports. This article attempts to fill this gap in literature and also analyse the impact of policies particularly of the tariff regimes in the destination markets. The primary focus of the article is to investigate the contributory factors leading to this decline in apparel exports from India. Furthermore, the article analyses export performance of other key apparel exporters globally and juxtaposes these findings with India’s export performance to glean insights regarding major factors inhibiting India’s apparel exports. The rest of the paper is organised as follows. Section II outlines the stylised facts pertaining to India’s textile and apparel sector. Major policy changes undertaken at the global level are set out in Section III. Section IV provides a snapshot of global apparel market. A review of relevant literature on the subject is covered in Section V. Model specification and empirical results are discussed in Section VI. Section VII sets out the concluding observations and the way forward. II. Stylised Facts Textile sector is a critical sector for the economy contributing more than 11 per cent in total manufacturing and more than 2 per cent in India’s GDP during the period 2012-17. The share of textiles in total manufacturing and in overall GDP recorded a marginal uptick during this period (Table 1). Textile sector, especially apparels manufacturing, is a major employment generating sector. Organised textile and apparel sector employed close to 27 lakh people in 2016-17, thus accounting for 18.1 per cent of the total employment in manufacturing sector (Table 2). The larger share in employment as compared to output of the textile sector to the manufacturing sector as a whole, (18.1 per cent share in employment vis-à-vis a 12.7 per cent share in output in 2016-17), highlights the labour intensive nature of the textile and the apparel sector. Not only is the textile sector highly labour intensive, it also employs unskilled and semi-skilled labour force and is a source of formal sector employment to women (Panagariya, 2018). | Table 1: Role of Textile Sector in Indian Economy | | Year | GVA at Basic Prices for Textiles Sector
(₹ crore) | Share of Textiles Sector in GDP (Per cent) | | Manufacturing | Overall | | 2012-13 | 184,335 | 11.71 | 2.14 | | 2013-14 | 197,617 | 11.92 | 2.16 | | 2014-15 | 226,770 | 13.50 | 2.33 | | 2015-16 | 232,718 | 12.43 | 2.22 | | 2016-17 | 259,108 | 12.65 | 2.30 | | Source: Ministry of Textiles, Government of India. |
| Table 2: Role of Organised Textiles Sector in Generating Employment | | Year | Employment in Textiles and Apparel Sector (in Nos.) | Share of Textile Sector in Total Employment in Manufacturing (Per cent) | | 2012-13 | 23,31,619 | 18.00 | | 2013-14 | 24,74,903 | 18.28 | | 2014-15 | 25,26,610 | 18.20 | | 2015-16 | 26,48,238 | 18.52 | | 2016-17 | 26,97,123 | 18.09 | | Source: Ministry of Textiles, Government of India. | Further, textile is also a major component of exports, contributing US$ 40.4 billion in export earnings in 2018-19 of which earning from apparel exports accounted for US$ 16.1 billion (Table 3). | Table 3: Role of Textiles and Apparel Sector in Exports (US$ million) | | | 2002-03 | 2006-07 | 2015-16 | 2016-17 | 2017-18 | 2018-19 | | Total Textile Exports | 12412 | 19147 | 39288 | 39011 | 39239 | 40431 | | Of which: Apparels | 5334 | 8282 | 16966 | 17368 | 16705 | 16176 | | Overall Exports | 52719 | 126263 | 262290 | 275852 | 303376 | 329536 | | Share of Textiles in Exports (Per cent) | 23.5 | 15.2 | 15.0 | 14.1 | 12.9 | 12.3 | | Share of Apparels in Exports (Per cent) | 10.1 | 6.6 | 6.5 | 6.3 | 5.5 | 4.9 | | Source: Ministry of Textiles, Government of India. | However, in recent years the share of both apparels and textiles overall, in India’s export basket has declined considerably. India possesses competitiveness in the global market of textile & apparel industry. The Indian textile industry has certain inherent strengths. India has the third largest technological and skilled manpower in the world; Thus it has the second largest consumer market consisting of more than 220 million middle income people. The land under cotton cultivation in India is around one-fourth of the total land under cotton cultivation in the world. Therefore, it has ready access to domestic cotton in abundant measure and generally at prices, which are extremely competitive. The waste generation in India is the lowest at 9 per cent of the total cost of production while the waste generation in other countries ranges between 11 per cent and 23 per cent. The labour cost in India is also the lowest, i.e., 3 per cent of the total production whereas in other countries the labour cost ranges between 5 per cent and 38 per cent, the highest being in Italy and Japan at 38 per cent and 29 per cent, respectively. (Katti and Sen, 1999). All the basic requirements are thus available for enhancing performance of textiles industry in India. The presence of these factors, however, have not eased India’s integration in global value chains. Garment chains are buyer-driven chains where production is organised in globally dispersed production networks, coordinated by lead firms. Activities that add value to the product (such as design and branding) are often coordinated by lead firms. The reasons for the low integration of India’s garment industry can be found in the costs associated with production logistics, and time involved in exporting/importing. The other possible reasons for the low integration are the large size of the domestic market. Further, owing to high export standards and strict delivery schedules, certain firms prefer to cater to the domestic market. Due to low integration in global value chains, though textile and apparel exports have grown in quantum, yet their pace of growth has lagged the growth in overall exports, especially in the last few years, leading to a fall in share of textile exports. III. Policy Regime: Global Trade Agreements for Textile Sector The Multi Fibre Agreement (MFA), 1974 had a major impact on the apparel and textile exports by the developing countries and the global value chains pertaining to apparel exports. The MFA was designed to protect the domestic industries of the United States and the European Union (EU) by limiting imports from highly competitive suppliers such as China. It allowed the developed countries like the United States, Canada, and many European nations to establish quotas and preferential tariffs on apparel and textile items imported by them from the developing countries. Thus, MFA restricted exports by developing countries to the major consuming markets, which in turn contributed to the international fragmentation of the apparel supply chain, whereby low-wage countries used the imported textile components and re-exported the finished product (Thoburn (2009), Gereffi (1999) and Audet (2004)). This reconfiguration began when exports from Hong Kong, South Korea, Taiwan, and later China reached their maximum levels under the quota system. Clothing assembly processes were then sub-contracted to low-wage developing countries throughout the Asia Pacific region and elsewhere that had unused export quotas, such as Bangladesh, Sri Lanka, and Vietnam. The MFA was phased out by the World Trade Organisation (WTO) between 1995 and 2005 via its Agreement on Textiles and Clothing (ATC). The ATC was a 10-year transitional agreement with a four-stage integration programme. According to WTO, the new ATC had the following six main features: -
The product coverage basically encompassing yarns, fabrics, made-up textile products and clothing; -
Programme for the progressive four-stage integration of these products into General Agreement on Tariffs and Trade (GATT) 1994 rules, i.e., on January 1, 1995, 1998, 2002, and 2005. Any new protection had to be based on the relevant provisions of the GATT 1994; -
A liberalisation process which automatically increased the existing quota levels inherited from the MFA; -
A transitional safeguard mechanism to deal with cases of serious damage or actual threat of serious damage, to domestic industries which may arise during the transition period; -
Other provisions, which included among other things, were clauses on circumvention of quotas, administration of quantitative restrictions other than those inherited from the MFA, and on actions as may be necessary to abide by GATT 1994 rules and disciplines; and -
The Textiles Monitoring Body (TMB) - a quasi-judicial standing body, within the WTO structure, entrusted with the task of supervising the implementation of the ATC. The ATC proved to be a game changer for textile and clothing (T&C) exports which underwent substantial changes due to the emergence of the global value chains (GVCs) and the phase-out of the MFA. Against this backdrop, the next section provides a snapshot of the global apparel market alongwith India’s position among the major apparel exporters. IV. Global Apparel Market IV.1 Global Imports The EU is the largest market for apparel exports, accounting for 38.4 per cent of global apparel imports in 2018 (Table 4). After excluding Intra-EU trade also, EU remains the largest importer of apparels accounting for 20.0 per cent of total apparel imports. Further, EU’s importance as a market for apparel exports for developing countries has increased with EU displacing USA as the largest importer of apparels, with its share increasing from 19.6 per cent to 20.0 per cent between 2000 and 2018, while US’s share has declined from 33.1 per cent to 17.4 per cent in the same period. IV.2 India’s Apparel Exports The major export destinations for India’s apparel exports include EU, USA, UAE followed by Saudi Arabia and Canada. The importance of EU to India’s apparel exports has increased over the years as its share in India’s apparel exports has increased from 32 per cent in 2000-01 to 38 per cent in 2018-19, to become the largest importer for Indian apparels (Chart 1 and 2). Within EU, 6 major economies, viz., UK, Germany, Spain, France, Netherlands and Italy form the largest markets for Indian apparels. Thus, performance of India’s apparel exports to EU has a bearing on apparel industry’s fortunes. | Table 4: Share in World Clothing Imports | | (Per cent) | | Country/Region | 2000 | 2005 | 2010 | 2018 | | EU (28) | 41.1 | 47.3 | 45.2 | 38.4 | | Extra-EU (28) Imports | 19.6 | 23.4 | 23.9 | 20.0 | | USA | 33.1 | 28.7 | 22.1 | 17.4 | | Japan | 9.7 | 8.1 | 7.2 | 5.7 | | South Korea | 0.6 | 1.0 | 1.2 | 2.0 | | Canada | 1.8 | 2.1 | 2.2 | 2.0 | | China | 0.6 | 0.6 | 0.7 | 1.6 | | Russia | 0.1 | 0.3 | 2.0 | 1.5 | | Switzerland | 1.6 | 1.6 | 1.4 | 1.4 | | Australia | 0.9 | 1.1 | 1.3 | 1.3 | | Source: World Trade Statistical Review (2019), WTO. |
While, the share of EU in India’s apparel exports increased consistently from 2000-01 to 2008-09 to reach a peak of 49.5, it has since been on a declining trend and fell to 38.4 per cent in 2018-19 (Chart 3). This decline has been accompanied by stagnation in India’s apparel exports to EU in value terms at around US$ 6 billion for the last few years. With EU being a particularly important market for apparel exports, especially for India, the stagnation in apparel exports to EU is a matter of concern.
IV.3 Evolution of Apparel Imports of EU EU’s apparel imports rose steadily from 2000 to 2008, but have stagnated since then (Chart 4). Further, the composition of EU’s apparel import basket reflects that countries like South Korea, Indonesia, Thailand, which were among the top 10 apparel exporters have since been replaced by countries like Cambodia, Vietnam and Pakistan due to a combination of factors including comparative advantage for these countries owing to cheap labour and relaxed labour norms, favourable tariff treatment and shift of the earlier major exporters to more technologically advanced products. China and Turkey were the largest source of apparels in EU in 2000 accounting for US$ 7.0 billion and US$ 5.0 billion in imports, respectively. Bangladesh was 4th and India was the 7th largest export partner. It also included Hong Kong and South Korea among the major exporters. By 2005, China had rapidly consolidated its top position accounting for US$ 21.2 billion of apparel exports, with Turkey as the 2nd largest exporter at US$ 10.1 billion. Bangladesh and India accounting for US$ 4.4 and US$ 4.0 billion of apparel exports, respectively, rounded off the top 4 (Table 5). 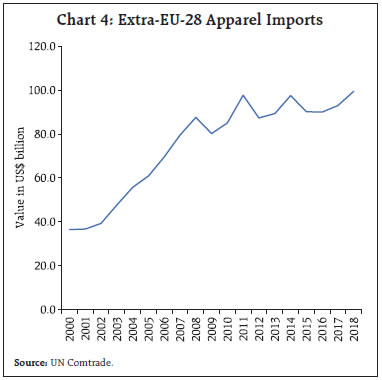
| Table 5: Top 10 Apparel Exporters to EU | | (US $ Billion) | | 2000 | 2005 | 2010 | 2015 | | China | 7.0 | China | 21.2 | China | 38.6 | China | 33.4 | | Turkey | 5.0 | Turkey | 10.1 | Turkey | 10.7 | Bangladesh | 15.4 | | Hong-Kong | 2.9 | Bangladesh | 4.4 | Bangladesh | 8.2 | Turkey | 10.5 | | Bangladesh | 2.4 | India | 4.0 | India | 5.8 | India | 5.7 | | Tunisia | 2.4 | Tunisia | 3.1 | Tunisia | 3.1 | Cambodia | 3.3 | | Morocco | 2.2 | Morocco | 2.8 | Morocco | 2.8 | Vietnam | 3.1 | | India | 1.9 | Hong Kong | 2.1 | Vietnam | 1.8 | Morocco | 2.6 | | Indonesia | 1.7 | Indonesia | 1.5 | Sri Lanka | 1.6 | Pakistan | 2.6 | | Thailand | 0.9 | Sri Lanka | 1.0 | Indonesia | 1.5 | Tunisia | 2.2 | | South Korea | 0.8 | Thailand | 1.0 | Pakistan | 1.4 | Sri Lanka | 1.8 | | Source: UN Comtrade. | Till 2010, China continued to be the largest exporter accounting for US$ 38.6 billion of apparel exports. Bangladesh with US$ 8.2 billion of exports was close behind Turkey (US$ 10.7 billion) in 3rd position. India continued to be the 4th largest exporter with US$ 5.8 billion. Vietnam, Srilanka and Pakistan entered among the top 10 exporting countries in 2010. By 2015, Bangladesh had eclipsed Turkey to become the 2nd largest exporter at US$ 15.4 billion behind China at US$ 33.4 billion. India at US$ 5.7 billion was followed by Cambodia and Vietnam at US$ 3.3 and US$ 3.1 billion, respectively. The compositional shift in the major suppliers of apparels to EU can be explained largely by the differential tariff structure facing each of them. IV.4 Tariff Structure in EU EU introduced the Everything but Arms (EBA) scheme in 2001 which grants duty and quota free access to EU markets for Least Developed Countries for all products except arms and armaments. Currently EBA benefits are available to 9 Asian countries which include Bangladesh and Cambodia. Thus the effective tariff faced by apparel exports from Bangladesh and Cambodia is nil. EU relaxed the rules of origin specifications for exports under EBA scheme in 2011. Turkey and EU have a free trade agreement (FTA) since 1991 under which Turkish apparel exports have duty free access to EU market. India and Vietnam are beneficiaries of the Generalised Scheme of Preferences (GSP) program and hence face a lower tariff rate (average tariff faced is 9.3 per cent). However, the tariff faced is still much higher when compared with Bangladesh, Cambodia and Turkey. Chinese apparel exports having graduated out of GSP mechanism and face the most favoured nation (MFN) tariff of 11.6 per cent. (Appendix 1 gives the tariff line level tariff structure). V. Literature Review Studies on India’s exports in the T&C sector, published prior to 2005, mainly investigated the impact of MFA phase-out on the export performance of India’s T&C. The competition in the global T&C market was expected to intensify after the MFA phase-out, significantly impacting India’s exports (Hashim 2005). Research showed that in a competitive market, deregulation and labour reforms were required to improve export performance (Kathuria and Bhardwaj, 1998). Research findings also showed that developing countries with lower labour costs, such as India and China, benefitted from the MFA phase-out (Nordas, 2004). Various studies analysed the probable post MFA implications on Indian textile exports. But there is no consensus among the researchers regarding the effect of quota removal on Indian textile exports. Few studies pointed at a higher potential gain for the developing countries, especially India in the post MFA period (Mehta, 1997, Chadha et al., 1999, Exim Bank, 2005 and Chaudhary, 2011). However some researchers argued that even though India’s textile exports showed an improved position in the post MFA period, there was a need to strengthen the policy measures to meet the global challenges in the changed scenario (Chaudhary, 2016). Research studies have also focused on India’s strength in textile sector in terms of abundant raw materials, low labour costs, and vertically integrated production facilities. As T&C is a labour-intensive industry, labour cost is a crucial factor in competitiveness and productivity. India’s labour cost is much lower compared to those of China and other countries, which makes India’s T&C attractive (Anthony and Joseph, 2014). Competitiveness of India’s textiles exports has also been analysed in detail by the researchers. Most studies analysed export competitiveness using revealed comparative advantage (RCA), which was developed by Balassa (1965). These studies have concluded that India maintained competitiveness in textile products from 1995 to 2003. However, Kannan (2018) found that India’s comparative advantage in T&C deteriorated from 1995 to 2007. Further, India was found to have a comparative advantage in most textile products based on an RCA analysis from 2010 to 2014 (Kathuria 2013, 2018; Dhiman and Sharma 2017; Kannan 2018). Analysis of export competitiveness of Indian textile industry vis-à-vis twelve major players of the world textile trade has found that India benefitted the most after China after elimination of ATC, i.e., after January 1, 2005, in terms of percentage share in world exports (Gupta and Khan, 2017). Trade agreements have also affected apparel trade flows. Key exporters and importers of apparels have seen increased trade in apparels over the decade due to the signing of several bilateral and regional trade agreements (Brenton and Hoppe, 2017). However, while China does not have any FTA with the US and the EU, a number of global brands are sourcing from China due to its capabilities to do bulk production at competitive rates (Pfohl and Shen, 2008). Chinese firms in the export business are much larger as compared to Indian firms and they enjoy large economies of scale (Minian, Martinez and Ibanez, 2016). Thus, the conclusion drawn by the researchers has varied with some concluding that India’s textile exports are competitive while some studies have derived contrarian results. Another area of research has been the factors driving the competitiveness of India’s textile exports and India’s position in the global value chains. A number of studies have shown that there is low level of investment in R&D and laggard adoption of advanced technology by Indian firms vis-à-vis their global competitors (Varukolu, 2007). Firms in countries such as China invest heavily in automation and R&D, leading to increased productivity and improvement in quality. Further, the fragmented nature of the apparel sector with a pre-dominance of small and mid-sized firms adversely affects its competitiveness (Lopez-Acevedo and Robertson, 2016). By contrast, in Turkey, apparel firms are represented at all levels of the value-chain. Thus research studies on India’s apparel exports have primarily focused on analysis of comparative advantage and the impact of MFA phase out. However, in recent times the stagnation in India’s apparel exports cannot be attributed entirely to loss of competitive strength of the domestic textile sector. An important factor leading to this loss of competitive strength is the differential tariff structure facing each of the major apparel exporters and how that has emerged as a major contributory factor in determining their relative positioning. This aspect has been highlighted by researchers analysing the export performance of India’s major competitor countries. Chen, et al., (2017) analysed the effects of trade cost on the textile and apparel market using a panel data of Asian countries. Using the gravity model with a trade cost function, they found that applied tariffs and most favored nations’ tariffs significantly reduced the trade between countries. Bhattacharya and Rahman (2000) while analysing the export performance of Bangladesh concluded that one important stimulator of the growth of apparel exports in Bangladesh is the tariff and import quota-free access in the European Union (EU) under the Generalised System of Preference (GSP) scheme, which contributed to the expansion of apparel export in the EU market provided that Bangladesh meets the rules of origin (ROO) requirement. The GSP scheme allows EU importers to claim full tariff drawback on their imports from Bangladesh. On average the tariff rate of apparel products in the EU is 12.5 per cent, which becomes zero for Bangladesh under the GSP. Such a preferential treatment has offered comparatively greater market access for Bangladesh in the EU and has made the EU the largest apparel export market of Bangladesh. Similarly, Vietnam has also benefitted from preferential tariff treatment in case of apparel exports. The Free Trade Agreements provide wide market access to Vietnam proving to be a major growth driver for the industry. Its bilateral and multilateral FTAs are a strength to industry’s growth (Valarmathi, 2019). The Bilateral Trade Agreement (BTA) between Vietnam and the U.S. gives benefits to Vietnam export products which get tariff reduction from about 40 per cent to only 3 per cent. The impact of this lower tariff is highly significant (Setyorini and Budiono, 2020). Thus tariffs facing a country’s exports have emerged as a major determining factor in the performance of a country’s textile exports. This paper attempts to investigate this significant factor and the next section provides the descriptive statistical analysis alongwith the econometric evaluation of the same. VI. Analytical Exploration This section aims to present a cross-country analysis of the apparel exports to identify the underlying factors driving the exports. The section first presents a descriptive statistical analysis followed by an econometric analysis to confirm the findings. The study utilises annual import data reported by 6 major EU countries (France, Germany, Italy, Netherlands, Spain and United Kingdom) from 1994 to 20181. The data has been sourced from UN Comtrade Database. Import data has been used instead of export data to maintain consistency in reporting of data across different exporters. Further, import data is usually more robust and reliable as it forms the basis for collection of custom duties in the importing country. Apparel exports are broadly covered under Chapter 61 and 62 of Harmonized Commodity Description and Coding System, thus aggregate of imports under these two chapter headings are considered for further analysis in this paper. VI.I Descriptive Analysis China managed brisk growth during the 2000-10 period, benefitting from the withdrawal of MFA. However, it has withdrawn thereafter possibly to focus on technology intensive exports. Turkey which was amongst the largest exporter pre-2000, also grew in 2000-05 period but has stagnated thereafter (Chart 5 and 6). Bangladesh witnessed a rapid rise in apparel exports after 2000 benefitting from duty free access to the EU market under the EBA program. The growth seems to have increased in recent years, possibly occupying the space withdrawn from China. The easing of sourcing norms has allowed it to focus on CMT (Cut, Make & Trim) production method, while sourcing the fabrics from other countries notably China, Korea, India, Pakistan, Italy and Turkey. Thus, it has become the second largest apparel exporter, much ahead of Turkey and India.
Cambodia which was a marginal player till 2010 has seen rapid growth since then. This may again be attributed to shifting of apparel production from China to take benefit of the duty free access. The relaxed sourcing norms since 2011 would have allowed it to rapidly scale up apparel exports while importing unfinished goods from other countries (Chart 7). Vietnam and India’s exports grew between 2000 and 2010 but while India has stagnated since then, Vietnam continues to grow and may soon surpass India. As both nations face similar tariffs in EU, the continued growth of Vietnam in contrast to India probably reflects competitive edge enjoyed by Vietnam and better integration of its domestic apparel industry in global textile value chains (Chart 8). VI.2 Econometric Analysis In this section, we aim to individually test each country’s apparel export data for structural breaks and also elaborate on the policy shifts in importing countries to explain these structural break points. Chow (1960) provided for testing for a single structural break at a priori known date using an F-statistic. Quandt (1960) modified Chow’s framework to allow for testing of a single unknown breakpoint. Andrews (1993) derived the limiting distribution of the Quandt test statistics formulating the Quandt-Andrews test. The advanced structural models allow for multiple break points. Further, they also do not require a priori information on number of structural break points and can endogenously determine the different structural break points. Bai (1997) provides for a simple approach for detecting more than one break, by repeated application of a single breakpoint test. Thus, sequential estimation model behaves as if there is only one breakpoint. Here, starting with the complete sample, a single unknown break is estimated. In the next step, the next break is identified by either: 1) Testing for an additional breakpoint in each of the segments (Model 1) 2) Testing for the single added breakpoint that reduces the sum-of-squares most (Model 2) Bai and Perron (1998) provided an alternative methodology. They consider a multiple linear regression model with m breaks -
for j = 1,…,m+1, where m is the number of breaks, -
yt is the dependent variable, xt and zt are vectors of covariates, β and δt are the corresponding vectors of coefficients, and ut is the disturbance term. For locating the breaks, two approaches are proposed: 1) Global approach (Model 3) where the break locations Ti, i= 1,…,m are determined to minimise the sum of squared residuals (SSR): It then uses a dynamic programming algorithm to find the global SSR-minimising breaks optimally. The test statistics depends on whether the number of breaks are known a-priori or not: i) Number of breaks are known: H0 (no breaks) vs H1 (k breaks) tested using F-ratio between SSE: supF(0, m). ii) Unknown number of breaks: Standard F-statistics becomes insufficient: Variation of supF(0, m) test is used (Double maximum test) 2) Sequential approach (Model 4) where breaks are determined sequentially, starting with a single break that minimises the SSR. For a model with l breakpoint, each of the l+1 regimes is tested for an additional breakpoint using the supF(0,1) in each of the partitions. If the null of 0 breaks is rejected in at least one of the l+1 partitions, then it establishes that l+1 breaks are statistically significant. At each test step, the l breakpoints under the null are obtained by global minimisation of the sum-of-squared residuals. Yao (1988) showed that the number of breaks that minimises the Schwarz criterion is a consistent estimator of the true number of breaks in a breaking mean model. Liu, Wu, and Zidek (1997) propose use of modified Schwarz criterion (LWZ) for determining the number of breaks in a regression framework (Model 5). | Table 6: Summary of Results | | Country/Model | Model 1 | Model 2 | Model 3 | Model 4 | Model 5 | | Bangladesh | 1 | 1 | 2 | 1 | 2 | | | (2006) | (2006) | (2003, 2011) | (2006) | (2003, 2011) | | Cambodia | 1 | 1 | 1 | 1 | 1 | | | (2011) | (2011) | (2011) | (2011) | (2011) | | China | 2 | 2 | 2 | 2 | 2 | | | (2003, 2010) | (2003, 2010) | (2003, 2010) | (2003, 2010) | (2003, 2010) | | India | 2 | 2 | 2 | 2 | 2 | | | (2002, 2012) | (2002, 2012) | (2002, 2012) | (2002, 2012) | (2002, 2012) | | Turkey | 1 | 1 | 2 | 1 | 2 | | | (2004) | (2004) | (2002, 2009) | (2004) | (2002, 2009) | | Vietnam | 1 | 1 | 1 | 1 | 1 | | | (2006) | (2006) | (2006) | (2006) | (2006) | VI.3 Results The results from the above listed 5 models are summarised in Table 6. For China, all the 5 models point to two structural breaks, in 2003 and 2011, respectively. While China was increasing its apparel exports to EU annually by US$ 580.4 million between 1994-2002 on average, it saw a structural shift in 2002-03, following which its apparel exports grew at a much faster pace as compared to the previous period. After 2002-03, China’s apparel exports grew by US$ 4566.2 million, annually. However, it witnessed another structural break in 2009-10 following which its apparel exports to EU have been in contractionary mode (Table 7). | Table 7: Rate of Increase in Apparel Exports of China and Turkey | | China | Turkey | | Period | Slope | Period | Slope | | 1994-2002 | 580.4 | 1994-2001 | 215.6 | | 2003-2009 | 4566.2 | 2002-2008 | 775.0 | | 2010-2018 | -1187.1 | 2009-2018 | 82.1 | Regarding Turkey, while models 1, 2 and 4 suggest a single break in 2004, models 3 and 5 suggest two breaks in 2002 and 2009, respectively. Literature including Bai and Perron (2003), recommends use of double maximum procedure used in Model 3 to estimate the number of breaks in case of conflict between different models. Following the breakpoint estimation of model 3, we find that Turkey too witnessed an increase in its growth rate of apparel exports to EU from 2002, but the exports have stagnated since 2008. In case of Bangladesh too we have found divergence between the models. The model 3 suggests two breakpoints at 2003 and 2011, respectively. The presence of two breakpoints is further confirmed by using the known breakpoint location testing. Sensitivity analysis also suggests that single breakpoint models (Model 1, 2 and 4) are sensitive to changes in significance and trimming percentage, thus lending further support to presence of two breakpoints. Bangladesh more than tripled its rate of export quantum after 2003, which again doubled post 2011 (Table 8). In case of Cambodia, there is unanimous support for a single structural break in 2010. While Cambodia was a marginal player prior to 2010, it has rapidly expanded since and is among the fastest growing exporter of apparels to EU not just in percentage terms but also in absolute terms. In case of India, all models point towards two structural breaks in 2002 and 2012, respectively. While India rapidly expanded its textile exports after 2002, with its annual incremental quantum of apparel exports in line with Bangladesh and Turkey. India, however, has witnessed stagnation post 2012 while countries like Bangladesh, Cambodia and Vietnam have continued to grow (Table 9). | Table 8: Rate of Increase in Apparel Exports of Bangladesh and Cambodia | | Bangladesh | Cambodia | | Period | Slope | Period | Slope | | 1994-2002 | 191.9667 | 1994-2010 | 63.09559 | | 2003-2010 | 665.6905 | 2011-2018 | 489.1786 | | 2011-2018 | 1115.833 | | |
| Table 9: Rate of Increase in Apparel Exports of India and Vietnam | | India | Vietnam | | Period | Slope | Period | Slope | | 1994-2001 | 11.86905 | 1994-2006 | 38.65734 | | 2002-2011 | 520.9636 | 2006-2018 | 257.6099 | | 2012-2018 | 98.96429 | | | In case of Vietnam, a single structural break is found in 2006. A second structural break may be present in 2012 but sensitivity analysis suggests it to be not statistically significant. Interestingly, accepting the second structural break shows that Vietnam has actually increased its pace of apparel exports to EU post 2012. This implies that Vietnam has continued to remain competitive despite heightened competition from Bangladesh and Cambodia possibly owing to better integration in global value chains, higher competitiveness and better capture of space vacated by China. From the above analysis we can see that the structural breaks observed in the apparel exports of various countries can be broadly explained by the policy changes. Many countries including India, Bangladesh, China and Turkey experienced a structural break around the year 20022, following which they witnessed rapid expansion of apparel exports. This can be attributed to the fact that many major importers of textiles & clothing waited until 2002 (Phase 3 of MFA) to eliminate quotas on many items where the quotas were binding (Bhattacharya & Elliott (2005), Hudson et al. (2010)). Further, Europe’s EBA program was introduced at similar time, thereby accounting for the impact of policy change to translate into actual economic performance along with the window of probability associated with any econometric analysis, it can be safely interpreted that introduction of EBA programme had an impact on the export performance of the countries in question. Similarly, Vietnam’s structural break in 2006 and the rapid expansion since can be attributed to phase out of MFA in 2005. The relaxation of rules of origin specifications under the EBA scheme of EU in 2011 explains the break point observed in case of Cambodia and Bangladesh in 2011. These countries benefitted due to this policy change as they could import inputs and focus on the CMT model to rapidly expand apparel production for exports to the EU market. At the same time this has rendered India, which is not a beneficiary of EBA, less competitive as confirmed by the breakpoint for India in 2012 leading to stagnation in apparel exports to EU. Thus, the econometric analysis provide a support to the hypothesis that the evolution of tariff structure faced by India vis-à-vis its competitors has played an important role in determing the performance of apparel exports. VII. Conclusion and Way Forward Apparel exports constitute a large share of India’s textile exports and have strong backward linkages with the textile sector. However, textile exports, particularly apparel exports have seen muted growth in recent years. This article tries to analyse this phenomenon and finds merit in increased competition from our competitors. Euro area which is the major destination of India’s apparel exports has seen increasing footprint of other countries including Bangladesh and Cambodia, which have benefitted from duty free access to the EU market under its EBA programme. They have successfully adopted CMT model of production to focus on apparel production while sourcing the fabrics from other countries. The relaxation in the EU’s rule of source of origin in 2011 and the subsequent spurt in apparel exports from these countries supports this hypothesis. Therefore, India needs to actively pursue Free Trade Agreements with its major export destinations - EU, US - to prevent competitive disadvantage it currently faces due to tariff free access to its competitors. With Vietnam having signed a FTA with EU in 2019 (Vietnam – EU Comprehensive Partnership and Cooperation Framework Agreement), the competition is only expected to intensify for India. Further, Vietnam which faces similar tariff structure as India in EU has continued to expand its apparel exports while India’s apparel exports have stagnated reflecting some underlying issues being faced by the apparel exporters in India. Indian apparel industry is dominated by cotton, with cotton apparels contributing to more than 70 per cent of the apparel exports. However, the global apparel consumption is well diversified across fibres. Therefore, there is a need for India to develop design and production capabilities in other fibres. This would also allow India to establish itself in growing niche segments like wearable electronics and embedded sensor apparels. The recently introduced Production Linked Incentive (PLI) scheme for textiles, specifically aimed at boosting the production of man-made fibre (MMF) fabric, MMF apparel and technical textiles is a step in the right direction. With a large proportion of production capacity being in micro, small and medium enterprises there is a need to address issues related to credit availability and input tax credit and tax refunds under Goods & Services Tax structure to revitalise the sector. Introduction of Scheme for Rebate of State and Central Taxes and Levies on Export of Garments and Made-ups (RoSCTL) in March 2019 by the Ministry of Textiles to rebate embedded state and central taxes and levies on garments and made-ups is a welcome move that is expected to enhance competitiveness of Indian apparel exports. The recently launched Samarth scheme by the Ministry of Textile can also help to improve competitiveness by improving the labour productivity of the workers in textile industry. High transportation cost owing to wider geographical spread, high inland transportation cost and major production areas situated inland also contribute to higher cost of Indian apparel exports vis-à-vis competitors. Therefore there is a need to not only improve the transportation infrastructure but also promote cluster based approach as aimed under the Comprehensive Powerloom Cluster Development Scheme. While the Amended Technology Upgradation Fund Scheme (ATUFS) has been introduced since 2016 to provide capital investment subsidy, there is a need to further encourage FDI in the sector. This would provide necessary resources to upgrade the equipment and adopt modern technologies and also help to integrate Indian textile sector into the global value chains. The PM-MITRA (Mega Integrated Textile Region and Apparel) parks scheme under which seven integrated textile parks are to be setup in the country will help develop the integrated textile value chain. It is also expected to attract cutting edge technology and boost FDI and local investment in the sector. References : Adhikari, R., & Weeratunge, C. (2006): “Textiles and Clothing Sector in South Asia: Coping with Post-Quota Challenges”, South Asian Yearbook of Trade and Development 2006, Chapter 4, pp. 109-145. New Delhi, India: CENTAD. Andrews, D. W. K. (1993): “Tests for Parameter Instability and Structural Change with Unknown Change Point”, Econometrica, 61(4), 821. Anthony, Anoo & Joseph, Mary. (2014). The Indian Textile Industry: Some Observations. 10.1057/9781137444578_4. Audet, D. (2004): “A New World Map in Textiles and Clothing”, Policy Brief. Organisation for Economic Co-operation and Development (OECD). Retrieved from http://www.oecd.org/dataoecd/43/14/33824605.pdf. Bai, J. (1997): “Estimating Multiple Breaks One at a Time”, Econometric Theory, 13(3), 315–352. Bai, J., & Perron, P. (1998): “Estimating and Testing Linear Models with Multiple Structural Changes”, Econometrica, Vol. 66, p. 47. Bai, J., & Perron, P. (2003): “Computation and Analysis of Multiple Structural Change Models”, Journal of Applied Econometrics, 18(1), 1–22. Balassa, Bela (1965): “Trade Liberalisation and “Revealed” Comparative Advantage”, The Manchester School 33: pp. 99–123. Bhattacharya, D., & Elliott, K. (2005): “Adjusting to the MFA Phase-Out: Policy Priorities”, Retrieved from www.cgdev.org Brenton, Paul; Hoppe, Mombert, (2007): “Clothing and Export Diversification : Still a Route to Growth for Low-Income Countries?” Policy Research Working Paper; No. 4343. World Bank, Washington, DC. © World Bank. https://openknowledge.worldbank.org/handle/10986/7334 License: CC BY 3.0 IGO.” Chaudhary, Asiya (2011): “Responsiveness of the Indian Textiles Exporters to the Phase Out of Multi Fiber Agreement (MFA)”, Far East Journal of Psychology and Business, 2011, vol. 4, pp. 38-56, August. Chaudhary, Asiya (2016): “Revealed Comparative Advantage Index: An Analysis of Export Potential of Indian Textiles Industry in the Post MFA Period”, American Journal of Economics 2016, 6(6): pp. 344-351. Chadha, R., Pohit, S., Stern, R. M., & Deardorff, A. V. (1999): “Phasing out the Multi-Fibre Arrangement: Implications for India”, Global Trade Analysis Project (GTAP) at Purdue University. Chen, W., Keung, C., Lau, M., Boansi, D., & Bilgin, M. H. (2017): “Effects of Trade Cost on the Textile and Apparel Market : Evidence from Asian Countries”, The Journal of The Textile Institute, 108:6, 971-986, DOI: 10.1080/00405000.2016.1206459. Chow, G. C. (1960): “Tests of Equality Between Sets of Coefficients in Two Linear Regressions”, Econometrica (Vol. 28). Debapriya Bhattacharya and Mustafizer Rahman (2000): “Experience with Implementation of WTO-ATC and Implications for Bangladesh”, CPD Working Paper 7, Centre for Policy Dialogue (CPD). Dhiman, Rahul, and Manoj Sharma (2017): “Productivity Trends and Determinants of Indian Textile Industry: A Disaggregated Analysis”, International Journal of Applied Business and Economic Research 15, pp. 114–24. Exim Bank: Research Brief. (2005): “Textile Exports: Post MFA Scenario Opportunities and Challenges”, No.11, February, www.eximbankindia.com. pp. 1-4. Gereffi, G. (1999): “International Trade and Industrial Upgrading in the Apparel Commodity Chain”, Journal of International Economics, 48(1), pp. 37-70. Gupta GK and Khan MA (2017): “Exports Competitiveness of the Indian Textile Industry during and after ATC”, Journal of Textile Science and Engineering. Habib, M. R. I. (2009). “Backward Linkages in Readymade Garment Industry of Bangladesh: Appraisal and Policy Implications”. Journal of Textile and Apparel, Technology and Management, 6(2), 1–11. Hashim, Danish A. (2005): “Post-MFA: Making the Textile and Garment Industry Competitive”, Economic and Political Weekly 40: pp. 117–27. Hudson, Darren & Ethridge, Don E. & Mutuc, Maria Erlinda M. (2011): “Lessons Learned from the Phase-out of the MFA: Moving from Managed Distortion to Managed Distortion”, Estey Centre Journal of International Law and Trade Policy, Estey Centre for Law and Economics in International Trade, vol. 12(1), pages 1-15, May. Kannan, Elumalai (2018): “India’s Comparative Advantage in Export of Textiles and Apparel Products”, In A Study of India’s Textile Exports and Environmental Regulations. Edited by K. S. Kavi Kumar. Singapore: Springer, pp. 45–60. Kathuria, Lalit Mohan (2013): “Analysing Competitiveness of Clothing Export Sector of India and Bangladesh: Dynamic Revealed Comparative Advantage Approach”, Competitiveness Review: An International Business Journal 23, pp.131–57. Kathuria, Lalit Mohan (2018): “Comparative Advantages in Clothing Exports: India Faces Threat From Competing Nations”, Competitiveness Review: An International Business Journal 28, pp. 518–40. Kathuria, Sanjay, and Anjali Bhardwaj (1998): “Export Quotas and Policy Constraints in the Indian Textile and Garment Industries”, Policy Research Working Paper Series 2012. Washington: The World Bank. Katti, V., Subir Sen (1999): “MFA Phasing out and Indian Textiles Industry, Select Issues for Negotiation”, Foreign Trade Review. Vol.34(3-4) pp.102-120, October. Liu, J., Wu, S., & Zidek, J. V. (1997): “On Segmented Multivariate Regression”, Statistica Sinica, Vol. 7, pp. 497–525. Institute of Statistical Science, Academia Sinica. Lopez-Acevedo, Gladys, and Raymond Robertson, (2016). “Stitches to Riches? Apparel Employment, Trade, and Economic Development in South Asia. Directions in Development”. Washington, DC: World Bank. doi:10.1596/978-1-4648-0813-5. License: Creative Commons Attribution CC BY 3.0 IGO. Mehta, R. (1997): “Trade Policy Reforms, 1991-92 to 1995-96: Their Impact on External Trade”, Economic and Political Weekly, pp. 779-784. Minian, I., Martinez, A. & Ibanez, J. (2016). “Technological Change and the Relocation of the Apparel Industry.” Problemas del Desarrollo. Revista Latinoamericana de Economía, 48(88), 139-164. Nordas, Hildegunn Kyvik (2004): “The Global Textile and Clothing Industry Post the Agreement on Textiles and Clothing”, Discussion Paper No. 5. Geneva: World Trade Organisation. Panagariya, A. (2018): “Job: Apparel Industry Model holds the Key for India’s Job Creation Requirements - The Economic Times”, Retrieved November 6, 2020, from The Economics Times website: https://economictimes.indiatimes.com/news/economy/policy/apparel-industry-model-holds-the-key-for-indias-job-creation-requirements/articleshow/62514682.cms Pfohl, H.C. and Shen, X., (2008). “Apparel Supply Chain Between Europe and China. A Guide to Apparel Sourcing and Distribution in China.” Darmstadt. Quandt, R. E. (1960): “Tests of the Hypothesis That a Linear Regression System Obeys Two Separate Regimes”, Journal of the American Statistical Association, 55, 324–330. Setyorini, D. and Budiono (2017): “The Impact of Tariff and Imported Raw Materials on Textile and Clothing Export: Evidence from the United States Market”, Working Paper in Economics and Development Studies Department of Economics, Padjadjaran University. Siddiqi, H.G.A. (2005). “The Ready Made Garment Industry of Bangladesh”. 2nd Edition, The University Press Limited, Dhaka. S. Valarmathi and B. Rajasekaran (2019): “Evolution and Growth of Vietnam Textile Industry”, The International Journal of Analytical and Experimental Modal Analysis Volume XI, Issue IX, September. Thoburn, J. (2009): “The Impact of the World Garment Recession on the Textile and Garment Industries of Asia”, Seoul (Korea) Workshop: November 13-15: United Nations Industrial Development Organization (UNIDO). Varukolu, Venu. (2007) “Technology Adoption of Indian Garment Manufacturing Firms” (2007). LSU Master’s Theses. 3605. https://digitalcommons.lsu.edu/gradschool_theses/3605. Yao, Y. C. (1988): “Estimating the Number of Change-points via Schwarz’ Criterion”, Statistics and Probability Letters, 6, 181–189.
| Appendix 1: Tariff faced by Apparel Exports in EU | | China | | Tariff Rate | Number of Tariff Lines | | 0.063 | 8 | | 0.065 | 5 | | 0.076 | 1 | | 0.080 | 20 | | 0.089 | 8 | | 0.100 | 4 | | 0.105 | 13 | | 0.120 | 383 | | Grand Total | 442 |
| India & Vietnam | | Tariff Rate | Number of Tariff Lines | | 0.050 | 8 | | 0.052 | 5 | | 0.060 | 1 | | 0.064 | 20 | | 0.071 | 8 | | 0.080 | 4 | | 0.084 | 13 | | 0.096 | 383 | | Grand Total | 442 |
| Bangladesh, Cambodia and Turkey | | Tariff Rate | Number of Tariff Lines | | 0 | 442 |
|