India enters Samvat 2079 having crested the third wave of the pandemic with economic activity returning to speed in several sectors. These gains are, however, at risk from disruptive spillovers from geo-political hostilities as increasingly evident in inflation prints, tightening financial conditions and a terms of trade shock accompanied by portfolio outflows. India faces these challenges with improving fundamentals and strong buffers. Going forward, spurring private investment remains a key thrust area for sustaining growth on a durable basis. Introduction The global economy is in the throes of a geo-political cataclysm, with heightened uncertainty obscuring the outlook. Choked supplies and mounting commodity prices, especially of food and energy, have stoked inflationary pressures, exacerbating policy trade-offs for central banks. Emerging economies are experiencing disruptive spillovers in terms of tightening financial market conditions, besides capital outflows and currency depreciations. Given these unsettled conditions, investors sporadically seek the shelter of safe-haven assets alternating between phases of risk-on activity with every positive news being priced in as a cessation of war. Consequently, financial markets are on edge. India too is experiencing tremors from these developments. The fallout of the war and retaliatory sanctions is already evident in inflation prints and balance of payments developments. Nonetheless, some domestic factors provide some measure of comfort. As India enters Samvat 20791, the third wave seems to be well behind us and, with the removal of all restrictions alongside a broadening of vaccination coverage, economic activity is returning to speed. Most sectors of the economy are reaching or have exceeded pre-pandemic levels. Notably, bank credit has gathered pace and the job market is gathering steam. There is an acceleration in the travel and hospitality sectors. The construction and real estate sector have also registered a pick-up. The Resolution of the monetary policy committee (MPC) of April 8, 2022 marks a turning point in the conduct of monetary policy in India. As pointed out in the statement of Governor Shri Shaktikanta Das on the same day, the sharp escalation in geopolitical tensions has significantly changed the external and domestic landscape. Global Inflation is running well above targets in major countries and sizeable adverse impacts on output are expected across geographies. Taking stock of recent developments and the evolving outlook, the MPC decided to keep the policy rate unchanged. Several noteworthy features distinguish this status quo, however. First, the forecasts – which function as the intermediate targets of monetary policy – have undergone significant shifts, with the average inflation projected for 2022-23 raised by 120 basis points (to 5.7 per cent) and growth lowered by 60 basis points (to 7.2 per cent) relative to the February 2022 configuration, mirroring the impact of the geopolitical conflict. Second, in consonance with this outlook, the MPC reprioritised price stability among its objectives “to ensure that inflation remains within the target going forward, while supporting growth”. Third, the MPC decided to remain accommodative, but to focus “on withdrawal of accommodation” in sync with the projections and the reordering of policy objectives. Fourth, the RBI announced innovative refinements in the operating procedure of monetary policy in order to implement the MPC’s decision, as set out in Section IV. Before we turn to global and domestic developments, an area of concern that we would flag is the currently raging heat wave. Temperatures are breaking all-time records in many pockets of the country. The country as whole saw the hottest March (average maximum temperature) in the last 122 years. As per the India Meteorological Department (IMD), this unseasonal phenomenon is believed to have occurred due to advance formation of anti-cyclonic circulations in Western India and scanty rains in the Central States. The IMD has forecasted that these heat waves are likely to continue beyond mid-April. The increasing frequency of these unseasonal fluctuations reveals the impact of climate change and underscores the urgency of reductions in carbon footprints and integrating the relevant climatic variables in the development strategies. Set against this backdrop, the remainder of the article is structured into four sections. Section II covers the rapidly evolving developments in the global economy. An assessment of domestic macroeconomic conditions is set out in Section III. Section IV encapsulates the financial conditions in India, while the last Section sets out concluding remarks. II. Global Setting Geo-political hostilities and their spillovers are weighing heavily on global economic activity. International commodity prices, which were already on an upward spiral amidst demand-supply imbalances, hardened precipitously in early March 2022 and remained volatile at elevated levels thereafter. Reflecting the pass-through of high commodity prices, headline inflation in many advanced economies spiked further to new record levels forcing central banks to hasten unwinding of accommodative monetary policy stances despite rising risks to growth. In its Interim Economic Outlook released on March 17, 2022 the OECD projects global growth to be lower by over 1 percentage point in 2022 from its December forecast of 4.5 per cent. This downward revision presumes that the commodity and financial market shocks seen in the first two weeks of the conflict persist for at least a year. Reflecting similar concerns, the United Nations Conference on Trade and Development (UNCTAD)’s Trade and Development Report released on March 24, 2022 projects that global growth would reduce by 1 percentage point to 2.6 per cent from its October forecast of 3.6 per cent2, amounting to approximately US$1 trillion foregone income. This is premised on the assessment that the sanctions and supply chain disruptions will last through 2022 even if the war ends. Among high frequency indicators, the global composite Purchasing Managers Index (PMI) moderated to 52.7 in March from 53.5 a month ago, suggesting loss of momentum on escalated geopolitical tensions and other lingering headwinds from strained supply chains and COVID-led disruptions (Chart 1). Both services and manufacturing PMIs eased, with the latter slipping to an 18-month low as growth in output and new orders slowed while new export business contracted. North America and Europe remained bright spots, while China and Russia registered contraction in their composite PMIs, the latter marking the steepest decline since May 2020. 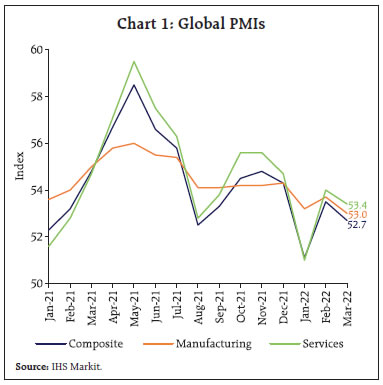
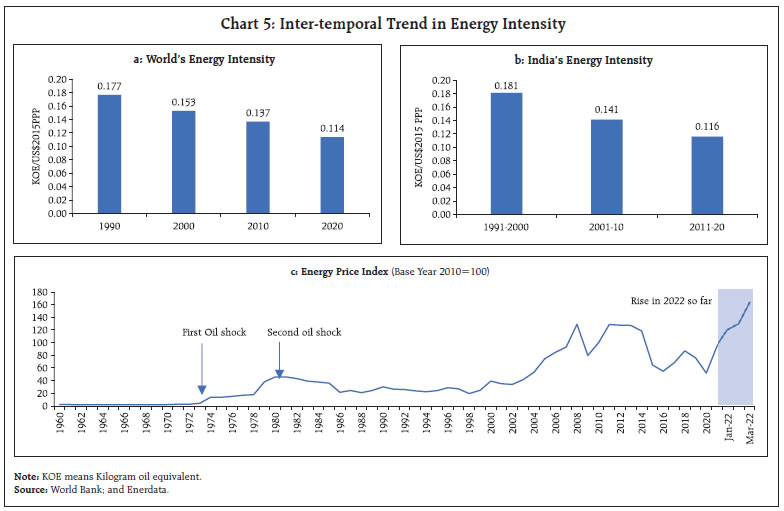
 Monthly data from the CPB World Trade Monitor point to deceleration of the growth in world trade volume to 5.5 per cent (y-o-y) in January 2022 following three consecutive months of acceleration (Chart 2a). Overall, emerging economies including China showed negative m-o-m growth in both imports and exports (-2.7 per cent and -1.5 per cent), but trade in the Euro area accelerated. The UNCTAD has estimated a likely 5-8 per cent increase in the Asia-Europe ocean freight demand, which could further exacerbate price pressures. Early signs are already visible in a 400 per cent rise in the Black Sea–Med Aframax and Suezmax tanker freight rates. The Baltic Dry Index, which remained high in March 2022 amidst renewed supply disruptions, has eased somewhat in April so far (up to April 10) (Chart 2b). The Bloomberg Commodity Index hit an 8-year high in early March, with prices soaring across the board on war-induced supply shocks (Chart 3a). Since mid-March, however, it has been exhibiting two-way movements. Crude oil prices rocketed to a 14-year high of US$ 133 per barrel in the first week of March (Chart 3b). Although they eased subsequently, high volatility has characterised their movements. The announcement by the US of a release of 180 million barrels from its strategic oil reserves capped gains towards end-March. Brent crude prices are trading above US$100 per barrel, registering 31.6 per cent gain in 2022 so far (up to April 10). Basking in safe haven and inflation hedge appeal, gold prices have also rallied since February. Although prices consolidated in the latter half of March on hardening bond yields, the yellow metal ended the month with net gains (Chart 3c). Base metal prices too exhibited a similar trend, with nickel, aluminum and palladium – key exports of Russia-Ukraine – rising the most. The FAO food price index at 159.3 in March marked it highest monthly jump on record to hit an all-time high. The increase was seen across the board, with vegetable oil and cereals sub-indices exhibiting the maximum acceleration (Chart 3d). 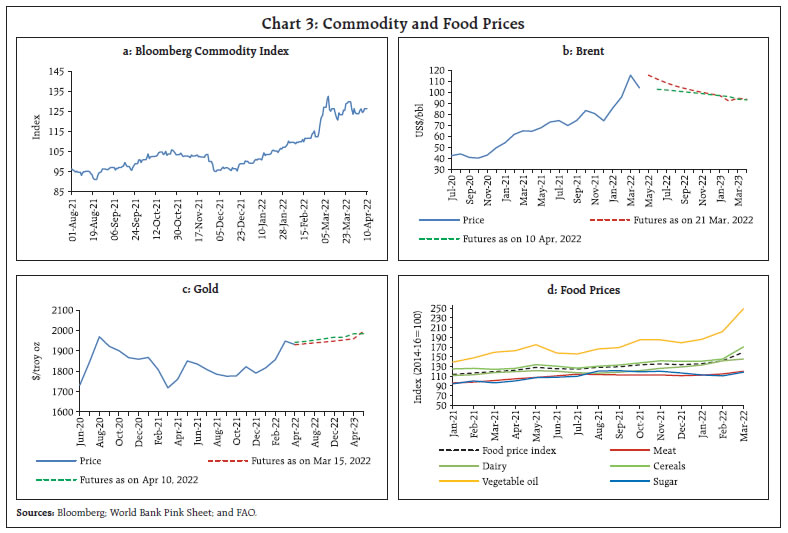 Inflation continues to mount, while turning more entrenched and broad-based across economies. Ongoing geopolitical crisis and the fear of prolonged supply disruptions have accentuated inflationary risks. Accordingly, the OECD has revised up projection for global inflation by approximately 2.5 percentage points for 2022 from its December forecast of 4.2 per cent. Euro area inflation jumped to a historical high of 7.5 per cent (y-o-y) in March from 5.9 per cent in February as energy and food prices accelerated sharply more so on war-led disruptions (Chart 4a). The US personal consumption expenditure (PCE) inflation inched up to a new record of 6.4 per cent in February, reflecting increases in energy and food prices. Core PCE inflation also remained elevated at a 39-year high. In the UK, inflation scaled a new record of 6.2 per cent in February as price pressures turned more broad-based, with rising energy, food and durable goods prices providing the impetus. Among BRICS economies, inflation in Brazil at 11.3 per cent in March remained in double digits for the seventh consecutive month, while in China, it rose to a three-month high of 1.5 per cent (Chart 4b). In Russia, following sanctions and a sharp depreciation in rouble, inflation jumped to a double-digit figure of 16.7 per cent in March – first time since 2015 – from 9.2 per cent in February. Globally, energy intensity has shown a downtrend, implying increased efficiency in its usage over the years (Chart 5a).3 India’s energy intensity has also recorded a secular decline, implying inter alia, that structural changes are underway in the output structure of the economy (Chart 5b). 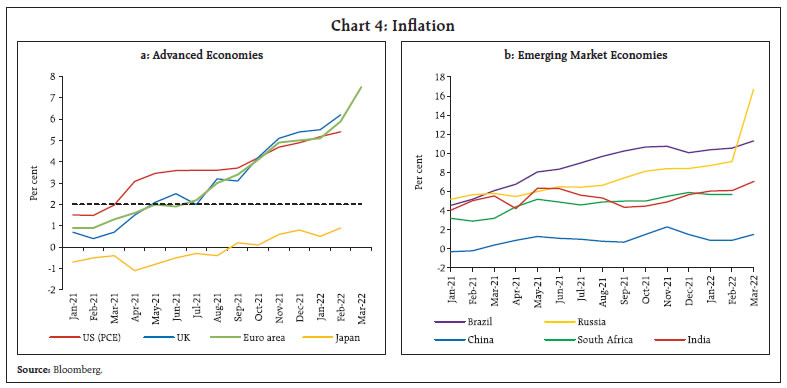
 Global financial markets were hit by bouts of turbulence as heightened war-induced uncertainties and policy normalisation kept investors on edge. Global equity markets, plummeted by mid-March, but they recouped losses and eked out a monthly gain of 2 per cent in March (Chart 6a). The MSCI world equity index is in the red on a year-to-date basis, with most stock indices in both advanced economies (AE) and emerging market economies (EME) clocking negative returns in 2022 so far (up to April 10). Among AEs, the US S&P stock indices ended March with net gains as upbeat economic data and ceasefire optimism bolstered risk-on sentiments, offsetting early March sell-offs. EME stocks underperformed their AE counterparts, with Chinese stock indices remaining the worst performers in March as shutdown of various cities and manufacturing facilities amidst rising infections weighed on growth prospects. In the bond markets, the 10-year US treasury yields, which had undergone a transient softening on flight to safety, hardened from mid-March. With markets pricing in faster rate hikes, short-term yields leaped, causing a transient inversion in the yield spread in the 10-year minus 2-year segment (Chart 6b). In the currency markets, the US dollar exhibited two-way movements since mid-March. Fluctuations in market sentiments can impart high volatility (Chart 6c). Concomitantly, the MSCI Emerging Markets Currency Index rebounded from steep declines in the first half of March, primarily underpinned by strengthening of a few major commodity exporters’ currencies and retrenchment in capital outflows in the later part of the month in EMEs (Chart 6d). 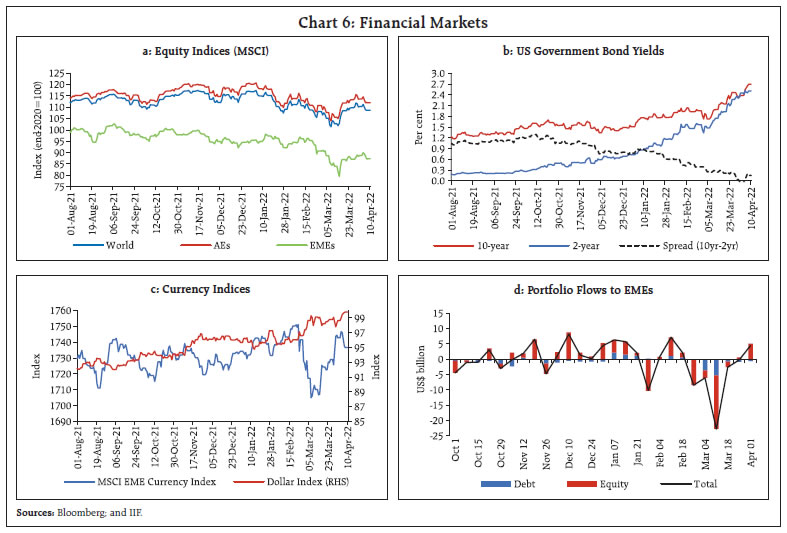 Globally, monetary policy actions and policies have been targeted at unwinding of stimulus and normalisation, albeit at differing paces. In its March meeting the US Fed, effected its first rate hike since December 2018, raising the target range for the Federal Funds rate by 25 basis points (bps) to 0.25-0.5 per cent while also undertaking balance sheet reduction. The Bank of England continued with monetary policy tightening, raising its policy rate by 25 bps in March – the third such hike in a row, taking the benchmark interest rate to 0.75 per cent. Among other AEs, Norges Bank hiked rates again by 25 bps after two rate hikes in 2021. Among EMEs, Brazil raised its policy rate by another 100 bps, taking the total cumulative increase to 975 bps in one year of its tightening cycle. South Africa raised its rate for the third consecutive time by 25 bps, cumulating the total increase to 75 bps since November 2021. Among other EMEs, Chile, Hungary, and Mexico raised their benchmark rates by 150 bps, 100 bps, and 50 bps, respectively, in March. China and Turkey, on the other hand, continued to maintain status quo in their second and third consecutive meetings, respectively, in March. Bank of Russia after an emergency rate hike of 10.5 percentage points in late-February, reduced its policy rate by 300 bps to 17 per cent in an unscheduled meeting on April 08, 2022 following signs of stabalisation in their financial system (Chart 7). The global outlook remains hostage to the spillovers from geo-political forces. Recent surge in risk-off sentiments in the wake of heightened volatility has embroiled financial markets with implications for global economic activity, going forward. Moreover, with strained supplies and concomitant bulging commodity prices, inflation figures are shooting up to new heights, thus putting the policymakers in a conundrum of quelling the ratcheting inflationary pressures without numbing the growth impulses with higher interest rates. III. Domestic Developments The domestic macroeconomic conditions have begun to improve with the rapid retreat in COVID-19 infections and the resumption of economic activity in normal modes of functioning. Daily infections plunged to 861 on April 11, 2022 from a peak of 3.47 lakh on January 20, 2022 (Chart 8a). The daily positivity rate plummeted to 0.32 per cent from 17.94 per cent during the same period. Over 84 per cent of the adult population (80 crore) and 3.9 crore plus children in the 15-18 year age group are fully vaccinated, while 2.2 crore children in the 12-14 year age group have been inoculated with the first dose. The total vaccination doses have crossed 185 crore as on April 11, 2022 (Chart 8b). The Central government has removed all COVID-19 related restrictions, except face masks and hand hygiene4, since March 31, 2022. Mobility remains well above pre-Covid levels. Google mobility improved across all categories in April (till April 11, 2022), as compared to a month ago, surging above 50 per cent over the baseline numbers around grocery, pharmacy and parks (Chart 9a). Apple mobility index too recorded strong improvement in April Chart 9b). With the opening of services sector outlets, electricity generation picked up in April across all jurisdictions, surpassing pre-pandemic levels and the levels recorded a month ago (Chart 9c).
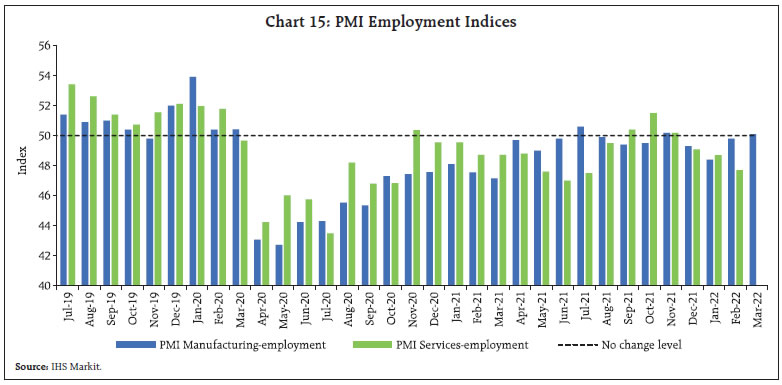
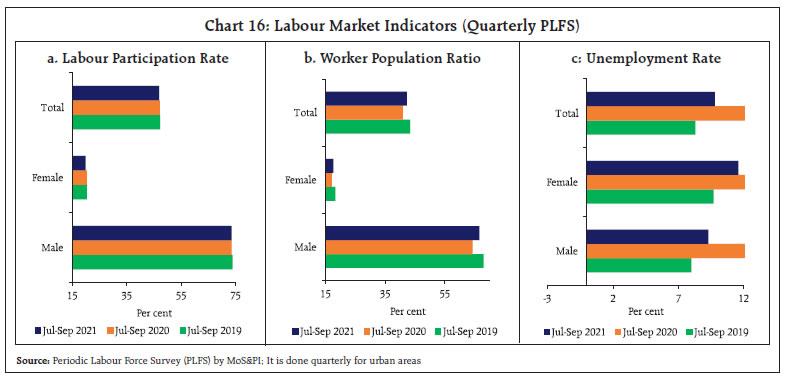
As an outcome of these developments, consumer sentiment improved sequentially in most States in March (Chart 10). Aggregate Demand Indicators of aggregate demand picked up in March 2022, with E-way bills recording a 48-month high and exceeding pre-pandemic levels by 37 per cent. The increase was led by intra-state e-way bills (Chart 11a). Toll collections remained upbeat in March, doubling from pre-pandemic levels for the fourth consecutive month (Chart 11b). Fuel consumption improved amidst price hikes as demand recovered. Aviation Turbine Fuel (ATF) and diesel consumption improved sequentially. But high fuel inflation led to moderation of petrol consumption (Chart 12a). Automobile sales remained muted in March, led by a dip in sales of two wheelers, even as wholesale dispatches of passenger vehicles from Original Equipment Manufacturers (OEMs) recorded an uptick with sustained demand momentum (Chart 12b). As per industry experts, sales of commercial vehicles are expected to be flat as diesel price hikes may dampen demand. Retail sales of automobiles inched up, led by an increase in the registrations of transport vehicles (Chart 12c). Maharashtra and Uttar Pradesh were the top two States in terms of vehicle registrations in March (Chart 12d). The electric vehicle segment continues to outperform other segments, but shortages in key raw materials like nickel are expected to raise input costs for electric vehicle (EV) batteries. Likewise, supplies of rare-earth metals and neon gas used in the production of semiconductor chips are vulnerable to disruptions. Within rural demand, tractor sales show strong sequential growth in March 2022 (Chart 12e). As per the household survey of the Centre for Monitoring Indian Economy (CMIE), the labour participation rate slipped from 39.9 per cent in February to 39.5 per cent in March 2022. The employment rate (worker population ratio) declined by 20 basis points, but the unemployment rate fell to 7.6 per cent in March from 8.1 per cent a month ago. While the unemployment rate fell across rural areas by over a percentage point, it increased in urban areas (Chart 13a). Though most states witnessed a reduction in employment rates in March over February, states like Gujarat, Maharashtra, Haryana and Odisha have shown a remarkable recovery and surpassed their pre-pandemic employment rates (Chart 13b).  CMIE’s employment statistics show that the total number of employed workers fell for the third consecutive month (Chart 14a). As per the category of occupation, number of businessmen and salaried workers fell between February and March, while the number of farmers and small traders increased. The labour force participation rate (LFPR) has inched closer to pre-pandemic levels across several states and in some it has even risen beyond (Chart 14b). PMIs show that employment conditions in manufacturing sector improved in March, as the index entered expansion after three months of contraction. PMI for services sector employment improved too after four successive months of decline (Chart 15). 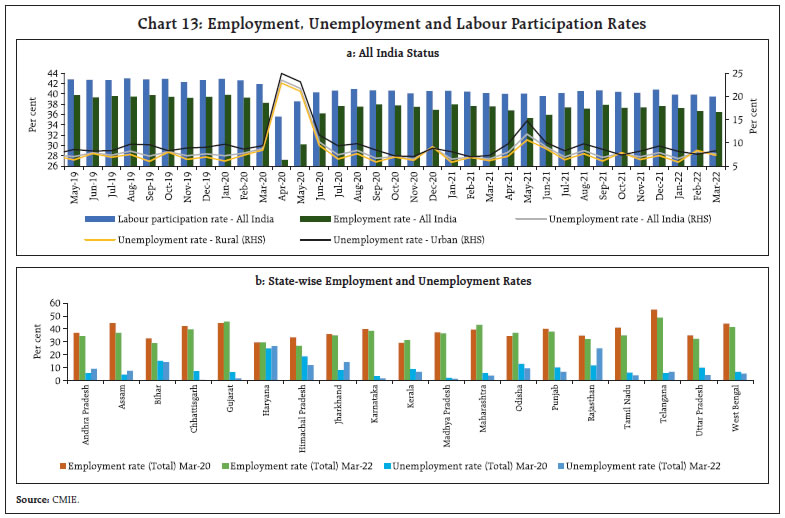 The latest available results from the Periodic Labour Force Survey (PLFS) by the Ministry of Statistics and Programme Implementation (MoS&PI) for April-September 2021 period allows an evaluation of the impact of the two waves of the pandemic on the labour market. A comparison of major labour market indicators such as the labour participation rate (LPR), worker population ratio (WPR) and the unemployment rate (for 15 years and above category) across July-September period of 2019 and 2021 shows that the labour market has recovered substantially, but the recovery was incomplete as unemployment rate remains high. The labour participation and worker population ratio are marginally behind their pre-covid September 2019 levels. Although all indicators fare worse for the female labour force, the impact of the pandemic has been equally worse across genders (Chart 16). Pandemic has significantly altered the labour market and industry dynamics across the globe. As the Industry 4.05 is gaining momentum, there is a case for re-examination of the impact of robotics on productivity and labour share in GDP (Annex). 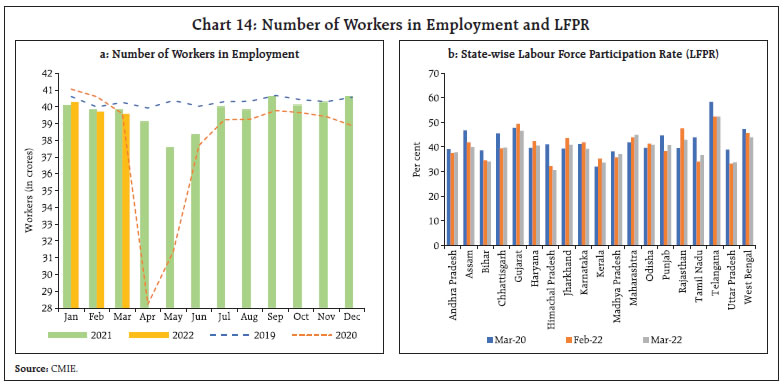
 India’s merchandise exports reached a monthly historic high level of US$ 40.4 billion in March 2022, reaching US$ 417.8 billion for the whole year as against the target of US$ 400 billion set for 2021-22 (Chart 17). Multiple initiatives including product diversification to export hi-tech goods, Geographic Indicator (GI) products, roll out of export incentives schemes such as Remission of Duties and Taxes on Export Products (RoDTEP) and Rebate of State and Central Taxes and Levies (RoSCTL) have contributed to the robust export performance. The exports of major commodities, viz., engineering goods, petroleum products, chemicals and gems and jewellery, accounting for more than half of the exports, witnessed robust expansion during 2021-22 (Chart 18). 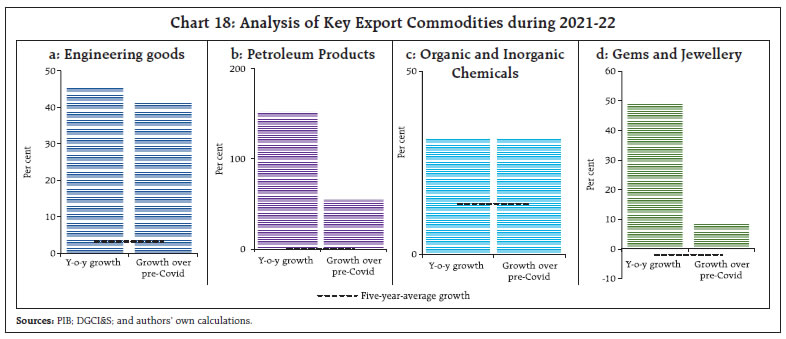
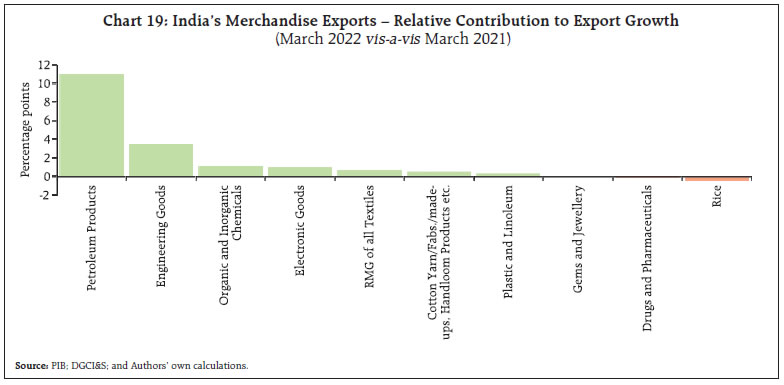 8 out of 10 major commodity groups accounting for more than 70 per cent of exports recorded an expansion over a year ago. Buoyant external demand for petroleum products, engineering goods and chemicals bolstered export growth (Chart 19). Engineering goods exports at US$ 10.4 billion crossed US$ 10 billion mark for the first time, aided by robust shipment of automobile exports. India has signed the Economic Cooperation and Trade Agreement (ECTA) with Australia on April 2, 2022, to enhance bilateral trade in goods and services to US$ 45-50 billion in the next five years from US$ 27.5 billion in 2021. The ECTA is expected to further bolster India’s merchandise export potential in textile and apparel, leather, and gems and jewellery (Chart 20). India’s direct trade exposure to Russia and Ukraine is limited - Russia accounts for 0.9 per cent and 1.5 per cent of India’s merchandise exports and imports, respectively, whereas Ukraine’s share in India’s exports and imports is miniscule to the tune of 0.1 per cent and 0.5 per cent, respectively. India’s trade exposure to Russian and Ukraine markets is limited to few commodities (Chart 21). Merchandise imports at US$ 59.1 billion in March 2022 remained above US$ 50 billion for the seventh consecutive month and registered a growth of more than 20 per cent on a y-o-y basis (Chart 22).
Import growth was broad-based and driven by higher demand for petroleum products, coal and electronic goods (Chart 23). Oil imports nearly doubled in March compared to a year ago, reflecting the increase in crude prices by 74.4 per cent y-o-y. Gold imports recorded an 8-month low value of US$ 1 billion in March 2022 due to a sequential rise in gold prices. India’s trade deficit widened to US$ 18.7 billion in March 2022 from US$ 13.1 billion in March 2021; however, it moderated on a sequential basis. On an annual basis, the merchandise trade deficit recorded an all-time high of US$ 192.4 billion during 2021-22 as against US$ 102.6 billion a year ago (Chart 24). 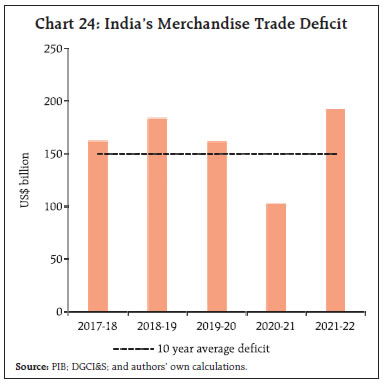
 During April-February 2021-22, the fiscal position of the Union government posted an improvement over previous years’ trend (Chart 25). As per latest available information, gross tax revenue of the Union government exceeded the budget estimates by ₹4.9 lakh crore in 2021-22. Total expenditure during April-February 2021-22 grew by 11.5 per cent over 2020-21, with capital expenditure and revenue expenditure recording a y-o-y growth of 19.7 per cent and 10.2 per cent, respectively. During April-February, capital outlay (capital expenditure net of loans and advances) recorded a y-o-y growth of 61.2 per cent. In order to meet the RE, however, capital expenditure in March 2022 will need to grow by 458.4 per cent y-o-y. In March 2022, GST collections recorded an all-time high of ₹1.42 lakh crore, breaching the previous high of ₹1.41 lakh crore achieved in January 2022. With this, the average monthly collection in 2021-22 stands at ₹1.24 lakh crore and the average monthly collection in Q4:2021-22 stands at ₹1.39 lakh crore (Chart 26). The revenue receipts of States posted a robust growth of 23.8 per cent through April-January 2021-22, as against a decline of 9 per cent a year ago, and have moved past their pre-pandemic levels of January 2020. This was reflected in the strong growth in both tax (including GST, sales tax, and states’ share in the Union’s gross taxes) and own non-tax revenues of the states.6 Grants-in-aid and contribution to the states from the centre dipped by 8.8 per cent in April-January 2021-22 y-o-y. Similarly, capital receipts of the States posted a sharp growth during the same period, but remained below their pre-pandemic levels. 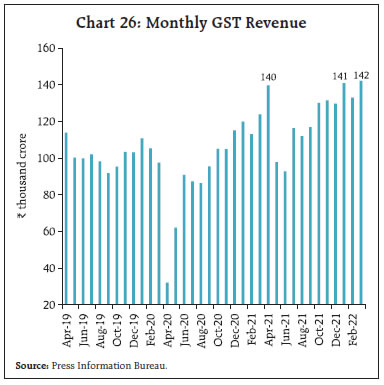 During April-January 2021-22, the revenue expenditure of States grew at 14.1 per cent over the same period a year ago. The sustained growth in the States’ capital expenditure during April-January 2021-22 after a sudden dip (a year ago), augurs well for a long-term growth through cascading effects of the fiscal multiplier in conjunction with the Union government’s push for capital investment (Chart 27). Buoyant growth of revenue and capital receipts, combined with moderate revenue expenditure growth, resulted in decline in both the gross fiscal deficit and the revenue deficit by 7.2 per cent and 45.4 per cent, respectively during April-January 2021-22 on a y-o-y basis. It is notable that the states are 33.3 per cent below their budgeted gross fiscal deficit this year so far, providing space for further increase in expenditure during the remaining part of the fiscal year. Aggregate Supply As per the first advance estimates (AE) released on March 28, 2022 horticulture production was pegged at over 333.3 million tonnes, which is higher by 2.0 per cent over the 1st AE and marginally lower than the final estimates for 2020-21 (Chart 28a). Production of vegetables - potatoes (-4.6 per cent); and tomatoes (-4.2 per cent) - declined, while onion production increased by 16.8 per cent due to increased acreage (17.9 per cent). The production of fruits also increased marginally over 2020-21. Summer or zaid season is a short intervening period between rabi and kharif starting from March till May. As on April 08, 2022, the total summer crop sown area reached 55.8 lakh hectare, 1.3 per cent lower than a year ago, mainly due to lower acreage under rice (Chart 28b). The total live storage in 140 major reservoirs as on April 07, 2022, was higher at 43 per cent of the full reservoir level (FRL) as compared to 40 per cent of FRL during the previous year. The current level of water stands higher than the last 10-year average of 34 per cent of FRL (Chart 29a).
Demand for employment under the Mahatma Gandhi National Rural Employment Guarantee Scheme (MGNREGS), remains lower than the levels witnessed a year ago, despite the lean agriculture season, indicating higher employment opportunities in the non-agriculture sectors. As of April 12, 2022, the overall procurement of rice during the ongoing kharif marketing season touched 50.6 million tonnes cumulatively, as against 47.1 million tonnes a year ago. The target for rice procurement in this complete season is set at 52.8 million tonnes. With record harvest of wheat, the procurement of wheat under the rabi marketing season has also commenced in some of the states with the target of 44 million tonnes set for this season. Free distribution of foodgrains (5 kg/month) under Pradhan Mantri Garib Kalyan Anna Yojana (PMGKAY) has been extended for another six months (April to September), with an additional outlay of ₹80,000 crore. Comfortable stock levels (7.2 and 1.4 times the buffer norms for rice and wheat, respectively) would auger well for this initiative. The global wheat supply has tightened in view of the ongoing geo-political crisis. The estimated exports from Russia and Ukraine, which accounted for 28 per cent of global wheat exports in 2020-21, has been revised down significantly. This, in turn, may trigger trade reallocation and demand rationing in the rest of the world. India, along with Australia, are expected to cater to a significant portion of the global demand gap with ample and competitively priced tradable surplus. With the similar variety of wheat produced in India as compared to Russia and Ukraine, and the record harvest being completed by March and April, India is expected to export a record 10 million tonnes of wheat this year (Chart 30). In the industrial sphere, the headline manufacturing PMI expansion of PMI at first use moderated to 54.0 in March 2022 from 54.9 in February, as companies reported softer expansions in new orders and production. The Future Output index fell below its long-run average to a two year low, amidst economic uncertainties caused by geopolitical risks (Chart 31a). The PMI services improved to 53.6 in March from 51.8 a month ago, recording the strongest rate of expansion since December 2021 and stretching an expansionary run to the eighth consecutive month. The Business Expectations Index (Future Activity Index) also improved marginally vis-à-vis February 2022 (Chart 31b). In the services sector, transport indicators recorded an expansion, with railways freight traffic increasing by 6.7 per cent (y-o-y) in March, despite a high base recorded last year (Chart 32a). An increase in freight traffic was recorded in coal even as iron-ore and cement declined on a high base a year ago. Cargo at major ports recorded an uptick in March, with cargo for all major commodities recording levels beyond or comparable to pre-pandemic figures. On a y-o-y basis, it recorded a contraction on a high base. In 2021-22, cargo increased by 7.1 per cent over the corresponding period a year ago. Over 2019-20, cargo recorded a compounded annual growth rate of 1.1 per cent (Chart 32b).
Activity in the construction sector picked up during February-March 2022, with cement production and steel consumption recording expansion over pre-pandemic levels (Chart 33). The sustained pick-up comes despite rising prices backed by demand stimulated by infrastructure activity in the economy. The Indian aviation sector continued to recover in March 2022. Daily domestic airport footfalls averaged 6.8 lakh per day – an expansion of 25.5 per cent over the preceding month. International airport footfalls too improved by 25.1 per cent sequentially, while in the cargo segment, domestic and international cargo grew by 5.4 per cent and 4.0 per cent, respectively. In the first ten days of April, domestic airport footfalls remained steady over the corresponding period in March. The Government of India decided to resume scheduled commercial international passenger services from March 27, which could boost the aviation sector in the upcoming months (Table 1).
Inflation Provisional CPI data for March 2022 released by the NSO on April 12, 2022 reveal that a positive price momentum (month-on-month change in prices in the current month) of around 100 bps in March, offset by favourable base effects (month-on-month change in prices a year ago) of around 10 bps, resulted in a sharp increase in headline inflation by close to 90 bps between February and March, i.e., from 6.1 per cent to 7.0 per cent (Chart 34a). Food and beverages inflation was the main driver, rising to 7.5 per cent in March from 5.9 per cent in February. In terms of sub-groups, inflation edged up in cereals, meat and fish, milk, edible oils, fruits, vegetables, sugar, spices and prepared meals. On the other hand, inflation softened in eggs, pulses and non-alcoholic beverages. CPI fuel inflation softened for the fifth consecutive month – from 8.7 per cent in February to 7.5 per cent in March – primarily due to moderation in LPG inflation. On the other hand, kerosene (PDS) inflation continued to increase sharply. Electricity prices remained in deflation in March. CPI fuel (weight of 6.84 per cent in the CPI basket) contributed around 7.3 per cent of headline inflation in February (Chart 34b). CPI inflation excluding food and fuel7 or core inflation edged up by 50 bps to 6.4 per cent in March from 5.8 per cent a month ago (Chart 34a). The increase was largely due to pressures emerging from personal care and effects, pan, tobacco and intoxicants, clothing and footwear, household goods and services, health and recreation and amusement. Inflation in housing, transport and communication and education sub-groups moderated. 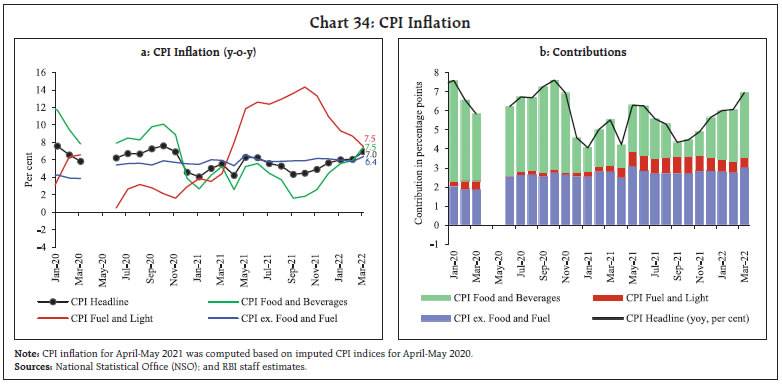 High frequency food price data from the Ministry of Consumer Affairs, Food and Public Distribution (Department of Consumer Affairs) for April so far (April 1-12, 2022) indicate some softening in rice prices even as wheat prices are firming up. Pulses prices registered correction, except for moong. In the case of edible oils, refined oils like soya, sunflower and groundnut oil continued to experience price pressures, while prices of mustard oil declined. Among vegetables, potatoes and onions witnessed price declines, while tomato prices have increased in April so far (Chart 35). 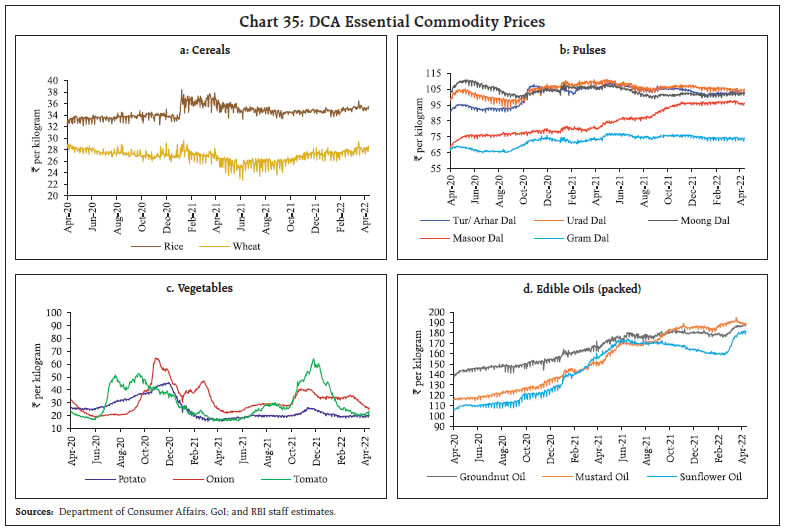 Pump prices of petrol and diesel registered increases from March 22, 2022. As on April 12, 2022 retail selling prices of petrol and diesel registered a cumulative increase of around ₹10 per litre and stood at ₹112.97 per litre (average of the pump prices in the four major metros) and at ₹100.55 per litre, respectively. LPG prices increased by ₹50 per cylinder on March 22, 2022 for the first time since October 6, 2021. Kerosene prices remained steady in the first half of April after rising in March (Table 2). Input costs rose further in March across manufacturing and services as reflected in the PMIs. While selling prices edged up to a five-month high across manufacturing, they rose only marginally across services. | Table 2: Petroleum Products Prices | | Item | Unit | Domestic Prices | Month-over-month (per cent) | | Apr-21 | Mar-22 | Apr-22^ | Mar-22 | Apr-22 | | Petrol | ₹/litre | 92.64 | 103.98 | 112.06 | 1.1 | 7.8 | | Diesel | ₹/litre | 84.54 | 91.62 | 99.65 | 1.2 | 8.8 | | Kerosene (subsidised) | ₹/litre | 30.32 | 46.87 | 46.87 | 11.3 | 0.0 | | LPG (non-subsidised) | ₹/cylinder | 819.63 | 926.25 | 960.13 | 1.8 | 3.7 | ^: For the period April 1-12, 2022.
Note: Other than kerosene, prices represent the average Indian Oil Corporation Limited (IOCL) prices in four major metros (Delhi, Kolkata, Mumbai and Chennai). For kerosene, prices denote the average of the subsidised prices in Kolkata, Mumbai and Chennai.
Sources: IOCL; Petroleum Planning and Analysis Cell (PPAC); and RBI staff estimates. | IV. Financial Conditions In consonance with the recalibration of the stance of monetary policy in the MPC’s resolution of April 8, 2022, the Reserve Bank also instituted changes in its operating procedure, which are excerpted from Governor Shri Shaktikanta Das’s statement on the same day so as draw out the key implications: • “The amendment to Section 17 of the RBI Act in 2018 empowered the Reserve Bank to introduce the Standing Deposit Facility (SDF). By removing the binding collateral constraint on the central bank, the SDF strengthens the operating framework of monetary policy. Accordingly, it has now been decided to introduce the SDF as the floor of the LAF corridor. This would provide symmetry to the operating framework of monetary policy by introducing a standing absorption facility at the bottom of the LAF corridor, similar to the standing injection tool at the upper end of the corridor, namely the marginal standing facility (MSF). Thus, at both ends of the LAF corridor, there will be standing facilities – one to absorb and the other to inject liquidity. Accordingly, access to SDF and MSF will be at the discretion of banks, unlike repo/reverse repo, OMO and CRR which are available at the discretion of the Reserve Bank. Notably, the SDF is also a financial stability tool in addition to its role in liquidity management. • The SDF rate will be 25 bps below the policy rate, and it will be applicable to overnight deposits at this stage. It would, however, retain the flexibility to absorb liquidity of longer tenors as and when the need arises, with appropriate pricing. The MSF rate will continue to be 25 bps above the policy repo rate. Thus, the width of the LAF corridor is restored to the pre-pandemic configuration of 50 bps, symmetrically around the policy repo rate, which will be at the centre of the corridor. • The fixed rate reverse repo (FRRR) rate is retained at 3.35 per cent. It will remain as part of Reserve Bank’s toolkit and its operation will be at the discretion of the Reserve Bank for purposes specified from time to time. The FRRR along with the SDF will impart flexibility to the Reserve Bank’s liquidity management framework. • Both MSF and SDF will be available on all days of the week, throughout the year. • It has also been decided to restore the opening time for financial markets regulated by the Reserve Bank to the pre-pandemic timing of 9:00 am with effect from April 18, 2022, without any change in their closing time prevailing at present.” The Reserve Bank also indicated that it will engage in a gradual and calibrated withdrawal of liquidity over a multi-year time frame in a non-disruptive manner beginning this year. The objective is to restore the size of the liquidity surplus in the system to a level consistent with the stance of monetary policy. The Reserve Bank also reiterated its commitment to ensure the availability of adequate liquidity to meet the productive requirements of the economy. The Reserve Bank committed to remain focussed on completion of the borrowing programme of the Government and towards this end deploy various instruments as warranted. During the second half of March 2022 through April 8, liquidity absorptions moderated to ₹7.3 lakh crore from ₹8.4 lakh crore during the second fortnight of February through mid-March 2022 on account of advance tax outflows. The average daily absorption under the FRRR window stood at ₹2.9 lakh crore while 61 per cent of total absorption on average was through the variable rate reverse repo (VRRR) auctions (both main and fine-tuning) during mid-March to April 7. Overnight money market rates traded in a range-bound manner, with the weighted average call rate (WACR) remaining closely aligned to the lower bound of the corridor. Interest rates on longer term money market instruments such as 3-month T-bills and certificates of deposit (CDs), however, ruled higher, drifting towards the policy repo rate (Chart 36). 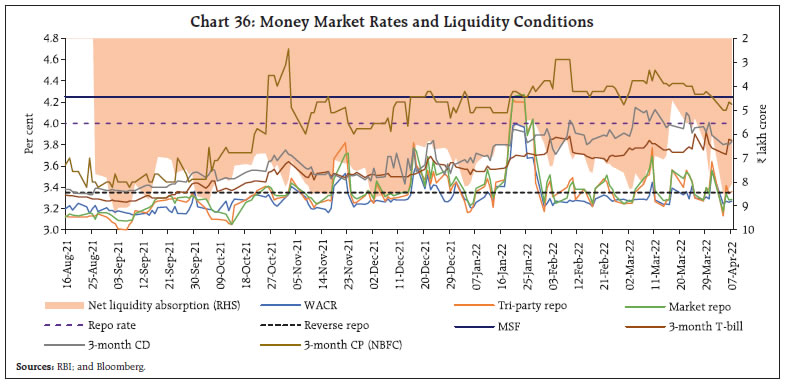
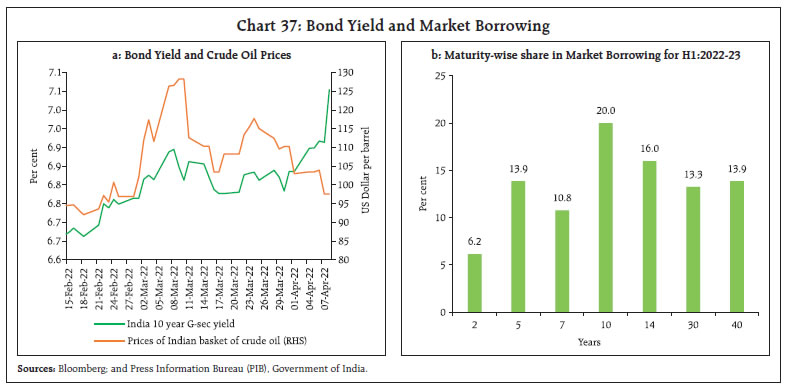 After softening since March 16 in tandem with the easing of crude oil prices, the yield on the 10-year benchmark security surged on April 4, 2022 following the release of the Central government’s borrowing calendar (Chart 37a). Subsequently, bond yields hardened across the maturity spectrum, with the 10-year benchmark yield (6.54% GS 2032) closing at 7.12 per cent on April 8, 2022. The rise in US treasury yields exacerbated the dampening of market sentiment. The market borrowing calendar was frontloaded with 59 per cent of the gross market borrowing or ₹8.5 lakh crore scheduled for H1:2022-23. The borrowing is scheduled to be completed in 26 weekly tranches of ₹32,000-33,000 crore, with the bulk of the borrowing concentrated in the 10-year segment (Chart 37b). With a view to enable banks to better manage their investment portfolio during 2022-23, the Reserve Bank decided on April 8, 2022 to enhance the present limit under Held to Maturity (HTM) category from 22 per cent to 23 per cent of NDTL till March 31, 2023. It was also decided to allow banks to include eligible SLR securities acquired between April 1, 2022 and March 31, 2023 under this enhanced limit. The HTM limits would be restored from 23 per cent to 19.5 per cent in a phased manner starting from the quarter ending June 30, 2023. Monetary and credit conditions evolved in line with the monetary policy stance. Reserve money (RM), excluding the first-round impact of the cash reserve ratio (CRR) restoration, grew at 10.9 per cent y-o-y as on April 1, 2022 (14.5 per cent a year ago), with currency in circulation – its major constituent – expanding at 9.8 per cent (16.2 per cent a year ago). Concomitantly, money supply (M3) grew at 8.7 per cent as on March 25, 2022 (12.3 per cent a year ago), primarily driven by the growth in aggregate deposits with banks at 8.4 per cent (11.3 per cent a year ago). The growth in scheduled commercial banks’ (SCBs’) credit to the commercial sector, accelerated to 8.6 per cent as on March 25, 2022 (5.6 per cent a year ago) [Chart 38]. The introduction of the external benchmark system has facilitated monetary transmission to lending and deposit rates, aided by surplus liquidity conditions. The weighted average lending rates (WALRs) on fresh and outstanding rupee loans have declined by 140 bps and 124 bps, respectively, since March 2020. The one-year median marginal cost of funds-based rate (MCLR) of SCBs has moderated by 95 bps (Chart 39). The median term deposit rate (MTDR) of SCBs has declined by 150 bps over the same period (Chart 40). The pass-through is maximum across shorter tenor deposits of up to one year. Amongst bank groups, foreign banks have exhibited better transmission to deposit rates across all the tenors compared to their counterparts. With the rising profile of credit demand, major domestic banks have hiked their term deposit rates.
The Government of India left interest rates on various small savings instruments (SSIs) unchanged for Q1:2022-23. Thus, the existing interest rates on SSIs are 9 to 118 bps higher than the formula-based rates. Domestic equities gained in tandem with global equity markets in the second half of March, shrugging off the first interest rate hike by the US Fed since 2018. Despite concerns over Russia-Ukraine war, equity markets moved higher in early April buoyed by encouraging GST collections in March 2022, the announcement of merger of HDFC and HDFC bank and moderation in international crude oil prices. Thereafter, markets exhibited correction amidst negative global cues from the minutes of the latest Federal Open Market Committee (FOMC) meeting of March 15-16, 2022, which hinted at increased reduction in the size of the Fed’s balance sheet. Markets rebounded following the Reserve Bank’s announcement of status quo in the policy repo rate and monetary policy stance remaining in accomodation. However, markets pared gains subsequently following weak cues from global markets amidst rising global bond yields and Covid-19 surge in China. Overall, the BSE Sensex has gained 4.1 per cent since end-February to close at 58,576 on April 12, 2022. 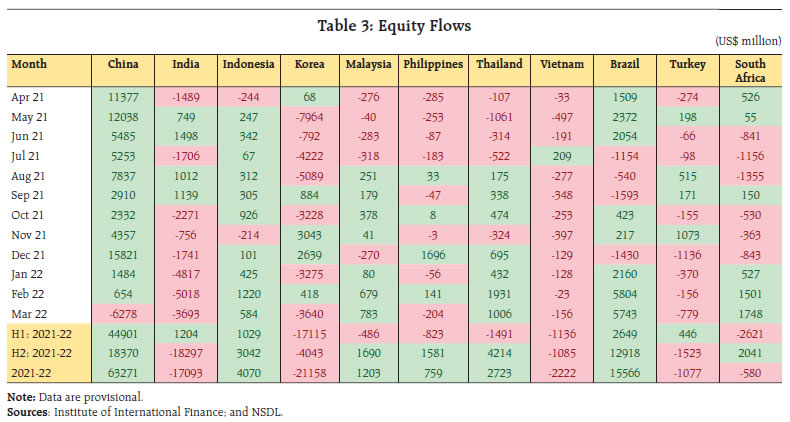 Foreign portfolio investors (FPIs) turned net sellers in domestic equities in March 2022 for the sixth consecutive month amidst concerns over the Russia-Ukraine war, with large outflows from financial services and software services sector (Table 3 and Chart 41). Noteworthy differences in the impact of the spike in crude oil price on stock prices has been observed among the oil-importing and exporting nations (Chart 42). India, a major importer of crude oil, remains vulnerable to volatility in crude oil prices and oil supply shocks. Through April-February 2021-22, gross inward foreign direct investment (FDI) at US$ 76.9 billion remained comparable with its level a year ago. Manufacturing, computer services, communication services, financial services, and retail and wholesale trade sector managed to attract most of the investment. However, net FDI came down to US$ 36.6 billion from US$ 43.2 billion a year ago, due to an increase in net outward FDI from India (Chart 43).
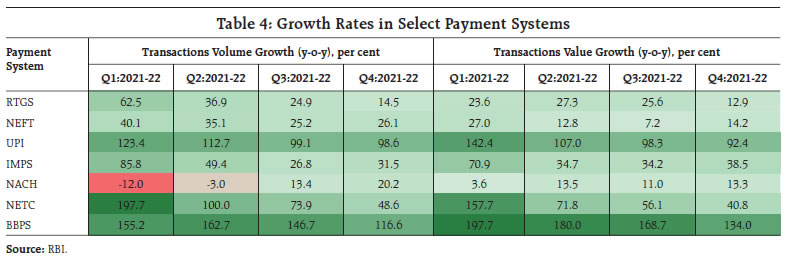
FPIs continued to pull out of domestic market, reporting net outflows of US$ 15.3 billion in FY 2021-22. In March 2022, FPI were net sellers in both equity and debt markets (Chart 44). Net disbursements of external commercial borrowings (ECB) to India, including inter-company borrowings, were to the tune of US$ 11.1 billion during April-February 2021-22 as compared with US$ 1.9 billion a year ago, while net disbursements excluding both repayments and inter-company borrowings amounted to US$ 7.0 billion as against net repayment of US$ 1.8 billion a year ago. In February, a considerable amount of borrowing was routed for refinancing of rupee loans, on-lending/sub-lending, and for working capital. The foreign exchange reserves stood at US$ 606.5 billion as on April 1, 2022 equivalent to about 12 months of imports during 2021-22 (Chart 45). The hardening oil import cost and portfolio outflows continued to mount pressure on the Indian rupee (INR), which depreciated against the US dollar by 1.6 per cent (m-o-m) in March 2022. In both nominal and real effective terms (40-currency basket), the INR depreciated by 0.5 per cent in March 2022 over its level a month ago (Chart 46). Payment Systems Through the three waves of the pandemic, digital transactions have proliferated. Offline digital payments initiatives, the Unified Payments Interface (UPI) for feature phones (UPI123Pay), broad basing of payment system by inclusion of non-banks into centralised payment systems, and enhancement of pre-paid card outstanding limits up to ₹2 lakh should further catalyse this growth (Table 4). 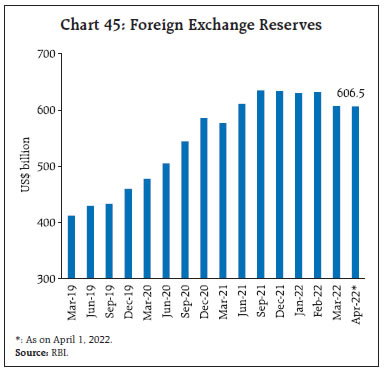 In the large value payment segment, transactions through the Real Time Gross Settlement (RTGS) recorded strong growth (y-o-y) across all months of the year. With the annual closing of accounts in March, RTGS transactions peaked at 2.3 crore transactions worth ₹145 trillion. On the retail side, digital payments posted annual volume growth of 64 per cent (28 per cent growth in value terms). Digital transaction volumes were dominated by the UPI. Other notable performers in the retail segment were the National Electronic Funds Transfer (NEFT), the Immediate Payment Service (IMPS), the Bharat Bill Payment System (BBPS). The Aadhaar enabled Payment Services (AEPS) also grew substantially due to direct benefit transfers under various welfare schemes. The number of FASTags issued under National Electronic Toll Collection (NETC) system expanded by 89 per cent in 2021-22, taking the total number of outstanding tags to approximately 4.8 crore. A notable feature of the digital ecosystem in 2021-22 was the resurgence of credit cards, with the average transaction size rising at double digit rates since March 2021 (Chart 47). 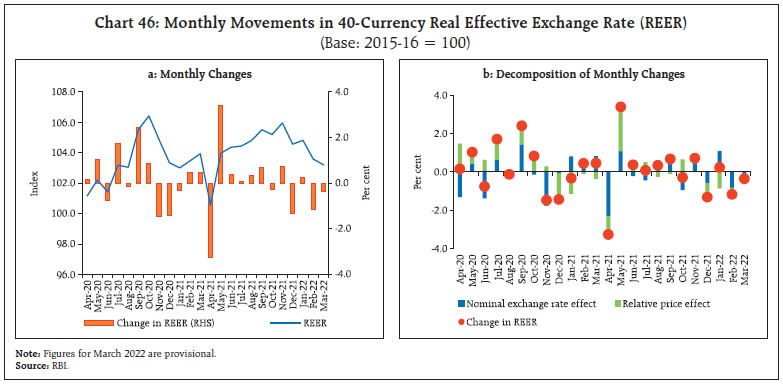
 Ascertaining the geographical spread of the payment infrastructure is necessary to develop targeted intervention strategies for inclusive digital payments. Accordingly, the Reserve Bank released the framework for Geo-tagging of Payment System Touch Points on March 25, 2022.8 The framework requires banks and non-bank payment system operators to submit geo-tagging information related to Point-of-Sale (PoS) terminals and paper-based/soft QR codes to the Reserve Bank. Enabling customer authorisation through the use of UPI is in the pipeline, which will encourage card-less cash withdrawal facility across all banks and all ATM networks/operators. V. Conclusion The near-term global outlook appears grim, caught up in a vortex of geo-political risks materialising rapidly, strained supply chains and the quickening pace of monetary policy normalisation. Emerging market economies are bracing up to contend with swift shifts in risk sentiments and tightening of global financial conditions that could produce real economy consequences which may thwart incipient recoveries or even precipitate rocketing inflation and economic downturns. The Indian economy is not immune to these negative externalities. The surge in commodity prices is already posing inflation risks, especially through the conduit of surging imports. Rapidly widening trade and current account deficits co-existing with portfolio capital outflows weigh on external sustainability, although the strength of underlying fundamentals and the stock of international reserves provide buffers. India faces these challenges from a position of strength built on broadened vaccine coverage, financial sector resilience, robust export and remittances and fiscal reprioritisation to spur capital spending on infrastructure. Going forward, spurring private investment remains a key thrust area for sustaining growth on a durable basis.
Annex Impact of Robotics on Productivity and Labour Share in GDP Pandemic has triggered the rate of robot adoption9 worldwide with large scale unavailability of workers and restricted physical proximity (Sedik et al, 2021). However, Georgieff et al, predicts risk to 14 per cent of the low-end jobs owing to automation in OECD countries. On the other hand, McKinsey Global Institute predicts an increase in the productivity from automation in the range of 0.8-1.4 per cent for the period 2015-2065. This has reignited the debate on the impact of automation on productivity and employment. The total market size of robotics industry is estimated to increase to US$ 165.4 billion by 2028 from US$ 55.4 billion in 2020 (Statista). With its 52 per cent automation potential (McKinsey Global Institute), the impact of Robotics on India can be significant in terms of growth of productivity and displacement of low-end workers. According to International Federation of Robotics, India has witnessed a 20 per cent average annual growth rate of new installations of robots for the period 2008-2020 as against the 15 per cent recorded worldwide. The literature on the impact of robotics on productivity and employment is divided in two schools of thought as illustrated by Aghion et al, the first view, i.e., the displacement effect focuses on the negative impact of automation on employment and labour share, while the second view (productivity effect) believes the existence of positive impact of automation on employment at the firm level. However, the consensus appears to be emerging on the existence of both displacement and productivity effect. In order to empirically examine the hypothesis regarding the dominance of productivity and displacement effects, a sample of 14 countries is analysed using fixed effect panel estimation for the period 2008 to 2018. The model is based on Fu et al (2021), with new installations of robots taken as the independent variable to account for the impact of rapid change in technology. The control variables of export and import share in GDP are incorporated to account for trade openness while population and capital stock are included as traditional parameters of growth. Secondary school enrolment rate and number of patents filled are taken as proxy for educational and technological advancement. The result suggests that an increase of 1 per cent in new robots installed leads to 0.031 per cent increase in labour productivity. While the impact of automation on share of labour compensation is not statistically significant. The results also highlight the negative impact of human capital on share of labour compensation in GDP when taken as a control variable to study the impact of robotics. This highlights the need to educate and retrain the workforce, in order to optimally utilise the full productivity gains brought on by the introduction of robotics. This is substantiated by the change in impact of human capital, number of patents and new robots installed, on the share of labour compensation in GDP when a lag of three periods in human capital is taken as an independent variable. These results appear to be in line with Berg et al (2016), which suggests an increase in labour productivity and a higher share of capital in the total income. Overall, the results suggest that the productivity effect dominates over displacement effect for the sample of countries analysed during 2008-2018, thereby corroborating the major findings obtained by Fu et al (2021). Moreover, the negative effects of the displacement can be minimised by recalibrating the existing skillset of low-medium skill workers. | Estimated Effects of Robotics on Labour Productivity and Share of Labour in GDP | | | (1) | (2a) | (2b) | | Dependent Variables | | Output per Worker | Share of Labour Compensation in GDP | Share of Labour Compensation in GDP | | Log of New Robots Installed | 0.0316** | -0.00583 | 0.0000287 | | Share of Exports as a Percentage of GDP | -0.00169 | -0.0120*** | -0.0177** | | Share of Imports as a Percentage of GDP | | 0.00951** | 0.0154** | | Human Capital | 0.00351** | -0.00126* | | | Human Capita (lagged) | | | 0.00300 | | Log of Total Population | 0.00475* | | | | Capital Stock | | 0.0755*** | 0.0792** | | Log of No of Patents filled by Residents | | -0.0253 | 0.0233 | | Constant | 10.26*** | 1.091** | 0.0876 | | Observations | 127 | 126 | 90 | | R-squared | 0.748 | 0.209 | 0.194 | | Note: ***, **, * denote the level of significance at 1%, 5%, and 10% respectively. | Reference: Aghion P, Antonin C, Bunel S, Jaravel X. The Direct and Indirect Effects of Automation on Employment: A Survey of the Recent Literature (forthcoming). Fu, X., Bao, Q., Xie, H., Fu, X. (2021). Diffusion of Industrial Robotics and Inclusive Growth: Labour Market Evidence from Cross Country Data. Journal of Business Science. Georgieff, A., Milanez, A. (2021). What happens to jobs at high risk of automation? OECD Social, Employment and Migration Working Papers. Sedik, T.S., Yoo, J. (2021). Pandemics and Automation: Will the Lost Jobs Come Back? IMF Working Paper.
|