The transmission to banks’ lending and deposit rates has improved notably since October 2019, facilitated by the introduction of external benchmark linked lending rate (EBLR) system, accommodative monetary policy stance, large surplus liquidity and subdued credit demand. The weighted average lending rates (WALRs) on fresh as well as outstanding rupee loans have declined across sectors. Banks have extended the benefits to existing borrowers by reducing the WALR more than the repo rate cuts during the EBLR period. Empirical estimation based on autoregressive distributed lag framework establishes improvement in the pace and extent of monetary transmission to lending and deposit rates in the EBLR regime. The pace of transmission is expected to improve going forward as the proportion of external benchmark linked loans increases further. Introduction The adoption of flexible inflation targeting (FIT) framework following the amendment to the RBI Act in 2016 has made price stability the primary objective of monetary policy, while keeping in mind the objective of growth. The introduction of FIT has increased the importance of interest rate channel of monetary transmission – the process through which changes in the central bank’s policy rate gets transmitted to the real economy. There are two components in this mechanism (Rangarajan, 2020). The propagation of monetary policy impulse from the central bank to the banking system is termed as the inside leg. The process begins with anchoring overnight inter-bank money market rates at or around the policy rate set by the central bank through its active liquidity management operations. The impulses of short-term rates are then transmitted to the longer end of the curve including government securities yield, corporate bonds yield and credit market rates. A smooth transmission of monetary policy impulses to the long-term interest rates is essential to influence aggregate demand conditions that determine the desired combination of output and price level at which an economy operates within its supply constraints. This process is categorised as the outside leg of transmission mechanism. Monetary policy transmission is characterised by long and variable lags. Hence, the efficacy of monetary policy depends on the pace at which policy rate changes are transmitted to the real economy in pursuit of the ultimate objectives of monetary policy, viz., price stability and growth. The pace of transmission in the inner leg is usually fast in advanced economies (Rangarajan, 2020). In contrast, transmission is generally sluggish in developing economies on account of underdeveloped financial markets (Mishra et al, 2012). In case of India, transmission has been smooth at the short end of the maturity spectrum of interest rates, while the pass-through to bank lending and deposit rates had till recently been relatively sluggish. Around 50 per cent of the pass-through from a change in the repo rate to deposit rate occurs in 12 months and a longer time of 17 months in case of transmission to lending rates (Das, 2015). Apart from differential lags, there is evidence of asymmetry in pass-through from policy repo rate changes to banks’ lending and deposit rates (Singh, 2011). Until October 2019, banks used benchmarks, which were internal and, hence, varied across banks; it also made the entire process of setting lending rates by banks opaque and hindered the monetary transmission (RBI, 2017). In case of internal benchmark-based pricing of loans, transmission from the policy rate to bank lending rates is indirect since lending rates are determined on a cost-plus basis. If the response of banks’ cost of funds to policy rate variations is lagged and incomplete, this creates a wedge in the pricing of bank credit and, thus, delays transmission. In recognition of this asymmetry, the Reserve Bank mandated the introduction of an external benchmark system of lending rates for select sectors in October 2019.1 Under this system, any change in the benchmark rate is mandated to be passed on to the lending rates for new and existing borrowers on a one-to-one basis and banks are restricted from adjusting their spreads for existing borrowers for a period of three years in the absence of any significant credit event. In this background, this article reviews monetary policy transmission in the deposit as well as credit segments of the financial market under different lending rate systems, with focus on external benchmark linked lending rate (EBLR) regime. The article is structured in the following manner. Section II assesses the transmission of policy rate changes to banks’ interest rates at aggregate as well as disaggregated level in current easing cycle juxtaposed with monetary transmission in the EBLR regime. Section III presents an empirical estimation of the extent and speed of adjustment in lending and deposit rates. Finally, Section IV concludes with key takeaways. II. Transmission to Lending and Deposit Rates of Banks In a bank dominated system like India, the transmission of monetary policy signals to banks’ deposit and lending rates is the key to successful implementation of monetary policy. With the objective of improving the magnitude and pace of monetary transmission to actual lending rates of banks and imparting transparency to the lending rates setting process, the Reserve Bank has periodically refined the process of setting interest rates by banks through the introduction of the prime lending rate (PLR) system in 1994, the benchmark prime lending rate (BPLR) system in 2003, the base rate system in 2010 and the marginal cost of funds-based lending rate (MCLR) system in 2016.2 While the transmission improved partially due to these measures, it continued to be sluggish, as all these systems relied on banks’ own cost of funds, i.e., internal benchmarks, and exhibited weak co-movement with the policy rate (Chart 1). Additionally, internal benchmark-based systems suffered from opacity, especially regarding the interest rate resetting practices for existing borrowers. The transmission to banks’ interest rates, however, has improved with the introduction of external benchmark-based pricing of loans in October 2019. The transmission has exhibited further improvement since March 2020 on account of sizeable policy rate cuts and persisting surplus liquidity conditions resulting from various system level as well as targeted measures introduced by the Reserve Bank in the aftermath of COVID-19 pandemic (Kumar and Sachdeva, 2021). Transmission at aggregate bank level In the credit segment of financial markets, transmission to lending and deposit rates improved in the current easing cycle and more so after the introduction of EBLR system (Table 1). The increase in the share of loans linked to external benchmark in total outstanding floating rate loans has facilitated transmission to weighted average lending rate (WALR) on outstanding rupee loans (Table 2). In addition, the sustained decline in MCLRs and the periodic resetting of such loans at lower rates have also helped the existing borrowers, as banks have extended the benefits to them by reducing WALR on outstanding rupee loans more than the policy repo rate cuts during the EBLR period. Forward guidance on accommodative stance of monetary policy coupled with surplus liquidity in the system have facilitated transmission to lending rates in FY 2021-22. | Table 1: Transmission from the Repo Rate to Banks’ Deposit and Lending Rates | | (Variation in basis points) | | Period | Repo Rate | Term Deposit Rates | Lending Rates | | Median TDR (Fresh Deposits) | WADTDR (Outstanding Deposits) | 1 - Year Median MCLR | WALR (Outstanding Rupee Loans) | WALR (Fresh Rupee Loans) | | Feb 2019 – Mar 2022* (Current Easing cycle) | -250 | -208 | -189 | -155 | -143 | -213 | | Memo | | | | | | | | Feb 2019 - Sep 2019 (Pre-External Benchmark) | -110 | -9 | -8 | -30 | 0 | -43 | | Oct 2019 – Mar 2022* (External Benchmark Period) | -140 | -180 | -181 | -128 | -143 | -170 | | Mar 2020 - Mar 2022* (COVID Period) | -115 | -150 | -143 | -95 | -124 | -140 | | Apr 2021 – Mar 2022* (Financial Year: 2021-22) | 0 | 0 | -26 | -5 | -29 | -10 | Note: Latest data on WALRs and WADTDR pertain to February 2022.
WALR: Weighted average lending rate; WADTDR: Weighted average domestic term deposit rate;
MCLR: Marginal cost of funds-based lending rate; TDR: Term deposit rate.
Sources: RBI; and Authors’ calculations. |
| Table 2: Share of Floating Rate Linked Outstanding Rupee Loans of SCBs: Interest Rate Benchmarks | | (Per cent to total) | | Bank Group | Base Rate | MCLR | External Benchmark | | Sep-19 | Mar-20 | Mar-21 | Dec-21 | Sep-19 | Mar-20 | Mar-21 | Dec-21 | Sep-19 | Mar-20 | Mar-21 | Dec-21 | | Public sector banks (11) | 14.6 | 11.9 | 7.8 | 6.6 | 83.1 | 79.5 | 68.7 | 61.4 | 0.4 | 4.8 | 20.3 | 28.3 | | Private sector banks (21) | 8.3 | 6.8 | 3.9 | 3.0 | 86.7 | 75.5 | 53.0 | 39.9 | 4.6 | 17.5 | 43.0 | 57.0 | | Foreign banks (42) | 6.8 | 5.2 | 2.7 | 1.7 | 67.3 | 56.7 | 30.7 | 24.8 | 25.7 | 37.9 | 66.6 | 73.3 | | SCBs (74) | 12.5 | 10.2 | 6.4 | 5.3 | 83.8 | 77.7 | 62.8 | 53.1 | 2.4 | 9.3 | 28.6 | 39.2 | Notes: (i) Figures in parentheses refer to the number of banks.
(ii) Figures in table do not add up to hundred because residual loans are linked to BPLR.
Sources: Information collected from banks; and Authors’ calculations. | Apart from the adoption of external benchmark-based pricing of loans, surplus liquidity conditions amidst muted credit demand have facilitated downward adjustment in deposit rates (Chart 2a). The median term deposit rate (MTDR) - average card rates on fresh term deposits – moderated considerably during the period October 2019 and March 2022, with the maximum pass-through witnessed in case of shorter tenor deposits of up to one year maturity. Across domestic banks, private banks exhibit a higher pass-through to term deposit rates compared to their state-owned peers (Chart 2b). However, with uptick in credit demand and moderation in deposit growth in the recent months, banks have started pricing in their deposits at higher rates to mobilise stable funding. As a result, the weighted average domestic term deposit rate (WADTDR) on fresh deposits has increased by 24 basis points (bps) since October 2021.3 The pass-through of policy rate changes to interest rates on term deposits appears larger as compared to lending rates. However, this does not present the complete picture, and banks’ deposit liabilities in the form of current account and savings account (CASA) deposits also need to be taken into account. Term deposits constituted only 56.2 per cent of aggregate deposits of banks in March 2022, while current account and savings account deposits constituted 9.8 per cent and 33.8 per cent, respectively. Current account balances do not earn any interest and, hence, are largely impervious to policy rate changes. Transmission to savings account rate is typically more subdued and modest, relative to term deposits. The median savings deposit rate of domestic banks declined by 60 bps from 3.5 per cent in January 2019 to 2.9 per cent in March 2022.
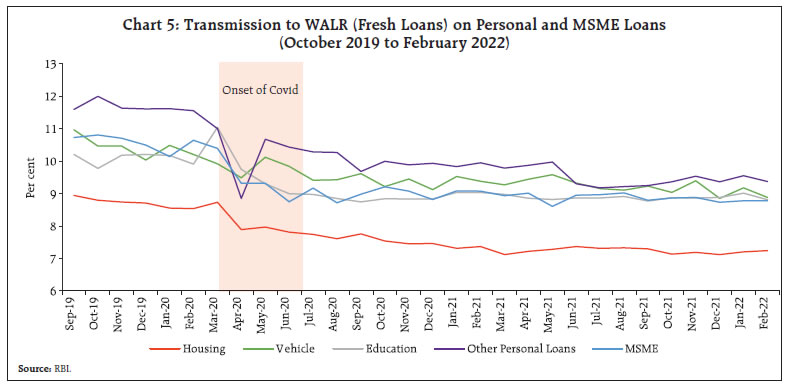
Transmission across bank groups At the bank group level, the pass-through to lending and deposit rates has been uneven reflecting idiosyncratic factors. Foreign banks exhibited maximum transmission to lending and deposit rates in the current easing cycle (Chart 3a). Across domestic banks, the decline in the WALRs (fresh and outstanding rupee loans) was higher in the case of public sector banks (PSBs) relative to private banks (PvBs), contrary to the trends seen in their deposit rates. Historically, WALR and WADTDR of private banks have been higher than those offered by PSBs. In the current easing cycle, private banks exhibited a higher pass-through to term deposit rates, resulting in a greater alignment in the levels of deposit rates across domestic banks. The degree of pass-through across bank groups improved after the introduction of EBLR regime in October 2019 (Chart 3b). Transmission across banks At a disaggregated level, most domestic banks (PSBs and PvBs) witnessed decline in WALRs on fresh rupee loans and WADTDR on outstanding deposits during the current easing cycle (Chart 4a). The transmission has improved notably at bank level since October 2019, facilitated by the introduction of EBLR regime, accommodative monetary policy stance, large surplus liquidity condition, and subdued credit demand (Chart 4b). Transmission across sectors In the wake of introduction of external benchmark regime for select sectors in October 2019, personal loans and MSMEs loans segments have witnessed significant increase in share of outstanding loans linked to external benchmark. Banks are voluntarily pricing their loans linked to external benchmark in other sectors as well (Table 3). The WALRs on personal loans and loans to MSMEs have declined significantly during the period October 2019-February 2022. The decline was sharpest in the case of other personal loans (222 bps) followed by vehicle loans (208 bps) and loans to MSMEs at 194 bps (Chart 5). Since March 2020, most sectors have witnessed decline in WALRs on fresh rupee loans. The decline is significant in case of commercial real estate followed by other personal loans and loans to large industry. The WALRs on outstanding rupee loans have declined across all sectors during the same period (Annexure Table A1). | Table 3: Sector-wise Share of Outstanding Floating Rate Loans across Interest Rates Benchmarks | | (Per cent to total) | | Sectors | Sep-19 | Mar-21 | Dec-21 | | Base rate | MCLR | External benchmark | Base rate | MCLR | External benchmark | Base rate | MCLR | External benchmark | | Industry (Large) | 10.6 | 85.3 | 3.2 | 7.1 | 79.2 | 12.7 | 5.9 | 70.9 | 20.4 | | Trade | 5.3 | 92.4 | 2.1 | 3.1 | 55.6 | 40.7 | 2.9 | 46.2 | 49.4 | | MSMEs | 11.5 | 85.5 | 1.8 | 5.5 | 34.8 | 58.6 | 4.0 | 24.2 | 69.2 | | Personal Loans | 15.4 | 82.0 | 1.6 | 6.1 | 57.2 | 35.2 | 4.3 | 45.1 | 46.2 | | Housing | 17.4 | 79.5 | 2.1 | 7.2 | 42.0 | 49.1 | 5.5 | 33.1 | 58.2 | | Vehicle | 8.7 | 90.3 | 0.6 | 2.6 | 73.6 | 23.5 | 1.3 | 60.0 | 31.1 | | Education | 43.4 | 51.8 | 0.3 | 25.1 | 53.2 | 18.8 | 23.4 | 49.2 | 23.0 | | Other Personal Loans | 6.9 | 92.5 | 0.3 | 1.9 | 78.4 | 19.0 | 1.2 | 60.7 | 31.5 | Notes: (i) The data are collected from 74 SCBs.
(ii) Figures in table do not add up to hundred because residual loans are linked to BPLR.
Sources: Information collected from banks; and Authors’ calculations. |
 In respect of fresh rupee loans linked to the policy repo rate, the spread (WALR – fresh rupee loans over the repo rate) charged by domestic banks across sectors reflected credit risk profiles and business strategies. In personal loans segment, the median spread charged by domestic banks is the lowest in respect of housing loans, reflecting lower defaults and the availability of collaterals. ‘Other personal loans’ i.e., loans other than housing, vehicle and educational loans - are mostly unsecured and involve higher credit risk; hence, the spread charged is the highest for this category. The spread charged on fresh loans extended in retail segments (except education) and MSMEs remained range bound during October 2019 to February 2022 (Chart 6a). Among the bank groups, the median spreads charged by PSBs for personal loans and loans to MSME segment were lower than those of PvBs as at end February 2022. Across domestic banks, there is more variability in spreads charged by private banks as compared to PSBs, possibly reflecting more diverse lending operations across sectors by private banks (Chart 6b). III. Empirical Analysis In this section, an attempt has been made to empirically estimate the degree and speed of pass-through of policy rate changes to lending and deposit rates of SCBs in a cointegration/error correction framework using autoregressive distributed lag (ARDL) modelling approach. Yt denotes dependent variable and Xt are set of explanatory variables. ECT is error correction term and measures speed of adjustment of the dependent variable in the event of a deviation in the long-term relationship between the dependent and the explanatory variables. ut and wt are residual terms. Equation A captures long-run relationship between the dependent and explanatory variables and Equation B captures short-run dynamics and is estimated by including the ECT extracted from equation A. Data and Methodology Drawing from Pesaran et al. (2001), an ARDL model is employed for the empirical estimation based on monthly data for the period January 2013 to October 2021.4 The choice of this model is based on two considerations: first, it has good small sample properties as compared to alternative econometric techniques (Narayan, 2005). Secondly, in ARDL framework, estimates of the long-run coefficients are unbiased and consistent; irrespective of the regressors being non-stationary at level and first difference form5 (Harris and Solis, 2003). The empirical analysis is undertaken for both lending and deposit rates and, in turn, for interest rates on fresh as well outstanding loans and deposits – thus, four separate equations are estimated. Furthermore, given the structural differences across banks, the empirical analysis for all SCBs is complemented by separate analysis for PSBs and PvBs. The first two equations, i.e., equations (1) and (2) in Table 4 analyse WALR on fresh rupee loans (WALR_F) and WALR on outstanding rupee loans (WALR_O) respectively; repo rate (REPO) and credit to deposit ratio (CD Ratio) are included as dynamic explanatory variables in both the equations. CD ratio is a measure of banking system’s lending capacity given its deposit funding. A high CD ratio, ceteris paribus, could allow banks pricing power to raise their lending rates, while a moderation in their CD ratio, reflecting subdued credit demand conditions could be expected to put downward pressure on their lending rates. WALR_F and WALR_O of banks are expected to be positively associated with REPO and CD Ratio. Equations (3) and (4) estimate the impact of policy rate changes on deposit rates. The weighted average domestic term deposit rates on outstanding deposits (WADTDR_O) and median term deposit rate on fresh deposits (MTDR_F) are used as dependent variables in the two sets of equations; repo rate (REPO) and liquidity captured by LAF adjusted for NDTL (LQDY) are used as dynamic explanatory variables. An increase in systemic liquidity in the banking system is expected to have a softening impact on the deposit rates. Scatter plots based on panel of banks suggest a correlation on the expected lines between the dependent and explanatory variables for both public and private sector bank groups (Annex Chart A1 and A2). Given the short period for which the external benchmark system has been in place, its impact on transmission is examined in the short run error correction equations by incorporating interaction term (ΔREPOt * DumEBLR), where DumEBLR is time dummy for the external benchmark period, i.e., October 2019 to October 2021. Time dummies for demonetisation (DumDEMO) and taper tantrum (DumTAPR) for the periods November 2016 to March 2017 and July 2013 to September 2013, respectively, are also incorporated in short-run estimation. Estimation Table 4 reports the summary of results of econometric analysis in the study with lending and deposit rates as dependent variables for the full sample of banks at aggregate level, i.e., for SCBs. Estimates for public and private sector bank groups are also reported.6 | Table 4: Pass-through of Repo Rate changes to Lending and Deposit Rates - Long-run Estimates and Short-run Adjustments in ARDL Framework | | | Dependent Variable | Explanatory Variables | PSBs | PvBs | SCBs | | Equation 1 | WALR_F | REPO | 0.78*** | 0.87*** | 0.90*** | | | CD Ratio | 0.13** | -0.01 | 0.12* | | | ECT(-1) | -0.14*** | -0.16*** | -0.14*** | | | (ΔREPOt) * (DumEBLR) | 0.20*** | 0.37 | 0.43** | | | Adjusted R2 | 0.28 | 0.25 | 0.44 | | Equation 2 | WALR_O | REPO | 0.51 | 0.78*** | 0.72*** | | | CD Ratio | 0.34 | 0.03 | 0.24* | | | ECT(-1) | -0.01*** | -0.06*** | -0.05*** | | | (ΔREPOt) * (DumEBLR) | 0.07**# | -0.17 | 0.08*# | | | Adjusted R2 | 0.47 | 0.14 | 0.43 | | Equation 3 | MTDR_F | REPO | 0.69*** | 0.64*** | 0.79*** | | | LQDY | -0.16** | -0.13*** | -0.12** | | | ECT(-1) | -0.10*** | -0.15*** | -0.16*** | | | (ΔREPOt) * (DumEBLR) | 0.15* | 0.13* | 0.27*** | | | Adjusted R2 | 0.48 | 0.45 | 0.32 | | Equation 4 | WADTDR_O | REPO | 0.69*** | 0.62*** | 0.69*** | | | LQDY | -0.24** | -0.26** | -0.24** | | | ECT(-1) | -0.05*** | -0.07*** | -0.06*** | | | (ΔREPOt) * (DumEBLR) | 0.09**@ | 0.07**$ | 0.08***@ | | | Adjusted R2 | 0.35 | 0.33 | 0.40 | Notes: 1. ECT and interaction dummy are estimated in error correction framework.
2. ‘***’, ‘**’ and ‘*’ denote significance at 1%, 5% and 10% respectively.
3. ‘#’, ‘$’ and ‘@’ denote impact of repo rate on dependent variables with a lag of 2, 3 and 4 months, respectively in EBLR period.
Source: Authors’ calculations. | The empirical analysis indicates that the long-run elasticity of WALR_F of SCBs with respect to repo rate is 0.90, which means that, over time, 90 per cent of change in the repo rate gets passed on to fresh lending rates. In case of WALR_O of SCBs, around 72 per cent of change in repo rate gets transmitted to outstanding lending rates over time. The CD Ratio, as expected, has positive and significant impact on the lending rates on fresh as well as outstanding loans. Across bank groups, the long-run transmission to WALR_F for private banks at 87 per cent per cent was somewhat higher than that of 78 per cent for PSBs over the sample period. In the case of outstanding loans, 78 per cent of a change in repo rate gets transmitted to lending rate over time for private banks; for PSBs, the coefficient is positive but insignificant.7 In the short run dynamics, the coefficient of interaction term (ΔREPOt * DumEBLR) is positive and significant for SCBs, suggesting improved transmission to lending rates during the external benchmark period. While the impact is instantaneous in case of fresh rupee loans, the impact is seen with a lag of two months in respect of outstanding rupee loans, as a majority of outstanding floating rate loans are not yet linked to the external benchmark. As may be seen from Table 2, the share of loans linked to MCLR for PSBs and SCBs in December 2021 exceeded that of loans linked to EBLR. The transmission of repo rate cuts to base rate and MCLR linked loans is muted and lagged. The error correction term is negative and significant for Equation (1) and Equation (2), as reported in Table 4. The coefficient of (-)0.14 indicates that the WALR_F of SCBs adjusts by 14 per cent per month towards long-run equilibrium. At this rate, it would take 5 months to achieve 50 per cent of the pass-through to WALR_F from a change in the repo rate for all SCBs taken together as well as for PSBs; the adjustment is relatively quicker for PvBs at 3 months. The speed of adjustment in case of WALR_O is slower, as expected, in view of factors, such as, the continued dominance of MCLR linked loans with annual reset periods. The speed of adjustment can be expected to improve going forward as the proportion of external benchmark linked loans increases further along with quicker reset periods (3 months relative to 1 year now). This is borne out by the statistical significance of the interaction between the changes in the repo rate and the dummy representing the external benchmark period (ΔREPOt*DUMEBLR). Turning to deposits, estimates show that 79 per cent of a change in the repo rate gets passed on to the deposit rate on fresh deposits of SCBs over time, while in case of outstanding deposits, the transmission is lower at 69 per cent. The long-run pass-through to both fresh and outstanding deposits is higher for PSBs vis-à-vis private banks. Liquidity has a soothing impact on deposit rates on outstanding as well as fresh deposits of SCBs as well as deposit rates of the two bank groups. The coefficient of the interaction term (ΔREPOt * DumEBLR) is positive and significant for all bank groups, implying improved transmission to deposit rates during the external benchmark period. Moreover, as noted earlier, weak credit demand during the Covid-19 pandemic period amidst sustained deposit growth prompted banks to lower their deposit rates. The impact of repo rate changes on deposit rates is instantaneous in case of fresh deposits for all bank groups, while it takes around 3-4 months in case of rates on outstanding deposits. The adjustment coefficient term is negative and significant for deposit rates of all bank groups, as presented in Equation (3) and Equation (4) of Table 4. For SCBs and PvBs, it would take around 4 months to achieve 50 per cent of the pass-through to fresh deposits; for PSBs, the same magnitude of pass-through is achieved in 10 months. The introduction of EBLR regime has enabled quicker adjustments in deposit rates, as alluded to earlier. Banks adjust their term deposit rates faster, as lending rates undergo frequent adjustments in line with the benchmark rates, to protect their profitability and net interest margins (NIMs). The speed of adjustment in WADTDR_O - almost one year to achieve 50 per cent of the pass-through - is expectedly slower, mainly due to relatively longer maturity profile of term deposits contracted at fixed rates. IV. Conclusion The Reserve Bank’s endeavour to improve monetary transmission to banks’ lending rates have gained traction with the advent of EBLR regime in October 2019. The earlier internal benchmark-based lending rate regimes suffered from a multitude of issues, such as, arbitrariness in calculation of the base rate/MCLR and spreads; long reset clauses, which inhibited efficient monetary transmission. The framework for pricing of loans under an external benchmark system improved the extent and pace of adjustment in lending and deposit rates in response to changes in policy repo rate. The EBLR system has also accelerated the pass-through to MCLR-linked loans, as changes in the benchmark rates lead banks to proactively adjust their deposit rates to protect their NIMs, thereby improving transmission to overall lending and deposit rates. Thus, the impact of the introduction of external benchmark-based pricing of loans on monetary transmission has been felt across various sectors, encompassing even those sectors that are not directly linked to external benchmark-based loan pricing and this has been corroborated by empirical analysis undertaken in this paper. The pace and extent of monetary transmission to lending and deposit rates have improved in the EBLR regime, facilitated by accommodative monetary policy stance, large surplus liquidity conditions and subdued credit offtake due to the Covid-19 pandemic. Looking ahead, the proportion of loans linked to external benchmarks is expected to increase further along with a commensurate fall in the internal benchmark linked loans. Coupled with shorter reset periods, monetary transmission can, thus, be expected to strengthen further in case of both deposits and loans. References Das, S. (2015), “Monetary Policy in India: Transmission to Bank Interest Rates”, Working Paper No. WP/15/129, International Monetary Fund. Harris, R., and Solis, R. (2003), Applied Time Series Modelling and Forecasting. Wiley. West Sussex. Kumar, A. and P. Sachdeva (2021), “Monetary Policy Transmission in India: Recent Developments”, RBI Bulletin, July 2021, Volume LXXV Number 7. Mishra, P., P. Montiel, and A. Spilimbergo (2012), “Monetary Transmission in Low-Income Countries: Effectiveness and Policy Implications,” IMF Economic Review, Vol. 60, pp. 270-302. Narayan, P.K. (2005), “The Saving and Investment Nexus for China: Evidence from Cointegration Tests”, Applied Economics 37, pp. 1979–1990. Pesaran, H.M., Shin, Y., Smith, J.R. (2001), “Bounds Testing Approaches to the Analysis of Relationships”, Journal of Applied Econometrics 16, 289-326. Rangarajan, C. (2020), “The New Monetary Policy Framework – What it Means”, NIPFP Working Paper Series No. 297. Reserve Bank of India (2017), “Report of the Internal Study Group to Review the Working of the Marginal Cost of Funds-based Lending Rate System”. Singh, B. (2011), “How Asymmetric is Monetary Policy Transmission to Financial Markets in India”, RBI Occasional Paper Volume 32, No, 2.
Annexure | Table A1: Sector-wise Transmission to Lending Rates of Domestic Banks | | | Rates (Per cent) | Transmission (Basis points) | | Dec-21 | Jan-22 | Feb-22 | Mar 2020 to Feb 2022* | | Policy Repo Rate | 4.00 | 4.00 | 4.00 | -115 | | WALR (Fresh rupee loans) | | Agriculture | 8.79 | 8.75 | 9.29 | -64 | | Large Industry | 6.87 | 7.00 | 6.83 | -187 | | MSME Loans | 8.73 | 8.78 | 8.78 | -186 | | Infrastructure | 7.50 | 6.91 | 7.05 | -174 | | Trade | 7.88 | 7.69 | 7.69 | -5 | | Professional Services | 7.93 | 8.75 | 8.27 | -62 | | Housing | 7.12 | 7.20 | 7.24 | -129 | | Vehicle | 8.85 | 9.17 | 8.88 | -132 | | Education | 8.88 | 9.01 | 8.81 | -110 | | Other Personal Loans | 9.36 | 9.55 | 9.37 | -218 | | Commercial Real Estate | 7.13 | 7.37 | 7.14 | -283 | | WALR (Outstanding rupee loans) | | Agriculture | 9.44 | 9.42 | 9.40 | -69 | | Large Industry | 8.14 | 8.12 | 8.08 | -122 | | MSME Loans | 9.37 | 9.35 | 9.31 | -124 | | Infrastructure | 8.54 | 8.40 | 8.36 | -137 | | Trade | 8.31 | 8.24 | 8.27 | -70 | | Professional Services | 8.39 | 8.14 | 8.27 | -176 | | Housing | 7.53 | 7.49 | 7.49 | -110 | | Vehicle | 9.24 | 9.17 | 9.10 | -91 | | Education | 9.31 | 9.30 | 9.32 | -121 | | Other Personal Loans | 10.52 | 10.51 | 10.39 | -165 | *: Transmission to WALRs on outstanding rupee loans is for the period April 2020 to February 2022.
Source: RBI. |
| Table A2: Transmission to WALR of SCBs | | Long-run Equations | | (ARDL 2,1,3) | | (ARDL 1,2,4) | | | WALR_F | | WALR_O | | REPO | 0.90 (0.00) | REPO | 0.72 (0.00) | | CD Ratio | 0.12 (0.09) | CD Ratio | 0.24 (0.06) | | Short-run Adjustments | | | ΔWALRF t | | | ΔWALR0 t | | ECT t–1 | -0.14 (0.00) | ECT t–1 | -0.05 (0.00) | | ΔWALRf t–1 | -0.51 (0.00) | ΔWALRo t–1 | -0.16 (0.00) | | ΔWALRf t–2 | -0.34 (0.00) | ΔREPOt | 0.07 (0.03) | | ΔREPOt | 0.31 (0.00) | ΔREPO t–1 | 0.05 (0.20) | | ΔCD Ratiot | -0.02 (0.15) | ΔCD Ratiot | 0.01 (0.41) | | ΔCD Ratio t–1 | -0.01 (0.61) | ΔCD Ratiot–1 | -0.02 (0.00) | | ΔCD Ratiot–2 | 0.004 (0.77) | ΔCD Ratiot–2 | -0.01 (0.02) | | (ΔREPOt) * (DumEBLR) | 0.43 (0.02) | ΔCD Ratiot–3 | -0.02 (0.00) | | DumDEMO | -0.13 (0.06) | (ΔREPOt–2) * (DumEBLR) | 0.08 (0.07) | | DumTAPR | 0.20 (0.00) | DumDEMO | -0.02 (0.26) | | | | DumTAPR | 0.04 (0.16) | | Adjusted R2 = 0.44; F-statistic = 4.63 (3.1, 3.87) | Adjusted R2 = 0.43; F-statistic = 11.45 (3.1, 3.87) | Figures in parentheses are p-values. F-Bounds Test confirms cointegration at 5 per cent level of significance. Breusch – Godfrey LM test confirms no serial correlation at 6 lags.
Δ represents month-on-month change in respective variables. |
| Table A3: Transmission to Deposit Rates of SCBs | | Long-run Equations | | (ARDL 4,4,2) | | (ARDL 3,2,0) | | | MTDR_F | | WADTDR_O | | REPO | 0.79 (0.00) | REPO | 0.69 (0.00) | | LQDY | -0.12 (0.05) | LQDY | -0.24 (0.02) | | Short-run Adjustments | | | ΔMTDRF t | | | ΔWADTR0 t | | ECT t–1 | -0.16 (0.00) | ECT t–1 | -0.06 (0.00) | | ΔMTDR_Ft–1 | -0.09 (0.27) | ΔWADTDR_0t–1 | 0.04 (0.79) | | ΔMTDR_Ft–2 | 0.11 (0.19) | ΔWADTDR_0t–2 | 0.06 (0.43) | | ΔREPOt | 0.17 (0.01) | ΔREPOt | 0.15 (0.01) | | ΔREPOt–1 | 0.11 (0.03) | REPOt–1 | -0.09 (0.13) | | ΔLQDYt | -0.01 (0.43) | (ΔREPOt–4) * (DumEBLR) | 0.08 (0.00) | | ΔLQDYt–1 | 0.04 (0.01) | DumDEMO | -0.04 (0.00) | | (ΔREPOt) * (DumEBLR) | 0.27 (0.01) | DumTAPR | 0.05 (0.21) | | DumDEMO | -0.04 (0.19) | | | | DumTAPR | 0.14 (0.00) | | | | Adjusted R2 = 0.32; F-statistic = 4.43 (3.1, 3.87) | Adjusted R2 = 0.40; F-statistic = 6.92 (3.1, 3.87) | Figures in parentheses are p-values. F-Bounds Test confirms cointegration at 5 per cent level of significance. Breusch – Godfrey LM test confirms no serial correlation at 6 lags.
Δ represents month-on-month change in respective variables. |
| Table A4: Transmission to WALR on Fresh Loans: Bank Group wise | | Long-run Equations | | PSBs (AIC 3,1,1) | | PvBs (AIC 3,1,0) | | | WALR_F | | WALR_F | | REPO | 0.78 (0.00) | REPO | 0.87 (0.00) | | CD Ratio | 0.13 (0.03) | CD Ratio | -0.01 (0.80) | | Short-run Adjustments | | | ΔWALRF t | | | ΔWALRf t | | ECT t–1 | -0.14 (0.00) | ECT t–1 | -0.16 (0.00) | | ΔWALRf t–1 | -0.39 (0.00) | ΔWALR0 t–1 | -0.40 (0.00) | | ΔWALRf t–2 | -0.25 (0.00) | ΔWALRf t–2 | -0.31 (0.00) | | ΔREPOt | 0.21 (0.07) | ΔREPOt | 0.38 (0.01) | | ΔCD Ratiot | -0.03 (0.17) | (ΔREPOt) * (DumEBLR) | 0.37 (0.20) | | (ΔREPOt) * (DumEBLR) | 0.20 (0.07) | DumDEMO | -0.22 (0.00) | | DumDEMO | -0.10 (0.02) | DumTAPR | 0.17 (0.01) | | DumTAPR | 0.14 (0.01) | | | | Adjusted R2 = 0.28; F-statistic = 7.3 (3.1, 3.87) | Adjusted R2 = 0.25; F-statistic = 2.38 (3.1, 3.87) | Figures in parentheses are p-values. F-Bounds Test confirms cointegration at 5/10 per cent level of significance. Breusch – Godfrey LM test confirms no serial correlation at 6 lags.
Δ represents month-on-month change in respective variables. |
|
| Table A5: Transmission to Deposit Rates on Fresh Deposits: Bank Group wise | | Long-run Equations | | PSBs (AIC 1,3,2) | | PvBs (AIC 3,1,0) | | | MTDR_F | | MTDR_F | | REPO | 0.69 (0.01) | REPO | 0.64 (0.00) | | LQDY | -0.16 (0.03) | LQDY | -0.13 (0.00) | | Short-run Adjustments | | | ΔMTDR_F t | | | ΔMTDR_F t | | ECT t–1 | -0.10 (0.00) | ECT t–1 | -0.15 (0.00) | | ΔREPOt | 0.11 (0.01) | ΔREPOt | 0.14 (0.04) | | ΔREPOt–1 | 0.16 (0.01) | ΔREPOt–1 | 0.07 (0.32) | | ΔREPOt–2 | 0.07 (0.19) | ΔLQDYt | -0.01 (0.32) | | ΔLQDYt | 0.01 (0.69) | ΔLQDYt–1 | 0.04 (0.02) | | ΔLQDYt–1 | 0.03 (0.01) | (ΔREPOt) * (DumEBLR) | 0.13 (0.10) | | (ΔREPOt) * (DumEBLR) | 0.15 (0.09) | DumDEMO | -0.09 (0.02) | | DumDEMO | -0.04 (0.28) | | | | Adjusted R2 = 0.48; F-statistic = 7.62 (3.1, 3.87) | Adjusted R2 = 0.45; F-statistic = 8.02 (3.1, 3.87) | Figures in parentheses are p-values. F-Bounds Test confirms cointegration at 5 per cent level of significance. Breusch – Godfrey LM test confirms no serial correlation at 6 lags.
Δ represents month-on-month change in respective variables. |
| Table A6: Transmission to WALR on Outstanding Loans: Bank Group wise | | Long-run Equations | | PSBs (AIC 1,2,2) | | PvBs (AIC 2,1,0) | | | WALR_O | | WALR_O | | REPO | 0.51 (0.39) | REPO | 0.78 (0.00) | | CD Ratio | 0.34 (0.35) | CD Ratio | 0.03 (0.25) | | Short-run Adjustments | | | ΔWALR0 t | | | ΔWALR0 t | | ECT t–1 | -0.01 (0.00) | ECT t–1 | -0.06 (0.00) | | ΔREPOt | 0.02 (0.51) | ΔWALRO t–1 | -0.27 (0.00) | | ΔREPOt–1 | 0.05 (0.19) | ΔWALRf t–2 | -0.31 (0.00) | | ΔCD Ratiot | -0.01 (0.07) | ΔREPOt | 0.19 (0.02) | | ΔCD Ratiot–1 | -0.01 (0.01) | (ΔREPOt) * (DumEBLR) | -0.17 (0.20) | | (ΔREPOt) * (DumEBLR) | 0.07 (0.02) | DumDEMO | -0.03 (0.51) | | DumDEMO | -0.01 (0.90) | DumTAPR | 0.06 (0.19) | | DumTAPR | 0.03 (0.11) | | | | Adjusted R2= 0.47; F-statistic = 15.7 (3.1, 3.87) | Adjusted R2 = 0.14; F-statistic = 3.63 (3.1, 3.87) | Figures in parentheses are p-values. F-Bounds Test confirms cointegration at 5 per cent level of significance. Breusch – Godfrey LM test confirms no serial correlation at 6 lags.
Δrepresents month-on-month change in respective variables. |
| Table A7: Transmission to Deposit Rate on Outstanding Deposits: Bank Group wise | | Long-run Equations | | PSBs (AIC 1,3,2) | | PvBs (AIC 3,1,0) | | | WADTDR | | WADTDR | | REPO | 0.69 (0.00) | REPO | 0.62 (0.00) | | LQDY | -0.24 (0.03) | LQDY | -0.26 (0.01) | | Short-run Adjustments | | | ΔWADTDR t | | | ΔWADTDR t | | ECT t–1 | -0.05 (0.00) | ECT t–1 | -0.07 (0.00) | | ΔWADTDR t–1 | -0.07 (0.63) | ΔWADTDR t–1 | -0.01 (0.92) | | ΔWADTDR t–2 | 0.12 (0.03) | ΔWADTDR t–2 | 0.08 (0.40) | | ΔREPO t | 0.17 (0.02) | ΔREPO t | 0.11 (0.02) | | ΔREPO t–1 | -0.10 (0.14) | (ΔREPO t–3) * (DumEBLR) | 0.07 (0.02) | | ΔREPO t–2 | 0.08 (0.14) | DumDEMO | -0.06 (0.00) | | (ΔREPO t–4) * (DumEBLR) | 0.09 (0.03) | DumTAPR | 0.04 (0.37) | | DumDEMO | -0.04 (0.00) | | | | DumTAPR | 0.05 (0.13) | | | | Adjusted R2 = 0.35; F-statistic = 6.5 (3.1, 3.87) | Adjusted R2= 0.33; F-statistic= 5.63 (3.1, 3.87) | Figures in parentheses are p-values. F-Bounds Test confirms cointegration at 5 per cent level of significance. Breusch – Godfrey LM test confirms no serial correlation at 6 lags.
Δ represents month-on-month change in respective variables. | Chart A: Bin Scatter Plot8
|