This article compares the impact of the Federal Reserve (Fed)’s two taper announcements (May 22, 2013 and November 3, 2021) on Indian financial markets. The event study results indicate that the later taper (Taper 2) announcement has been less severe as compared to Taper Tantrum of 2013 (Taper 1) in terms of the impact on bond yields and spreads. Empirical analysis using a GARCH framework suggests a muted impact of Taper 2 announcement on financial market volatilities which could be a result of India’s stronger external position in 2021 as compared to 2013. Introduction “Although monetary policy has a predominantly domestic orientation, the effects of the imminent shift in gears will not be confined domestically. It will spill over to emerging market economies, and it will spill back to systemically important ones. It is always easier to go into accommodation than to come out. This brings back memories of 2013 and the infamous ‘taper tantrum’. It also focuses the spotlight on India.”1 The Quantitative Easing (QE) programmes by the Fed have a long history that dates back to the early 1930s. QE interventions were also utilised between 2008 and 2014 as a response to the Great Recession, in addition to the Fed’s recent QE programme in response to the pandemic. While the Fed’s QE operations have been successful in easing financial conditions and lowering longer-term rates via the portfolio rebalance channel and/or the signalling channel, the Fed’s balance sheet expansion has had some unintended consequences for many emerging market economies (EMEs). Fed QE operations, in particular, have the potential to distort exchange rates; influence capital and trade flows; produce asset market bubbles; and to increase business and household borrowing (Aizenman et al., 2016, Aizenman et al., 2017). In light of the aforementioned negative consequences and adverse impact of the Fed taper announcement in May 2013 on the Indian equity, bond, and currency markets, this article compares the impact of the COVID-QE taper announcement (2021) with the impact of the taper announcement in May 2013 and draws future policy implications. In response to the Global Financial Crisis, the Fed’s large-scale asset acquisition programme was launched in November 2008, when it made public its plans to buy mortgage-backed securities (MBS) and debt issued by Freddie Mae and Fannie Mac. The Federal Open Market Committee (FOMC) authorised large-scale purchases of MBS and Treasury securities in March 2009 (QE1). Two more rounds of QE followed, with QE2 in November 2010 involving an open-ended announcement to buy Treasuries and MBS, and QE3 in September 2012 involving an open-ended announcement to buy Treasuries and MBS. On May 22, 2013, Fed Chairman Ben Bernanke delivered the first hint that the Fed could taper QE (Taper 1), causing a bond market meltdown that raised the 10-year yield by nearly a percentage point (Bernanke, 2020). The Fed’s asset market purchases, on the other hand, did not end until October 2014. In his presidential address to the American Economic Association in January 2020, Ben Bernanke argued that the unconventional monetary policy tools had proven effective, enhancing monetary policy flexibility for the future. The asset purchases recommenced in the wake of the dysfunction of the treasury and mortgage-backed securities (MBS) markets after the outbreak of COVID-19. The Fed announced on March 15, 2020 that it would buy at least $500 billion in treasury securities and $200 billion in MBS. The Fed made the purchase amounts open-ended on March 23, 2020. It set its rate of purchases to at least $80 billion per month in treasuries and $40 billion per month in MBS in June 2020. In December 2020, the Fed indicated that it would slow down the pace of these purchases once the economy has made progress toward the Fed goals. On November 3, 2021, the Fed announced a taper in asset purchases to the tune of $10 billion in treasuries and $5 billion in MBS per month (Taper 2). In December 2021, the Fed announced a doubling of its tapering speed. The Fed announced that the asset purchases would end in March 2022. While such policies may be well-designed and calibrated for the US economy, what could be done to minimise their spillovers to other emerging market economies remains an open question. With this backdrop, the rest of the article is organised as follows. Section II provides a brief overview of the literature analysing the impact of QE and its taper on financial markets. Section III presents a detailed economic and statistical analysis of the impact of Taper 1 and Taper 2 on Indian equity, bond and currency markets. It also provides an assessment of the impact of recent global events e.g. Russia- Ukraine conflict, the policy rate hikes by the Fed and the Reserve Bank on financial market volatilities. Section IV explores the reasons for the differential financial market response to the two taper events. Section V concludes with some key takeaways and policy suggestions. II. Literature Review The impact of QE announcements on prices of financial assets is well documented using event studies framework (Gagnon et al., 2011, Krishnamurthy and Vissing-Jorgensen, 2011). The event study framework, however, is able to reliably capture only the short-term impact on asset prices. Considerable research has linked the dynamic relationship between bond market yields and relative supply of securities and highlighted a highly persistent impact on asset prices (Greenwood and Vayanos, 2014, Wu, 2014, Ihrig et al., 2018). Bruno and Shin (2015) find evidence of US monetary policy on cross-border capital flows through banking sector leverage channel. Hausman and Wongswan (2011) analyse the impact of FOMC announcements on international equity, bond and currency markets in 49 countries. Ghosh and Saggar (2017) analyse volatility spillovers during the taper talk and actual tapering across major emerging economies. More recently, Lin and Niu (2021) examine the spillover effects of QE in advanced economies on Chinese yield curve. Extant literature has also analysed the role of country-specific macro-economic factors in determining the effects of US monetary policy spillovers on other economies. Bowman et al. (2015) find that a country’s currency regime and vulnerability to US financial conditions had a significant role to play in a country’s responsiveness to US unconventional monetary policy spillovers. Eichengreen and Gupta (2014) found that EMEs with larger and liquid financial markets that allowed greater capital inflows experienced a sizeable impact during the taper talk episode. Many studies find that strong macroeconomic fundamentals helped in dampening volatilities during the taper episode (Aizenman et al., 2014, Basu et al., 2015). III. Impact of Fed Taper Announcement on Financial Markets of US and India III.1 Impact on US and India Government Bond Yield Curve, FPI Flows and Exchange Rate The taper announcement on May 22, 2013 led to a significant increase in 10-year government bond yields in the US and a steepening of the US yield curve as opposed to the announcement of November 3, 2021 taper that had an insignificant impact on the yield curve (Chart 1). An event study analysis of 1-day change in yield around the taper announcement dates indicates that the impact of announcement of Taper 2 on 10-year government bond yields was moderate (5.46 basis points) as compared to Taper 1 (11.32 basis points). The statistical significance is calculated on the basis of unconditional standard deviation of 1-day yield changes over a period of one year starting from one month prior to the Taper 1 announcement date. The slope of the yield curve remained unchanged during Taper 2 (Table 1). The increase in 10-year yields was on the expected lines given that the taper announcement served as a signal for a reduction in future demand for these securities leading to a decrease in price and hence, an increase in yield. During Taper 2 episode, the 10-year yield increased but not significantly, perhaps due to the anticipated nature of the announcement. In subsequent months, the US yield curve fell further and inverted stoking fears of a possible recession. 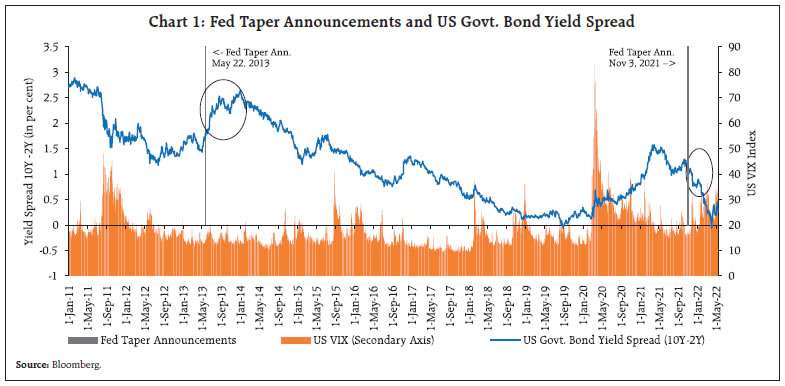
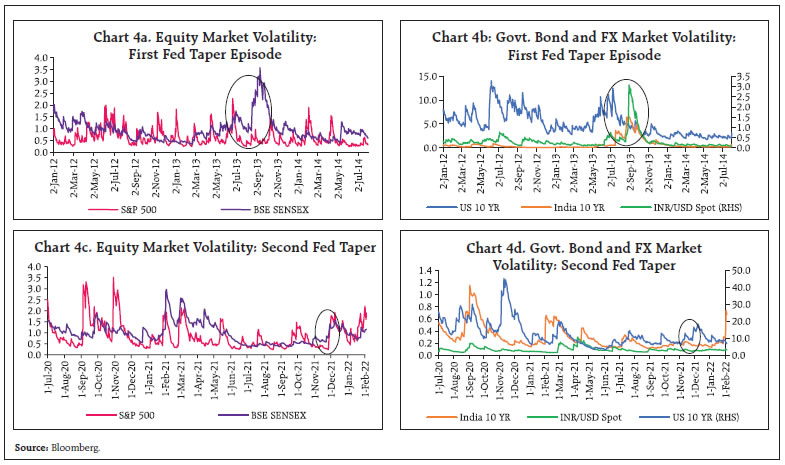
| Table 1: Impact of Fed Taper Announcements on US Govt Bond Yields | | 1-day change (in basis points) | Taper 1 (May 22, 2013) | Taper 2 (November 3, 2021) | | US 2-Year Govt. Bond Yield | 1.23 | 1.6 | | US 10-Year Govt. Bond Yield | 11.32*** | 5.46 | | US 10-Year minus 2-Year Bond Yield | 10.09*** | 3.9 | | Unconditional Std. Dev of 1-day changes in US 2-Year Govt. Bond Yields | 1.05 | 1.15 | | Unconditional Std. Dev of 1-day changes in US 10-Year Govt. Bond Yields | 4.25 | 4.13 | | Note: *** p < 0.01 | The Indian bond market reacted strongly to Taper 1 announcement with the yield curve (10-year minus 2-year) inverting in the months following the May 2013 announcement (Chart 2). The bond market reaction to the Taper 2 announcement has been tepid. Event study results of 1-day change in yield around the taper announcement dates highlight the decrease of 10-year yields and the yield curve inversion around Taper 1 with 10-year yields falling by 19 basis points and the spread (10-year minus 2-year yield) falling by 21 basis points. Extant empirical evidence also points to a similar decline in 10-year yields for India around Taper 1 announcement and indicates that the yield softening could be due to a delayed debt market reaction as inflation was edging down and monetary policy was easing in the period leading upto Taper 1 announcement (Patra et al., 2016). A yield curve inversion, is usually treated as a precursor to recession. An inverted yield curve has preceded all recessions in the US since 1973. However, proactive steps by the RBI averted any recessionary concerns in India in the period post Taper 1 announcement. In comparison, Taper 2 announcement has had an insignificant impact on Indian bond yields (Table 2). 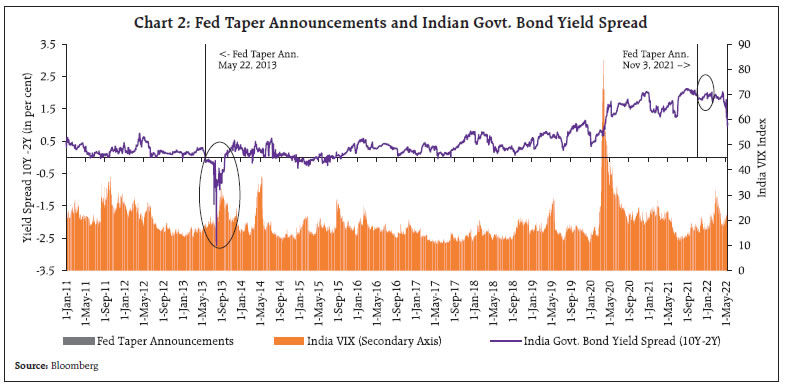 There was a significant exodus of foreign portfolio investment (FPI) flows from India and a steep depreciation of the rupee following Taper 1 announcement (Chart 3). There was an FPI outflow of approximately ₹78,000 crore in the three months following Taper 1 announcement (June - August 2013) and most of it was in the form of debt. In contrast, the rupee experienced a mild depreciation following Taper 2 announcement that was quickly corrected in the following weeks. FPI outflows have been moderate and mostly in the form of equity in the immediate aftermath of Taper 2. However, there has been a strong exodus of FPI investors in recent months largely owing to global inflationary pressures, policy rate hikes by major central banks and heightened geo-political tensions on account of world developments such as Russia-Ukraine War. | Table 2: Impact of Fed Taper Announcements on Indian Govt Bond Yields | | 1-day change (in basis points) | Taper 1 (May 22, 2013) | Taper 2 (November 3, 2021) | | India 2-Year Govt. Bond Yield | 2.1 | -2.4 | | India 10-Year Govt. Bond Yield | -18.5*** | 0.2 | | India 10-Year minus 2-Year Bond Yield | -20.6*** | 2.2 | | Unconditional Std. Dev of 1-day changes in India 2-Year Govt. Bond Yields | 3.01 | 6.01 | | Unconditional Std. Dev of 1-day changes in India 10-Year Govt. Bond Yields | 3.13 | 2.78 | | Note: *** p < 0.01 | III.2 Volatility in Bond, Equity and Currency Markets Following the seminal work of Engle and Bollerslev (1986), generalised autoregressive conditional heteroskedasticity (GARCH) models were used to quantify volatility in equity, bond and currency markets using Bloomberg daily financial equity, bond and currency data for the US and India from January 1, 2011 to May 16, 2022. Univariate estimation of GARCH with standard conditional variance formulation based on autoregressive conditional mean specification was used. The GARCH(1,1) specification was found to be parsimonious with coefficients significantly different from zero and satisfying stability conditions. The regression results from GARCH estimation are reported in the Annex. The estimates of conditional GARCH volatility for equity, bond and currency markets were plotted separately for Taper 1 and Taper 2 (Chart 4). Volatility increased across bond, equity and currency markets in US and India during the first taper episode; the impact of the second taper announcement has been mild with an insignificant increase in volatility across the three markets. 
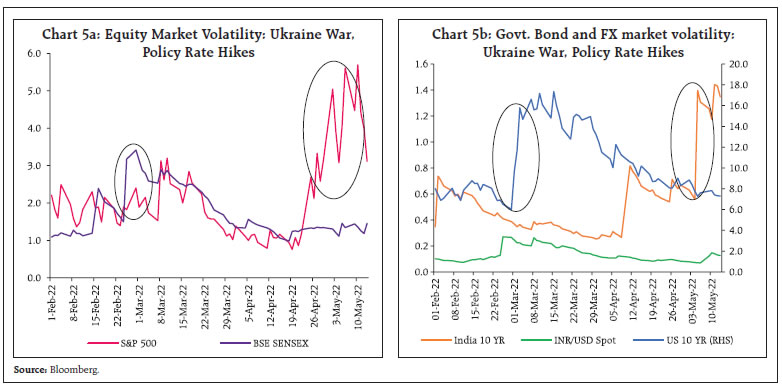 Recent geo-political events, however, have contributed to a surge in volatility across global financial markets. Inflationary concerns and consequent tightening of monetary policies across the globe have also led to an increase in uncertainty in equity and bond markets in the early part of calendar year 2022 (Chart 5). The surge in volatility in the last week of February 2022 and first week of March 2022 is driven by the Russia-Ukraine war and associated financial market and supply chain disruptions. The US equity market volatility may have accelerated due to a 50 basis points policy rate hike at the beginning of May- 2022. Notwithstanding these bouts of recent financial market volatilities, our two main observations are (a) the volatilities in Indian markets were muted as compared to the US counterparts; and (b) the recent movement in volatilities is due to a confluence of several confounding events and may not be attributed to the taper episode alone. The identification of each of them could be difficult and may be a topic of future research. III.3 Volatility Spillovers from the US to Indian Financial Markets Extant empirical research provides evidence of volatility spillovers from advanced economies to EMEs on account of many factors including central bank monetary policy actions (Ghosh and Saggar, 2017). In order to quantify the volatility spillovers from the US to Indian equity and bond markets, a multivariate GARCH (MGARCH) framework that allows for co-movement of volatilities across several markets was used. Under MGARCH framework, the following mean specification was used: Where eit is the conditional error and St is the conditional variance at time t. The variance-covariance matrix in VECH model is specified as follows: The aforementioned system of equations can be estimated using maximum likelihood function under the assumption of conditional normality. Each element of the DVECH model follows a GARCH(1,1) process in our analysis. The spillover of volatility from the US equity market (S&P 500 returns) to Indian equity market (BSE SENSEX returns) and US 10-year government bond market to Indian 10-year government bond market is analysed. The A(1,2) coefficients for both equity and bond market are significant indicating significant volatility contemporaneous comovement between US and Indian markets (Table 3). The significance of B(1,2) coefficients highlight clustering and high persistence of these volatilities in equity markets though the phenomenon seems muted in the Govt. bond market (Table 3). The strong comovement of volatilities and spillover in bond market may arise due to interest rate arbitrage causing lumpy debt market portfolio flows. Similarly, the strong movement of equity volatilities may be reflective of movement of global equity portfolio funds. This strong comovement highlights the tradeoff that many emerging markets face when determining their degree of openness to foreign capital inflows that can prove to be destabilising during policy reversions. | Table 3: Volatility Spillover from the US to Indian Financial Markets | | | Equity Market | Govt. 10-Year Bond Market | | Coefficient | Probability | Coefficient | Probability | | C(1) | 0.08*** | 0.00 | -0.01 | 0.88 | | C(2) | 0.08*** | 0.00 | -0.01 | 0.46 | | Variance Equation Coefficients | | | | M(1,1) | 0.05*** | 0.00 | 0.05*** | 0.00 | | M(1,2) | 0.01*** | 0.00 | 0.01 | 0.75 | | M(2,2) | 0.02*** | 0.00 | 0.00*** | 0.00 | | A(1,1) | 0.18*** | 0.00 | 0.08*** | 0.00 | | A(1,2) | 0.02*** | 0.00 | 0.04*** | 0.01 | | A(2,2) | 0.07*** | 0.00 | 0.07*** | 0.00 | | B(1,1) | 0.77*** | 0.00 | 0.91*** | 0.00 | | B(1,2) | 0.93*** | 0.00 | 0.01 | 0.98 | | B(2,2) | 0.91*** | 0.00 | 0.93*** | 0.00 | | *** p < 0.01 | IV. Potential Explanations for Differential Responses to Taper Announcements The analysis has indicated that the response of Indian financial markets to Taper 2 announcement has been moderate as compared to Taper 1 announcement which lead to a substantial increase in bond, equity and currency market volatilities and significant depreciation of the rupee vis-à-vis the USD. An attempt is made to understand the potential causes for this differential financial market response. One potential explanation could be that the Taper 1 announcement caught the financial markets across the world by surprise, and hence, led to a significant adverse reaction. Taper 2 announcement, on the other hand, was somewhat anticipated by the financial markets given the past experience with Taper 1 and Fed communication subtly hinting at chances of taper in the periods leading upto Taper 2 announcement. Another potential explanation for the resilience in the Indian markets post Taper 2 could be the backing of stronger economic fundamentals in India as opposed to the period before Taper 1 announcement. A lower current account deficit as a percentage of GDP, larger foreign exchange reserves and stronger economic growth in Taper 2 vis-à-vis Taper 1 period imply that the Indian economy is in a much better shape to withstand Fed tightening and manage any associated change in volatility in financial markets (Chart 6). 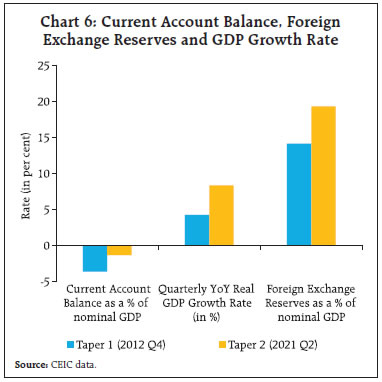 Inflation dynamics in India were also vastly different in Taper 1 vis-à-vis Taper 2 announcement period. In contrast to the multiple indicator approach in 2013, monetary policy currently operates under an inflation targeting regime with a well-defined inflation target that anchors inflation expectations. Inflationary pressures were much higher in 2013 with headline consumer price index (CPI) inflation at 9.10 per cent in April 2013 as opposed to 4.48 per cent in October 2021 (Chart 7). Food inflation is a major component of headline inflation and has a tendency to spillover to core components. Food inflation was at an elevated level in 2013 as compared to 2021. V. Conclusion Monetary policy of systemically important advanced economies has the potential to exert a significant impact on financial markets in emerging economies through their impact on global financial conditions. Geopolitical risks have also altered the current global environment and the backdrop of operation of international monetary policy. The first episode of Fed taper announcement in 2013 led to an abrupt tightening of financial conditions, significant capital outflows and large currency depreciation in emerging economies. This article contrasted the impact of Fed taper announcement in 2013 with the recent one in 2021 and analysed the differences in the impact of the two taper announcements on Indian equity, bond and currency markets. In terms of changes in government bond yields, yield curve, and exchange rate, the impact of the Taper 2 announcement was found to be rather muted. In comparison to Taper 1 announcement, movements in Indian equities, bond, and currency market volatility were also observed to be rather muted in Taper 2 announcement period. The Indian financial markets’ mild response to Taper 2 announcement can be linked to the country’s strong external sector position during the Taper 2 announcement period. However, there are evidences of large volatility spillovers from the US to Indian equity and bond markets. This emphasizes the need for readiness among EMEs in terms of adequate buffers, pre-emptive and calibrated state contingent and data dependent policy responses to withstand future volatility spillovers. 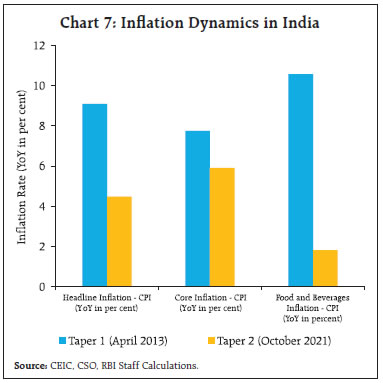 References Aizenman, J., Binici, M., & Hutchison, M. M. (2014). “The transmission of Federal Reserve tapering news to emerging financial markets (No. w19980)”. National Bureau of Economic Research. Aizenman, J., Chinn, M. D., and Ito, H. (2016). “Monetary policy spillovers and the trilemma in the new normal: Periphery country sensitivity to core country conditions”. Journal of International Money and Finance, 68, 298-330. Aizenman, J., Chinn, M. D., and Ito, H. (2017). “Balance sheet effects on monetary and financial spillovers: The East Asian crisis plus 20”. Journal of International Money and Finance, 74, 258-282. Bollerslev, T., Engle, R. F., & Wooldridge, J. M. (1988). “A capital asset pricing model with time-varying covariances”. Journal of political Economy, 96(1), 116- 131. Basu, K., Eichengreen, B., & Gupta, P. (2015, August). “From tapering to tightening: The impact of the fed’s exit on India”. In India Policy Forum (Vol. 11, No. 1, pp. 1-66). National Council of Applied Economic Research Bernanke, B. S. (2020). “The new tools of monetary policy”. American Economic Review. 110(4). 943-83. Bowman, D., Londono, J. M., & Sapriza, H. (2015). “US unconventional monetary policy and transmission to emerging market economies”. Journal of International Money and Finance, 55, 27-59. Bruno, V., & Shin, H. S. (2015). “Capital flows and the risk-taking channel of monetary policy”. Journal of monetary economics, 71, 119-132. Eichengreen, B., & Gupta, P. (2015). “Tapering talk: The impact of expectations of reduced Federal Reserve security purchases on emerging markets”. Emerging Markets Review, 25, 1-15. Engle, R. F., & Bollerslev, T. (1986). “Modelling the persistence of conditional variances”. Econometric reviews, 5(1), 1-50. Gagnon, J., Raskin, M., Remache, J., and Sack, B. (2011). “The financial market effects of the Federal Reserve’s large-scale asset purchases”. International Journal of Central Banking, 7(1), 45-52. Ghosh, S., & Saggar, M. (2017). “Volatility spillovers to the emerging financial markets during taper talk and actual tapering”. Applied Economics Letters, 24(2), 122-127. Greenwood, R., and Vayanos, D., (2014). “Bond Supply and Excess Bond Returns”. The Review of Financial Studies 27 (3): 663–713 Hausman, J., & Wongswan, J. (2011). “Global asset prices and FOMC announcements”. Journal of International Money and Finance, 30(3), 547-571. Ihrig, J., Klee, E., Li, C. and Kachovec, J., (2018). “Expectations about the Federal Reserve’s Balance Sheet and the Term Structure of Interest Rates”. International Journal of Central Banking 14 (2): 341–90 Krishnamurthy, A., and Vissing-Jorgensen, A. (2011). “The Effects of Quantitative Easing on Interest Rates: Channels and Implications for Policy”. Brookings Papers on Economic Activity 42 (Fall): 215–65 Lin, M., & Niu, L. (2021). Echo over the great wall: “Spillover effects of QE announcements on Chinese yield curve”. Journal of International Money and Finance, 111, 102294. Mishra, M. P., Moriyama, M. K., N’Diaye, P. M. B., & Nguyen, L. (2014). “Impact of Fed tapering announcements on emerging markets”. International Monetary Fund. Patra, M. D., Khundrakpam, J. K., Gangadaran, S., Kavediya, R., & Anthony, J. M. (2016). “Responding to QE taper from the receiving end”. Macroeconomics and Finance in Emerging Market Economies, 9(2), 167-189. Wu, M. T. (2014). “Unconventional monetary policy and long-term interest rates”. International Monetary Fund.
Annex | Table: Univariate GARCH Results | Method: ML ARCH - Normal distribution (BFGS / Marquardt steps)
Included observations: 2922 after adjustments
GARCH = C(3) + C(4)*RESID(-1)^2 + C(5)*GARCH(-1) | | Dependent Variable | S&P 500 Returns | Sensex Returns | US 10-Year G-Sec Yield | India 10-Year G-Sec Yield | INR USD Return | | Constant | 0.0786 | 0.0629 | -0.0069 | -0.0070 | 0.0104 | | Lagged Value | -0.0543 | 0.0544 | -0.0560 | 0.0236 | 0.0059 | | Variance Equation | | Constant | 0.0430 | 0.0170 | 0.0523 | 0.0039 | 0.0037 | | RESID(-1)^2 | 0.1966 | 0.0751 | 0.0792 | 0.0671 | 0.0733 | | GARCH(-1) | 0.7651 | 0.9099 | 0.9157 | 0.9309 | 0.9033 | | R-squared | 0.0117 | -0.0027 | 0.0062 | 0.0014 | -0.0003 | | Adjusted R-squared | 0.0114 | -0.0030 | 0.0059 | 0.0011 | -0.0006 | | S.E. of regression | 1.0704 | 1.0790 | 3.0797 | 0.6660 | 0.4215 | | Sum squared resid | 3393.8900 | 3448.2600 | 28093.7800 | 1313.7400 | 526.1200 |
|