As the global economy recovers from the ravages of the COVID-19 pandemic, economic activity has been gaining momentum, but unevenly. Rising crude oil prices, emerging inflationary pressures and global policy uncertainty are the key risks. Domestically, high frequency indicators of activity are ticking up as the second wave abates. While banks and other financial institutions have resilient capital and liquidity buffers, and balance sheet stress remains moderate in spite of the pandemic, close monitoring of MSME and retail credit portfolios is warranted alongside the need for banks to reinforce buffers, improve governance and remain vigilant in the context of global spillovers. Introduction 1.1 Powered by the gathering pace of vaccination drives and large policy support, global economic activity is regaining momentum, although at an uneven and halting pace that is widely differentiated across national jurisdictions. Global trade is also recovering on the strength of rising demand amidst elevated freight rates and logistics costs, and slowly mending supply chains. Meanwhile, commodity prices, especially of crude, food and base metals, have surged to new highs, with inflationary implications as well as welfare losses for low income countries. 1.2 Monetary and fiscal stimulus and regulatory relief have engendered generally benign financial conditions globally. Accordingly, financial markets have extended gains with intermittent corrections. This has stretched equity valuations, with market-based inflation expectations pushing up bond yields, and as capital flows cautiously return to emerging market economies (EMEs) on the tailwinds of rekindled risk appetite, they have lifted currencies against a generally weakening US dollar. 1.3 Up until now, banking systems across the world have weathered the pandemic. Although credit growth is subdued, banks have been maintaining flows, supported by capital and liquidity buffers. The insurance sector has been buffeted by business continuity claims related to COVID-19 induced business disruption, cyber insurance and conduct risk as employees access corporate systems remotely. Banks and financial intermediaries, more generally, are bracing up to deal with the scars of the pandemic as well as pre-existing vulnerabilities, including the uncertain outlook for corporate finances, the balance of risks around sectors like commercial real estate, rising sovereign exposures and low interest rates that will test the financial sector’s resilience. 1.4 In India, the ferocity of the second wave has been unprecedented, but there are signs of its ebbing in several parts of the country, especially in the large cities. Economic activity has been dented by the shock to aggregate demand, especially in April and May 2021, but supply conditions in the farm sector, organised manufacturing and contact-lite services have shown resilience and adaptation to pandemic protocols. The improvement in global trade has enabled exports to recover on a sequential basis, while the hardening of international crude prices has translated into terms of trade losses. Inflation prints are increasingly reflecting cost push pressures although weak demand tempers a fuller pass through. 1.5 Domestic financial markets have been buoyed by the Reserve Bank’s systemic and targeted liquidity measures and sector-specific programmes of the Government, including guarantee support. Equity markets have recouped losses during the height of the second wave, bond markets are range-bound, and the Indian rupee is moving both ways in reaction to global spillovers. The credit market continues to see muted offtake in the face of persisting risk aversion and weak demand. 1.6 The banking system’s pre-pandemic capital and liquidity buffers have imparted resilience, with some of them accessing the market for fresh capital, and public sector banks having been allocated budgetary recapitalisation. Under this protective cover, banks have improved their financial performance and profitability. The true state of their balance sheets will be revealed once the effects of regulatory forbearances have fully played out. Among other financial intermediaries, liquidity stress has eased considerably among non-banking financial companies and the Reserve Bank is reaching out to smaller and vulnerable entities among them with targeted measures to shield them from the ravages of the second wave. In the insurance sector, premia collections in life and health insurance business have generally held up well. The mutual funds (MFs) industry is regaining lost ground; while the volume of fund mobilisation and redemption is muted in relation to a year ago, the investor base has increased substantially, and liquid asset buffers have shown a steady rise. 1.7 In this milieu, this chapter sets out global macroeconomic and financial market developments in Section I.1 as a backdrop for an overview of domestic macrofinancial developments and the evolving balance of risks with a focus on the corporate sector, the banking system and non-bank financial intermediation. As in the past, the chapter concludes with an analysis of the responses to the Reserve Bank’s half-yearly systemic risk survey. I.1 Global Backdrop I.1.1 Macrofinancial Developments and Outlook 1.8 Global economic performance improved in the first half of 2021, but in a manner so widely divergent across countries that unequal participation in the recovery could emerge as a downside risk going forward. A supportive financial environment and continued policy support have contributed to nurturing the recovery; the gamechanger has, however, been the speed and scale of vaccination and the consequent unlocking of advanced economies and some EMEs, including contact-intensive activities. In many EMEs, however, sheer lack of access to vaccines, the slow pace of vaccine deployment, new surges of infections and associated containment measures are operating as drags on the recovery, with a disproportionately high toll on the poorest and most vulnerable. Amidst these stark disparities, the Organisation for Economic Cooperation and Development (OECD) estimates that the pace of global economic activity moderated in the first quarter of 2021, with global GDP growth easing to 0.5 per cent (quarter-on-quarter, non-annualised). 1.9 Turning to the second quarter, global mobility stalled in April, but improved in May, especially in respect of recreation and retail in the advanced economies where containment is being eased. In contrast, there were declines in mobility in parts of Europe, Latin America and India where infections had recorded renewed surges. The global composite purchasing managers’ index (PMI) rose to a 11-year high in April, with services expanding at a higher pace than manufacturing for the first time since July 2020. In May 2021, the composite PMI increased to its highest level in over 15 years, with the services PMI at a 181-month high and above the manufacturing PMI for the second successive month (Chart 1.1). 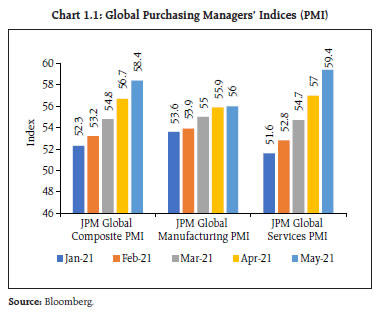 1.10 Global retail sales volumes have picked up again, after remaining unchanged for several months and business confidence has continued to improve. After growing by 3.5 per cent in the first quarter, global merchandise trade is continuing to recover, with the May 2021 reading of the World Trade Organisation’s (WTO) goods trade barometer at 109.7, almost 10 points higher than the baseline and 21.6 per cent higher than a year ago. On the downside, shipping costs continue to spiral – the Baltic Dry Index (BDI) surged to its highest level in more than a decade as supply disruptions continue to co-exist with a bounce back in demand (Chart 1.2). 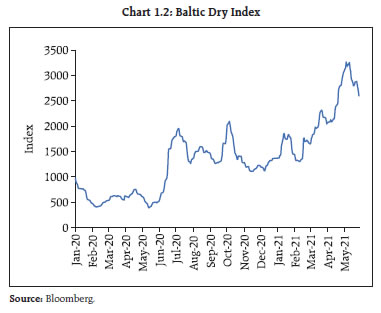 1.11 Alongside these developments, several risks have emerged on the horizon. The dominant one is the evolution of the virus, especially as more contagious and lethal variants emerge and test vaccine efficacy. Second, input cost pressures are elevated. The recent upturn in inflation reflects these pressures stemming from commodity price increases, apart from steepening shipping costs, and the ongoing normalisation of prices in pandemic-hit sectors, including one-off tax and margin increases. While the current assessment is that this pick-up will ease in the near-term in view of the substantial slack around the world and employment still way below pre-pandemic levels, close vigil is warranted. Third, tensions are building between policy authorities and markets on the timing and pace of normalisation of ultra-accommodative policies, with the latter anticipating that inflationary pressures will force the hand of authorities despite their forward guidance of extended accommodation. For the former, the dilemma of the trade-off between cliff effects of withdrawing stimulus too soon and ramp effects of a more gradual withdrawal but associated with the moral hazard of too prolonged a stimulus gets sharper by the day. 1.12 Against this backdrop, as per the International Monetary Fund (IMF), after an estimated contraction of –3.3 percent in 2020, the global economy is projected to grow at 6 percent in 2021 before moderating to 4.4 percent in 2022 and 3.3 per centover the medium-term1. In advanced economies, the strong pace of vaccination is expected to boost contact-intensive services as pent-up demand is released and funded by accumulated savings. Output is expected to emerge out of the decline of (-) 4.7 per cent in 2020 and grow by 5.1 per cent in 2021 and by 3.6 per cent in 2022. In emerging and developing countries, effective vaccine protection is likely to become available for most of the population only by late 2021 and hence containment measures may be needed in 2021 and 2022. Accordingly, GDP growth is projected to recover from (-) 2.2 per cent in 2020 to 6.7 per cent in 2021 and 5.0 per cent in 2022. As the recovery strengthens in 2021, global trade growth is projected to accelerate to 8.4 percent, mainly because of the rebound in merchandise volumes. Cross-border services trade is expected to remain subdued until the pandemic is brought under control everywhere. Although commodity prices (particularly for oil) are expected to firm up further in the months ahead, the increase is widely regarded as transitory. Hence, inflation is expected to revert to its long-term average – remaining below target in advanced economies and averaging below 5 per cent in emerging and developing economies in 2021 and 2022 (Table 1.1). 1.13 In the second quarter of 2021, financial markets have remained buoyant and financial conditions easy in a historical perspective. Advanced economy equity prices hit new all-time highs in late April on strong first quarter corporate results and reflation trade. Bond yields have traded range-bound on encouraging economic data, but the episode of sell-offs in the first quarter of 2021 is a reminder that bond yield surges could become more frequent, amplified by changes in financial systems. In the US Treasury market, the provision of liquidity has shifted away from traditional market-makers to so-called principal trading firms (PTFs), which create an illusion of ample liquidity during normal times but that liquidity has become more fragile during stress episodes. In EMEs, investor bases have broadened to encompass a larger domestic investor participation, contributing to greater liquidity and depth. Greater openness to international investors and issuers has also helped develop hedging markets. 1.14 The US dollar has weakened by 3.2 per cent in the second quarter of 2021 (up to June 6) on a trade-weighted basis, with opposite movements in other currencies. In EMEs, financial conditions have tightened with a rise in bond yields and in spreads. Net capital flows have returned to these economies since April and partly eased financial conditions. Moreover, stronger fundamentals in the form of current account surpluses or smaller deficits and higher international reserves have reduced external vulnerabilities for several of them. At the same time, risks remain. Greater international openness may make these economies vulnerable to future shocks, especially with the large presence of typically unhedged international investors in local currency bond markets. Also, mutual funds remain important players in EMEs. Since they tend to liquidate assets when their end investors redeem units, their actions may amplify portfolio flows as well as swings in emerging market yields, currencies and other asset prices in times of stress. | Table 1.1: Growth Projections for 2021 and 2022 | | (per cent) | | | 2020 | 2021* | 2022* | | Advanced Economies | -4.7 | 5.1 | 3.6 | | Emerging Markets and Developing Economies | -2.2 | 6.7 | 5.0 | | World | -3.3 | 6.0 | 4.4 | Source: World Economic Outlook, April 2021, International Monetary Fund (IMF).
Note *: Projections | 1.15 With the onset of the pandemic and its evolution, policy authorities across the world have sought to sustain the flow of credit to the private sector to alleviate liquidity strains among firms and households and mitigate economic scarring. A wide variety of measures have been implemented, as the country experience shows. Policy makers have sought to increase banks’ capacity to lend by either conserving or freeing up capital through measures such as restrictions on dividends, share buybacks and bonus payments; access to low cost financing from central banks; flexibility in provisioning standards; reducing regulatory capital buffer requirements; allowing temporary breaches of the liquidity coverage ratio. They have also endeavoured to increase the willingness of banks to lend by addressing the risk-adjusted return on loans (flexibility in asset classification; incentivising restructuring; direct fiscal transfers to borrowers to help reduce their credit risk; moratoriums on loan payments; prohibitions on foreclosures; loan guarantees; funding-for-lending schemes; and moral suasion) (Table 1.2). | Table 1.2: Channels for Policy Measures to Support Bank Lending | | Type of policy measure | Channel | | Increase banks’ capacity to lend | Increase banks’ willingness to lend | | Conserve capital | Free up resources | Maintain existing loans | Stimulate new loans | | Monetary | Central bank funding and liquidity facilities | | | Funding-for-lending schemes | | Prudential | Restrict capital distributions | Release buffers | Restructuring loans/NPLs | Moral suasion | | Treatment of expected losses | Increase flexibility of capital and liquidity requirements
Increase flexibility of risk weight classifications | | | | Fiscal or other | | | Payment moratoriums Transfers to borrowers | Loan guarantees | Note: Measures might work through multiple channels, but each is shown once for illustration.
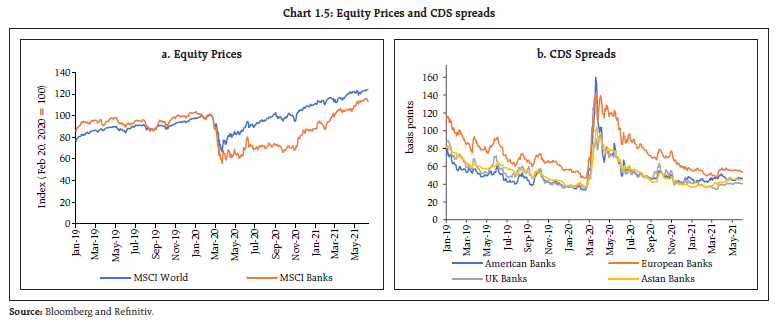
Source: Bank for International Settlements (BIS) | 1.16 Overall, these policy responses mitigated the risk of a credit crunch and eased lending conditions. While guarantees provided an impetus to lending, particularly corporate lending, the impact of moratoriums on bank lending is less clear, except when implemented jointly with guarantees. Restrictions on bank capital distributions are also correlated with increased loan growth. Country-level evidence suggests that a large share of incentivised lending went to new loans and even first-time borrowers. As a result of fiscal and monetary support measures, banks’ funding costs and lending rates have declined to historical lows. In the case of funding-for-lending schemes, small and medium enterprises were typically the beneficiaries, but such policies, especially moratoriums, seem effective only in the short term and could have created incentives for the zombification of some firms. 1.17 Banks entered the pandemic with relatively strong balance sheets, benefiting from the reforms undertaken in the aftermath of the global financial crisis (GFC). Armed with higher levels and quality of capital, better liquidity and more stable funding, the banking sector is in a better position to cushion shocks and absorb losses than in the past. Extensive measures taken by governments, central banks and prudential authorities to support the economy also helped to shield banks from the initial impact of the pandemic and to keep insolvencies low. As a result, banks’ asset quality has not deteriorated as much as would have been expected from the sharp drop in economic activity in 2020. Furthermore, during the early months of the crisis, banks substantially increased provisions for expected losses (Chart 1.3). 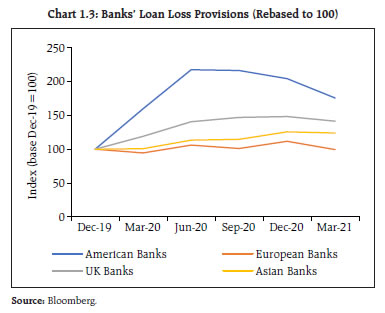 1.18 Banks with higher pre-provision earnings tended to announce higher provisions. In contrast to the positive relationship observed with earnings, provisions were not positively related to bank capital. In fact, banks with higher capital ratios announced lower provisions, indicating that they were not motivated as much by capital preservation as by the change in accounting standards to provision on the basis of expected credit losses (ECL). Lower provisions helped the return on assets (ROA) to recover from the lows hit in the initial stages of the pandemic. Despite lower profits, capital ratios rose in developed market banking systems (Chart 1.4). Banks in countries that implemented restrictions on dividends or share buybacks saw the largest increases in capital ratios. Temporary exemptions from prudential rules also mitigated declines in capital ratios in some countries. 1.19 Concerns about banks’ profitability led credit rating agencies to downgrade or assign a negative outlook to many banks. As of April 2021, those on negative outlook still outnumbered those with stable or positive outlooks. While equity prices and credit default swap (CDS) spreads for banks lagged the broad market rebound, they largely recovered to their pre-crisis levels by early 2021 (Chart 1.5). A notable exception was banks in a number of EMEs, where CDS spreads drifted wider starting from late February 2021 because of the tightening of global financial conditions and country risk. In general, the crisis has not caused investors to fundamentally reassess banks’ prospects. 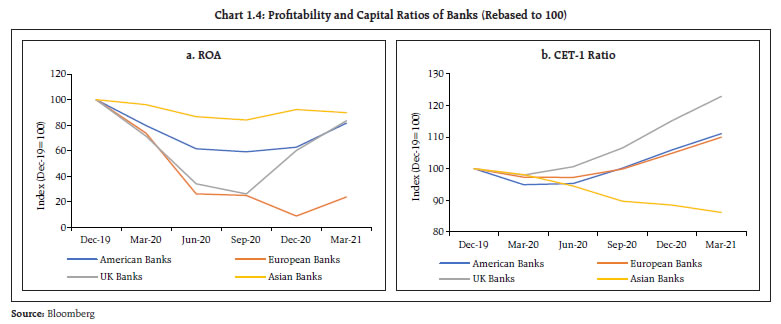
 1.20 The most immediate challenge for banks worldwide is a possible rise in corporate insolvencies and non-performing assets (NPLs). The outlook remains uncertain, though. The health of their balance sheets is tied closely to the strength of the recovery and the continuation of policy support. Historical experience shows that credit losses remain elevated for several years after recessions end. Indeed, in EMEs, non-performing assets typically peak six to eight quarters after the onset of a severe recession (BIS, 2021). Eventually, support measures will be phased out. The longer that blanket support is continued, the higher the risk that it props up persistently unprofitable firms (“zombies”), with adverse consequences for future economic growth. Prolonging support also risks undermining the sustainability of public finances. Furthermore, it might delay the recognition of losses, which could reduce confidence in banks’ asset quality and capitalisation and may raise their funding costs. If support measures are phased out before firms’ cash flows recover, however, banks will have to increase provisions and might tighten lending standards to preserve capital which might, in turn, undermine the recovery. Banks need sufficient buffers to absorb losses along the entire path to full recovery. Another looming concern is banks’ sovereign exposures, especially with debt/GDP ratios rising to historically high levels. Moreover, banks’ exposure to highly leveraged non-bank financial intermediaries (NBFIs) and hedge funds can turn adverse, as the events of March 2021 showed. A contingent risk is the environment of “low-for-long” interest rates which tends to depress net interest margins and thus profitability. Other pre-existing challenges facing banks include climate-related risks, cyber attacks, increased competition from the entry of fintechs and the growing presence of big techs in financial services. 1.21 Big techs offer a wide range of digital financial services and have a substantial footprint in the payment systems, crowdfunding, asset management, banking and insurance of several advanced and emerging market economies. While this holds the promise of supporting financial inclusion and generating lasting efficiency gains, including by encouraging the competitiveness of banks, important policy issues arise. Specifically, concerns have intensified around a level playing field with banks, operational risk, too-big-to-fail issues, challenges for antitrust rules, cybersecurity and data privacy2. Big techs present at least three unique challenges. First, they straddle many different (non-financial) lines of business with sometimes opaque overarching governance structures. Second, they have the potential to become dominant players in financial services. Third, big techs are generally able to overcome limits to scale in financial services provision by exploiting network effects. For central banks and financial regulators, financial stability objectives may be best pursued by blending activity and entity-based prudential regulation of big techs (an activity-based approach is already applied in areas such as anti-money laundering [AML] /combating the financing of terrorism [CFT]; an activity-based approach is the provision of cloud services, where minimising operational and in particular, cyber risk is paramount). Furthermore, as the digital economy expands across borders, international coordination of rules and standards becomes more pressing. 1.22 The pandemic response saw a tight interaction of monetary and fiscal policy. As monetary policy has sought to control a larger segment of the yield curve, the overlap with public debt management has grown. With monetary policy committed to an easy stance for some time in many countries, the fiscal stance becomes important. Too loose a fiscal stance could cause inflation surprises and financial conditions could tighten. A more constrained fiscal policy would add pressure on monetary policy. It would test the efficacy of further monetary expansion and could heighten intertemporal trade-offs. The extraordinary combination of high debt-to-GDP ratios and ultra-low interest rates raises three challenges: the risk of fiscal dominance; the risk that fiscal positions may ultimately prove unsustainable; and the complications of the possible joint “normalisation” of fiscal and monetary policies. Growth-friendly fiscal policy can help by effectively targeting public infrastructure and productivity. 1.23 Global public debt rose to an all time high as the pandemic-induced decline in government revenues and increased spending to support growth-oriented policies and other pandemic related measures led to a sharp increase in fiscal gaps (Table 1.3). | Table 1.3: General Government Fiscal Balance and Gross Debt, 2019-22 | | (per cent of GDP) | | | Overall Fiscal Balance | Gross Debt | | Actual | Current Projections | Actual | Current Projections | | 2019 | 2020 | 2021 | 2022 | 2019 | 2020 | 2021 | 2022 | | World | -3.7 | -10.8 | -9.2 | -5.4 | 83.7 | 97.3 | 98.9 | 99.0 | | Advanced Economies | -2.9 | -11.7 | -10.4 | -4.6 | 103.8 | 120.1 | 122.5 | 121.7 | | Emerging Markets and Developing Economies | -4.7 | -9.8 | -7.7 | -6.7 | 54.7 | 64.4 | 65.1 | 67.3 | | Asia | -6.0 | -10.8 | -9.2 | -8.2 | 57.3 | 67.6 | 69.9 | 73.0 | | Europe | -0.7 | -5.9 | -3.5 | -2.7 | 29.2 | 37.6 | 36.9 | 37.2 | | Low-Income Developing Countries | -3.9 | -5.5 | -4.9 | -4.4 | 44.3 | 49.5 | 48.6 | 48.2 | | Source: IMF Fiscal Monitor, April 2021 update | 1.24 Aggregate public and private debt for a sample of 61 countries rose by USD 24 trillion in 2020 alone (Chart 1.6), making up over a quarter of the USD 88 trillion rise over the past decade. The pandemic also took its toll on private sector and household indebtedness and the debt of the private non-financial sector stood at USD 214 trillion in 2020, up from USD 194 trillion in 2019. I.1.2 Capital Flows and Exchange Rate Volatility 1.25 The episode of capital outflows from emerging market economies (EMEs) triggered by the outbreak of the pandemic, was followed by a resumption that began in June 2020. Capital flows picked up strongly in the ensuing months as risk appetite returned with positive news on COVID-19 vaccines (Chart 1.7). 1.26 EMEs’ local currency bond portfolio returns in USD terms have outperformed local currency returns, benefiting from exchange rate gains (Chart 1.8) and hence attractive carry for risk taking. 1.27 Cross-currency (CCY) basis swaps remain a major hedging tool. Hence, the basis in such swaps is a good indicator of the underlying demand for US dollar assets (funding) from non-US participants. The movement in cross-currency basis swaps for Euro and JPY (1 and 3-year tenors) shows that the spike in underlying demand for US dollar funding following the COVID-19 pandemic in March and April, 2020 normalised in subsequent months, largely owing to the bilateral currency swap facility instituted by the US Fed (Charts 1.9 and 1.10). I.1.3 COVID-19 and Impact on Asset Quality of Banks 1.28 Some insights into the impact of COVID-19 on banks’ asset quality can be gleaned from the European Banking Authority (EBA)’s published list of credit risk metrics that are based on supervisory returns of European Union (EU) banks, including the health of the banks’ corporate and non-corporate counterparties across major EU and non-EU regimes. The median default rate observed for corporate obligors showed a year-on-year increase in Q4:2020, led by small and medium enterprises (SMEs) (Table 1.4). 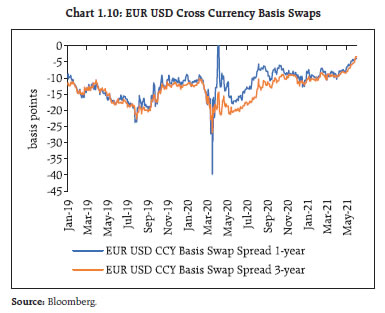
| Table 1.4: Default Rates by Country of Counterparty for EU IRB3 Banks – Corporate Obligors | | | Default Rate | | Q4: 2019 | Q4:2020 | | 50TH percentile | 75TH percentile | Weighted Average | 50TH percentile | 75TH percentile | Weighted Average | | France | Corporates | 0.61 | 1.12 | 1.09 | 0.88 | 1.51 | 0.90 | | Of which: SME | 0.83 | 3.23 | 2.18 | 0.82 | 2.73 | 1.55 | | Germany | Corporates | 0.40 | 0.98 | 0.84 | 0.61 | 1.32 | 0.85 | | Of which: SME | 0.58 | 1.39 | 0.70 | 1.07 | 2.07 | 0.85 | | Italy | Corporates | 0.19 | 1.20 | 1.38 | 0.58 | 0.77 | 0.69 | | Of which: SME | 1.53 | 2.32 | 2.73 | 1.21 | 5.13 | 1.16 | | United Kingdom | Corporates | 0.98 | 2.17 | 1.27 | 0.99 | 3.67 | 1.18 | | Of which: SME | 0.21 | 2.52 | 2.50 | 2.62 | 7.88 | 4.07 | | Canada | Corporates | 0.00 | 0.27 | 0.34 | 0.02 | 0.64 | 0.64 | | Of which: SME | 0.00 | 1.31 | 2.36 | | | | | United States | Corporates | 0.49 | 1.01 | 0.62 | 0.92 | 2.81 | 1.13 | | Of which: SME | | | | 0.16 | 1.51 | 0.35 | | India | Corporates | 0.35 | 3.22 | 1.55 | 3.27 | 6.91 | 2.86 | | Of which: SME | | | | | | | | Source: EBA risk dashboard |
| Table 1.5: Default Rate by Country of Counterparty for EU IRB Banks- Retail Obligors | | | Default Rate | | Q4: 2019 | Q4:2020 | | 50TH percentile | 75TH percentile | Weighted Average | 50TH percentile | 75TH percentile | Weighted Average | | France | Retail | 0.66 | 1.76 | 0.69 | 0.77 | 1.46 | 0.58 | | Of which: Other Retail | 1.32 | 3.74 | 1.05 | 1.38 | 3.13 | 0.89 | | Germany | Retail | 0.63 | 1.08 | 0.57 | 0.75 | 2.02 | 0.62 | | Of which: Other Retail | 0.86 | 2.05 | 1.09 | 1.12 | 2.34 | 1.26 | | Italy | Retail | 0.57 | 1.53 | 4.63 | 1.05 | 1.97 | 4.17 | | Of which: Other Retail | 1.07 | 2.67 | 6.32 | 1.68 | 3.32 | 5.35 | | United Kingdom | Retail | 0.84 | 2.48 | 0.63 | 0.80 | 1.67 | 0.66 | | Of which: Other Retail | 1.20 | 3.11 | 2.26 | 1.21 | 2.81 | 2.30 | | Canada | Retail | 0.26 | 0.94 | 0.37 | 0.25 | 1.41 | 0.43 | | Of which: Other Retail | 0.76 | 2.86 | 1.42 | 0.40 | 3.16 | 2.00 | | United States | Retail | 0.30 | 1.30 | 1.06 | 0.38 | 1.75 | 1.29 | | Of which: Other Retail | 0.48 | 1.66 | 3.09 | 0.83 | 3.74 | 3.71 | | India | Retail | 0.25 | 0.86 | 0.22 | 0.36 | 2.68 | 2.17 | | Of which: Other Retail | 0.25 | 5.64 | 0.23 | 4.43 | 12.73 | 5.04 | Note: ‘Other retail’ excludes (i) retail exposure secured on real estate and (ii) qualifying revolving retail exposure as per IRB asset classification under CRE 30.
Source: EBA risk dashboard | 1.29 The performance of the retail portfolio also deteriorated in five of the seven countries listed, with the segment “other retail” (i.e., excluding (a) retail exposure secured on real estate and (b) qualifying revolving retail exposure as per Basel norms) driving the rise in impairments (Table 1.5). 1.30 Additionally, a comparison of the adjusted probability of default (PD) for the credit portfolio for corporate and retail borrowers indicates that the median as well as the weighted average PD for corporate obligors have generally risen across countries, led by the SME portfolio (Table 1.6). | Table 1.6: Adjusted probability of default (PD) by Country of the Counterparty for EU IRB Banks - Corporate Obligors | | | Probability of Default (PD) | | Q4: 2019 | Q4:2020 | | 50TH percentile | 75TH percentile | Weighted Average | 50TH percentile | 75TH percentile | Weighted Average | | France | Corporates | 0.55 | 1.55 | 1.63 | 0.65 | 1.75 | 1.84 | | Of which: SME | 2.14 | 3.36 | 2.62 | 2.23 | 4.80 | 3.04 | | Germany | Corporates | 0.66 | 1.43 | 1.01 | 0.75 | 1.31 | 1.09 | | Of which: SME | 1.78 | 3.63 | 1.22 | 1.22 | 2.71 | 1.19 | | Italy | Corporates | 1.12 | 2.69 | 5.90 | 1.28 | 2.64 | 4.84 | | Of which: SME | 3.14 | 8.21 | 9.30 | 2.67 | 8.69 | 9.74 | | United Kingdom | Corporates | 0.73 | 1.21 | 1.22 | 0.87 | 1.99 | 1.60 | | Of which: SME | 1.68 | 4.40 | 2.26 | 2.13 | 3.97 | 2.40 | | Canada | Corporates | 0.48 | 1.05 | 1.02 | 1.00 | 1.70 | 1.52 | | Of which: SME | 1.78 | 3.56 | 1.76 | 1.53 | 3.24 | 1.87 | | United States | Corporates | 0.54 | 1.04 | 0.96 | 0.75 | 1.48 | 1.20 | | Of which: SME | 1.19 | 2.97 | 2.62 | 1.30 | 4.04 | 2.55 | | India | Corporates | 0.71 | 1.96 | 2.88 | 1.27 | 4.55 | 3.94 | | Of which: SME | 2.52 | 4.44 | 4.81 | 2.57 | 12.47 | 7.01 | | Source: EBA risk dashboard. |
| Table 1.7: Adjusted probability of default (PD) by Country of the Counterparty for EU IRB Banks - Retail Obligors | | | Probability of default (PD) | | Q4: 2019 | Q4:2020 | | 50TH percentile | 75TH percentile | Weighted Average | 50TH percentile | 75TH percentile | Weighted Average | | France | Retail | 1.37 | 1.98 | 1.69 | 1.25 | 1.99 | 1.47 | | Of which: Other Retail | 2.26 | 4.05 | 2.07 | 2.37 | 4.10 | 1.88 | | Germany | Retail | 1.51 | 2.27 | 1.04 | 1.31 | 2.67 | 0.88 | | Of which: Other Retail | 2.38 | 3.67 | 1.92 | 2.22 | 4.03 | 1.72 | | Italy | Retail | 1.56 | 2.47 | 2.43 | 1.18 | 2.26 | 2.28 | | Of which: Other Retail | 2.30 | 4.34 | 5.44 | 2.52 | 4.99 | 5.42 | | United Kingdom | Retail | 1.60 | 3.02 | 1.53 | 1.40 | 2.90 | 1.51 | | Of which: Other Retail | 2.64 | 4.54 | 2.90 | 2.41 | 3.86 | 4.05 | | Canada | Retail | 1.03 | 1.73 | 0.64 | 0.90 | 1.84 | 0.68 | | Of which: Other Retail | 1.74 | 3.24 | 2.03 | 1.57 | 3.00 | 2.16 | | United States | Retail | 1.25 | 2.19 | 1.86 | 1.17 | 2.50 | 1.91 | | Of which: Other Retail | 2.17 | 4.04 | 2.41 | 2.38 | 4.62 | 2.75 | | India | Retail | 0.85 | 2.62 | 5.02 | 0.99 | 2.50 | 8.57 | | Of which: Other Retail | 2.39 | 5.55 | 3.88 | 2.80 | 6.70 | 6.30 | | Source: EBA risk dashboard. | 1.31 In contrast, these indicators have held up well for the retail portfolio (with the exception of India), underlining the significant fiscal support extended to protect retail credit in the wake of the pandemic (Table 1.7). I.1.4 London Inter Bank Offered Rate (LIBOR) Transition 1.32 On March 5, 2021 the UK’s Financial Conduct Authority (FCA), announced that all LIBOR settings for all currencies will either cease or no longer be representative after (a) 31st December 2021, for the Pound Sterling, Euro, Swiss Franc and Japanese Yen in all tenors, and for US Dollar 1-week and 2-month settings; and after (b) 30th June 2023, for US Dollar overnight, 1-month, 3-month, 6-month and 12-month settings. 1.33 Regulatory authorities and public and private sector working groups in several jurisdictions, including the International Swaps and Derivatives Association (ISDA), the Sterling Risk-Free Rates Working Group, the Working Group on Euro Risk-Free Rates and the Alternative Reference Rates Committee (ARRC), have been discussing alternative risk-free rate (RFR) based benchmark rates to replace the LIBOR as well as to manage the transition. Of the major currencies transitioning to RFR regime by end-December 2021, only the Pound Sterling (GBP) has a significant proportion (51 per cent) of its interest rate risk in the interest rate derivative portfolio being generated out of an RFR linked index as on April 2021, with the Swiss franc (CHF) being a distant second (16.7 per cent) (Table 1.8). | Table 1.8: Percentage DV01 Contributed by RFRs - Currency Wise | | Month | USD | EUR | GBP | JPY | AUD | CHF | | Jan-20 | 1.8 | 0.2 | 41.1 | 1.8 | 61.8 | 6.0 | | Feb-20 | 2.1 | 0.2 | 34.8 | 2.9 | 66.3 | 8.1 | | Mar-20 | 1.7 | 0.2 | 28.8 | 4.2 | 49.0 | 4.7 | | Apr-20 | 1.6 | 0.1 | 21.0 | 3.0 | 13.1 | 6.9 | | May-20 | 1.9 | 0.0 | 29.8 | 1.3 | 31.3 | 7.1 | | Jun-20 | 3.1 | 0.3 | 24.4 | 2.6 | 9.2 | 7.6 | | Jul-20 | 4.9 | 0.2 | 31.8 | 1.7 | 17.1 | 6.4 | | Aug-20 | 4.4 | 0.2 | 30.4 | 2.1 | 13.2 | 7.6 | | Sep-20 | 5.8 | 0.5 | 39.2 | 2.5 | 31.7 | 7.0 | | Oct-20 | 9.7 | 0.4 | 40.4 | 4.7 | 36.4 | 4.6 | | Nov-20 | 5.6 | 1.0 | 33.6 | 5.1 | 18.4 | 6.2 | | Dec-20 | 5.6 | 0.7 | 40.5 | 2.8 | 17.5 | 5.9 | | Jan-21 | 5.6 | 1.2 | 45.9 | 3.5 | 3.1 | 7.7 | | Feb-21 | 5.1 | 1.3 | 45.8 | 3.5 | 5.2 | 8.8 | | Mar-21 | 4.7 | 0.9 | 44.9 | 2.4 | 5.1 | 6.3 | | Apr-21 | 7.5 | 1.3 | 51.0 | 3.9 | 6.0 | 16.7 | Note: DV01 measures the risk of bond portfolio (viz., the price change in response to one basis point change in yield).
Source: International Swaps and Derivatives Association (ISDA) Clarus RFR adoption indicator. | 1.34 For risk generated in interest rate derivatives beyond two years, however, RFR linked indices contribute a significant proportion across currencies, with the exception of the Australian dollar (AUD) (Table 1.9). | Table 1.9: Percentage DV01 Contributed by RFRs for Tenors Greater than 2 Years - Currency Wise | | Month | USD | EUR | GBP | JPY | AUD | CHF | | Jan-20 | 4.3 | 30.3 | 12.1 | 56.8 | 0.1 | 31.2 | | Feb-20 | 7.0 | 51.1 | 15.8 | 65.1 | 0.1 | 21.2 | | Mar-20 | 4.4 | 87.2 | 18.6 | 59.8 | 0.3 | 28.3 | | Apr-20 | 5.2 | 49.6 | 33.4 | 41.4 | 0.4 | 32.1 | | May-20 | 5.1 | 42.7 | 23.0 | 43.3 | 0.1 | 47.3 | | Jun-20 | 8.9 | 78.6 | 27.3 | 62.1 | 2.0 | 38.8 | | Jul-20 | 28.0 | 41.9 | 18.5 | 44.6 | 0.5 | 21.9 | | Aug-20 | 22.8 | 72.4 | 23.5 | 58.8 | 1.1 | 34.9 | | Sep-20 | 36.2 | 87.8 | 15.2 | 39.8 | 0.8 | 32.6 | | Oct-20 | 62.1 | 73.6 | 23.2 | 73.3 | 0.1 | 30.6 | | Nov-20 | 27.7 | 89.4 | 36.5 | 77.3 | 0.3 | 36.7 | | Dec-20 | 24.7 | 66.2 | 24.4 | 62.1 | 1.3 | 16.6 | | Jan-21 | 27.1 | 88.2 | 29.0 | 58.6 | 6.5 | 84.8 | | Feb-21 | 32.0 | 89.0 | 44.1 | 54.2 | 7.3 | 75.9 | | Mar-21 | 30.1 | 67.7 | 59.9 | 48.5 | 10.2 | 61.4 | | Apr-21 | 30.1 | 65.6 | 65.3 | 73.1 | 2.6 | 70.9 | | Source: ISDA Clarus RFR adoption indicator. | I.1.5 Commodity Markets 1.35 Global commodity markets have recorded a broad-based upswing in prices in the recent period. Sharp rebounds in key economies and improvement in global trade, combined with shortfalls in key food items, have propelled the upsurge, with ample global liquidity contributing to financialisation of commodity markets. 1.36 Crude prices continue to rise, supported by strong economic fundamentals in the US and China, and supply-side concerns. Crude futures rallied after bottoming out on April 5 and went into backwardation (Chart 1.11). In May 2021 the International Energy Agency (IEA) noted a rise in the world oil supply and projected further increases as the Organisation of Petroleum Exporting Countries plus (OPEC+) alliance continues to ease output cuts. It expects oil demand to take a temporary knock due to the sharp rise in India’s COVID-19 infections in Q2:2021, but it has kept its oil demand projections for H2:2021 unaltered, based on expectations of the pandemic being brought under control. 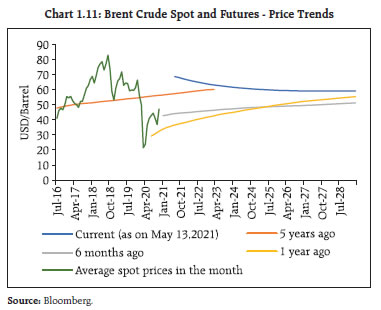 1.37 Industrial metals and base metals made strong gains backed by fundamentals and investor demand for commodity assets (Chart 1.12). Their prices have been supported by strong demand from China, the ongoing global economic recovery, supply disruptions, and a weaker U.S. dollar. China’s importdemand rose 51.1 per cent y-o-y in May 2021 and was at its highest since 20114. Of late, however, industrial metals and base metals have retraced some of the earlier gains in prices. 1.38 Global food prices rose for the twelfth month in a row in May 2021. The FAO Food Price Index(FFPI)5 rose by nearly 40 per cent in April 2021 (y-o-y) to its highest level since May 2014, led by strong increases in the prices of sugar, oils, meat, dairy and cereals (Chart 1.13). 1.39 The sustained buoyancy in commodity prices has fuelled expectations of a commodity super cycle building up, with the peak not yet in sight. These spiralling prices are also fuelling concerns about the potential impact on inflation across commodity importing countries. The rise in food prices could pose grave risks of increase in food insecurity and undernourishment in some low-income economies6. Meanwhile, climate change risks are ascending the hierarchy of threats to financial stability across advanced and emerging economies alike (Box 1). Box 1.1: Climate Change and Financial Stability: A Perspective The climate change debate is on the move, its focus now on financial stability. Consequently, the need for an appropriate framework to identify, assess and manage climate-related risk has become an imperative. For central banks, the impact of climate change on the financial system entails two major dimensions: monitoring financial entities’ exposure to climate risks as part of supervisory functions on an ongoing basis; and, stress testing to measure the resilience of the system against such risks. With regard to supervision of climate risks to the financial system, the Financial Stability Board (FSB) established the Task Force on Climate-related Financial Disclosures (TCFD), which has formulated guidelines to help firms include climate-related risks in their existing reporting processes. Overall, there has been an increased push towards integrating climate risks into the existing risk management framework of financial firms. Climate risk stress tests are different from the traditional regulatory stress-testing framework in terms of time horizon, reporting frequency, sectoral specificity, modelling approach and nature of output. With regard to approaches, attempts to quantify climate risks to the financial system can take two forms – top down and bottom up. Under a top down approach, the magnitude of risks can be estimated by using the sensitivity of exposures of the banking system to physical risk (based on geography) and transition risk (mostly based on carbon emissions of the sector). This provides a useful approximation of losses in a worst-case scenario across various sectors at a broad level, based on emission reduction. In the alternative bottom up approach, financial institutions themselves compute the impact of climate risk on their respective portfolios based on a common scenario (or scenarios) specified by the central bank. The systemic impact of climate stress induced losses can be estimated by aggregating the impact of climate risks of individual financial firms. Some central banks have already started to prepare to monitor and manage climate risks. The Bank of England has announced plans to launch its 2021 Biennial Exploratory Scenario in order to test the resilience of the UK financial system to the physical and transition risks associated with different climate pathways. A similar bottom-up approach is also being undertaken by Banque de France, taking into account the high-level scenarios given by the Central Banks and Supervisors Network for Greening the Financial System (NGFS) (Chart 1). The IMF has already begun working on macro-relevant climate data. In April 2021, it launched the experimental Climate Change Indicators Dashboard (CID) covering a) economic activity and climate indicators; b) cross border indicators; c) financial, physical, and transition risks indicators; and d) government policy indicators. The Reserve Bank joined NGFS as a member central bank in April 2021. A top-down impact assessment of technology-related transition costs in India’s iron and steel sector, based on sales turnover and incorporating the goals and the cost estimates envisaged by the Ministry of Steel7, shows that the operating profit coverage ratio (operating profit / interest cost) of the entire sector reduced from 3.8 to 3.5 (Chart 2). A cross industry cross disciplinary forum is required to launch a comprehensive climate risk assessment exercise for India. A key prerequisite is to develop emission reduction pathways for energy intensive sectors and map them onto macroeconomic and financial variables and integrate them with quantitative climate risk related disclosures to develop a holistic approach to addressing the financial stability risks arising out of climate change.
References: Bank of England (2019), ‘The 2021 Biennial Exploratory scenario on the Financial Risks from Climate Change’ (December 18) Banque De France (2020), ‘Scenarios and Main Assumptions of the ACPR Pilot Climate Exercise’ (July 17) The Central Banks and Supervisors Network for Greening the Financial System (2020), ‘NGFS Climate Scenarios for Central Banks and Supervisors’ (June 24) The Central Banks and Supervisors Network for Greening the Financial System (2021): Progress Report on Bridging Data Gaps’ (May 26) | I.2 Domestic Macrofinancial Risks 1.40 The ferocity and speed of transmission of the second wave of COVID-19 in India has imposed a deleterious human toll, severely stretching the medical infrastructure. It has also interrupted the recovery of the Indian economy that was underway during the second half of 2020-21. Although it has started subsiding after mid-May 2021, the destruction wrought by it has dwarfed the first wave in terms of infections and loss of lives. Business disruptions have, however, remained more contained as region-centric restrictions were preferred over a nation-wide lockdown. As large swathes of the population remain to be vaccinated, there are downside risks and potential externalities of global spillovers. I.2.1 Public Finances 1.41 The provisional accounts of the Controller General of Accounts (CGA) reveal that the gross fiscal deficit of the central government amounted to 9.3 per cent of GDP, undershooting the revised estimated (9.5 per cent). Apart from substantial loss of tax revenue, increased expenses towards social welfare measures and fiscal stimulus requirements in the wake of the pandemic impacted the fiscal accounts adversely and also resulted in the build-up of public debt (Table 1.10). | Table 1.10: Fiscal Indicators | | (per cent of GDP at market prices) | | | 2019-20
(Actuals) | 2020-21
(Provisional Actuals) | | Tax Revenue (Net) | 6.7 | 7.2 | | Non-Tax Revenue | 1.6 | 1.1 | | Revenue Expenditure | 11.6 | 15.6 | | Capital Expenditure | 1.6 | 2.2 | | Fiscal Deficit | 4.6 | 9.2 | | Source: Comptroller General of Accounts (CGA). | 1.42 Notwithstanding the contraction in GDP during the year, net tax revenue (provisional actual) was 5.9 per cent higher than the revised estimates (RE) due to buoyancy in the last quarter under corporation tax, other direct taxes, customs, excise duties and GST collections (centre). 1.43 With the expansion in the fiscal deficit, there was a quantum jump in market borrowings during 2020-21 and elevated levels persist into 2021-22 (Table 1.11). Given the revenue sharing arrangements between central and state governments, any revenue shortfall at the centre is likely to have a direct and proportionate effect on the fiscal position of state governments. | Table 1.11: Market Borrowings by the Central and State Governments | | (face value in ₹ crore) | | Item | Gross Amount | Net Amount | | 2019-20 | 2020-21 | 2021-22 | 2019-20 | 2020-21 | 2021-22* | | Government of India | 7,10,000 | 13,70,324 | 12,05,500 | 4,73,972 | 11,43,114 | 9,67,708 | | State Governments | 6,34,521 | 7,98,816 | NA | 4,87,454 | 6,51,777 | NA | Note *: Budget estimates
Source: RBI. |
| Table 1.12: Central Government Securities and State Development Loans – Key Investor Profile | | (per cent) | | End-March | SDL as a proportion of total SCBs’ domestic assets | GOI Securities as a proportion of SCBs’ domestic assets | Aggregate SLR securities as a proportion of SCBs’ domestic assets | SCBs' aggregate holding of G-Secs as a proportion of total outstanding G-Secs | SCBs' aggregate holding of SDL as a proportion of total outstanding SDL | Aggregate SLR holding by SCBs as a proportion of outstanding SLR-eligible securities | RBI holding as a proportion of total outstanding GOI securities | | 2021 | 7.3 | 16.2 | 23.5 | 37.8 | 33.7 | 36.4 | 16.2 | | 2020 | 6.7 | 15.1 | 21.8 | 39.8 | 34.9 | 38.2 | 15.1 | | 2015 | 5.0 | 16.5 | 21.6 | 43.3 | 42.9 | 43.2 | 13.5 | | 2008 | 3.8 | 19.2 | 23.0 | 50.7 | 52.3 | 51.0 | 7.8 | Note: As of end-March for all the years
Source: Reserve Bank of India | 1.44 In the absence of robust demand for credit, banks’ holdings of SLR securities (mainly government securities [G-secs] and state development loans [SDLs]) in March 2021 stood at their highest level since March 2010. During 2008-21, however, the share of banks in total G-Sec and SDL holdings has gradually declined, falling steadily from 51.0 per cent in 2008 to about 36.4 per cent in 2021 (Table 1.12). Insurance companies and providentfunds’ holdings8, by contrast, grew at 15.4 per centand 21.5 per cent9, respectively, during 2008-2021 and they held nearly 37 per cent of total SLR-eligible securities by March 2021. 1.45 From an active interest rate risk management perspective, the accounting classification of new securities in banks’ portfolio indicates that the held-to-maturity (HTM) holdings of G-Secs have not risen commensurate with their acquisition by public sector banks (PSBs) (Table 1.13). As a significant part of the newly acquired securities are held in the fair value portfolio of available for sale (AFS) / held for trading (HFT) (predominantly AFS for PSBs), it renders the profitability of PSBs particularly sensitive to secondary market yields (Table 1.14). | Table 1.13: Change in Holdings of G-Secs and SDLs, H2: 2020-21 | | (₹ crore) | | | G-Sec | SDLs | | SCBs | 1,32,704 | 73,573 | | Insurance Companies | 1,24,142 | 86,688 | | Provident Funds | -1,205 | 93,789 | | RBI | 1,65,820 | 30,000 | | Source: RBI. |
| Table 1.14: Bank-group wise increase in HTM holdings, H2:2020-21 | | (₹ crore) | | | G-Sec | SDLs | Others | Total | | Public Sector Banks (PSBs) | 63,357 | 1,14,317 | 54,074 | 2,31,747 | | Private Sector Banks (PVBs) | 47,236 | 37,621 | -10,132 | 74,726 | | Foreign Banks (FBs) | -771 | - | - | -771 | | All SCBs | 1,09,822 | 1,51,938 | 43,942 | 3,05,702 | Note: Based on 46 SCBs which account for about 98 per cent of the total assets of the banking system.
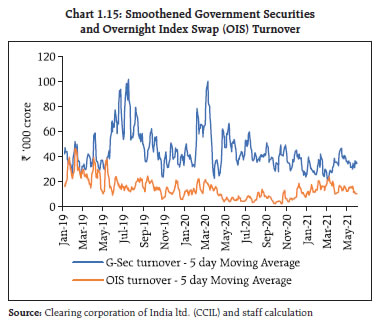
Source: Individual bank submissions to RBI. | I.2.2 Developments in Government Securities and Fixed Income Derivatives Markets 1.46 Shifts in yields of various tenors between September 2020 and December 2020 / May 2021 showed notable divergences, almost mirroring each other (Chart 1.14). While the sub 1-year tenor yields plunged during both the periods, they rose sharply till May 2021 in the above 1-year tenor, specifically in the tenors which witnessed large supplies owing to increased government borrowing. Yield movements across tenors were also non-parallel in both the periods, with the 10-year segment showing relatively smaller adjustments. Such idiosyncratic tenor specific yield adjustments make risk management challenging. The smoothened government securities turnover also indicates a general ebbing of trading interest, albeit with some recovery in 2021-22 (Chart 1.15). 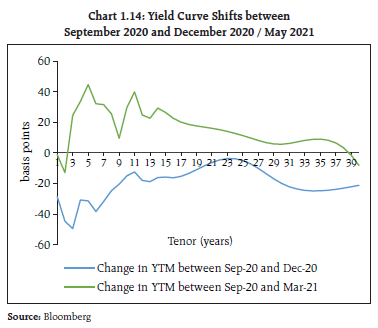
 1.47 Measuring market depth through thedifferential price impact (sale versus buy10) of a ₹25 crore buy and sell order in the 10-year on the run benchmark (Chart 1.16), it is found that during 2020-21, there were sharp peaks in February-March 2021 and a disproportionate price impact of sale relative to purchase. During the current financial year so far, however, the price impact of sell and buy has been offsetting, and no net price impact has been observed.
1.48 Surplus liquidity conditions and the accommodative monetary policy stance have driven down short-term interest rate expectations and kept the near end of the risk-free curve well anchored. As a result, the spread between the 3-month Treasury bill rate and both OIS and unsecured CD rates have narrowed down significantly (Charts 1.17-1.18). The risk-free and the OIS spread has also narrowed across the term structure, although the slope of both the risk-free and the OIS curves continues to steepen (Chart 1.19). 1.49 Aggregate portfolio holdings of non-bank primary dealers (PD) were also lower at end-March, 2021 relative to all the prior quarters since June 2019, except the quarter ending December 2020. The challenges in managing price risk in a relatively illiquid market is reflected in their capital deployment (represented as median non-bank PD portfolio VaR as a proportion to the portfolio), which has dipped in the current financial year (Chart 1.20).
I.2.3 Corporate Sector 1.50 After nosediving in H1:2020-21 due to pandemic-related restrictions, private corporate activity revived during H2:2020-21 after the gradual opening up of the economy. Nominal sales of 724 listed private manufacturing companies increased by 6.8 per cent and 31.7 per cent in Q3 and Q4:2020-21, respectively, and the rise was broad-based. IT companies remained in expansion zone throughout the pandemic period and recorded 6.5 per cent growth in sales during Q4:2020-21. The non-IT services sector, which recorded the maximum contraction during the pandemic, also witnessed signs of recovery in sales (Chart 1.21). 1.51 Operating profit margins of these companies remained nearly flat across sectors. Higher expenditure (e.g., raw materials) growth was compensated by increase in sales of manufacturing companies (Chart 1.22). 1.52 Leverage11 of 1360 listed private non-financial companies declined during H2:2020-21, relative to the previous period (Chart 1.23a). Also, as compared to pre-pandemic levels, cash holdings of these companies remained elevated, indicating precautionary savings by these companies in the face of heightened uncertainty. Their capital expenditure remained muted during this period, which was reflected in lowering of the ratio of fixed assets to total assets (Chart 1.23b). 1.53 An analysis of sources and uses of funds for 794 listed private manufacturing companies, where more detailed information is available, indicates higher profitability during H2:2020-21 and reinvestment of retained earnings as reserves and surplus, which became their major source of funds, which were mainly used for deleveraging, increasing cash holdings and inventory formation. I.2.4 Developments in External Sector and Foreign Exchange Derivative Market 1.54 Despite the adverse impact of the COVID-19 pandemic, India received strong interest from foreign portfolio investors on the back of stable financial market conditions, favourable economic prospects and easy liquidity conditions in the global financial markets. Powered by record receipts in the equity segment, net Foreign Portfolio Investment (FPI) inflow during 2020-21 stood at US$ 36.2 billion as against a net outflow of US$ 3.0 billion in the previous year. During the first two months of 2021-22 however, FPI recorded net outflows (Chart 1.24). 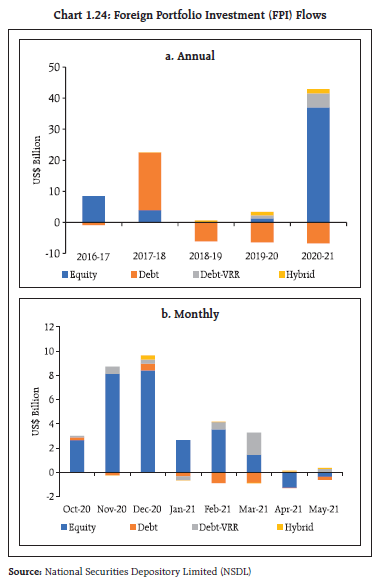 1.55 After a surplus of 3.0 per cent in H1: 2020-21, the current account balance reverted to a deficit of 0.7 per cent of GDP in H2: 2020-21 (Chart 1.25). The turnaround was led by a widening trade deficit and an increase in net investment income payments. There was an accretion to foreign exchange reserves to the tune of US$ 87.3 billion on balance of payments (BoP) basis during the year. The current level of foreign exchange reserves exceeds US$ 600 billion and provides some cushion against global spillovers. 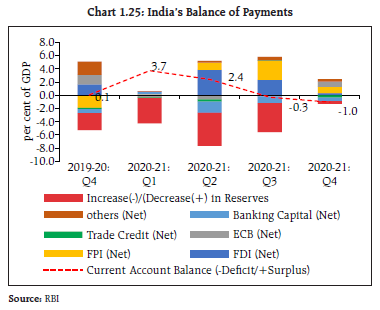 1.56 India’s merchandise exports and imports contracted by 7.3 per cent and 18.0 per cent, respectively, during 2020-21 which reflected deep recessionary conditions and collapse in world trade. External trade, however, witnessed a rebound in growth since Q3:2020-21 but the global trade environment is still uncertain under the pandemic. Risks have also emerged from the uptrend in prices of crude oil, edible oils and other commodities and rising inflation expectations in advanced economies. 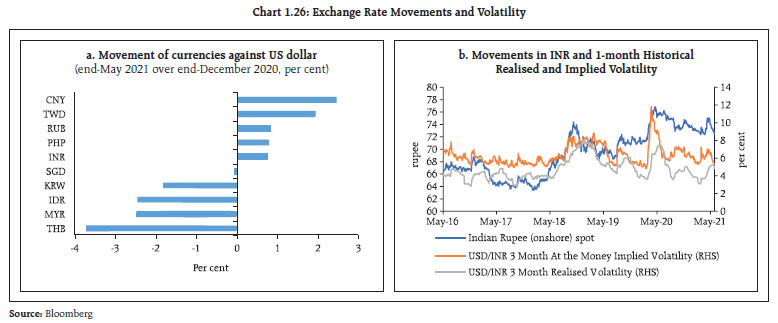 1.57 After depreciating to touch a historical low of ₹76.91 per US dollar on April 22, 2020 coinciding with large FPI outflows induced by the pandemic, the Indian rupee appreciated on the back of FPI inflows amidst revival of economic activity, positive developments on vaccines and easing of COVID-19 related restrictions. The Indian rupee has moved both ways in 2021-22 so far, largely reflecting changes in global risk perceptions on capital flows to EMEs and evolution of monetary policy in few advanced economies. While implied volatility has generally been range bound, realised volatility has moved higher (Chart 1.26). 1.58 Banks in India which operate IFSC Banking Units (IBUs) were permitted to participate in the non-deliverable forwards (NDF) market with effect from June 1, 2020. The non-deliverable trading volumes and monthly outstanding amount have generally increased, although turnover in client positions indicate no discernible trend(Charts 1.27-1.28). In the meanwhile, MIFOR-OIS spread12 remains wide, which has implications for hedging behaviour of entities with foreign exchange liabilities (Chart 1.29).
I.2.5 Developments in Debt Mutual Funds (MFs) 1.59 Resource mobilisation by debt mutual funds (MFs) suffered from idiosyncratic shocks such as corporate defaults during Q4: 2019-20, with pressure intensifying in March 2020 but, in the subsequent period, assets under management (AUM) of open-ended debt-oriented schemes and liquid asset holding of MFs have grown (Charts 1.30 and 1.31). Income/debt-oriented schemes are of systemic importance as the size of the debt mutual fund corpus is significant, with attendant spillover risk.
1.60 For money market instruments, excess returns may potentially mask illiquidity premia. In the case of liquid funds, excess returns, which turned negative in the wake of COVID-19 pandemic, are now in positive terrain (Chart 1.32). Given the size of the debt MFs, the embedded liquidity risk, which is an important ingredient of excess returns, is relevant. I.2.6 Valuation of Perpetual Bonds 1.61 Debt Mutual Funds (MFs) invest in certain debt instruments such as perpetual bonds (which are treated as additional tier-1 [AT-1] capital under extant banking regulations). AT-1 bonds are issued with special features like subordination to equity, whereby 100 per cent of the bonds can be written off even before equity capital is written off, and / or the bonds can be converted to equity upon trigger of a pre-specified event for loss absorption. However, the said bonds were being treated by the market as a nominal bond and were valued considering the first call date as a maturity date thereby leading to possible serious mispricing of risk. This was highlighted when the AT-1 bonds of a bank were written off while the equity capital was not. Therefore, in order to address potential mispricing of risk in the valuation of perpetual bonds, the Securities and Exchange Board of India (SEBI), reviewed the norms regarding investment in debt instruments with special features in March 2021 and introduced a standardised valuation regime for perpetual bonds to be implemented from April 01, 2021. Based on the representations from the mutual fund industry and other stakeholders, the SEBI subsequently introduced some modifications in the valuation norms (Table 1.15). 1.62 SEBI guidelines on valuation give primacy to the traded price. For the purpose of valuation of these perpetual bonds, valuation agencies look back 15 days for benchmark securities and 30 days for non-benchmark securities. If the security or similar security has traded during the look back period, it is valued at the traded price with necessary adjustment of spread. 1.63 The implications of the revised valuation norms on actual bond prices were analysed by using related bond prices of one large public sector bank and one large private sector bank. The prices of Additional Tier 1 (AT-1) bonds (callable in October, 2022) and Tier-2 bonds (maturity in December, 2022) of the private bank indicated a simultaneous dip around the event of write off, implying that credit events affected both the bonds, although given the differential seniority, prices of Tier-2 bonds recovered faster (Charts 1.33 a & b). Since the equity price of the entities are well above the book value, the decline is unlikely to have been caused by the loss absorbency provisions of the AT-1 instrument. | Table 1.15: Glide Path for Valuation | | Time Period | Deemed Residual Maturity of Basel III AT-1 bonds (years) | Deemed Residual Maturity of Basel III Tier 2 Bonds (years) | | Till March 31, 2022 | 10 | 10 years or contractual maturity whichever is earlier | | April 01, 2022 – September 30, 2022 | 20 | Contractual Maturity | | October 01, 2022 – March 31, 2023 | 30 | Contractual Maturity | | April 01, 2023 onwards | 100 * | Contractual Maturity | Note * :100 years from the date of issuance of the bond.
Source : SEBI | 1.64 Following the revised valuation norms, prices of AT-1 instruments had dipped, but this was succeeded by a sharp recovery for both PSB and PVB (Charts 1.33 a & b) possibly underlining the fact that their valuation is not fundamentally affected by regulatory dispensations on maturity. This shows that the basis for valuation by the investors of the underlying risk of the instrument has not fundamentally changed following the implementation of the new valuation norms. 1.65 However, the yields of the perpetual bond instruments of both the PVB and the PSB show a sharp rise from April 01, 2021. This has led to distortion between the relative costs of Tier-I and Tier-2 bonds (Charts 1.34 a & 1.34 b), although such repricing of risks have no relation to the underlying movements in their respective prices (Charts 1.33 a & 1.33 b).
1.66 The valuation norms also appear to have led to distortions in relative yields between these two entities. A comparison of the yield differential between a PSB AT-1 (callable on December 2023) and a PVB AT-1 (callable on October 2022) indicates that the yield differential between the two instruments has narrowed following the implementation of the valuation guidelines (Chart 1.35). I.2.7 Banking Stability Indicator 1.67 The banking stability indicator (BSI)13 of SCBs exhibited improvement in all five dimensions in March 2021 as compared to the previous year (Chart 1.36). In particular, soundness, profitability and liquidity components revealed noteworthy reduction in risk due to banks’ improved capital positions, better returns on assets and higher customer deposits to total assets ratio, respectively. I.2.8 Bank Credit 1.68 The environment for bank credit remains lacklustre in the midst of the pandemic, with credit supply muted by persisting risk aversion and subdued loan demand. Within this overall setting, underlying shifts are becoming more evident than before. Over recent years, the share of the industrial sector in total bank credit has declined whereas that of personal loans has grown (Table 1.16). Bank credit to the private corporate sector recorded a decline for the second successive year in 2020-21: its share in total bank credit has come down from 37.6 per cent to 27.7 per cent during the 7-year period 2014-2021. Also, the housing segment within personal loans has longer tenor loans for which stress tends to get reflected with a lag. | Table 1.16: Sectoral Share in Credit by SCBs | | (per cent, end-March) | | Sector | 2014 | 2021 | | Economic Sector | | a) Agriculture | 12.0 | 12.0 | | b) Industry | 42.7 | 28.9 | | c) Transport operators | 2.1 | 2.1 | | d) Professional and other Services | 7.6 | 7.4 | | e) Personal Loans | 16.2 | 26.3 | | of which, Housing Loan | 8.5 | 13.8 | | f) Trade | 9.2 | 10.8 | | g) Finance | 8.2 | 9.8 | | h) Others | 2.0 | 2.7 | | Total credit | 100.0 | 100.0 | | Organisational Sector | | i) Public Sector | 18.2 | 16.8 | | ii) Private Corporate Sector | 37.6 | 27.7 | | iii) Households Sector - Individuals | 33.4 | 43.2 | | iv) Household Sector – Others (including proprietary concerns, partnership firms, Hindu undivided families) | 9.2 | 10.3 | | v) Others (MFIs, NPISHs and NRIs) | 1.6 | 2.0 | | Total credit | 100.0 | 100.0 | MFI – Micro finance institution
NPISH – Non-profit institution serving household
NRI – Non-resident Indian
Source: Basic Statistical Returns, RBI | I.2.9 Wholesale Bank Credit14 1.69 The second wave of COVID-19 has accentuated the slowdown in wholesale credit relative to retailcredit15 (Chart 1.37). 1.70 Aggregate mobilisation of funds by wholesale corporate borrowers (from the banking sector as also through market instruments) has risen in relation to a year ago, largely driven by funding through market instruments, although efforts are underway to ease risk-related credit constraints through schemes such as the Emergency Credit Line GuaranteeScheme (ECLGS) and its recent expanded versions16 (Table 1.17). | Table 1.17: Aggregate Mobilisation of Funds | | (₹ thousand crore) | | Outstanding Amount under | Dec-19 | Mar-20 | Jun-20 | Sep-20 | Dec-20 | Mar-21 | | Commercial Papers (CPs) | 415 | 346 | 391 | 362 | 365 | 365 | | Non-convertible Debentures (NCDs)17 | 2,600 | 2,712 | 2,783 | 2,825 | 2,902 | 3,017 | | Wholesale credit18 | 5,290 | 5,582 | 5,507 | 5,410 | 5,439 | 5,620 | | Total | 8,305 | 8,640 | 8,681 | 8,597 | 8,706 | 9,002 | | Source: NSDL, Prime Database and CRILC |
Table 1.18: Growth in Wholesale Credit to Companies
(y-o-y, per cent unless otherwise stated) | | | Non-PSU | PSU | Total | | 2019-20 | 2020-21 | April-2021* | 2019-20 | 2020-21 | April-2021* | 2019-20 | 2020-21 | April-2021* | | PSBs | -4.3 | -6.3 | -3.1 | 19.4 | 3.7 | -4.8 | 2.6 | -2.9 | -3.7 | | PVBs | -0.9 | -1.9 | -6.6 | 44.4 | 58.5 | -7.5 | 2.2 | 3.8 | -6.7 | | PSBs+PVBs | -3.0 | -4.6 | -4.5 | 21.8 | 10.1 | -5.2 | 2.5 | -0.8 | -4.7 | Note *: Growth over March-2021
Source: CRILC and RBI staff calculations | 1.71 An analysis of the funded amount extended to companies (which accounts for 86 per cent of the total funded amount to wholesale borrowers) indicates that the banking sector’s exposure to this cohort remained flat over the year as increased flow of funds to PSUs by both PSBs and PVBs was more than offset by subdued lending to non-PSUs, particularly by PSBs (Table 1.18). During the current financial year so far, growth in wholesale credit to corporates has decelerated sequentially. Significantly lower rates on market instruments may have enabled the private corporate sector to reduce its aggregate banking sector exposure by accessing markets. 1.72 An analysis of wholesale credit to companies (excluding PSUs) based on rating grades reveals that there was sharp decline in exposures to well rated borrowers by both PSBs and PVBs. Credit growth to other investment grades was relatively lukewarm, which may also imply a somewhat uncertain risk profile for this segment. 1.73 The upgrades to downgrades ratio, which made a slow recovery from its trough in Q1:2019-20, reversed direction in Q1:2021-22 (Tables 1.19 and 1.20, Chart 1.38). Table 1.19: Growth in Wholesale Credit to Non-PSU obligors
(y-o-y, per cent unless otherwise stated) | | | PVBs | PSBs | | 2019-20 | 2020-21 | April-2021* | 2019-20 | 2020-21 | April-2021* | | AA and above | 9.70 | -2.72 | -7.47 | 8.00 | -11.08 | -6.66 | | Other Investment Grade | -6.93 | 0.77 | -6.34 | -6.18 | 1.48 | -5.38 | | Below Investment Grade | 8.63 | -6.48 | -2.55 | -7.26 | -4.31 | 0.55 | | Unrated/NA | -8.43 | -1.35 | -7.76 | -12.42 | -9.25 | -0.11 | Note *: Growth over March-2021
Source: CRILC, Prime Database and RBI staff calculations |
Table 1.20: Growth in Wholesale Credit to Non-PSU Non-financial Obligors
(y-o-y, per cent unless otherwise stated) | | | PVBs | PSBs | | 2019-20 | 2020-21 | April-2021* | 2019-20 | 2020-21 | April-2021* | | AA and above | 13.63 | -6.60 | -8.29 | 7.22 | -5.78 | -1.98 | | Other Investment Grade | -6.72 | 0.37 | -6.10 | -2.72 | 3.66 | -3.45 | | Below Investment Grade | 5.95 | -5.08 | -2.75 | -13.66 | -5.84 | -1.80 | | Unrated/NA | -7.94 | -0.82 | -7.56 | -12.08 | -9.31 | -2.02 | Note *: Growth over March-2021
Source: CRILC, Prime Database and RBI staff calculations | 1.74 A size-wise disaggregation of wholesale credit growth points to decline in banks’ exposure to large wholesale borrowers while the relatively smaller borrowers (loans size: ₹5 - ₹100 crore) maintained a sustained appetite for credit (Chart 1.39). 1.75 An examination of the transition in assetquality19 of a constant sample of wholesale performing exposures (non-PSU non-financial companies) shows that between September 2020 and April 2021, there was considerable deterioration, with migration to impaired status across all SMA categories (Table 1.21). Over half of SMA-2 loans moved to the NPA category in April 2021, pursuant to the vacation of the Supreme Court order on asset classification standstill.
1.2.10 Bank Credit to MSME Sector 1.76 Growth in credit to MSMEs during 2020-21 was aided by the ECLGS scheme, with aggregate sanctions at ₹2.46 lakh crore at end-February 2021. PSBs’ credit to the sector remained flat and new disbursements turned negative, after adjusting for interest accretion on past loans; PVBs, on the other hand, showed relatively robust increase in exposure (Table 1.22). | Table 1.22: Growth in Bank Credit to MSME Sector - March 2021 | | (y-o-y, per cent) | | | PSB | PVB | | Exposures < ₹25 crore | 8.08 | 8.04 | | Aggregate MSME exposures | 0.89 | 9.23 | | Source: RBI supervisory returns and staff calculations. | 1.77 Since 2019, weakness in the MSME portfolio of banks and NBFCs has drawn regulatory attention, with the Reserve Bank permitting restructuring of temporarily impaired MSME loans (of size upto ₹25 crore) under three schemes. While PSBs have actively resorted to restructuring under all the schemes, participation by PVBs was significant only in the COVID-19 restructuring scheme offered in August 2020 (Table 1.23). | Table 1.23: Restructuring of MSME Portfolios – Bank Group wise | | Restructuring Scheme | Aggregate Restructured Portfolio (₹ crore) | | PSBs | PVBs | | Restructuring - January 2019 scheme | 26,190 | 2,174 | | Restructuring - February 2020 scheme | 5,860 | 1,364 | | Restructuring - August 2020 scheme | 24,816 | 11,027 | | Source: RBI supervisory returns and staff calculations. | 1.78 Despite the restructuring, however, stress in the MSME portfolio of PSBs remains high (Table 1.24). 1.79 Boosted by ECLGS disbursements to eligible categories, net credit flow to stressedMSMEs20 during March 2020-February 2021 rose to ₹50,535 crore with the shares of PSBs and PVBs at 54 per cent and 35 per cent, respectively. (Chart 1.40 and 1.41). | Table 1.24: SMA Distribution of MSME Portfolio – Bank Group Wise | | (per cent) | | | PSBs | PVBs | | 0 days past due | SMA-0 | SMA-1 | SMA-2 | NPA | 0 days past due | SMA-0 | SMA-1 | SMA-2 | NPA | | Mar-20 | 65.0 | 6.9 | 5.7 | 4.2 | 18.2 | 88.6 | 4.4 | 1.9 | 0.7 | 4.3 | | Jun-20 | 63.3 | 18.2 | 2.2 | 2.6 | 13.7 | 88.6 | 7.0 | 0.9 | 0.6 | 2.9 | | Sep-20 | 65.9 | 13.4 | 3.2 | 2.6 | 14.9 | 87.9 | 8.1 | 0.9 | 0.6 | 2.6 | | Dec-20 | 65.7 | 7.8 | 5.6 | 7.8 | 13.1 | 88.1 | 4.8 | 2.6 | 2.4 | 2.0 | | Mar-21 | 60.7 | 10.6 | 9.2 | 3.6 | 15.9 | 89.6 | 3.7 | 2.4 | 0.8 | 3.6 | Note: MSME exposures of up to ₹25 crore only are included.
Source: RBI supervisory returns and staff calculations. |
1.80 The transition from low and medium risk MSME borrowers (y-o-y) to the high-risk segment was noteworthy, as per information available for February 2021 (Table 1.25). Given the elevated level of debt of the stressed cohort, the implications of business disruptions following the resurgence of the pandemic could be significant. 1.2.11 Bank Credit to NBFCs/HFCs 1.81 Banking sector exposure to the NBFCs/HFCs cohort showed contrasting movements during 2020-21. Exposure to private NBFC sector declined whereas lending to private housing finance companies (HFCs) rose during the last two quarters coinciding with the surge in sale of residential houses during H2:2020-21. In April 2021, however, bank exposure to HFCs too contracted (Charts 1.42 a-b).
Table 1.25: Borrower Transition Matrix
(February 2020 - February 2021) | | (per cent) | | CMR as of February 2020 | CMR as of February 2021 | | CMR 1-3 | CMR 4-5 | CMR 6-7 | CMR 8-10 | | CMR 1-3 | 67 | 21 | 7 | 5 | | CMR 4-5 | 17 | 50 | 22 | 11 | | CMR 6-7 | 5 | 22 | 58 | 15 | | CMR 8-10 | 1 | 3 | 15 | 80 | Note: Low Risk (CMR 1-3), Medium Risk (4-6), High Risk (CMR 7-10)
Source: TransUnion CIBIL |
I.2.12 Heterogeneity in Credit Exposures across PVBs 1.82 The credit portfolios of private sector banks indicate significant difference between old and new private sector banks (regulatory classificationbased on dates of incorporation)21. The expansion in wholesale advances generally lagged retail loans growth for both the cohorts, but new PVBs recorded higher growth compared to old PVBs, especially in the wholesale portfolio (Table 1.26). | Table 1.26: Asset Growth: Old and New PVB Cohorts | | (y-o-y, per cent) | | | Gross Loans and Advances | Retail Loans and Advances | Wholesale Advances | | Old PVBs | New PVBs | Old PVBs | New PVBs | Old PVBs | New PVBs | | Mar-20 | 4 | 12 | 18 | 25 | 0 | 6 | | Jun-20 | 3 | 9 | 14 | 22 | 0 | 4 | | Sep-20 | 3 | 8 | 15 | 15 | -1 | 5 | | Dec-20 | 2 | 8 | 15 | 11 | -2 | 6 | | Mar-21 | 3 | 11 | 15 | 14 | -1 | 9 | | Source: RBI supervisory returns. | 1.83 The average risk weighted assets22 (RWA) of the wholesale segment are largely comparable for the two cohorts (Chart 1.43).
1.84 A comparison of the wholesale portfolio assets’ yield spread over the 1-year marginal cost of lending rate (MCLR) across both the cohorts shows that old PVBs have been able to charge their customers a consistently higher premium over their MCLRs even though the risk profile of both categories of banks are largely similar in terms of average RWA (Chart 1.44 a). As the deposit cost structure for old PVBs is higher relative to new PVBs (Chart 1.44 b), the bigger margin may reflect the general adverse selection bias in the former’s asset portfolios. I.2.13 Liquidity Risk in the Banking Sector 1.85 Liquidity in the banking system has remained in large surplus. The Reserve Bank’s average daily net liquidity absorption stood at ₹4,96,154 crore during 2020-21 and ₹5,09,098 crore during 2021-22 so far (up to June 28). It amounted to nearly 3.2 per cent of SCBs’ net demand and time liabilities (NDTL) during the latest reporting fortnight (June 4, 2021). 1.86 An analysis of bank group-wise estimated 30-day cash flows indicated a significant uptick relative to pre-COVID-19 levels for PSBs, specifically from retail and small business counterparties after expiry of the loan moratorium, though the standstill on asset classification continued up to March 2021 (Chart 1.45). I.2.14 Consumer Credit23 1.87 The overall demand for consumer credit,as reflected in inquiry volumes24, had stabilised in Q4:2020-21 after a sharp rebound during the festive season in Q3:2020-21 after the first COVID-19 wave receded. The second wave, however, has sharply affected credit demand, with a steep fall in inquiries across product categories in April 2021 (Charts 1.46 and 1.47). 1.88 Loan approval rates remain healthy as the risk tier composition of inquiries shows a distinct tilt towards better rated customers. Growth in credit active consumers (i.e consumers with at least one outstanding credit account) and, outstanding balances, however, remains sluggish vis-a-vis a year ago (Charts 1.48 -1.50 and Table 1.27). | Table 1.27: Growth in Credit Active Consumers (number) by Product Type | | (per cent) | | Product | January 2020 | January 2021 | | Home Loans | 12.3 | 0.3 | | Loans against property | 31.6 | 10.5 | | Auto Loans | 9.7 | -3.6 | | Personal Loans | 39.4 | 6.5 | | Credit Cards | 22.9 | 6.3 | | Source: TransUnion CIBIL |
1.89 Consumer credit deteriorated after the loan moratorium programme came to an end in September 2020. Customer risk distribution of the credit active population underwent a marginal shift towards the high-risk segment in January 2021 relative to January 2020. In terms of credit risk migration, even low risk tiers are showing downward momentum (Table 1.28). Consumer credit portfolios of non-PSBs are seeing incipient signs of stress (Table 1.29). I.2.15 Housing Market 1.90 The slowdown in the housing market witnessed even before the onset of the pandemic bottomed out in Q1:2020-21. During Q3 and Q4: 2020-21, residential housing property registration and sales across major cities exceeded their pre-pandemic average levels (Chart 1.51). This was largely aided by (a) stamp duty cuts by some states; (b) unmet demand during the COVID-19 related restrictions in H1:2020-21; and (c) moderation in interest rates. All-India House Price Index (HPI) increased (y-o-y) by 2.7 per cent in Q4:2020-21 vis-a-vis 3.9 per cent growth a year ago. On a sequential (q-o-q) basis, all-India HPI growth rate moderated to 0.2 per cent in Q4:2020-21. 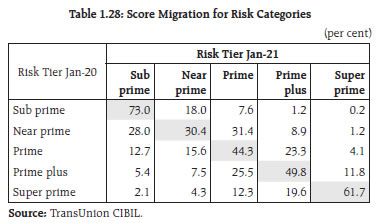
| Table 1.29: Delinquency Rates in Aggregate Consumer Credit | | (per cent) | | | PSB | PVB | NBFC / HFC | | Jan-20 | 2.9 | 1.2 | 5.3 | | Feb-20 | 2.9 | 1.1 | 5.2 | | Mar-20 | 3.0 | 1.0 | 4.8 | | Apr-20 | 3.2 | 1.1 | 5.2 | | May-20 | 3.2 | 1.0 | 5.2 | | Jun-20 | 3.0 | 1.2 | 5.0 | | Jul-20 | 2.8 | 1.1 | 5.1 | | Aug-20 | 2.7 | 1.1 | 5.2 | | Sep-20 | 2.8 | 1.4 | 5.4 | | Oct-20 | 2.6 | 1.4 | 5.3 | | Nov-20 | 2.2 | 1.6 | 5.8 | | Dec-20 | 2.0 | 2.2 | 6.3 | | Jan-21 | 1.8 | 2.4 | 6.7 | Note: based on 90 days past due balances
Source: TransUnion CIBIL |
1.91 Although the level of housing inventory remains elevated, it has come down in the recent period due to lower new launches in relation to sales; new launches in premium and sub-premium categories, however, remain robust (Chart 1.52). I.2.16 Systemic Risk Survey26 1.92 In the latest round of the systemic risk survey (SRS) conducted during April-May 2021, all the broad categories of risks to the financial system (viz., global; macroeconomic; financial market; institutional; and general risks) were perceived as ‘medium’ by the panellists. The risks for several sub-categories (viz., commodity price risk; domestic growth and inflation; fiscal deficit; corporate vulnerabilities; equity price volatility; credit growth; banks’ assets quality; capital requirements; and cyber risk) were, however, rated as ‘high’. 1.93 A majority of the respondents expected deterioration in the growth prospects of the Indian banking sector over the next one year. They also expected a decline in credit demand over the next three months due to pandemic-related restrictions in different parts of the country and postponement of discretionary spending by consumers. The impact of shutdown of economic activity across states may moderate consumer demand, reduce income and payment capacity of borrowers, which might lead to deterioration in average credit quality and weigh on balance sheet of banks. 1.94 Respondents were unequivocal that the second wave of the COVID-19 pandemic would adversely impact employment, productivity and wages in the short-term. Construction and real estate, tourism and hospitality, aviation, retail and entertainment are assessed to have borne the brunt of the second wave. Over 60 per cent of the respondents predicted that the economic recovery after the second wave is likely to be K-shaped, i.e., different parts of the economy recovering at different rates. Summary and Outlook 1.95 The impact of the pandemic on global and domestic economic conditions was, to an extent, moderated by a combination of unprecedented macroeconomic and regulatory policy support. As the global economy recovers, however, it remains uneven and divergent, warranting sustained policy support. A hastened pace and ramped up scale of the vaccination drive and quick bridging of gaps in the healthcare infrastructure across both urban and rural areas would make the recovery more durable. 1.96 Domestically, the near-term growth outlook faces headwinds from supply side constraints, surging global commodity prices, large swings in capital flows and global spillovers from financial market volatility that is in turn contingent upon policy stances of systemic economies. Hasty withdrawal of policy stimulus to support growth before sufficient coverage of the vaccination drive can sap macrofinancial resilience and have adverse unintended consequences. 1.97 Reduction in banks’ exposure to better rated borrowers and a somewhat uncertain risk profile for their other investment grade obligors have visibly impacted wholesale credit growth. Consumer credit demand, too, appears to have been dented by the second wave of the pandemic. Going forward, close monitoring on asset quality of MSME and retail portfolios of banks is warranted. This calls for banks to shore up capital positions while favourable market conditions prevail. The banking sector will be required to specifically guard against adverse selection bias while being alive to the credit demand from productive and viable sectors. In the most optimistic scenario, the impact of the second wave should be contained within the first quarter of the year, while frictional inflation pressures work their way out over the first half of the year. Financial intermediaries need to internalise these expectations into their outlook while staying on guard against potential balance sheet stress with sufficient capital and liquidity buffers and appropriate governance structures.
|