Risks to banking sector have increased since the publication of the last FSR in December 2012. The strain on asset
quality continues, although it has shown some improvement during the quarter ended March 2013. The growth
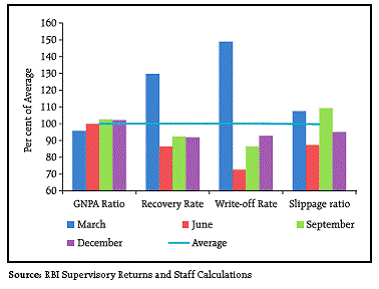
in credit and deposit, as well as changes in asset quality have shown significant ‘seasonality’.
Various Banking Stability Measures, based on co-movements in banks’ equity prices, indicate that the distress
dependencies within the banking system which were rising during last year, have shown some sign of easing. The
inter-bank market continues to be highly interconnected as brought out by the network analysis. A simulation of
liquidity and solvency contagion reveals that the failure of a large bank can significantly impact the banking system.
Macro stress tests indicate that if the current macroeconomic conditions persist, the credit quality of commercial
banks could deteriorate further. However, the comfortable position on the banks’ capital adequacy front has provided
resilience as shown by the top-down stress testing exercises on various risks.
The results of the bottom up stress tests (sensitivity analysis) carried out by select banks, also testified to the general
resilience of the banks to different kinds of shocks.
The new business premium of insurance sector continued to contract for the last two years. Single premium insurance
policies account for a major part of the life insurance business especially of the Life Insurance Corporation. Persistency
rates also continue to cause concern in life insurance business. New Pension System introduced by the Government
of India with a view to develop the pension sector has shown steep growth in the subscriber base and corpus.
Assessment of Risks - Banking Sector
2.1 The risks to the banking sector, as at end March
2013 have increased marginally since the publication
of previous FSR1. The Banking Stability Indicator,
which combines the impact on all major risk dimensions, shows an increase in vulnerability in the
banking sector since September 2010 (Chart 2.1). An
analysis of the components contributing to banking
stability shows that tight liquidity, deteriorating asset
quality and reducing soundness are the major contributors to the decline in stability of the banking
system. This comparative position is reflected in the
Banking Stability Map also (Chart 2.1).
Distress Dependencies and Interconnectedness
Banking Stability Measures (BSMs) – Distress
Dependency Analysis
2.2 The financial system is conceptualised as a
portfolio of a specific group of banks2, for the purpose
of modelling distress dependencies, based on the
premise that during times of distress, the financial
position of banks tend to decline concurrently
through direct and / or indirect links. These links
mainly include mark-to-market asset values, interbank
lending and information asymmetries.
2.3 The Banking Stability Measures (BSMs), based
on the distress dependency structure among banks,
use the technique of Banking System’s Portfolio
Multivariate Density (BSMD)3 (Segoviano and
Goodhart, 2009). The BSMD technique takes into
account inter-dependent structure of distress, which
captures both linear and non-linear distress
dependencies among the banks in the system and
provides a set of tools to measure: (i) common distress
of the banks in a system and (ii) distress between
specific banks. The BSMD technique uses both the
individual and joint asset value movements of the
portfolio of banks and the BSMD is derived from
Probabilities of Distress (PoDs)4 of the banks, observed
empirically, based on 99 per cent Value at Risk (VaR)
of banks’ daily equity price return.
2.4 The BSMs presented in this section comprise
of the Banking Stability Index, Toxicity Index and
Vulnerability Index. While the Banking Stability Index depicts the common distress of the banks in a system,
the Toxicity and Vulnerability Indices depict the
distress between specific banks.
Common distress in the system
2.5 The probability of distress of the entire banking
system, as measured by Joint Probability of Distress
(JPoD) has registered a marginal decline during last
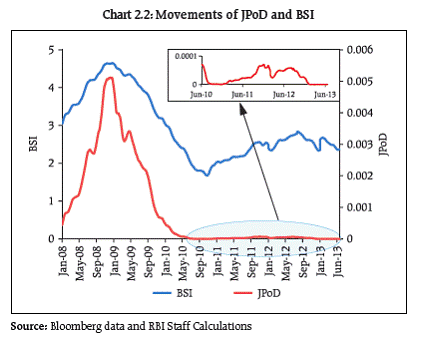
six months. Trends in the Banking Stability Index
(BSI), that measures the expected number of banks
that could become distressed given that at least one
bank has become distressed, showed an upward trend
(deteriorating conditions) from December 2010 till
September 2012. A marginal decline in BSI registered
since September 2012 indicating some sign of easing
in interdependencies among banks, has again
reversed in February 2013 (Chart 2.2). It may be
observed the common distress in the system
measured by JPoD and BSI is significantly lower at
present, than the distress observed during the peak
of the global financial crisis. The JPoD and the BSI not
only take account of individual banks’ probabilities of distress, but these measures also embed banks’
distress dependence. Therefore, these measures may
experience larger and nonlinear increases than those
experienced by the PoDs of individual banks.
 Distress relationship among banks
2.6 The Toxicity Index (TI) is the average probability
that a bank under distress may cause distress to
another bank in the system, whereas, Vulnerability
Index (VI) is the average probability of a bank coming
under distress given distress in other banks in the
system. Both the indices have shown a co-movement
with that of BSI indicating signs of easing toxicity and
vulnerability of the selected banks (Chart 2.3).
Network Analysis5
The interbank market
2.7 The Indian Financial System is bank dominated.
The market for interbank exposures (exposures
between SCBs), stood at `9.8 trillion as at end March
2013. The public sector banks with 62 per cent share
of the market comprised the largest segment, followed
by the foreign banks whose share of the market was
around 28 per cent.
2.8 Average interbank lending as a percentage of
total assets stood at around 11 per cent while inter
bank borrowing as a percentage of total outside
liabilities stood at around 13 per cent. However, the
exposure was significantly higher for some banks,
making them vulnerable to solvency and liquidity
shocks arising out of any instability in the overall
banking system (Charts 2.4 and 2.5).
2.9 An analysis of the network of interbank call
money market indicates a low level of tiering6 compared to the network of interbank exposures. The
size of the market amounted to `213 billion as at end
March 2013 and its network structure effectively
demonstrates only two tiers with the banks in the
core being the major lenders in the system. The
structure of the network in the call money market
indicates that the failure of any of the lenders in the
inner core will have significant implications for the
liquidity of the market.
2.10 The network of the interbank Certificate of
Deposit (CD) exposures displays a higher degree of
interconnectedness as compared to the call money
market, though the level of tiering is low in this
market as well. The connectivity ratio7 of the
interbank CD market stood at 9 per cent, whereas the
same ratio for the interbank call market was just above
1 per cent (Chart 2.6 and 2.7). These ratios are well
below the connectivity ratio for the total interbank
market which is around 25 per cent.
The Non-Banking Financial Sector
2.11 In the broader financial system, the main nonbank
institutions are the Asset Management
Companies and the Insurance Companies. The
combined investment/lending by these two sectors
amounts to over `6.5 trillion, most of which is to
banks. The exposure of these entities to the banking
system makes them potentially vulnerable to solvency
shocks arising from any instability in the banking
system.
2.12 The business models of Non-Banking Financial
Companies (NBFCs)8 make them largely reliant on
banks for their liquidity requirements. Within the
financial system, they are the second largest borrowing
sector, after the banking sector. Total borrowing by this sector is close to `3 trillion, while the investment/
lending by NBFCs stood at around `1.2 trillion. The
bulk of these exposures are fund based. The reliance
of the NBFCs to banks makes them vulnerable to
liquidity shocks arising from any instability in the
banking system (Chart 2.8).
Contagion Analysis
2.13 Contagion analysis with network tools is used
to assess distress in the banking system due to
insolvency of the net borrowers. The exercise is a
stress test which reckons the impact of failure of a
net borrower in the system without taking cognizance
of the probability of failure of a bank. It is important
to note that the trigger for contagion is the failure of
a major player, the probability of such failure being
subject to macroeconomic factors and its own financial
position. In the well regulated Indian banking system,
the probability of such failure is a tail event, especially
since the prudential regulator is also in charge of
systemic risk.
2.14 The extent of contagion caused by distress in
a bank will vary depending on the criteria that is used
to determine the condition under which a bank is
treated as ‘distressed’, with more stringent distress
conditions leading to a more severe contagion results.
This is illustrated in the table below which shows the
contagion impact using different distress conditions
(Table 2.1).
Liquidity contagion9 in the financial system
2.15 An analysis of the three main sectors in the
financial system, i.e. the banking sector, the insurance
sector and the mutual funds sector reveals that the
failure of any institution which has large lending
position will have significant downstream impact. As
discussed in paragraph 2.11 above, the insurance
companies and the asset management companies are
fund providers in the financial system and any failure
can cause severe liquidity stress in the system (Table 2.2). A stylised representation of how a liquidity
contagion will play out is depicted in Chart 2.9
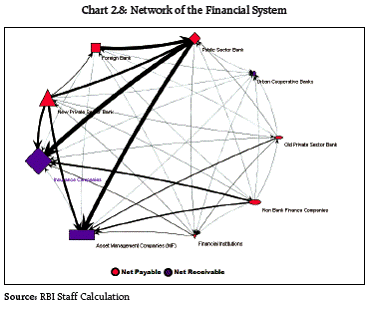
Table 2.1: Contagion due to one of the five largest borrower banks are under distress |
Distress Criteria |
Banks is under distress if leverage ratio falls below 3 per cent |
Banks is under distress if it loses more than 25 per cent of its capital |
Banks is under distress if core capital ratio falls below 6 per cent |
Trigger Banks |
No. of banks becoming distressed |
Per cent of capital loss to the banking system |
No. of banks becoming distressed |
Per cent of capital loss to the banking system |
No. of banks becoming distressed |
Per cent of capital loss to the banking system |
A |
3 |
7.5 |
24 |
20.2 |
13 |
20.2 |
B |
3 |
11.9 |
14 |
18.0 |
11 |
18.0 |
C |
1 |
5.6 |
7 |
7.6 |
3 |
7.6 |
D |
2 |
8.0 |
7 |
10.0 |
3 |
10.0 |
E |
1 |
6.0 |
2 |
6.6 |
2 |
6.6 |
| Source: RBI Staff Calculations |
Table 2.2: Liquidity contagion in the financial system if one of the large lenders/investors is under distress |
Trigger Institution |
Per cent of capital loss to the financial system |
Per cent of liquidity reserve loss to the financial system |
No. of institutions becoming distressed |
A |
18.2 |
103.6 |
49 |
B |
12.4 |
70.4 |
30 |
C |
9.4 |
53.4 |
30 |
D |
7.3 |
41.8 |
18 |
E |
7.0 |
40.2 |
19 |
Source: RBI Staff Calculation |
Scheduled Commercial Banks (SCBs)
Trends in Credit and Deposit
2.16 The SCBs recorded lower credit growth on y-o-y
basis at 15.1 per cent in March 2013 than in September
2012 (15.8 per cent) and March 2012 (16.9 per cent),
respectively. However, the y-o-y deposits growth of
all SCBs increased marginally to 14.4 per cent in March
2013 from 14.3 per cent of the September 2012
(Chart 2.10). Despite the lower credit growth during
March 2013, the Credit-Deposit (C-D) ratio of SCBs
improved to 76.5 per cent during the quarter from
74.3 per cent in September 2012, indicating greater
share of credit in their incremental assets.
2.17 At the bank-group level, except foreign banks,
all the other bank-groups recorded lower credit growth
and higher deposit growth in March 2013 compared
to September 2012. The credit growth of foreign banks
increased sharply to 14.6 per cent in March 2013 from
6.5 per cent in September 2012, whereas, the deposit
growth of this bank-group declined to 4.0 per cent in
March 2013 from 8.2 per cent in September 2012. The
public sector banks registered credit and deposits
growth of 14.2 per cent and 14.0 per cent in March
2013, respectively (Chart 2.10).
Seasonality in Credit and Deposit activities of
Indian banks
2.18 It can be observed that the banks’ performance
on credit delivery and deposit mobilisation improves
during the last quarter of the financial year. The asset
quality indicators also show an improvement during
the last quarter of financial year. While there may be
some business reasons for such a phenomenon, it is
widely perceived that the banks adopt various strategies to improve their performance for the yearend
balance sheets. In a competitive scenario, the
incentive structures could be driving the banks
towards ‘window-dressing’ practices.
Chart 2.9: Liquidity Contagion10 in the Financial System
2.19 An empirical analysis of seasonal factors of
credit, deposit, slippage ratio, recovery and write-off11 has been carried out to understand the behavioral
aspects. The finding of this analysis shows that, credit
and deposit, both have significant seasonality, which
pulls them up during the last quarter of financial year
(Chart 2.11).
2.20 The q-o-q growth in credit and deposit of SCBs
increased to 7.3 per cent and 6.9 per cent in March
2013 from 4.6 per cent and 2.1 per cent of the previous
quarter, respectively. However, the q-o-q growth in
seasonally adjusted credit and deposit declined to 3.4
per cent and 2.9 per cent in March 2013 from 3.7 per
cent and 3.2 per cent of the previous quarter,
respectively. This shows that the improved credit and
deposit growth during March 2013 was largely due to
the seasonal factor (Chart 2.12).
Chart 2.11: Seasonal Factors12 of Credit and Deposit
Sectoral Deployment of Credit
2.21 There were no major changes in the overall
distribution of sectoral credit allocation over the last
two years. The trends in credit flow to some select
sectors like Agriculture, Exports, Medium and Small
Enterprises (MSE), and NBFCs have been studied in
this section. These sectors account for around 40 per
cent of the total bank credit as at end March 2013
(Chart 2.13). The sectors under ‘Others’ include,
advances to central and state governments, food
credit, advances to public sector units, etc.
2.22 The growth in the credit to the agriculture
declined sharply to 12.5 per cent in March 2013 from
29.8 per cent of September 2012.
2.23 Export credit continues to contract, an issue
that has been engaging the attention of policy makers
in the light of increasing trade deficit. The Reserve
Bank has been initiating measures from time to time
to direct credit to the sector at competitive rates. The
recent report of a technical committee13 constituted
by the Reserve Bank has recommended several
measures to improve the flow of credit to export
sector, reduce transaction costs and incentivise
exports & export financing.
2.24 Credit growth to MSE sector, which has a large
potential for employment generation, increased
significantly to 25.6 per cent in March 2013 from 15.5
per cent and 7.6 per cent in September 2012 and
March 2012, respectively. The increase in credit
growth of MSE sector registered during the quarter
needs to be sustained, for improving the overall credit
deployment for this sector. The credit growth to retail
housing also increased to 16.4 per cent from 13.0 per
cent in September 2012 (Chart 2.14).
2.25 Bank credit to NBFCs recorded a decline in
growth on y-o-y basis to 13.6 per cent in March 2013
from 32.5 per cent and 42.8 per cent recorded in September 2012 and March 2012, respectively. This
decline is attributed to lower demand for auto &
consumer loans, stricter norms on lending against
gold, withdrawal of priority sector status for some
loans given by SCBs to NBFCs for on-lending to specific
purposes, etc.
Soundness
Capital Adequacy
2.26 The system level Basel II Capital to Risk
Weighted Assets Ratio (CRAR) improved slightly to
13.8 per cent as at end March 2013 from 13.6 per cent
as at end September 2012 (Chart 2.15). The y-o-y
growth in risk weighted assets (RWA) of SCBs was at
17.1 per cent in March 2013 compared to 14.5 per
cent in September 2012. The rise in capital was
attributed mainly to increase in Tier I capital.
2.27 At the bank-group level, public sector banks
continued to register the lowest CRAR at 12.4 per cent
in March 2013 followed by old private banks
(Chart 2.15).
Leverage
2.28 The Tier I leverage ratio14 of all SCBs increased
to 6.4 per cent in March 2013 from 6.1 per cent and
6.2 per cent of September 2012 and March 2012,
respectively, due to the higher Tier I capital growth
relative to the growth in the total assets (Chart 2.16).
2.29 An analysis of the bank-wise leverage15 was
carried out, in conjunction with the trends in the
riskiness of their assets. The leverage was measured
as total assets to capital (using Tier I as well as Tier I
& II), while the ratio of RWA to total assets was taken
as an indicator of the degree of riskiness of the assets
portfolio. It has been observed that the banks which
have lower ratio of RWA to total assets tend to have
a higher leverage (Chart 2.17).
Estimation of Losses, Provisioning and Capital
Adequacy
2.30 At present, banks in India follow ‘incurred loss
model’ to recognise credit losses of banks. Under the
approach, provision is made for loans, only on
occurrence of an identifiable credit event. The timing
and measurement of losses are, therefore, based on
estimating losses that have been incurred as on the
reporting date. This model does not permit recognising
credit losses based on events that are expected to
occur in the future and hence it is not a forward
looking approach. As suggested by the BCBS, there is
a need to move towards a new accounting standard, which is based on the concept of expected losses (EL)
and unexpected losses (UL) to measure the potential
losses in a credit portfolio (Box 2.1). Banks are
expected to cover the UL by capital and EL by
provisions. The EL is generally derived as the mean
of the credit loss distribution and has a forwardlooking
element16.
2.31 The estimated EL of SCBs at system level was
around 2.0 per cent of total advances as at end March
2013 and is expected to rise to 2.3 per cent by
September 2013 under baseline scenario (Table 2.3).
The present level of total provisions17 being
maintained by the SCBs at 2.6 per cent of total advances as at end March 2013, is adequate under
the baseline scenario. The EL may further increase
to 3.1 per cent under severe stress conditions by
March 2014, leaving a gap between the present
provisioning level and EL under heightened adverse macroeconomic conditions18. Therefore, it would be
prudent for the SCBs to increase their provisioning
from the present levels. On the other hand, the UL
and expected shortfall of SCBs are estimated to be
around 7.0 per cent and 7.1 per cent of total advances respectively for the quarter ended March 2013. The
corresponding losses may further rise to 8.8 per cent
and 9.0 per cent as at end March 2014 under severe
stress scenario. The UL and expected shortfall are
less than the Tier I capital to total advances ratio of
12.1 per cent maintained by SCBs as at the end of
March 2013.
Table 2.3: Estimated Losses of SCBs |
(Per cent to Total Advances) |
End-Quarter |
Expected Loss |
Unexpected Loss |
Expected Shortfall |
Baseline |
Medium Stress |
Severe Stress |
Baseline |
Medium Stress |
Severe Stress |
Baseline |
Medium Stress |
Severe Stress |
Mar-13* |
2.0 |
- |
- |
6.9 |
- |
- |
7.0 |
- |
- |
Sep-13 |
2.3 |
2.5 |
2.8 |
7.2 |
7.8 |
8.5 |
7.3 |
8.0 |
8.7 |
Mar-14 |
2.1 |
2.6 |
3.1 |
7.0 |
7.9 |
8.8 |
7.1 |
8.0 |
9.0 |
* Estimation of losses for the quarter ended Mar-13 is based on the observed numbers.
Source: Supervisory Returns and Staff Calculations |
Box 2.1: Estimation of Losses
Expected Loss, Unexpected Loss and Expected
Shortfall of Scheduled Commercial Banks in India
The EL is generally derived as the mean of the credit
loss distribution and has forward-looking element as it
is capable of incorporating ‘through-the-cycle’ view of
probability of default.
A pictorial presentation of loss distribution depicting EL,
UL and expected shortfall is given in the chart below.
The following standard definitions have been used for
estimation of these losses:
Expected Loss (EL): The EL is the average credit loss that
the banking system expects from their credit exposure.
Unexpected Loss (UL): The UL at 100(1-α) per cent-level
of significance is the loss may occur at the α-quantile of
the loss distribution.
Expected Shortfall (ES): When the distributions of loss
(Z) are continuous, expected shortfall at the 100(1-α)
per cent confidence level ( ESα (Z) ) is defined as, ESα
(Z) = E[Z | Z≥VaRα (Z)]. Hence, Expected shortfall is the
conditional expectation of loss given that the loss is
beyond the VaR level.
These losses were estimated as: Loss = PD X LGD X EAD
Where, EAD = Exposure at Default, is the total
advances of the banking system. EAD
includes only on-balance sheet items
as PD was derived only for on balance
sheet exposures.
LGD = Loss Given Default. Under baseline
scenario, the average LGD was taken as
60 per cent as per the RBI guidelines on
‘Capital Adequacy – The IRB Approach
to Calculate Capital Requirement for
Credit Risk’. LGD was taken at 65 per
cent and 70 per cent under medium
and severe macro-economic conditions,
respectively.
PD = Probability of Default. PD was defined as
gross non-performing advances to total
advances ratio. Because of unavailability
of data on number of default accounts,
the size of default accounts (i.e. NPA
amount) has been used for derivation of
PDs.
The above losses viz., EL, UL and ES, were estimated
by using a simulated PD distribution. As a first step; an
empirical distribution of the PD was estimated using
Kernel Density Estimate, second; using the empirically
estimated probability density function, 20000 random
numbers were drawn based Monte Carlo Simulation
and finally, for calculation of expected loss, unexpected
loss and expected shortfall, PDs were taken as average
PD, 99.9 per cent VaR of PD and average PD beyond 99.9
per cent loss region, respectively.
Asset Quality
2.32 The asset quality of SCBs, which was
deteriorating continuously, recorded an improvement
in March 2013 quarter. The Gross Non-Performing
Advances (GNPA) ratio of SCBs improved to 3.4 per cent as at end March 2013 against 3.6 per cent as at
end September 2012. The net NPA ratio declined to
1.4 per cent as at end March 2013 from 1.6 per cent
as at end September 2012. This decline in NPA was
attributed to the lower slippage, improved recovery
and higher write-off during the quarter (Chart 2.18).
Change in classification for restructured advances
with effect from April 1, 2015 may have some adverse
impact on the NPAs, unless banks take preventive
measures in this regard.
2.33 At the bank-group level, the GNPAs of public
sector banks was highest and stood at 3.8 per cent
as at end March 2013, followed by that of the foreign banks. The quarterly slippage ratio of public sector
banks declined to 0.5 per cent for the quarter ended
March 2013 from 0.8 per cent recorded during
September 2012. Quarterly slippage of foreign banks
increased to 0.3 per cent and 0.1 per cent for the
corresponding periods. The old private banks
registered highest quarterly recovery at 21.2 per cent
during quarter ended March 2013 followed by the
public sector banks at 9.1 per cent. All the bank
groups, except new private banks, recorded higher
write-off during the quarter ended March 2013 as
compared to quarter ended September 2012
(Chart 2.18).
Seasonality in Asset Quality
2.34 An empirical seasonal analysis shows that
during the March quarter, the slippages of standard
advances are more than the average slippages of all
four quarters, but, the GNPA ratio declines during this
quarter mainly because of the higher recovery and
write-off of bad loans observed during the last quarter
(March) of financial year (Chart 2.19).
Restructuring of loans
2.35 The restructured standard loans of SCBs as
proportion of their total loans have registered a
marginal decline from 5.9 per cent as at end September
2012 to 5.7 per cent as at end March 2013. Among the
bank groups, this ratio, at 7.1 per cent, was the highest
for the public sector banks followed by old private
banks. (Chart 2.20).
2.36 Industry and services sector account for a
major proportion of restructured loans of the
banking sector. As these sectors have a relatively
higher share of total bank credit, the trends in
restructuring of loans to these sectors make a bigger
impact on the health of the banking sector. Within
the industrial sector, a few sub-sectors, namely; Iron
& Steel, Textile, Infrastructure, Power generation and
Telecommunications; have become a cause of concern in recent times. In case of sectors like Aviation, though
the incidence of restructuring is high, its share of
bank credit is relatively low (Chart 2.21).
Chart 2.19: Asset Quality - Seasonal Factors21
 \
2.37 The increasing incidence of forbearance in the
banking system especially in Europe has emerged as
a concern in recent times against the backdrop of a
slowdown in the global economy. Forbearance refers
to the act of granting a concession to the borrower by
the lender (bank), in view of some economic or legal
reasons related to temporary financial difficulties
being faced by the borrower. While forbearance is
essential and good in the case of viable ventures,
forbearance to avoid classification as NPL or simply
keeping zombie companies alive, leads to inefficient
allocation of resources and eventual problems for the
lender.
2.38 The previous FSR had covered the unhealthy
trends in restructuring of advances by banks in India,
especially the public sector banks. In this context the
recommendations of a Reserve Bank Working Group22 to review the restructured loans have been accepted
and the extant asset classification benefits available
on restructuring will be withdrawn effective from
April 1, 2015 - with the exception of provisions related
to changes in date of commencement of commercial operation (DCCO) in respect of infrastructure and
non-infrastructure project loans.
2.39 The Working Group had also recommended
that, till such time the regulatory forbearance on asset
classification is dispensed with, the provision
requirement on such accounts should be increased
from the present 2 per cent to 5 per cent, in order to
prudently recognise the inherent risks in restructured
standard assets in the interregnum. The Reserve Bank,
therefore has increased23 the provision on restructured
standard accounts to 2.75 per cent from 2.00 per cent.
The provision has been increased to 5 per cent in
respect of new restructured standard accounts (flow)
with effect from June 1, 2013 and in a phased manner
for the stock of restructured standard accounts as on
March 31, 2013.
Profitability
2.40 The profitability of all SCBs, measured by return
on assets (RoA) and return on equity (RoE) declined
to 1.0 per cent and 12.8 per cent in March 2013 from
1.1 per cent and 13.4 per cent in March 2012,
respectively. The lower growth in profit after tax (PAT)
was mainly attributed to the lower y-o-y growth in
net interest income (NII) at 11.0 per cent in March 2013 against 15.8 per cent in the previous year. The
decrease in NII is accompanied by a reduction in the
net interest margin (NIM) to 3.0 per cent in March
2013 from 3.1 per cent in the previous two years. The
SCBs have seen a faster growth in their other operating
income (OOI), with the y-o-y growth increasing to 13.8
per cent in March 2013 from 7.4 per cent in the
previous year (Table 2.4).
2.41 The contribution of NII to total operating
income(TOI) declined marginally to 72.1 per cent in
2012-13 from 72.6 per cent in the previous year,
whereas, contribution of OOI to TOI increased to 27.9
per cent in 2012-13 from 27.4 per cent in the previous
year. This rise in the contribution of OOI to total
income was attributed to the higher contribution
recorded from security trading (10.5 per cent in 2012-
13 against 3.6 per cent in the previous year) and
miscellaneous income (Table 2.5).
2.42 Among the major bank groups, the contribution
of NII to the TOI is highest in the case of the public
sector banks followed by old private banks; whereas
the contribution of OOI to TOI is highest in the case
of new private banks followed by foreign banks
(Chart 2.22).
2.43 Another emerging area that is adding to banks’
OOI is commission on account of insurance business.
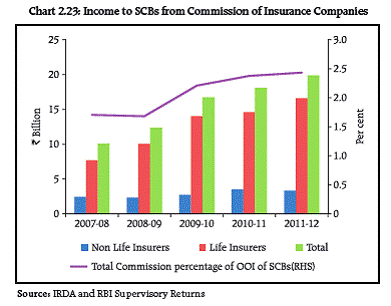
For the year 2011-12, banks accounts for `19.9 Billion, which is 9.7 per cent of total commission paid by
insurers (life as well as non-life) and 2.4 per cent of
the OOI of all SCBs (Chart 2.23).
Table 2.4: Profitability of SCBs |
(Per cent) |
|
Return on As-sets |
Return on Equity |
PAT Growth |
Net In- terest Income Growth |
Other Oper-ating Income Growth |
NIM24 |
Spread25 |
Mar-09 |
1.1 |
14.5 |
23.3 |
24.4 |
24.0 |
2.7 |
3.5 |
Mar-10 |
1.0 |
12.9 |
4.3 |
14.8 |
3.1 |
2.7 |
3.5 |
Mar-11 |
1.1 |
13.6 |
23.6 |
34.6 |
0.5 |
3.1 |
3.8 |
Mar-12 |
1.1 |
13.4 |
14.6 |
15.8 |
7.4 |
3.1 |
3.8 |
Mar-13 |
1.0 |
12.8 |
12.8 |
11.0 |
13.8 |
3.0 |
3.3 |
Source: RBI Supervisory Returns |
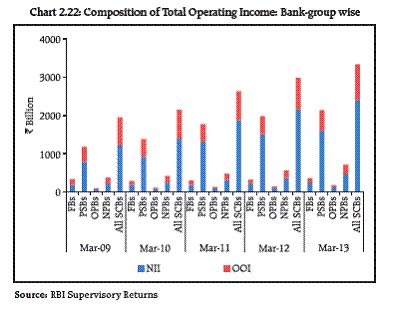
Table 2.5 Income components of SCBs - Select Ratios |
(Per cent) |
|
Net Interest Income to TOI |
Other Operating Income to TOI |
Risk Provisions to TOI |
Fee income to OOI |
Profit/(Loss) on Forex operations to OOI |
Profit/(Loss) on securities trading to OOI |
Dividend income to OOI |
Miscellaneous income to OOI |
Mar-09 |
62.2 |
37.8 |
12.3 |
47.3 |
16.9 |
21.1 |
2.4 |
12.3 |
Mar-10 |
64.7 |
35.3 |
12.6 |
51.1 |
12.8 |
18.0 |
2.7 |
15.5 |
Mar-11 |
71.1 |
28.9 |
14.3 |
57.7 |
18.3 |
4.0 |
3.2 |
16.7 |
Mar-12 |
72.6 |
27.4 |
17.0 |
59.5 |
18.7 |
3.6 |
3.1 |
15.1 |
Mar-13 |
72.1 |
27.9 |
16.8 |
55.1 |
15.4 |
10.5 |
2.5 |
16.4 |
Note: TOI-Total Operating Income;
OOI- Other Operating Income.
Source: RBI Supervisory Returns |
 2.44 The contribution of public sector banks as a
bank-group, to NII and OOI of all SCBs, declined to
66.3 per cent and 57.5 per cent in March 2013 from
69.3 per cent and 58.1 per cent in the previous year,
respectively. The contribution of new private banks
to NII and OOI of all SCBs increased to 18.7 per cent
and 26.5 per cent in March 2013 from 16.3 per cent
and 24.6 per cent in the previous year, respectively
(Chart 2.24).
2.45 The present levels of NIM and spread of the
SCBs in India as a whole, may indicate that there is
scope for banks to improving their efficiency. A
comparison of NIM, for the three years through 2011,
of select countries shows that NIM of banks in India
is comparable to that of BRICS countries (Chart 2.25).
Resilience - Stress Tests
2.46 The resilience of the Indian banking system to
macroeconomic shocks was tested through a series
of macro stress tests for credit risk at system, bankgroup
and sectoral levels. These tests are based on
baseline scenario and two adverse (medium and
severe) risk scenarios (Table 2.6). The adverse
scenarios were derived based on up to 1 standard
deviation for medium risk and 1.25 to 2.0 standard
deviations for severe risk (10 years historical data).
Credit Risk - System Level
2.47 The macro stress tests for credit risk suggest
that under baseline scenario, GNPA ratio of all SCBs
is expected to rise to around 3.8 per cent by September
2013 from 3.4 per cent of March 2013, whereas, under
the assumed improved macroeconomic condition for
the financial year (FY) 2013-14 (compared to 2012-13),
GNPA ratio may decline subsequently to 3.5 per cent
by March 2014. However, under severe stress scenario,
GNPA ratio may rise to 4.4 per cent by March 2014
(Chart 2.26). Under such severe risk scenario, the
system level CRAR of SCBs could decline to 12.2 per
cent by March 2014, but will still remain above the
regulatory requirement of 9 per cent (Chart 2.27). This
projection of GNPAs, however, does not capture the
likely impact of the withdrawal of forbearance for
restructured loans.
Credit Risk - Bank Group Level
2.48 Among the bank-groups, public sector banks
are projected to register the highest GNPA ratio. Under
baseline scenario, the GNPA of public sector banks
and foreign banks may rise to 4.1 per cent and 3.2 per
cent by March 2014 from 3.8 per cent and 3.0 per cent
in March 2013, respectively. Whereas, GNPA ratio of
both old private banks and new private banks may
rise to 2.3 per cent by March 2014 from 1.9 per cent
in March 2013 (Chart 2.28).
Table 2.6 Macroeconomic Scenario Assumptions (FY: 2013-14)26 |
(Per cent) |
|
Baseline |
Medium Stress |
Severe Stress |
GDP Growth |
5.7 |
4.0 |
2.4 |
WPI Inflation |
5.5 |
7.7 |
9.8 |
Short-term Interest Rate |
6.8 |
8.4 |
10.0 |
Exports to GDP Ratio |
16.8 |
15.1 |
13.4 |
Gross Fiscal Deficit |
4.8 |
5.9 |
7.0 |
2.49 CRAR of PSBs, which is the lowest at around 12
per cent, may decline to 10.8 per cent by March 2014
under severe stress scenario. Under such severe risk
scenario, the CRAR of new private sector banks, old
private banks and foreign banks may decline to 15.5
per cent, 12.4 per cent and 14.6 per cent from 17.5
per cent, 13.8 per cent and 17.0 per cent recorded as
at end of March 2013 quarter, respectively. However,
even under severe stress scenario, the CRAR of all the
bank groups is seen to remain above the regulatory
requirement of 9 per cent (Chart 2.28).
Credit Risk - Sector Level
2.50 Macro stress test of sectoral credit risk revealed
that, among the selected seven sectors, Construction
and Agriculture are expected to register the highest
NPA ratios of around 4.7 to 4.8 per cent by March 2014,
followed by Iron & Steel sector. The adverse
macroeconomic shocks seem to have maximum
impact on Iron & Steel and Construction followed by
Engineering (Table 2.7).
Table 2.7 Projected Sectoral NPA |
(Per cent to gross advances) |
Sector |
Mar-13
(Actual) |
Sep-13 |
Mar-14 |
Baseline |
Medium Risk |
Severe Risk |
Baseline |
Medium Risk |
Severe Risk |
Agriculture |
4.7 |
4.9 |
5.1 |
5.2 |
4.6 |
4.9 |
5.1 |
Construction |
4.0 |
4.5 |
4.6 |
4.7 |
4.8 |
5.1 |
5.5 |
Cement |
2.7 |
3.4 |
3.4 |
3.5 |
3.9 |
4.2 |
4.4 |
Infrastructure |
1.5 |
1.9 |
2.0 |
2.1 |
2.2 |
2.5 |
2.7 |
Iron and Steel |
4.0 |
4.2 |
4.4 |
4.6 |
4.0 |
4.8 |
5.5 |
Engineering |
3.7 |
4.1 |
4.2 |
4.5 |
3.9 |
4.5 |
5.1 |
Automobiles |
1.8 |
2.1 |
2.2 |
2.2 |
2.1 |
2.3 |
2.4 |
Source: RBI Supervisory Returns and Staff Calculations |
Top Down Stress Tests - Bank Level
2.51 A number of single factor sensitivity stress tests
(top-down) were carried out on SCBs (60 banks
comprising 99 per cent of total banking sector assets)
to assess their vulnerabilities and resilience under
various scenarios. The resilience of the commercial
banks in respect of credit, interest rate and liquidity
risks were studied through top down sensitivity
analysis by imparting extreme but plausible shocks.
The results are based on March 2013 data27. The same
set of shocks was used by 25 select SCBs (comprising
about 75 per cent of total assets) to conduct bottom
up stress tests. The results of the bottom up stress
tests broadly reflected those of the top down stress
tests and reconfirmed the resilience of the banking
system to a wide range of shocks.
Credit Risk
2.52 The impact of different static shocks for banks
as on March 2013 shows that the system level CRAR
remained above the required minimum of 9 per cent.
The capital losses at the system level could be about
29 per cent in the case of severe stress condition
(Shock 1). The stress test results, further showed that
some banks would fail to maintain required CRAR
under stress scenarios (Chart 2.29).
2.53 The stress tests on credit concentration risk of
banks show that the impact under various stress
scenarios is not significant. The impact on CRAR under
the assumed scenarios of default of top three
individual borrowers and default of top group
borrower would be 240 and 185 basis points
respectively and the system should be able to
withstand this default. However, at individual level,
a few banks with high concentration might be
seriously impacted under stressed conditions.
Interest Rate Risk
2.54 The interest rate risk for the trading book (direct
impact) under various stress scenarios is manageable
with reduction in CRAR by 1 percentage points at the
system level, though a few small banks would be
impacted adversely. The major impact is due to
upward movement (2.5 percentage points) of yield
curve, especially for the low maturity buckets because
of their relatively large size. For the same stress
scenario the capital position of the banking system
gets impacted by about 2.6 percentage points for the
banking book.
Liquidity Risk
2.55 To capture the impact on the liquidity risk,
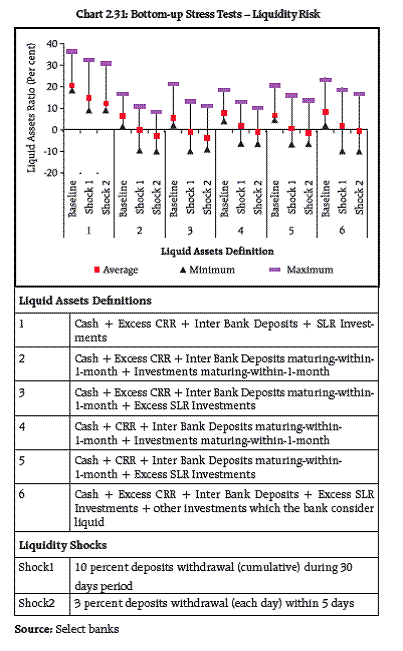
analysis has been done with five definitions of liquid
assets28. As per these definitions, the liquid assets
comprise of Cash, CRR, Inter-bank-deposits and
Investments. Different liquid asset ratios are arrived
at using various definitions under the baseline
scenario. The stress scenarios are constructed to test
the ability of banks to meet a run on their deposits
using only their liquid assets. It is assumed that (1)
ten per cent total deposits would be withdrawn in 10
days and (2) three per cent deposits would be
withdrawn in each day for 5 days. Under the stress
scenarios, there were indications of deterioration in
the liquidity position of banks though SLR investments
and CRR helped the banks to ward off the liquidity
pressure.
Bottom Up Stress Tests
2.56 The results of the bottom up stress tests carried
out by select banks also testified to the general
resilience of the banks to different kinds of shocks.
As in the case of top down stress tests, the impact of
the stress tests was relatively more severe on some
banks with their stressed CRAR position falling below
the regulatory minimum (Chart 2.30).
2.57 The results of bottom up stress tests for
liquidity risk show significant impact of liquidity
shocks on select banks. The results also reflect that
SLR investments, and CRR deposits to some extent,
helped the banks to sustain against the liquidity
pressure from sudden and unexpected withdrawal of
deposits by depositors (Chart 2.31).
Derivatives Portfolio of Banks
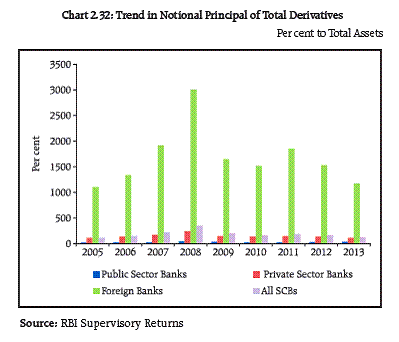
2.58 The derivatives portfolio of banks in India grew
sharply in the years leading up to the global financial
crisis. Though the portfolio size has shrunk since
2008, it still remains large with the outstanding
notional principal of the derivatives portfolio of banks
constituting over 120 per cent of banks’ total assets
as on March 31, 2013. However, the credit equivalent
of derivate portfolio is about 8 per cent of the balance
sheet assets. The foreign banks as a group account for
about 80 per cent of the outstanding notional
principal in the derivatives market, whereas their
share in the balance sheet assets of the banking
system is only 7 per cent. The size of outstanding
notional principal and their credit equivalent for
foreign banks is about 1200 and 80 per cent of total
assets respectively (Chart 2.32 and 2.33).

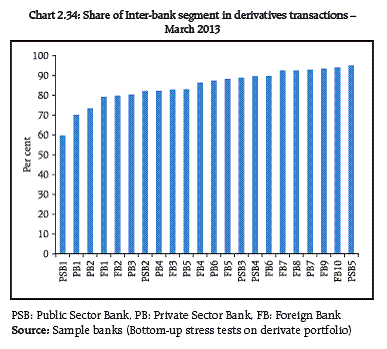 2.59 Among the sample banks29, the majority of
outstanding derivative transactions are interbank
transactions. The interbank segment of the derivatives
portfolio constituted about 85 per cent of the total
outstanding derivatives as at March 2013 (Chart 2.34).
2.60 The credit equivalent of derivative portfolio of
public and private sector banks were not very
significant. However, the credit equivalent for foreign
banks were large (Chart 2.35).
2.61 The mark to market (MTM) value of the
derivatives portfolio for the banks in the sample
varied – with most banks registering positive net
MTM with the exception of a few large negative Net
MTM (Chart 2.36).
2.62 A series of stress tests (sensitivity analysis) on
derivative portfolios were conducted with the
reference date as March 31, 2013. The banks in the
sample reported the results of four separate shocks
on interest rates and foreign exchange rates. The
shocks on the interest rates ranged from 1.0
percentage points to 2.5 percentage points, while that
for foreign exchange rates was kept at 20 per cent.
The stress tests were carried out on individual shocks,
on stand-alone basis. The results showed that the
average net impacts of shocks on sample banks were
not very high (Chart 2.37).
Scheduled Urban Co-operative Banks (SUCBs)
2.63 The CRAR of SUCBs has remained at 12.7 per
cent as at end March 2013, whereas, GNPA ratio
declined to 5.3 per cent as at end March 2013 from
6.1 per cent in September 2012. The annualised return
on assets (RoA) declined from 1.1 per cent in the
quarter ended September 2012 to 0.9 per cent in the
quarter ended March 2013. The Liquidity Ratio for
the SUCBs declined marginally to 34.0 per cent in
March 2013 from 34.1 per cent in September 2012.
However, the Provision Coverage Ratio (PCR) of SUCBs
improved to 73.7 per cent in March 2013 from 66.3
per cent in September 2012 (Table 2.8).
2.64 Stress tests for assessment of credit risk were
carried out for SUCBs using the data as on March 31,
2013. The impact of credit risk shocks on the CRAR
of the SUCBs was observed under two different
scenarios assuming an increase in the gross NPA ratio
by 50 per cent and 100 per cent respectively. The
results show that SUCBs could withstand shocks
assumed under the first scenario easily, though they
would come under some stress under the second
scenario (Chart 2.38).
2.65 Stress tests on liquidity risk were carried out
under two different scenarios assuming increase in
cash outflows in the 1 to 28 days time bucket by 50
per cent and 100 per cent respectively. It was further
assumed that there was no change in cash inflows
under both the scenarios. The SUCBs would be
impacted as a result of the stress if the mismatch or
negative gap (i.e. the cash inflow being less than the
cash outflow) in the 1 to 28 days time bucket exceeds
20 per cent of outflows. The stress test results indicate
that the SUCBs would be significantly impacted even
under the less severe stress scenario (Chart 2.39).
Table 2.8 Select Financial Soundness Indicators of SUCBs |
(Per cent) |
Financial Soundness Indicators |
Sep-12 |
Mar-13 |
1. CRAR |
12.7 |
12.7 |
2. Gross NPAs to Gross Advances |
6.1 |
5.3 |
3. Return on Assets (annualized) |
1.1 |
0.9 |
4. Liquidity Ratio |
34.1 |
34.0 |
5. Provision Coverage Ratio |
66.3 |
73.7 |
Note: 1. Data are provisional and based on OSS Returns.
2. Liquidity Ratio = 100 * (Cash + due from banks + SLR investment) / Total Assets.
3. PCR = NPA provisions held as per cent of Gross NPAs.
Source: RBI Supervisory Returns and Staff Calculations |
Non-Banking Financial Companies (NBFCs)
2.66 The NBFCs sector under Reserve Bank‘s
regulation is dominated by non-deposit taking
systemically important NBFCs (NBFC-ND-SIs), which
account for around 90 per cent of the sector in terms
of asset size.
Capital Adequacy
2.67 The CRAR norms were made applicable to
NBFCs-ND-SI w.e.f April, 200730, in terms of which
every systemically important non-deposit taking
NBFC is required to maintain a minimum capital,
consisting of Tier-I and Tier- II capital, of not less than
15 per cent of its aggregate risk-weighted assets. The
aggregate CRAR of the NBFCs-ND-SI sector stood at
26.8 per cent for the quarter ended December 2012
(27.4 per cent in the previous quarter ended
September 2012) (Chart 2.40).
Asset Quality
2.68 The GNPA ratio of the NBFCs-ND-SI sector stood
at 3.2 per cent for the quarter ended December 2012
as against 2.5 per cent for the same quarter in the
preceding year. Trends in GNPA ratio is given in Chart
2.41.
Profitability
2.69 The ROAs (net profit as a percentage of total
assets) of the NBFCs-ND-SI sector stood at 2.1 per cent
for the quarter ended December 2012 as compared
with 1.8 per cent for the same quarter in the previous
year (Chart 2.42).
Real Estate Exposure
2.70 Advances of NBFCs-ND-SI to real estate sector
on an average accounted for 4.5 per cent of total
advances to this sector. Trends in advances to real
estate sector in absolute terms are furnished in Chart 2.43.
Capital Market Exposure (CME)
2.71 Capital market exposure includes (i)
investments in listed instruments and (ii) advances
to capital market related activities. CME of the
NBFCs-ND-SI sector on an average accounted for 8.8
per cent of total assets of the sector, while CME to
own funds of the sector accounted for 34.0 per cent
(Chart 2.44).
Stress Tests - Credit Risk
System level (NBFC-D and NBFC-ND-SI)
2.72 Stress tests on credit risk for NBFCs (includes
both deposit taking and ND-SI sectors) for the period
ended December 2012 were carried out under two
scenarios (i) where gross NPA increased two times and
(ii) gross NPA increased 5 times from the current level.
It was observed that in the first scenario, CRAR
dropped by 1.1 percentage points from 21.7 per cent
to 20.6 per cent while in the second scenario CRAR
dropped by 4.4 percentage points (CRAR dropped from
21.7 per cent to 17.3 per cent). It may be concluded
that even though there will be a decline in CRAR under
both the scenarios, it will remain above the minimum
required level of 15 per cent.
Select NBFCs
2.73 Stress tests on credit risk for individual NBFCs
for the period ended December 2012 was also carried
out under the same scenarios as used for system level
stress tests. Under the first scenario, it was observed
that CRAR in respect of 3.5 per cent companies was
less than minimum regulatory requirement of 15 per
cent while in the second scenario, CRAR in respect of
8.9 per cent companies went under 15 per cent.
Insurance
Soundness
2.74 The soundness of insurance companies is
indicated by solvency ratio. During the first three
quarters of the financial year 2012-13, the life and
non-life insurance companies comfortably maintained
the minimum required solvency ratios of 1.5 and 1.3,
respectively.
Business operations
2.75 The total premium collected by life insurance
companies during the first three quarters of 2012-13
was `1.80 trillion out of which LIC accounted 71.9
per cent. During the same period, total premium
collected by non life insurance companies (excluding
GIC) was `513.88 billion, out of which 52.5 per cent
was contributed by the four companies in the public
sector.
Life Insurance
2.76 The business of the life insurance sector,
measured in terms of new business premium
continued to contract for the last two years. The new
business premium contracted by 6.3 per cent on y-o-y
basis in the FY: 2012-13 (Chart 2.45). This contraction
was observed in both public (i.e. Life Insurance
Corporation of India (LIC)) and private sectors. The
profitability of the life insurance companies had also
declined during the first three quarters of 2012-13
from the previous year. A major shift in the sector has
been the move away from ULIP products, which is
especially evident in the private sector.
Single Premium Policies
2.77 A major part of the new business premium of
LIC is from single premium policies, hovering around
60 per cent of the total premium. Since 2010 -11,
private insurers have also expanded their single
premium business to about 30 per cent of the total.
Overall contribution of single premium business for
the life insurance sector increased to 51.4 per cent
during 2012-13 from 45.2 per cent of the previous
year (Chart 2.46).
2.78 From Chart 2.46, it can be observed that the
number of single premium policies sold is declining
with increase in premium indicating rising ticket size
of single premium policies.
Persistency
2.79 Life insurance policies being long term in
nature, it is necessary to put in place measures to
ensure that they remain in force throughout their life.
Persistency31 of life policies is, however, a problem
globally due to the following issues i) during the life
of the policy, there might be better products with
more beneficial features available in the market, or
ab initio the product was not appropriate to the
insured’s requirements over the lifetime;
ii) extraneous factors like change in the policyholder’s
economic profile, job, etc., and iii) poor after- sales
service due to attrition of agents, etc., IRDA has been
initiating measures to improve the persistency in the
Indian life insurance market, especially for post sales
service of orphan policies. This has resulted in some
improvement.
Pension Fund
2.80 The New Pension System (NPS) introduced by
the Government of India with a view to develop the
pension sector, is mandatory for all new recruits to
the Government (except armed forces) with effect
from January 1, 2004 and has also been rolled out to
all citizens with effect from May 1, 2009 on a
voluntary basis. During March 2010 and March 2013
the subscriber base of NPS grew by 522.9 per cent,
whereas, the corpus increased by 538.0 per cent,
indicating a steep growth pattern in the subscriber
base and corpus during the short time (Table 2.9).
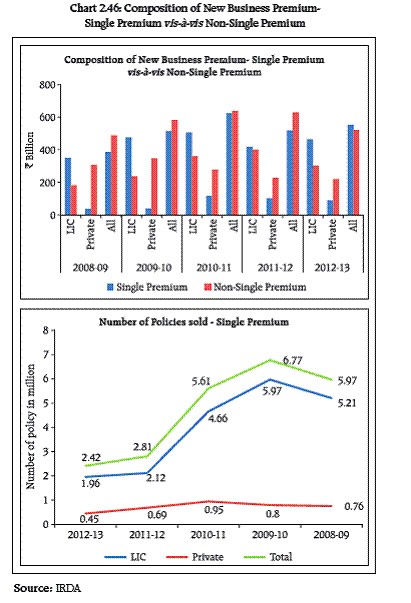
Table 2.9: Developments in New Pension System |
|
Number of Subscribers (in Lakhs) |
Assets Under Management (in Crores) |
Growth of Mar-13 over Mar-10 (%) |
Mar-10 |
Mar-11 |
Mar-12 |
Mar-13 |
Mar-10 |
Mar-11 |
Mar-12 |
Mar-13 |
No of Subcribers |
AUM |
Central Government |
5.96 |
7.48 |
9.47 |
11.40 |
4,484.04 |
7,266.39 |
11,341.43 |
17,576.00 |
91.15 |
291.97 |
State Government |
1.79 |
5.83 |
11.44 |
16.26 |
185.64 |
1,203.95 |
3,420.42 |
10,489.00 |
806.22 |
5,550.18 |
NPS Main-Private Sector |
0.04 |
0.36 |
0.74 |
2.13 |
9.52 |
111.26 |
260.93 |
1,351.00 |
5,042.44 |
14,091.18 |
NPS Lite |
|
4.86 |
9.69 |
18.79 |
- |
3.13 |
140.46 |
436.00 |
- |
- |
Total |
7.80 |
18.53 |
31.34 |
48.58 |
4,679.20 |
8,584.73 |
15,163.24 |
29,852.00 |
522.85 |
537.97 |
- : Not Available.
Source: PFRDA |
2.81 The fast growing subscriber base and corpus
have been accompanied with notable returns. The
weighted average return as on March 31, 2013
calculated on the basis of Net Asset Value of the NPS
Schemes was in the range of 8.4 per cent to 14.2 per
cent (Table 2.10).
2.82 The 2013-14 budget estimated a total outflow
of `707.26 billion on pensions of central government
employees alone, which is an increase of 10.79 per
cent over the revised estimate of `638.36 billion for
2012-13. The outflows are expected to rise as the
cohort of recruits between 1970s and 1980s retire. In
the case of several Defined Benefit (DB) schemes,
currently under implementation and newly announced
(mostly in the government sector), the lack of liability
computation especially in a world of rising life
expectancy can be a potential source of fiscal stress
in years when there are large payouts.
Table 2.10: Weighted Average Returns on Pension Funds |
Scheme |
Returns (Per cent) |
Central Government |
12.39 |
State Government |
13.00 |
Swavalamban |
13.40 |
Private: Equity |
8.38 |
Private: Corporate Debt |
14.19 |
Private: Government Debt |
13.52 |
Source: PFRDA |
|