The growth of the Indian banking sector moderated further during 2013-14. Profitability declined on account
of higher provisioning on banks’ delinquent loans and lacklustre credit growth. The financial health of urban and
rural co-operatives indicated divergent trends in terms of key indicators. While urban co-operative banks (UCBs)
exhibited improved performance, the performance of primary agriculture credit societies (PACS) and long term
rural credit co-operatives remained a matter of concern with a further increase in their losses coupled with a
deterioration in asset quality. While the asset size of the non-banking financial companies (non-deposit taking
systemically important) showed an expansion, asset quality deteriorated further during the period of review.
The banking stability indicator suggests that overall risks to the banking sector remained unchanged during the
first half of 2014-15. In individual dimensions, though the liquidity position improved in the system, concerns
remain on account of deterioration in asset quality along with weakened soundness. The profitability dimension
of the indicator showed an improvement but it remained sluggish. The stress tests suggest that the asset quality
of banks may improve in the near future under expected positive developments in the macroeconomic conditions
and banks may also be able to meet expected losses with their existing levels of provisions. However, the asset quality
of scheduled commercial banks (SCBs) may worsen from the current level if the macroeconomic conditions
deteriorate drastically and banks are likely to fall short in terms of having sufficient provisions to meet expected
losses under adverse macroeconomic risk scenarios.
Analysis of the interconnectedness indicates that the size of the interbank market in relation to total banking
sector assets has been on a steady decline. However, contagion analysis with top five most connected banks reveals
that the banking system could potentially lose significant portion of its total Tier-I capital under the joint solvencyliquidity
condition in the event of a particular bank triggering a contagion.
2.1 Given the sluggish demand for credit and
concerns about asset quality, the Indian banking
sector experienced relatively lower growth and dip in
profitability in 2013-14. Scheduled commercial banks
(SCBs) showed a moderation in balance sheet growth
and a fall in net profits, while the trends were
divergent amongst other banking institutions with
urban co-operative banks and short-term rural credit
co-operative institutions other than primary
agriculture credit societies (PACS) showing an
improvement in growth as well as health. Long-term
credit co-operative institutions, however, continued
to be a weak spot within the banking sector.
2.2 Data used in this report are based on audited
accounts of banks for the year ended 31 March 2014
as well as supervisory returns till 30 September 2014.
The annual accounts include foreign operations of
banks, whereas, the supervisory returns covered only their domestic operations. The detailed data on
balance sheets as well as income and expenditure of
SCBs, regional rural banks, local area banks, urban
co-operative banks and rural credit co-operatives are
available in the ‘Statistical Tables Relating to Banks
in India 2013-14’ (www.rbi.org.in).
Scheduled commercial banks
2.3 This section discusses the health and
performance of SCBs on the basis of their:
(i) consolidated operations covering their domestic as
well as overseas operations during 2013-2014 (as
reported through their audited accounts) and
(ii) domestic operations during the first half of
2014-15 (based on supervisory returns).
Performance
Consolidated operations
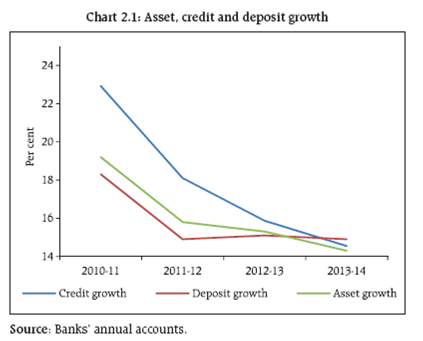
2.4 The consolidated balance sheet of SCBs in
2013-14 registered a decline in growth in total assets and credit for the fourth consecutive year (Chart 2.1).
This decline could be attributed to a variety of factors
ranging from slower economic growth, de-leveraging,
persistent pressure on asset quality leading to
increased risk aversion among banks and also
increasing recourse by corporates to non-bank
financing including commercial papers and external
commercial borrowings.
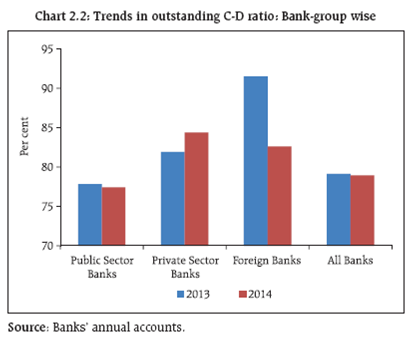
2.5 With both credit and deposit growth more or
less same, the outstanding credit to deposit (C-D) ratio
at the aggregate level remained unchanged at around
79 per cent (Chart 2.2).
Domestic operations
Credit and deposit growth
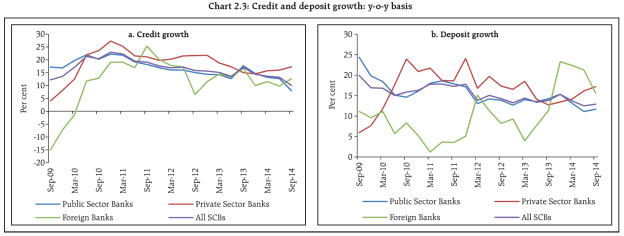
2.6 Credit growth on a y-o-y basis continues to
decline and recorded low growth at 10.0 per cent as
of September 2014, with public sector banks (PSBs)
underperforming the rest with a growth of 7.9 per
cent. Growth in deposits also declined to 12.9 per cent
as of September 2014 from 13.7 per cent as of March
2014 (Chart 2.3).
Soundness
Capital adequacy
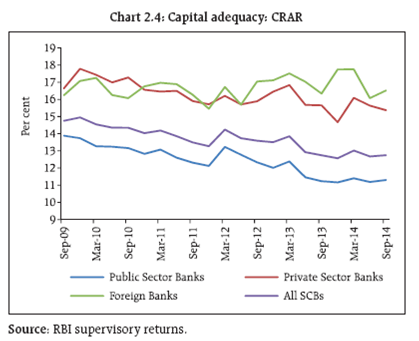
2.7 Between March and September 2014 the total
capital and risk weighted assets (RWA) of SCBs
increased by 1.9 per cent and 4.1 per cent respectively.
This has resulted in decline in the capital to risk
weighted assets ratio (CRAR) from 13.0 per cent to
12.8 per cent (Chart 2.4).
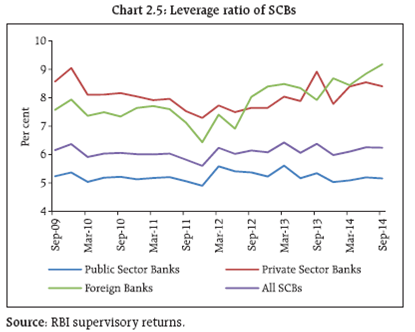
Leverage
2.8 The Tier I leverage ratio1 was 6.2 per cent in
September 2014. In the case of PSBs, it marginally
improved to 5.2 per cent in September 2014 from 5.1
per cent in March 2014 (Chart 2.5).
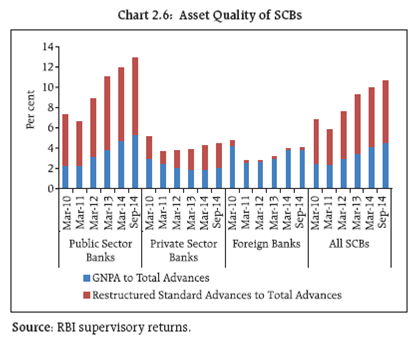
Asset quality
2.9 The gross non-performing advances (GNPAs)
of SCBs as a percentage of the total gross advances
increased to 4.5 per cent in September 2014 from 4.1
per cent in March 2014. The net non-performing
advances (NNPAs) as a percentage of total net advances
also increased to 2.5 per cent in September 2014 from
2.2 per cent in March 2014. Stressed advances2
increased to 10.7 per cent of the total advances from
10.0 per cent between March and September 2014.
PSBs continued to record the highest level of stressed
advances at 12.9 per cent of their total advances in
September 2014 followed by private sector banks at
4.4 per cent (Chart 2.6).
2.10 At a more granular level, share of stressed
advances in total advances increased in the case of 46
SCBs (accounting for around 88 per cent of total loan
portfolios of SCBs) between March and September 2014 (Table 2.1). There are 20 banks which have higher
share in the total stressed advances of all SCBs than
their share in the total advances of SCBs. These 20
banks together have 43 per cent of the total SCB loans
and contribute around 60 per cent of the total stressed
advances of the banking system.
Table 2.1: Changes in the stressed advances ratio : March - September 2014 |
|
No. of
Banks |
Share in Total
Advances of all
SCBs (in per cent) |
Increase in Stressed Advances Ratio |
46 |
88.2 |
Decline in Stressed Advances Ratio |
25 |
5.9 |
No Change in Stressed Advances Ratio |
18 |
5.9 |
Total |
89 |
100.0 |
Source: RBI supervisory returns. |
2.11 Five sub-sectors: infrastructure, iron and steel,
textiles, mining (including coal) and aviation, had
significantly higher levels of stressed assets and thus
these sub-sectors were identified as ‘stressed’ sectors
in previous FSRs. These five sub-sectors had 52 per
cent of total stressed advances of all SCBs as of June
2014, whereas in the case of PSBs it was at 54 per cent
(Table 2.2).
Table 2.2: Share of stressed advances in total loan portfolio |
(Per cent) |
Sub-sector |
|
All SCBs |
PSBs |
Mar-13 |
Mar-14 |
Jun-14 |
Mar-13 |
Mar-14 |
Jun-14 |
Mining |
Share in Total Advances of SCBs |
0.7 |
0.6 |
0.6 |
0.8 |
0.7 |
0.7 |
Share in Total Stressed Advances of SCBs |
0.6 |
0.9 |
0.9 |
0.6 |
0.8 |
0.8 |
Iron and Steel |
Share in Total Advances of SCBs |
4.9 |
4.8 |
4.8 |
5.7 |
5.5 |
5.6 |
Share in Total Stressed Advances of SCBs |
8.2 |
10.8 |
10.2 |
8.7 |
11.2 |
10.6 |
Textiles |
Share in Total Advances of SCBs |
3.7 |
3.5 |
3.5 |
4.1 |
4.0 |
4.0 |
Share in Total Stressed Advances of SCBs |
7.5 |
7.7 |
7.2 |
7.5 |
7.8 |
7.4 |
Infrastructure |
Share in Total Advances of SCBs |
14.6 |
14.4 |
14.8 |
16.8 |
16.5 |
17.1 |
Share in Total Stressed Advances of SCBs |
28.8 |
29.4 |
30.7 |
29.5 |
30.2 |
31.9 |
Aviation |
Share in Total Advances of SCBs |
0.5 |
0.5 |
0.5 |
0.6 |
0.6 |
0.7 |
Share in Total Stressed Advances of SCBs |
3.9 |
3.3 |
3.1 |
4.3 |
3.6 |
3.4 |
Total |
Share in Total Advances of SCBs |
24.4 |
23.9 |
24.2 |
28.0 |
27.2 |
28.0 |
Share in Total Stressed Advances of SCBs |
48.9 |
52.0 |
52.0 |
50.5 |
53.7 |
54.0 |
Source: RBI supervisory returns. |
2.12 The data on exposure to infrastructure as of
September 2014 shows that SCBs’ exposure to the
sector rose further to 15.6 per cent of their total loans.
Exposure to the energy segment largely comprising
of electricity, oil and gas constituted the major portion
(around 58 per cent) of banks’ aggregate exposure to
infrastructure sectors, followed by transport (around
21 per cent) and telecommunications (around 10 per
cent). Among bank groups, exposure of PSBs to
infrastructure stood at 17.5 per cent of their gross advances as of September 2014. This was significantly
higher than that of private sector banks (at 9.6 per
cent) and foreign banks (at 12.1 per cent).
Profitability
Consolidated operations
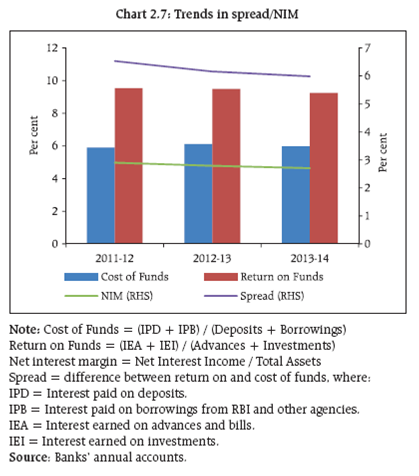
2.13 During 2013-14, the growth in net profits of
SCBs, which had been on a declining trend since
2011-12, turned negative. SCBs as a whole reported
net profits of about `809 billion, indicating decline
by 11.3 per cent compared to previous year. This
decline in net profits was primarily the result of higher
provisioning on banks’ delinquent loans which
registered an increase of nearly 34 per cent coupled
with growth in the interest expenses of around 12
per cent during the year. This in turn impacted their
return on assets (RoA) and return on equity (RoE)
(Table 2.3). Their spread and net interest margin (NIM)
also witnessed a decline (Chart 2.7).
Table 2.3: Return on assets and return on
equity of SCBs: Bank group-wise |
(Per cent) |
Sr. No. |
Bank Group/Year |
Return on Assets |
Return on Equity |
|
1 |
2 |
3 |
4 |
5 |
|
2012-13 |
2013-14 |
2012-13 |
2013-14 |
1 |
Public sector banks |
0.80 |
0.50 |
13.24 |
8.47 |
2 |
Private sector banks |
1.63 |
1.65 |
16.46 |
16.22 |
3 |
Foreign banks |
1.92 |
1.57 |
11.53 |
9.02 |
|
All SCBs |
1.04 |
0.81 |
13.84 |
10.68 |
Notes: Return on Assets = Net profit/Average total assets.
Return on Equity = Net profit/Average total equity.
Source: Annual accounts of respective banks. |
Domestic operations
2.14 After contraction in the profit after tax (PAT)
during the financial year 2013-14, SCBs recorded
positive growth in PAT at 10.0 per cent in September
2014 due to the significantly lower growth in
provisioning and write-offs. The RoA of all SCBs
remained at 0.8 per cent as of September 2014,
whereas, RoE of SCBs improved to 9.9 per cent as of
September 2014 from 9.5 per cent as of March 2014
(Table 2.4).
Table 2.4: Profitability of SCBs |
(Per cent) |
|
Return on Assets |
Return on Equity |
PAT Growth |
Earnings Before
Provisions & Taxes-Growth |
Net Interest
Income-Growth |
Other Operating
Income-Growth |
Sep-11 |
1.0 |
12.4 |
6.3 |
11.2 |
16.8 |
4.1 |
Mar-12 |
1.1 |
13.4 |
14.6 |
15.3 |
15.8 |
7.4 |
Sep-12 |
1.1 |
13.2 |
24.5 |
13.2 |
12.9 |
12.4 |
Mar-13 |
1.0 |
12.9 |
12.9 |
9.9 |
10.8 |
14.4 |
Sep-13 |
0.8 |
10.2 |
-9.7 |
12.8 |
11.6 |
30.5 |
Mar-14 |
0.8 |
9.5 |
-14.1 |
9.5 |
11.7 |
16.6 |
Sep-14 |
0.8 |
9.9 |
10.0 |
7.0 |
9.7 |
4.3 |
Note: RoA and RoE are annualised figures, whereas growth on a y-o-y basis.
Source: RBI supervisory returns. |
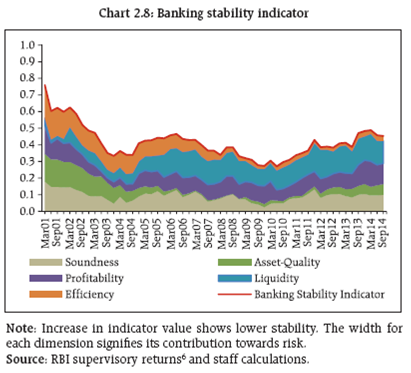
Risks
2.15 As per the Banking Stability Indicator (BSI),3
risks to the banking sector have not changed much
since the publication of the previous FSR.4 The BSI
showed a continuous increase in vulnerability in the
banking sector over the past few years. The factors
contributing towards increase in risks, in the order
of their share, are liquidity, profitability, soundness
and asset quality. Though the liquidity position
improved in the system during March and September
2014, concerns remain over deterioration in asset
quality and soundness.5 Profitability improved but
remained sluggish (Charts 2.8 and 2.9).

Stress tests
Macro stress test: Credit risk
2.16 The resilience of the Indian banking system
against macroeconomic shocks was tested through a
series of macro stress tests for credit risk at the
system, bank group and sectoral levels. These tests
encompass assumed risk scenarios incorporating a
baseline and two adverse macroeconomic scenarios
representing medium and severe risks (Table 2.5). The
adverse scenarios were derived based on up to 1 standard deviation (SD) for medium risk and 1.25 to
2 SD for severe risk (ten years historical data).
Table 2.5: Macroeconomic scenario assumptions7 |
(per cent) |
FY |
|
Baseline |
Medium
Stress |
Severe
Stress |
2014-15* |
Real GDP Growth |
5.5 |
4.0 |
2.6 |
Gross Fiscal Deficit |
4.1 |
4.9 |
5.7 |
CPI (Combined) Inflation |
7.4 |
8.9 |
10.4 |
Weighted Average Lending Rate |
12.1 |
12.6 |
13.0 |
Merchandise Exports to GDP Ratio8 |
15.5 |
14.3 |
13.1 |
2015-16 |
Real GDP Growth |
6.3 |
4.1 |
2.1 |
Gross Fiscal Deficit |
3.6 |
4.8 |
6.0 |
CPI (Combined) Inflation |
7.2 |
9.5 |
11.6 |
Weighted Average Lending Rate |
12.1 |
12.8 |
13.5 |
Merchandise Exports to GDP Ratio |
16.5 |
14.7 |
13.0 |
* Average number for the last two quarters of FY 2014-15. |
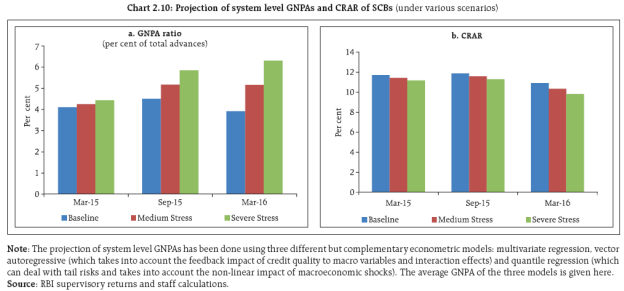
System level credit risk
2.17 The macro stress tests for credit risk suggest
that under the baseline scenario, which assumes
improvement in the overall macroeconomic scenario
during the next financial year, the GNPA ratio of all
SCBs may decline to 4.0 per cent by March 2016 from
4.5 per cent as at end September 2014. However, if
macroeconomic conditions deteriorate, the GNPA ratio
may increase further and under a severe stress scenario could rise to around 6.3 per cent by March
2016. Under such a severe stress scenario, the system
level CRAR of SCBs could decline to 9.8 per cent by
March 2016 from 12.8 per cent in September 2014
(Chart 2.10).
Bank group level credit risk
2.18 Under the assumed baseline scenario of
improved macroeconomic conditions, the asset
quality of public sector banks is expected to improve,
but they will continue to carry the highest GNPA ratio
among the bank groups (Chart 2.11).
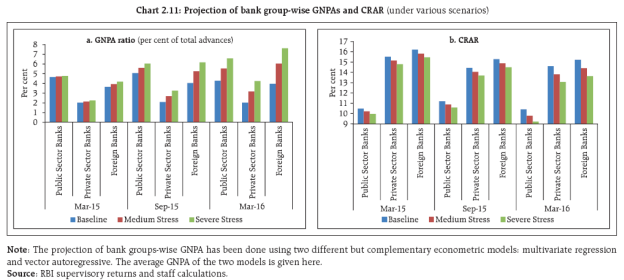
2.19 Under a severe stress scenario, PSBs may
record the lowest CRAR of around 9.2 per cent by
March 2016 (as against 11.3 per cent in September
2014), close to the minimum regulatory capital
requirement of 9 per cent (Chart 2.11).
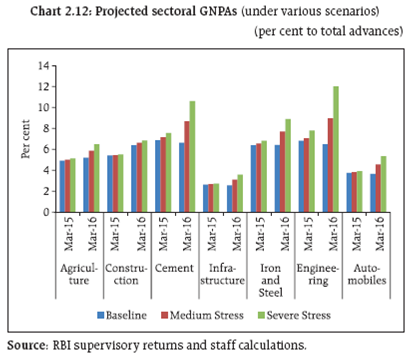
Sectoral credit risk
2.20 A macro stress test of sectoral credit risk
revealed that under a severe stress scenario, among
seven select sectors the engineering sector is expected
to register the highest GNPA ratio at 12.0 per cent by
March 2016 followed by the cement sector (10.6 per
cent) (Chart 2.12).
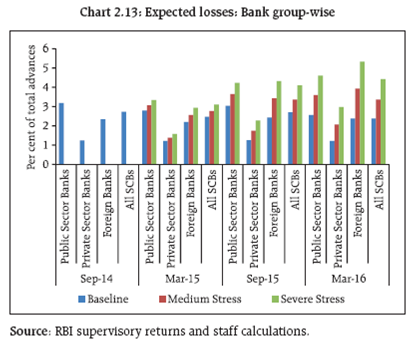
Estimation of losses9 for credit risk: Provisioning
and capital adequacy
2.21 Due to secular deterioration in their asset
quality, SCBs’ expected loss (EL) continues to rise
but might decline in the second half of 2015-16 if
the assumed improvements in macroeconomic
conditions materialise. The current level of
provisions10 of various bank groups – public sector
banks, private sector banks and foreign banks as a
proportion of their respective total advances as of
September 2014 were at 3.2 per cent, 1.9 per cent
and 3.9 per cent respectively. Among the bank
groups, PSBs had the highest expected loss at 3.2 per
cent of their total advances as of September 2014.
Though they may meet the expected losses under
baseline scenarios they are likely to fall short in
terms of having sufficient provisions to meet
expected losses (EL) under adverse macroeconomic
risk scenarios11 (Chart 2.13).
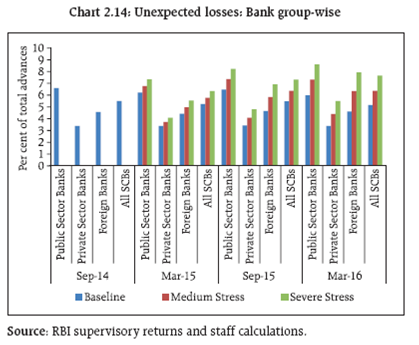
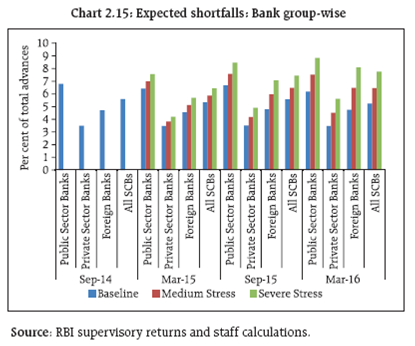
2.22 The estimated unexpected losses (UL) and
expected shortfalls (ES) arising from the credit risk of
various bank groups even under severe macroeconomic
stress conditions are expected to be much lower than
the present level of total capital (Tier-I plus Tier-II)
maintained by them. Public sector banks, private
sector banks and foreign banks maintained total
capital at the level of 12.5 per cent, 21.4 per cent and
36.0 per cent of total advances respectively as of
September 2014 (Charts 2.14 and 2.15).
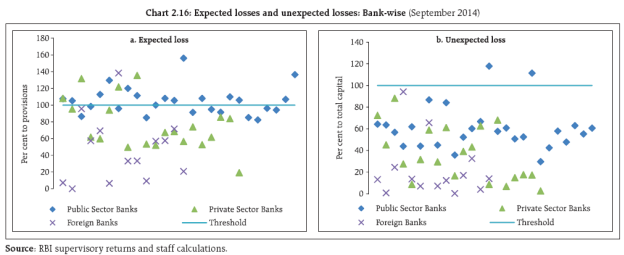
2.23 The bank-wise12 estimation of EL and UL
arising from credit risk shows that 20 banks (mostly
PSBs) were unable to meet their expected losses with
their existing provisions. These banks had a 29.8 per
cent share in the total advances of the select 60 banks.
On the other hand, there were only two banks (with
2.0 per cent share in total advances of the select banks)
which were expected to have higher unexpected
losses than the total capital (Chart 2.16).
Sensitivity Analysis: Bank Level13
2.24 A number of single factor sensitivity stress
tests (top-down) were carried out on select SCBs (60
banks accounting for 99 per cent of the total banking
sector assets) to assess their vulnerabilities and
resilience under various scenarios. The resilience of
commercial banks with respect to credit, interest rate
and liquidity risks was studied through the top-down
sensitivity analysis by imparting extreme but
plausible shocks. The results are based on September
2014 data.14
Top-down stress tests
Credit risk
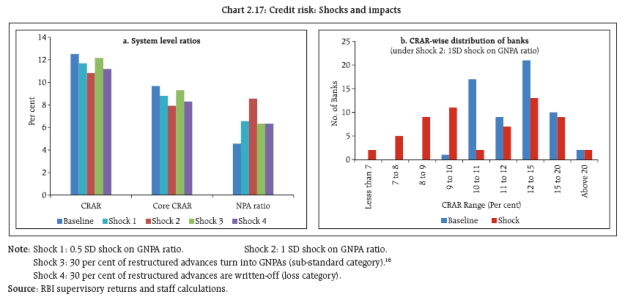
2.25 The impact of different static credit shocks
for banks as on September 2014 shows that the system
level stressed CRAR remained above the required
minimum of 9 per cent (Chart 2.17). Capital losses at the system level could be about 15 per cent in the
case of a severe shock of 1 SD15 (shock 2), while the
impact on banks’ profits would be more severe wiping
out their annual profits. The stress test results further
show that 16 banks, mostly PSBs, sharing about 28
per cent of SCBs’ total assets, would fail to maintain
required CRAR if GNPA increases under shock 2
assumptions. For 7 banks, the CRAR may even go
below the level of 8 per cent.
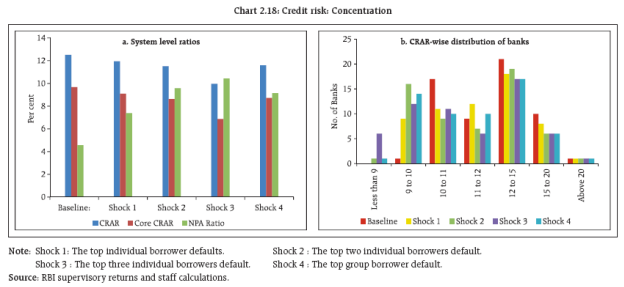
Credit concentration risk
2.26 Stress tests on the credit concentration risk
of banks show that the impact under various stress
scenarios was significant for six banks, which account
for 8 per cent of the assets, with their CRAR falling
below 9 per cent. Capital losses could be around 5
per cent, 9 per cent and 14 per cent at the system
level under the assumed scenarios of default of the
top one, two and three individual borrowers respectively. Capital losses17 could be around 9 per
cent at the system level under the assumed scenarios
of default of the top group borrower. The impact on
profit before tax (PBT) could be as high as 202 per
cent with a minimum of 73 per cent under the same
scenarios. The direct impact on CRAR at the system
level under the assumed scenarios of default of the
top individual borrower, the top two individual
borrowers, the top three individual borrowers and
default by the top group borrowers would be 56, 100,
254 and 94 basis points respectively. However, system
level CRAR will remain above 9 per cent under these
shocks (Chart 2.18).
Sectoral credit risk
2.27 Credit risk of exposure to a few important
sectors/industries was examined through sectoral
credit stress tests. The assumed shock was an
increase in GNPAs ratio by 5 percentage points in
each sector. The results of a sensitivity analysis
revealed that the shocks would significantly increase
system level GNPAs, with the most significant effect
of the single sector shock being in the real estate
(Table 2.6). The impact of the shock on capital ratios
was limited given that only a portion of the credit
portfolio was shocked. However, there could be a significant impact on banks’ profitability (profit
before tax).
Table 2.6: Credit risk: Sectors |
(Per cent) |
Sector level |
System level |
CRAR |
Tier-1
CRAR |
GNPA
Ratio |
Losses as
per cent
of capital |
Losses as
per cent
of profit |
Baseline: |
12.5 |
9.7 |
4.6 |
- |
- |
|
Share in Total
Advances |
GNPA Ratio of
the Sector |
Shock: 5 percentage points increase
in GNPAs in each sector |
Agriculture |
12.6 |
5.4 |
12.3 |
9.4 |
5.2 |
2.4 |
17.6 |
Power |
9.0 |
1.4 |
12.3 |
9.5 |
5.0 |
1.6 |
11.7 |
Real Estate |
17.4 |
4.6 |
12.2 |
9.3 |
5.4 |
3.3 |
24.5 |
Telecom |
1.6 |
4.8 |
12.5 |
9.6 |
4.6 |
0.3 |
2.3 |
All 4 Sectors (Agriculture + Power + Real Estate + Telecom) |
41.0 |
4.0 |
11.7 |
8.8 |
6.6 |
7.7 |
57.9 |
Priority Sector |
34.1 |
5.2 |
11.8 |
9.0 |
6.3 |
6.4 |
47.7 |
Source: RBI supervisory returns and staff calculations. |
Interest rate risk
2.28 The interest rate risk in the trading book
(direct impact on AFS and HFT portfolios of banks)
under various stress scenarios is manageable with
reduction in CRAR by 74 basis points at the system
level. This impact is due to parallel upward shift (2.5
percentage points) in the yield curve. Reduction in
CRAR was 82 basis points reported in the previous
FSR (June 2014) for the same shock. At the disaggregated
level, three banks that accounted for 5.1 per cent
assets are getting impacted adversely. The total capital
loss at the system level would be about 6.6 per cent.
The assumed shock of 2.5 percentage points parallel
upward shift in the yield curve on the HTM portfolio
of banks, if marked-to-market, would significantly
reduce the CRAR by about 261 basis points (the
previous FSR reported an impact of 280 basis points),
impacting 25 banks. The income impact on the
banking book18 of SCBs could be about 50 per cent of
their profit (before tax) under the assumed shock of
a parallel downward shift (2.5 percentage points) in
the yield curve.
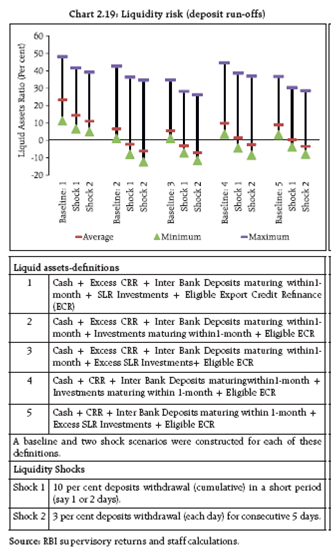
Liquidity risk
2.29 The liquidity risk analysis captures the impact
of assumed deposit run-off scenarios on banks. The
analysis used five definitions of liquid asset.19 As per
these definitions, liquid assets comprise of cash, CRR,
interbank deposits and investments in different
forms. Different liquid asset ratios20 were arrived at
using various definitions under the baseline scenario.
The stress scenarios were constructed to test the banks’ ability to meet a run on their deposits using
only their liquid assets. The analysis shows that
though there was liquidity pressure under the stress
scenarios, banks could withstand sudden and
unexpected withdrawals by depositors under assumed
shocks with the help of their statutory liquidity ratio
(SLR) investments (Chart 2.19).
2.30 Another liquidity risk analysis based on the
unutilised portion of credit lines which are sanctioned/
committed/guaranteed (taking into account the
undrawn working capital sanctioned limit, undrawn
committed lines of credit and letters of credit and
guarantees) was carried out to focus on banks’ ability
to fulfil the additional demand for credit. Banks were
required to meet the demand using their cash
balances, excess CRR, short term interbank deposits
(one month maturity), excess SLR and eligible export
credit refinance (ECR). The major impact was due to
the utilisation of undrawn working capital limits and
around 12 small banks were unable to meet the credit
requirements of their customers using existing liquid
assets (shock1). However, the number of impacted
banks was much lower at six, if only a portion (50 per
cent) of undrawn sanctioned working capital was
assumed to be used by the customers (Table 2.7).
Table 2.7: Liquidity risk: Utilisation of undrawn limits/
devolvement of contingencies |
|
System Level |
Impacted Banks |
Size of
Unutilised
Credit
(% to O/s
Advances) |
Liquid
Assets
Ratio
(%) |
Number
of Banks
with Deficit
Liquidity
after shock |
Deposit
Share
(%) |
Asset
Share
(%) |
Liquid assets: Cash, excess CRR, interbank deposits maturing 1-month, excess SLR, ECR |
Baseline |
- |
5.6 |
- |
- |
- |
Shock 1 |
3.2 |
3.5 |
12 |
8.5 |
9.5 |
Shock 2 |
1.4 |
4.4 |
6 |
4.2 |
5.0 |
Shock 3 |
0.4 |
5.0 |
2 |
1.6 |
2.0 |
Shock 4 |
0.2 |
5.1 |
1 |
0.8 |
1.2 |
Shock 5 |
0.4 |
5.0 |
0 |
0.0 |
0.0 |
Note: Liquidity Shocks
Shock 1: Undrawn Sanctioned Limit - Working Capital - Fully Used
Shock 2: Undrawn Sanctioned Limit - Working Capital - Partially Used (50
per cent)
Shock 3: Undrawn Committed Credit Lines to Customers - Fully Demanded
Shock 4: Undrawn Committed Credit Lines to Customers - Partially
Demanded (50 per cent)
Shock 5: Letters of Credit/Guarantees given to Customers - Devolvement
Source: RBI supervisory returns and staff calculations. |
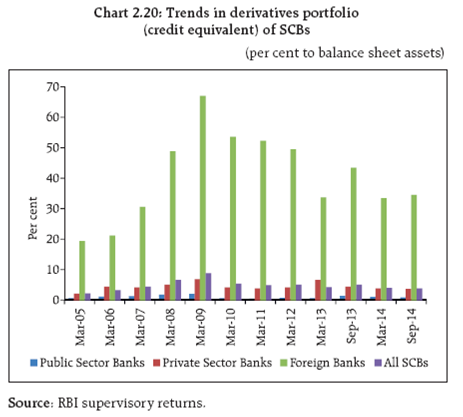
Bottom-up stress tests: Derivatives portfolios of
banks
2.31 The derivatives portfolios of banks have
relatively shrunk in the recent period. The credit
equivalent of the derivatives portfolio is about 4 per
cent of balance sheet assets. However, the size of the
derivatives portfolio was quite significant for foreign
banks at 34 per cent of their balance sheet assets in
September 2014 (Chart 2.20).
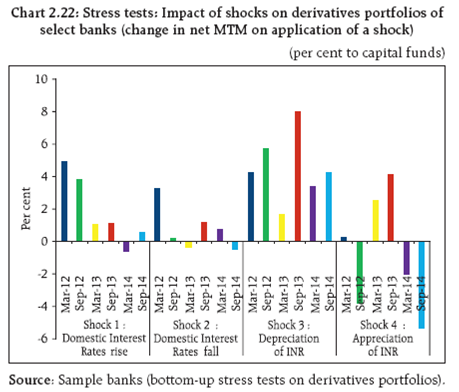
2.32 A series of bottom-up stress tests (sensitivity
analyses) on derivative portfolios were conducted
for select sample banks,21 with the reference date as
on 30 September 2014. The banks in the sample
reported the results of four separate shocks on
interest and foreign exchange rates. The shocks on
interest rates ranged from 100 to 250 basis points, while 20 per cent appreciation/depreciation shocks
were assumed for foreign exchange rates. The stress
tests were carried out for individual shocks on a
stand-alone basis.
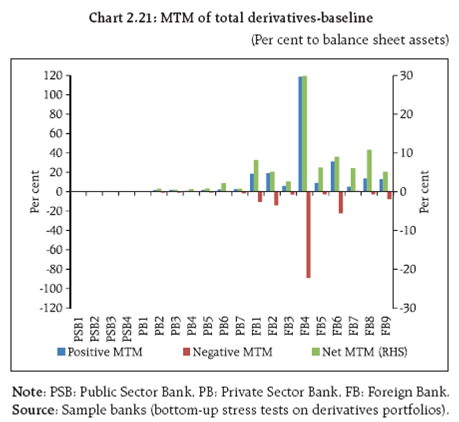
2.33 In the sample, the impact of mark-to-market
(MTM) of the derivatives portfolios for banks as a
proportion to their balance sheet assets as of
September 2014 varied with PSBs and PBs registering
small values, while foreign banks had relatively large
ratios. The banks had positive net MTM in September
2014 (Chart 2.21).
2.34 The stress test results showed that the average
net impact of interest rate shocks on sample banks
was not very high. However, foreign exchange shock
scenarios showed relatively higher impacts on banks
(Chart 2.22).
Regional rural banks
Balance sheet operations
2.35 Regional rural banks (RRBs) maintained stable
growth in assets around 16 per cent during 2013-14.
Major sources of growth were borrowings and capital
infusion by NABARD and sponsor banks on the
liabilities side and loans and advances on the assets
side.
Profitability
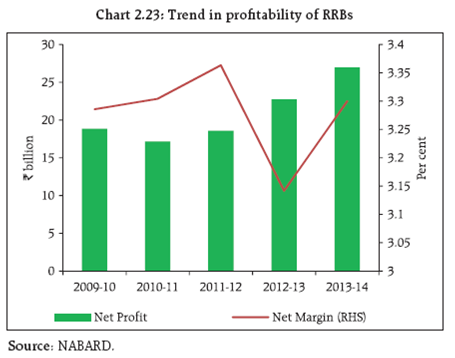
2.36 As per the provisional results, all the 57 RRBs
reported profits in 2013-14 with their net profits going
up by 18.5 per cent during the year. Net margin (net
interest income as per cent of average total assets)
also recovered from previous year (Chart 2.23).
Local area banks
Balance sheet operations and profitability
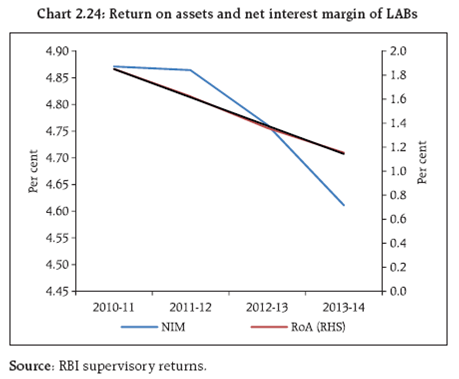
2.37 Four local area banks (LABs) are currently
operational. During 2013-14, they witnessed an asset
growth of 20 per cent. The decline in net profits by
over 21 per cent, can be attributed to growth in
interest expenses outpacing the increase in their
incomes (Chart 2.24).
Urban co-operative banks
Balance sheet operations
2.38 The balance sheets of urban co-operative
banks (UCBs) showed stable growth in 2013-14
(Chart 2.25). Growth in liabilities was driven by an
increase in their other liabilities and deposits.
Following consolidation, the number of UCBs came
down marginally to 1,589 in 2013-14 from over 1,600
a year ago.

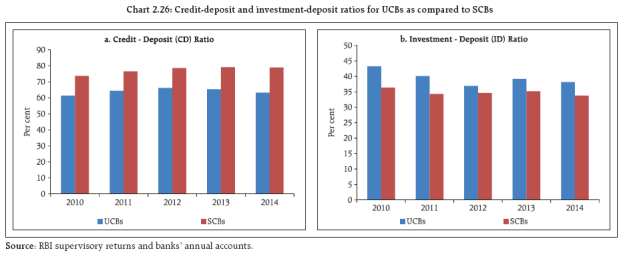
2.39 In 2013-14 UCBs’ C-D ratio declined by about
2 percentage points and the investment-deposit ratio
also showed a small contraction (Chart 2.26).
Profitability
2.40 Net profits of UCBs increased by 31 per cent
during 2013-14 as compared to a decline of 25 per
cent in the previous year. Although the growth in both
income and expenditure decelerated during the year,
the sharp contraction in provisions, contingencies
and taxes resulted in an increase in their net profits.
Consequently, RoA and RoE of UCBs improved to 0.9
per cent and 9.0 per cent, respectively, during the year
from 0.8 per cent and 7.2 per cent during 2012-13.
Scheduled urban co-operative banks
Performance
2.41 At the system level,22 CRAR of scheduled
urban co-operative banks (SUCBs) improved to 12.7
per cent as of September 2014 from 12.4 per cent as
of March 2014. However, at a disaggregated level,
seven banks failed to maintain the minimum required
CRAR of 9 per cent. The asset quality of SUCBs,
measured in terms of GNPAs, deteriorated and their
provision coverage ratio declined significantly
(Table 2.8).
Table 2.8: Select financial soundness indicators of SUCBs |
(per cent) |
Financial Soundness Indicators |
Mar-14 |
Sep-14 |
CRAR |
12.4 |
12.7 |
Gross NPAs to Gross Advances |
5.5 |
7.4 |
Return on Assets (annualised) |
0.7 |
0.9 |
Liquidity Ratio |
35.1 |
35.5 |
Provision Coverage Ratio (PCR) |
71.4 |
53.7 |
Note: 1. Data are provisional.
2. Liquidity Ratio = (Cash + due from banks + SLR
investment) / Total Assets * 100.
3. PCR is compiled as ‘NPA provisions held as per cent of Gross
NPAs’.
Source: RBI supervisory returns. |
Stress tests
Credit risk
2.42 A stress test for assessing credit risk was
carried out for SUCBs using the provisional data as of
September 30, 2014. The impact of credit risk shocks
on CRAR of SUCBs was observed under four different
scenarios.23 The results showed that except under the
extreme scenario (1SD increase in GNPAs which are
classified as loss advances), the system level CRAR of
SUCBs remained above the minimum regulatory
required level, though individually a large number of
banks (28 of the 50 banks under the fourth scenario)
would not be able to meet the required CRAR levels.
Liquidity risk
2.43 A stress test on liquidity risk was carried out
using two different scenarios assuming 50 per cent
and 100 per cent increase in cash outflows in the one
to 28 days time bucket. It was further assumed that
there was no change in cash inflows under both the
scenarios. The stress test results indicate that the
SUCBs will be significantly impacted under stress
scenarios (out of 50 banks, 24 banks under scenario
I and 38 banks under scenario II).
Rural co-operatives24
Short-term rural credit co-operatives
State co-operative banks
Balance sheet operations
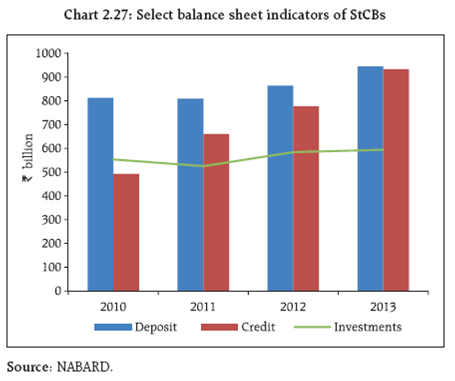
2.44 There was some moderation in the growth of
the overall balance sheet size of state co-operative
banks (StCBs) during 2012-13 to 10.2 per cent from
14.4 per cent in the previous year. This decline was
primarily on account of deceleration in their borrowings, which accounted for about 30 per cent
of their total liabilities, even as deposits registered a
moderate growth (Chart 2.27).
Profitability
2.45 Continuing the trend of the previous year,
net profits of StCBs increased to `11.0 billion during
2012-13 from `6.2 billion in the previous year on the
back of a rise in total income (both interest and noninterest
income) which exceeded the growth in their
total expenditure. The decline in provisions and
contingencies also contributed to the rise in net
profits.
Asset quality
2.46 Although there was a marginal improvement
in the asset quality of StCBs during 2012-13,
the GNPAs ratio still remained high at 6.1 per cent
(Table 2.9).
Table 2.9: Soundness indicators of rural co-operative banks (short-term) |
(amount in ` billion) |
|
StCBs |
DCCBs |
As at end-March |
Percentage Variation |
As at end-March |
Percentage Variation |
2012 |
2013P |
2011-12 |
2012-13P |
2012 |
2013P |
2011-12 |
2012-13P |
1 |
2 |
3 |
4 |
5 |
6 |
7 |
8 |
9 |
A. Total NPAs (i+ii+iii) |
54 |
56 |
-3.7 |
3.9 |
161 |
181 |
8.8 |
12.0 |
i. Sub-standard |
16 |
21 |
-8.6 |
30.1 |
63 |
79 |
6.4 |
25.7 |
|
(29.2) |
(36.6) |
|
|
(38.9) |
(43.6) |
|
|
ii. Doubtful |
24 |
20 |
-7.8 |
-15.3 |
71 |
76 |
13.9 |
7.1 |
|
(43.4) |
(35.4) |
|
|
(44.2) |
(42.2) |
|
|
iii. Loss |
15 |
16 |
10.4 |
6.3 |
27 |
26 |
2.1 |
-6.5 |
|
(27.4) |
(28.0) |
|
|
(17.0) |
(14.2) |
|
|
B. NPA-to-Loans Ratio (%) |
7.0 |
6.1 |
- |
- |
10.2 |
9.9 |
- |
- |
C. Recovery-to-Demand Ratio (%)
(as on 30 June of previous year) |
95.6 |
94.8 |
- |
- |
79.2 |
80.0 |
- |
- |
P : Provisional
Notes: 1. Figures in parentheses are percentages to total NPAs.
2. Percentage variation could be slightly different because absolute numbers have been rounded off to `billion.
Source: NABARD |
District central co-operative banks
Balance sheet operations
2.47 There was a deceleration in growth of the
overall balance sheet of district central co-operative
banks (DCCBs) in 2012-13 which was evidenced by
decline in asset growth to 13.3 per cent during the
year from 14.5 per cent during 2011-12.
Profitability
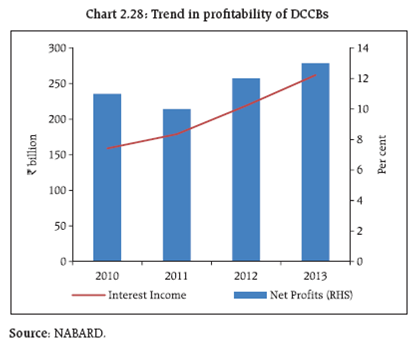
2.48 DCCBs reported decline in growth in net
profits in 2012-13 mainly on account of moderate
increase in both interest as well as non-interest
income (Chart 2.28). This is despite that provisions
and contingencies witnessed a sharp decline during
the year.
Asset quality
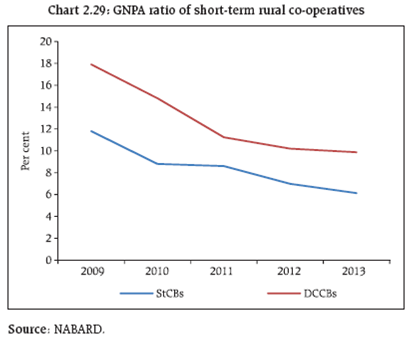
2.49 The reduction in provisions of DCCBs was
primarily on account of an improvement in asset
quality with a decline in the overall GNPA ratio from
10.2 per cent to 9.9 per cent between 2011-12 and
2012-13 (Chart 2.29). Notwithstanding this
improvement, the high GNPA ratio for DCCBs
remained a matter of concern.
Primary agricultural credit societies
Balance sheet operations
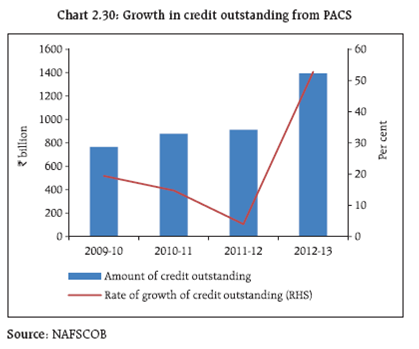
2.50 During 2012-13 an analysis of select indicators
on the balance sheets of primary agricultural credit
societies (PACS) suggests certain positive changes.
Their owned funds increased with lower growth in
borrowings. Loans outstanding during the year also
witnessed higher growth (Chart 2.30).
Profitability
2.51 As of March 2013, about 41 per cent of all the
PACS in the country reported losses, while about 46
per cent were making profits. There was a concentration
of loss making PACS in the eastern region (Chart 2.31).
Long-term rural credit co-operatives
State co-operative agriculture and rural
development banks
Balance sheet operations
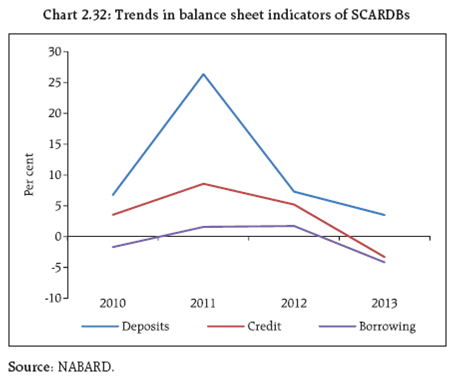
2.52 There was continued deceleration in balance
sheet growth of state co-operative agriculture and
rural development banks (SCARDBs) in 2012-13; this
was contributed to by all major components on the
liabilities and assets sides (Chart 2.32).
Profitability
2.53 Apart from the continued decline in their
asset sizes, SCARDBs also incurred losses to the tune
of `1.0 billion in 2012-13. These losses were primarily
on account of large provisioning towards loan losses.
Asset quality
2.54 There was a decline in the asset quality of
SCARDBs in 2012-13 taking their GNPA ratio to a high
of 36 per cent (Table 2.10).
Table 2.10: Soundness indicators of rural co-operative banks (long-term) |
(in ` billion) |
Item |
SCARDBs |
PCARDBs |
As at end- March |
Percentage Variation |
As at end-March |
Percentage Variation |
2012 |
2013P |
2011-12 |
2012-13P |
2012 |
2013P |
2011-12 |
2012-13P |
1 |
2 |
3 |
4 |
5 |
6 |
7 |
8 |
9 |
A. Total GNPAs (i+ii+iii) |
64 |
68 |
7.7 |
5.1 |
46 |
46 |
-5.0 |
-0.1 |
i. Sub-standard |
30 |
28 |
1.4 |
-4.4 |
21 |
20 |
-14.5 |
-4.3 |
|
(46.1) |
(41.9) |
|
|
(45.3) |
(43.5) |
|
|
ii. Doubtful |
34 |
38 |
13.8 |
10.2 |
25 |
26 |
4.2 |
3.8 |
|
(53.6) |
(56.2) |
|
|
(53.9) |
(56.1) |
|
|
iii. Loss |
0.2 |
1.2 |
8.3 |
603.0 |
0.3 |
0.2 |
58.1 |
-35.0 |
|
(0.3) |
(1.8) |
|
|
(0.7) |
(0.5) |
|
|
B. GNPA-to-Loans Ratio (%) |
33.1 |
36.0 |
- |
- |
36.7 |
37.1 |
- |
- |
C. Recovery-to-Demand Ratio (%) (as on 30 June of previous year) |
40.2 |
32.3 |
- |
- |
47.3 |
42.7 |
- |
- |
P: Provisional
Note: 1. Figures in parentheses are percentages to total GNPAs.
2. Percentage variation could be slightly different because absolute numbers have been rounded off to `billion.
Source: NABARD. |
Primary co-operative agriculture and rural development banks
Balance sheet operations
2.55 The asset growth of primary co-operative
agriculture and rural development banks (PCARDBs)
further declined to 1.7 per cent in 2012-13 from 5.5
per cent during the previous year. These institutions
also showed weak growth in owned funds (including
capital and reserves) as well as negative growth in
credit outstanding during the year.
Profitability
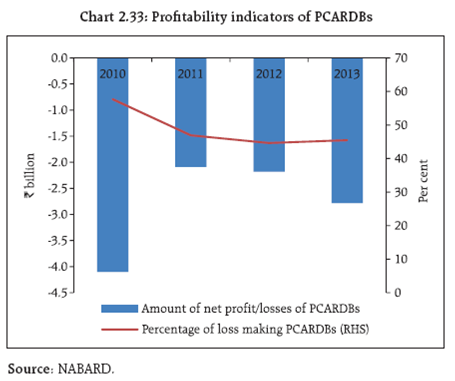
2.56 The number of loss making PCARDBs
marginally increased to 318 during 2012-13
(Chart 2.33). On aggregate basis, PCARDBs reported
losses in 2012-13.
Asset quality
2.57 The asset quality of PCARDBs continued to
be fragile with their GNPA ratio increased to 37 per
cent in 2012-13 (Table 2.10).
Non-banking financial companies
2.58 As of March 2014, there were 12,029 NBFCs
registered with the Reserve Bank, of which 241 were
deposit-accepting (NBFCs-D) and 11,788 were nondeposit
accepting (NBFCs-ND). NBFCs-ND with assets
of `1 billion and above had been classified as
Systemically Important Non-Deposit accepting NBFCs
(NBFCs-ND-SI)25 since April 1, 2007 and prudential
regulations such as capital adequacy requirements
and exposure norms along with reporting requirements
were made applicable to them. From the standpoint
of financial stability, this segment of NBFCs assumes
importance given that it holds linkages with the rest
of the financial system (further discussed in Chapter
III, paras 3.21 to 3.23).
Performance
2.59 During 2013-14, the overall balance sheet of
NBFCs-ND-SI expanded by 9.5 per cent (Table.2.11).
Loans and advances (a major component on the assets
side) increased by 11.2 per cent. Total borrowings,
which constituted more than two-third of their
liabilities, increased by 9.8 per cent.
Table 2.11: Consolidated balance sheet of NBFCs-ND-SI
(As of March) |
(in ` billion) |
Item |
2013 |
2014P |
Percentage
Variation |
1. Share Capital |
647 |
695 |
7.4 |
2. Reserves & Surplus |
2,276 |
2,457 |
8.0 |
3. Total Borrowings |
8,104 |
8,902 |
9.8 |
4. Current Liabilities & Provisions |
574 |
647 |
12.8 |
Total Liabilities/ Assets |
11,601 |
12,701 |
9.5 |
1. Loans & Advances |
7,600 |
8,455 |
11.2 |
2. Hire Purchase Assets |
805 |
896 |
11.3 |
3. Investments |
1,945 |
2,075 |
6.6 |
4. Other Assets |
1,250 |
1,276 |
2.1 |
Memo Items |
1. Capital Market Exposure (CME) |
885 |
1,029 |
16.4 |
2. CME to Total Assets (per cent) |
7.6 |
8.1 |
|
3. Leverage Ratio |
3.0 |
3.0 |
|
P: Provisional
Note: 1. Data presented here pertain to 420 entities which account for
more than 95 per cent of the total assets of the NBFCs-ND-SI
sector.
2. Percentage figures are rounded-off.
Source: RBI supervisory returns. |
2.60 The financial performance of NBFCs-ND-SI
improved during 2013-14 as their net profit to total
income increased from 18.3 per cent to 20.2 per cent.
As a result, return on assets rose to 2.3 per cent as of
March 2014 from 2.0 per cent a year ago
(Table 2.12).
Table 2.12: Financial performance of NBFCs-ND-SI sector
(As of March) |
(in ` billion) |
Items |
2013 |
2014 P |
1. Total Income |
1,272 |
1,436 |
2. Total Expenditure |
1,039 |
1,147 |
3. Net Profit |
233 |
290 |
4.Total Assets |
11,601 |
12,701 |
Financial Ratios (per cent) |
(i) Net Profit to Total Income |
18.3 |
20.2 |
(ii) Net Profit to Total Assets |
2.0 |
2.3 |
P: Provisional.
Source: RBI supervisory returns. |
Asset quality
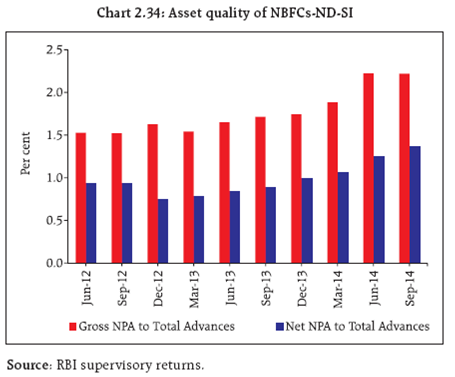
2.61 The asset quality of the NBFCs-ND-SI sector
has been deteriorating since the quarter ended March
2013 (Chart 2.34). The Reserve Bank issued separate
guidelines for both banks and NBFCs with an objective
of mitigating the stress due to their NPAs. NBFCs were
advised to identify incipient stress in their accounts
by creating a sub-asset category viz. ‘Special Mention
Accounts’ (SMA), which was further divided into three
sub-categories (viz., SMA-0, SMA-1 and SMA-2) based
on the extent of principal or interest payment overdue
as also the weakness of their accounts. They were also
directed to report relevant credit information to the
Central Repository of Information on Large Credits
(CRILC).
Capital adequacy
2.62 As per the guidelines, NBFCs-ND-SI
are required to maintain a minimum capital
consisting of Tier-I26 and Tier-II capital, of not less
than 15 per cent of their aggregate risk-weighted
assets. As of March 2014, by and large, the capital
adequacy position of the NBFCs-ND-SI remained
comfortable and was well above prudential norms.
Nevertheless, CRAR of the NBFCs-ND-SI slipped from
the peak of 29.0 per cent as of September 2013 to
27.2 per cent as of March 2014. It subsequently
recovered to 27.8 per cent by the quarter ended
September 2014 (Chart 2.35).

Profitability
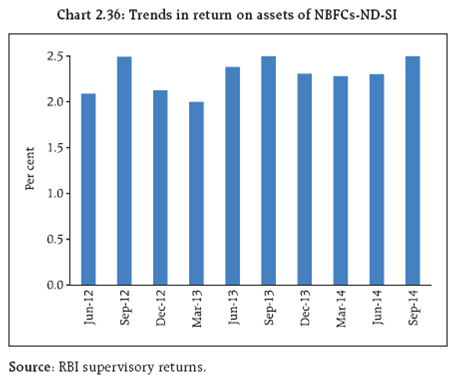
2.63 RoA of NBFCs-ND-SI increased to 2.5 per cent
in September 2014 after remaining at around 2.3 per
cent in previous three quarters (Chart 2.36).
Stress tests: Credit risk
System level
2.64 A stress test on credit risk for NBFC sector27 as
a whole for the period ended September 2014 is carried
out under three scenarios: (i) GNPA increased by 0.5
SD (ii) GNPA increased by 1 SD and (iii) GNPA is
increased by 3 SD. The results suggest that under first
two scenarios, CRAR of the NBFC sector is unaffected
while in the third scenario, it declines to 23.0 per cent
from its level of 23.6 per cent.
Individual NBFCs
2.65 A stress test on credit risk for individual
NBFCs is also conducted for the same period under
the same three scenarios. The results indicate that
under scenarios (i) and (ii) around 1.6 per cent of the
companies will not be able to comply with the
minimum regulatory capital requirements of 15 per
cent, while 4.1 per cent of companies will not be able
to comply with the minimum regulatory CRAR norm
under third scenario.
Interconnectedness
Trends in the interbank market
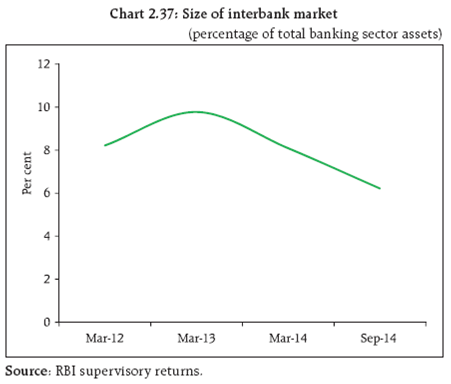
2.66 Banks’ dependence on the interbank market
for liquidity as well as long term uses reveals certain
noteworthy trends. While the size of the market in
absolute terms has hovered around a range of `6 to
8 trillion over the last ten quarters, the market as a
percentage of total banking sector assets has
witnessed a steady decline (Chart 2.37).
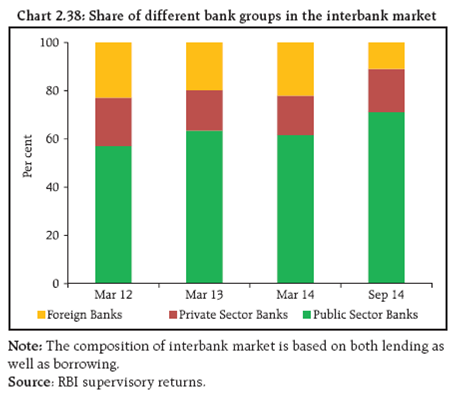
2.67 PSBs continue to be the biggest players in the
market with a share of over 70 per cent as of
September 2014. The share of foreign banks in the
interbank market, however, has declined considerably
since March 2012 (Chart 2.38).
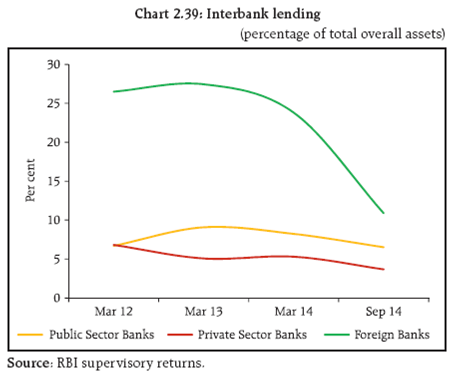
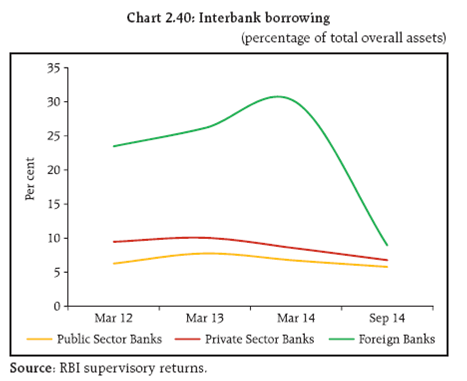
2.68 The ratio of lending and borrowing28 in the
interbank market by each bank group to its respective
total assets is an important indicator of business
models employed by a particular group. Foreign banks,
which had the highest ratios in this respect, have
shown a sharp fall in the recent past (Charts 2.39
and 2.40).
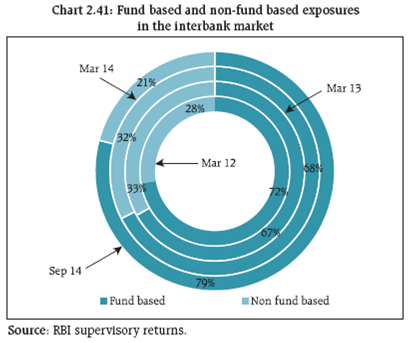
2.69 The interbank market continued to be
predominantly fund based (close to 80 per cent of
the exposures) as of September 2014 (Chart 2.41).
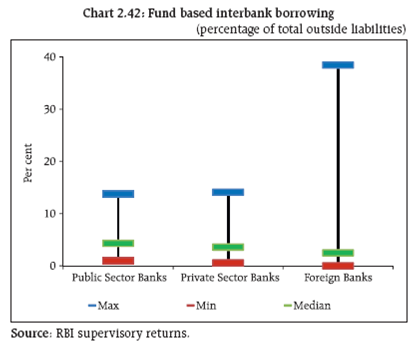
The banking sector as a whole had raised nearly 6
per cent of its total outside liabilities from this market
(Chart 2.42).
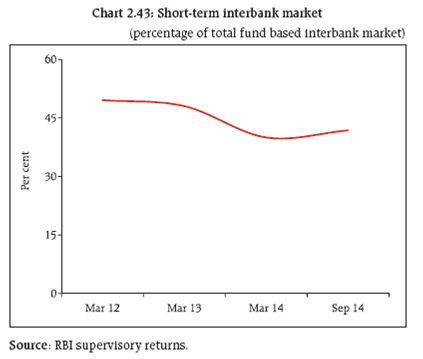
2.70 A substantial portion of fund-based exposures
in the interbank market are short term in nature.
Certificates of deposit (CDs) issued by banks are a
major contributor in this area. The size of the short
term interbank market as a percentage of the total fund-based interbank market stood at over 41 per cent
as of September 2014 (Chart 2.43).
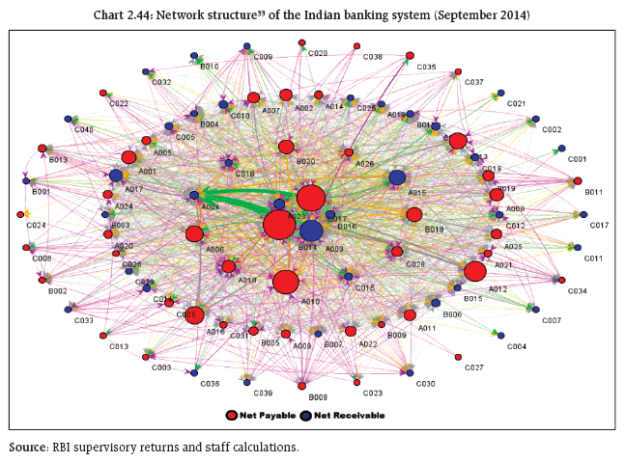
Network structure of the banking system
2.71 The banking system continues to be reasonably
connected with the connectivity ratio,29 which is a
simple estimate of interconnectedness, consistently
remaining over 20 per cent in the last three years. The
network structure30 of the banking system, which is
tiered31 in nature, reveals that the most connected
banks have been the same for the last two years.
Further, the bank which is systemically the most
important32 continues to be the same. PSBs are the
biggest net lenders while private banks are the biggest
net borrowers in the interbank market (Chart 2.44).
Interconnectedness in the financial system
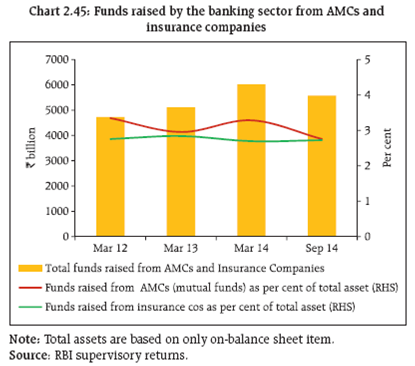
2.72 A better perspective of the network structure
of the Indian financial system emerges when an
analysis of the interbank market is extended to
include the other two most important sectors: asset
management companies (AMCs) managing mutual
funds and insurance companies.34 The size of this
enlarged market as of September 2014 stood at over
`12 trillion which is roughly double the size of the
interbank market. Both mutual funds and insurance
companies are the biggest providers of funds in this
system, while the PSBs emerge as the largest receiver
of funds. Total funds raised by the banking sector
from mutual funds and insurance companies was to
the tune of `5.5 trillion (Chart 2.45).
2.73 When viewed from a different angle, AMCs’
and insurance companies’ investments in the banking
sector as a percentage of their respective assets under
management (AuM) were also sizeable.35 The interconnectedness that exists between different
sectors in the financial system does expose the system
to contagion risks in the event of stress scenarios.
Irrespective of this, good interconnectedness amongst
financial institutions is a necessary evil (Box 2.1).
Box 2.1: Interconnectedness in the Financial System: How Vital and How Critical
The post-crisis experience of many features in the
financial system which were not given due attention
earlier, led to the calibration of many new regulatory
standards. More notably, in addition to keeping a tab
on individual institutions, the importance of a macro
view of the financial system was acknowledged. Among
the many structures that emerged was ‘Too Connected
to Fail (TCTF)’. The US experience of one institution
going bust leading to the failure of a dozen others
due to common exposures, led the world to come
alive to the phenomenon of ‘interconnectedness’ that
exists between financial institutions. Subsequently,
interconnectedness has been accepted by standard
setting bodies as one of the parameters for identifying
systemically important financial institutions.
Why then are network models being increasingly used
across the world to assess interconnectedness among
financial institutions? The answer lies in the fact that
financial networks are complex and adaptive systems. They are complex because the interconnections involved
among financial institutions are massive and they are
adaptive because while individual institutions in the
system always want to be in an optimal position, they
are not fully informed. Such complex adaptive systems
have the potential to amplify losses manifold during
crisis events. This is exactly what happened during
the Lehman fallout when many institutions shut their
doors and refused liquidity to institutions just because
they were suspected of being ‘infected’.
To begin with, network models assist in understanding
the structure and pattern of connections in a particular
system. If the institutions with high centrality scores
are also heavy net borrowers in the system, then there
might be potential stability issues in the event of any
such institution facing distress. These sort of indications
can provide valuable inputs to a regulator in reassessing
the available redundancies in the system and initiate
counteractive measures.
Contagion analysis
2.74 A contagion analysis36 is conducted to
estimate potential loss to the banking system triggered
by either one or several banks. Though such an
analysis may appear hypothetical, it is a good indicator
about the toxicity of banks. The results further
provide an additional input in identifying systemically
important banks. Three types of contagion analysis
are generally carried out: solvency contagion, liquidity
contagion and joint liquidity-solvency contagion.
Solvency contagion is typical to distress generated by
the failure of a bank which is a net borrower in the
financial system. On the other hand, liquidity
contagion is generated by a net lender bank. In the
actual world, both solvency and liquidity contagion
are likely to emanate simultaneously due to the
obvious dynamics present in a financial system.
2.75 An analysis of the top five connected banks
as trigger banks reveals that the banking system could
potentially lose close to 50 per cent of its total Tier-I
capital under the joint solvency-liquidity condition in the event of a particular bank triggering a contagion
(Table 2.13). It may be noted that Bank E, which does
not cause substantial solvency or liquidity contagion
on a standalone basis, does have a massive impact
under the joint scenario. This is because Bank E is
causing distress to one particular bank that in turn is
magnifying the contagion. This underscores the
importance of monitoring not just the
interconnectedness, but also the counterparties and
magnitude of exposure involved in the connection.
Table 2.13: Contagion triggered by the top-5 connected banks in the system |
Trigger Banks |
Percentage loss of total Tier-I capital of the banking system |
Solvency Contagion |
Liquidity Contagion |
Joint Solvency-Liquidity Contagion |
Bank A |
3.4 |
13.7 |
37.1 |
Bank B |
0.7 |
11.2 |
49.5 |
Bank C |
5.5 |
0.9 |
42.5 |
Bank D |
0.5 |
2.1 |
2.7 |
Bank E |
4.4 |
3.3 |
47.5 |
Source: RBI supervisory returns and staff calculations. |
|