Letter of Transmittal March 1, 2015 Dr. Raghuram G. Rajan
Governor
Reserve Bank of India
Central Office
Mumbai 400 001 Sir Report of the Internal Working Group (IWG) to Revisit the Existing Priority Sector Lending Guidelines We hereby submit the Report of the Internal Working Group constituted to revisit the existing priority sector lending guidelines and suggest revised guidelines in alignment with the national priorities as well as financial inclusion goals of the country. On behalf of members of the Working Group as well as on my own behalf, we sincerely thank you for entrusting this important responsibility to us as well as for all the guidance and support we have received from you at all stages. With kind regards Yours sincerely, Sd/-
(Lily Vadera) | | | | | | | Sd/-
(R.N. Dash) | Sd/-
(Reena Banerjee) | Sd/-
(R.K. Moolchandani) | | | | | Sd/-
(Abhiman Das) | Sd/-
(P. Manoj) | Sd/-
(Pallavi Chavan) |
Acknowledgements The Working Group expresses its gratitude for the guidance it received from the Hon’ble Governor Dr. Raghuram G. Rajan who evinced a keen interest and deep insight on the subject. It also expresses its gratitude to Deputy Governors, Shri Harun R. Khan, Dr Urjit R. Patel, Shri R. Gandhi and Shri S.S. Mundra, for sharing their rich perspective and understanding of the subject as also Executive Directors, Shri B. Mahapatra (since retired) and Dr. Deepali Pant Joshi under whose auspices the Group worked. The Working Group benefited from the inputs provided by Shri A. Udgata, PCGM, FIDD, Smt. Madhavi Sharma, CGM, FIDD, RBI; Shri H. R. Dave, DMD, NABARD; Shri S. K. Bansal, CGM, NABARD and his team; Prof. M.S. Sriram, IIM, Bangalore; Dr. N. R. Prabhala, CAFRAL; Dr. K. Subramanian, ISB; Shri N. Srinivasan, Retd. CGM, NABARD and Shri Vinay Baijal, Retd. CGM, RBI. The Working Group also acknowledges the suggestions and contributions of the various banks with whom discussions were held. The Working Group thanks Smt. Ranjeeta Choudhary, Shri Vinay Jain, Smt. Sabeeta Badkar and Shri Subhash Kaspale, Department of Banking Regulation, for the administrative and logistical support provided.
Executive Summary 1. In the past, the objective of priority sector lending (PSL) has been to ensure that vulnerable sections of society get access to credit and there is adequate flow of resources to those segments of the economy which have higher employment potential and help in making an impact on poverty alleviation. Thus, the sectors that impact large sections of the population, the weaker sections and the sectors which are employment-intensive such as agriculture and micro and small enterprises were included in priority sector. India in her quest for inclusive growth has experimented with a variety of policy mix since gaining independence in 1947. Policymaking, however, evolves based on experience gained in success and failure of past measures, and reflects changing priorities over time. The Indian economy has not only undergone a structural transformation but has also been increasingly integrated into the global economy. The national priorities have changed over the last four decades, as India has moved up to middle income level status. The emphasis now, over and above lending to vulnerable sections, is to increase employability, create basic infrastructure and improve competitiveness of the economy, thus creating more jobs. 2. Hence, there is a need to ensure adequate allocation of credit to emerging priority sectors. The issue regarding the need for continuance of priority sector prescriptions was discussed with a representative section of bankers and some of the other stakeholders to get a wider perspective. A general perception that emerged was that if the prescriptions under PSL had not been there, the identified sectors would not have benefited to the extent they have and hence, there is a need to continue with priority sector prescriptions. However, the composition of the priority sector needs a re-look and review to re-align it with the national priorities and financial inclusion goals of the country. 3. The Working Group, therefore, felt that while revisiting the extant guidelines on priority sector, the focus will be on giving a thrust to areas of national priority as well as inclusive growth. In this backdrop, the Working Group has looked at the following sectors for priority sector status viz., agriculture, Micro, Small and Medium Enterprises (MSMEs), exports, social infrastructure, renewable energy, educational loans and housing. Overall Priority Sector Target 4. In view of the continued need for making credit available to various priority sectors on grounds of growth and equity, the Working Group recommends that the target for lending to the redefined priority sector may be retained at 40 per cent of ANBC or Credit Equivalent of Off-Balance Sheet Exposure (CEOBE), whichever is higher, for all scheduled commercial banks uniformly. All foreign banks (irrespective of number of branches they have) may be brought on par with domestic banks and the same target/ sub-targets may be made applicable to them. Foreign banks with 20 and above branches may be given time up to March 2018 in terms of extant guidelines and submit their revised action plans. Other foreign banks i.e. with less than 20 branches, may be given time up to March 2020 to comply with the revised targets as per action plans submitted by them and approved by Reserve Bank. 5. In view of the need for efficiency in priority sector lending, the Working Group has made certain recommendations which include introduction of Priority Sector Lending Certificates (PSLCs). These instruments would provide a mechanism for banks to specialize in certain segments of priority sector and leverage on their comparative advantage. Agriculture 6. The Working Group has attempted to focus on ‘credit for agriculture’ rather than ‘credit in agriculture’. While the Working Group recommends retaining the agriculture target of 18 per cent, the approach and thrust has been re-defined to include (i) Farm Credit (which will include short-term crop loans and medium/long-term investment credit to farmers) (ii) Agriculture Infrastructure and (iii) Ancillary Activities and on-lending as defined in Chapter 4. 7. Considering the significant share of landholdings of small and marginal farmers and their contribution to the agriculture sector, the Working Group recommends a sub-target of 8 per cent of ANBC for lending to them, which is to be achieved in a phased manner within a period of two years i.e., achieve 7 per cent by March 2016 and 8 per cent by March 2017. The remaining 10 per cent may be given to other farmers, agri-infrastructure and ancillary activities. Perceiving the huge need to create rural infrastructure and processing capabilities, the Working Group decided not to put any caps on the loan limits for lending for agri-infrastructure and agri-processing. 8. The Working Group has designed a framework for a periodic reset of the agricultural targets. It has recommended that while the agriculture lending target should be retained at 18 per cent of ANBC, the designed framework can be followed for resetting of this target every three years depending on the function of three variables viz., contribution of agriculture to GDP, employment and number of credit accounts. Micro, Small and Medium Enterprises 9. Presently, credit extended to micro and small enterprises counts for priority sector. The Working Group recommends extending PSL status to Medium Enterprises (MEs) in addition to the Micro and Small Enterprises (MSEs). While all MEs (Manufacturing) may be included under PSL, MEs (Service) with credit limit up to Rs.10 crore may be eligible to qualify for PSL. 10. To ensure that the smallest segment within the MSME sector i.e. micro enterprises, is not crowded out with the inclusion of the medium enterprises, the Working Group recommends a target of 7.5 per cent of ANBC for lending to micro enterprises to be achieved in stages i.e. achieve 7 per cent by March 2016 and 7.5 per cent by March 2017. 11. Further as the MSMED Act 2006 does not provide for any sub-categorisation within the definition of micro enterprise and a separate sub-target for micro enterprises has been suggested, the Working Group recommends that the extant provisions of further bifurcating micro enterprises may be dispensed with. 12. To ensure that MSMEs do not remain small and medium units merely to be eligible for priority sector status, the Working Group recommends that the priority sector lending status may stay with them for up to three years after they grow out of the category of MSMEs. 13. It was announced in the Union Budget 2014-15 that the definition of MSME will be reviewed to provide for a higher capital ceiling. In the light of the Budget announcement, the Working Group recommends that the matter may be pursued with the Government. Any change in definition will automatically apply to PSL norms from the date it is notified. Exports 14. Given the importance of exports in the economy and to give focused attention to export finance within the priority sector lending, the Working Group recommends carving out a separate category of export credit under priority sector. The Working Group recommends that incremental export credit from a base date (i.e. the outstanding export credit as on the date of reckoning minus outstanding export credit as on the base date) to units having turnover of upto Rs.100 crore having sanctioned credit limit of upto Rs.25 crore from the banking system may be included in priority sector. The export credit under priority sector may have a ceiling of 2 percent of ANBC in order to ensure that other segments are not crowded out. Education 15. The Working Group endorses the need for continuation of including education loans, including loans for vocational courses, under priority sector. The recent trends in education loans, however, suggested a concentration of educational loans in the size class of up to Rs. 5 lakh, notwithstanding the extant ceilings of Rs.10/20 lakh. Taking this into account, the Working Group recommends that an amount of Rs.10 lakh for education loans per borrower, irrespective of the sanctioned limit be considered eligible under priority sector. As the extant guidelines provide for loans upto Rs.20 lakh for study abroad, all such existing loans may continue under priority sector till the date of maturity. Housing 16. With a view to ensure that the credit flows to needy persons for affordable housing, it is recommended that the overall cost of the dwelling unit in the metropolitan centre and at other centres should not exceed Rs.35 lakh and Rs. 25 lakh respectively. Further, with a view to align it with guidelines on Loan to Value Ratio (presently 80% for loans above Rs.20 lakh) prescribed by the Reserve Bank, it recommends that priority sector limits be modified and fixed at Rs. 28 lakh in metropolitan centres and Rs. 20 lakh in other centres. 17. The recent guidelines allow exemption from ANBC for long-term bonds for lending to housing loans with loan up to Rs.50 lakh. As the inclusion of priority sector housing loans which are backed by the long term bonds, would result in ‘double counting’ on account of exemption from ANBC, the Working Group recommends that banks should either include housing loans to individuals up to the prescribed ceiling under priority sector or take benefit from exemption from ANBC, but not both. All other existing guidelines regarding housing loans may be continued. Weaker Sections 18. So that, vulnerable sections of the society get a reasonable share of bank credit, the Working Group, recommends that existing categories and the target of 10 per cent of ANBC for loans to weaker sections may continue as per extant guidelines with some enhancement in the existing loan limits. Social Infrastructure 19. Given the importance of social infrastructure for development and its impact on ultimate credit absorption in rural and urban areas, the Working Group recommends that financing for building infrastructure for certain activities viz., schools and health care facilities; drinking water facilities and sanitation facilities in Tier II to Tier VI centres, with population less than 1 lakh, may be treated as a separate category under priority sector, subject to a ceiling of Rs.5 crore per borrower. Renewable Energy 20. The Working Group recommends that bank loans up to Rs. 10 crore to borrowers other than households, for purposes like solar-based power generators, biomass-based power generators, wind mills and micro-hide plants and for purposes like non-conventional energy-based public utilities viz., street lighting systems, remote village electrification, etc. be included under priority sector. For household sector, the loan limit may be Rs. 5 lakh. Review of Limits 21. The Working Group recommends that the various loan limits recommended should be reviewed once in three years. In addition, based on the experience gained, the targets and sub-targets recommended may also be revisited. Monitoring and Reporting 22. Presently, PSL compliance is monitored on the last day of March each year. The Working Group recommends that more frequent monitoring of PSL compliance by banks may be done. To start with, it may be done on ‘quarterly’ basis. The Working Group recommends that PSL shortfall should be worked out based on the average shortfall for the four quarters during the financial year. The base for determining the target achievement for each quarter end i.e. ANBC should be as of the corresponding date of the previous year so that banks get sufficient time for planning and achieving the targets, and seasonalities are taken care of. 23. The reporting format for PSL may be modified to capture the achievement of banks on the PSL targets /sub- targets recommended by the Working Group. While monitoring the lending to small and marginal farmers, it may have to be ensured that the format captures lending to small and marginal farmers directly as well as through SHGs/JLGs, farmer producer organizations, etc. To ensure accurate reporting to the Reserve Bank, banks would have to ensure that they build a robust database on PSL. Priority Sector Lending Certificates (PSLCs) 24. The Working Group recommends introduction of PSLCs to enable banks to meet their PSL requirements and allow leveraging of their comparative advantage. The model on PSLCs envisages that banks will issue PSLCs that can be purchased at a market determined fee on an electronic platform. This purchase will give the buyer a right to undershoot his PSL achievement for the stated amount of PSLC. PSLCs would count specifically towards PSL achievement and thus would be sector/ sub-sector specific where particular targets have been mandated. It would not be necessary for an issuer to have underlying assets on his books at the time of issue of PSLC or for the buyer to have a shortfall in obligation of that amount. The issuer could assess possible credit achievement during the year and issue PSLCs of the estimated surplus. However, as the PSLCs could be issued without an underlying, there is a risk that the issuing bank may overestimate its achievement and fall short on reporting date, thereby subjecting itself to penalties. Therefore, no bank can issue PSLCs of more than 50 percent of last year’s PSL achievement or excess over the last year’s PSL achievement, whichever is higher. However, there would be no limit on the amount of PSLCs that could be purchased for achievement of various targets. 25. The buyer could also estimate possible credit shortfall without the need for waiting till the time of such shortfall or he could also buy PSLCs with a view to trading it when premiums are higher. This would add to efficiency in meeting targets and create a deep and liquid forward market. PSLCs envisage the separation of transferring priority sector obligations from the credit risk transfer and refinancing aspects. While the PSLCs will be sold, the loans would continue to be on the books of the original lender. If the loans default, for example, no loss would be borne by the certificate buyer. As stated in the Report of the Committee on Financial Sector Reforms, the merit of a scheme of this nature is that it would allow the most efficient lender to provide access to the poor, while finding a way for banks to fulfil their norms at a lower cost. Essentially, the PSLCs will be a market-driven interest subsidy to those who make priority sector loans. 26. In the future, the Reserve Bank may intervene in the market for PSLCs to encourage further lending to a particular sector. Non-Achievement of Targets 27. With the inclusion of new sectors and introduction of PSLCs, banks would be better placed to achieve the targets and sub-targets. However, in case of shortfall, the prevailing penal provisions would continue. The need for more stringent measures such as imposition of monetary penalties could be considered either independently or in combination with the existing provisions after a period of three years of operationalisation of the PSLC market and based on the performance of banks in achievement of targets. Improving the credit culture 28. The Working Group observed that it would also be necessary to look at the credit delivery mechanism to ensure that credit reaches the intended beneficiaries and misuse in the form of availing of credit from multiple institutions does not take place. The Working Group, therefore, recommends that, to be eligible for PSL status, any borrowal account, including that to individual members of SHGs and JLGs, should be reported to one of the credit bureaus. The information should also capture the borrower’s Aadhaar number which will help in identification of the borrower. The deadline for this may be linked to that of UIDAI deadline for completion of Aadhaar enrolment. A system of information sharing may be put in place between the credit bureaus.
Chapter 1 Introduction 1.1 The concept of using directed credit to channelise resources to areas whose development was seen as national priority originated at a meeting of the National Credit Council held in July 1968, and was further formalised into the priority sector concept in 1972. Since then, directed credit through the priority sector dispensation has continued as a major public policy intervention to finance areas which might otherwise be financially underserved as also to achieve Plan targets. 1.2 In the decades since the vision of priority sector first took shape, the structure of the Indian economy and the contribution by various sectors to GDP and the demographic profile has changed significantly. These emerging realities have also shaped our perception of national priority and these must reflect in any definition of priority sector. Going forward, the country’s vision of equitable growth and development will require investment in areas such as infrastructure, exports, micro small and medium enterprises, non- conventional energy, education, health, etc. 1.3 In view of the above, an Internal Working Group, to revisit the existing priority sector lending guidelines and suggest revised guidelines in alignment with the national priorities as well as financial inclusion goals of the country, was set up vide Governor’s orders dated July 02, 2014. The Terms of Reference of the Working Group are as under: -
To revisit the priority sector lending targets/classification; whether the purpose of the priority sector has been achieved by way of inclusion and access needs of the weak and vulnerable sections of the population and the neglected sectors of the economy; -
Whether the priority sector lending should encompass certain areas of national priorities, while at the same time examine the need to continue with all the existing items under PSL; -
To examine whether there is a need for having sub-limits within the prescribed overall PSL limit. To devise criteria for fixing the targets under priority sector lending; -
To suggest ways on how to achieve the priority sector targets in the most effective way; and -
To suggest better measures to be taken in case of under achievement of the priority sector targets. 1.4 The members of the Working Group are: -
Smt. Lily Vadera, Chief General Manager, DBR, Central Office -
Shri R.N.Dash, General Manager, FIDD, Hyderabad Office -
Smt. Reena Banerjee, General Manager, DBR, Central Office -
Shri R. K. Moolchandani, General Manager, FIDD, Central Office -
Dr. Abhiman Das, Director, DSIM -
Shri P. Manoj, Deputy General Manager, FIDD, Central Office -
Dr. Pallavi Chavan, Assistant Adviser, DEPR 1.5 The progress of the Working Group was monitored by Executive Directors Shri B Mahapatra (since retired on August 31, 2014) and Dr. Deepali Pant Joshi. 1.6 The Report is structured as follows: Chapter 2 discusses the approach of the Working Group and delineates the broad contours and framework within which the Group shaped its recommendations. Chapter 3 analyses the impact of priority sector lending on inclusion/serving the vulnerable/neglected sectors of the economy. Chapter 4 details the recommended future approach for priority sector lending including targets/sub-targets keeping in mind national priorities as well as non-achievement of targets. Chapter 5 discusses the concept of Priority Sector Lending Certificates (PSLCs) as an alternative and efficient method of achievement of targets.
Chapter 2 Approach of the Working Group 2.1 The Priority Sector Lending (PSL) programme of India is one among the longest serving directed lending programmes in the world. The origin of the PSL programme can be traced back to the Credit Policy for 1967-68, when public sector banks were advised to increase their involvement in financing of certain sectors identified as priority sectors viz., agriculture and small-scale industries in line with the national economic policy. Priority sector lending in its present form was introduced in 1980, when it was also made applicable to private sector banks and a sub-target was stipulated for lending to the “weaker” sections of the society within the priority sector. Over time, there have been changes in overall definition of PSL as newer sectors were added to the list with an attempt to realign PSL with the changing economic realities. There were also attempts to redefine the contours of many of the identified sectors. 2.2 The Committee that in many ways offered the blue print for economic reforms in India in the early 1990s, namely the Committee on Financial Sector Reforms of 1991 [Chairman: Shri M. Narasimham (popularly known as Narasimham Committee I)] had recommended reduction followed by phasing out of PSL requirements. Notwithstanding this recommendation, the PSL dispensation continued due to various economic and social considerations, as noted in the Committee on Banking Sector Reforms of 1998 [Chairman: Shri M Narasimham (Narasimham Committee II)]. However, the recommendation made by Narasimham Committee I and later upheld by Narasimhmam Committee II, of having a focus on various employment generating sectors as part of PSL has influenced the PSL policy in the later years. The Report of the Internal Working Group on Priority Sector Lending (2005) too emphasised the need to include those sectors as part of PSL that, inter alia, had a bearing on employment generation in the economy. 2.3 The Committee to Re-examine the Existing Classification and Suggest Revised Guidelines with regard to Priority Sector Lending Classification and Related Issues (Chairman: Shri M. V. Nair) in 2012 recommended several changes in the definition and targets under the PSL policy. The underlying emphasis of the Committee on employment generating sectors, however, could not be missed. 2.4 The insights offered by many of these committees along with the deliberations with other stakeholders including banks, NABARD and other individual experts have been useful inputs for the Working Group while examining the PSL policy. Further, the Working Group has also relied on Plan and Union Budget documents in order to identify the various sectors of national priority and understand their credit needs. The Group has attempted an empirical assessment of the impact of sectoral credit on output to determine the efficacy of the PSL policy. It has also designed a framework for a periodic reset of the agricultural targets under PSL. Finally, banks’ achievements under the PSL programme in recent decades have also been a guiding factor for the Group while recommending revisions in the overall and sectoral targets. 2.5 While examining the broad superstructure of the PSL policy, the approach of the Working Group has been to give emphasis on sectors that (a) have greater potential for employment generation, (b) address the considerations of social and economic equity, and (c) create a conducive infrastructure for improving the absorptive capacity of credit. Accordingly, while the existing sectors of agriculture and allied activities, MSEs, exports and socio-economically weaker sections have been considered for continuation by the Working Group, several newer sectors/segments, including agricultural and social infrastructure, medium enterprises, and renewable energy have also been recommended for addition to the existing sectors. The Working Group has given emphasis on a targeted lending for small and marginal farmers and micro enterprises within the PSL policy. 2.6 One of the outcomes of the Group’s interactions with banks was the unequivocal need for targets to ensure the flow to credit to priority sectors. Coupled with the need for targets, however, the Group has also laid emphasis on improving the efficiency of achievements of these targets. The process by which the mandates are implemented has been revisited to emphasize on efficiency and better compliance. Towards this end, the Group has examined the possibility of introducing the Priority Sector Lending Certificates (PSLCs) to allow a more efficient implementation of the priority sector lending mandate. Accordingly, the targets set may be viewed as floors rather than ceilings to ensure that banks are incentivised to lend more to priority sectors. 2.7 Finally, apart from revisiting the sectors and targets, the Working Group has recommended bringing in uniformity in priority sector lending requirements for all banks - domestic and foreign - in the interest of equitable treatment, and given the magnitude of need to provide credit to underserved segments. Accordingly, domestic and foreign banks irrespective of the branch network would be equal stakeholders in the PSL policy. The introduction of PSLCs will provide a mechanism to cover the priority sector shortfall and help banks specialize in certain sectors of the priority sector. Bringing all banks on par would also help in releasing greater resources towards the priority sectors. 2.8 In sum, the approach of the Working Group has been to align the priority sectors with the existing and emerging economic realities as also to improve the means to achieve the targeted credit flow to these sectors.
Chapter 3 Impact of Priority Sector Lending 3.1 Since the early 1970s, Priority Sector Lending (PSL) programme has been an integral part of the banking policy in India. It is a major public policy intervention through which credit is directed to the sectors of national priorities critical for both employment and equity. This chapter examines the efficacy of the PSL programme by analysing the growth and distribution of credit to various sectors and sections covered by this programme. As a background to this analysis, it provides a discussion on the major lessons emerging from the literature on the PSL programme in India and also similar directed lending programmes in other countries. I. Directed Lending Programmes – An International Perspective 3.2 Like India, several advanced and emerging economies have experimented with Directed Lending Programmes (DLPs) of various types since the Second World War. Although there were considerable differences across countries in the design of such programmes, the broad objective was to provide credit-based support for the development of the deserving sectors/sections that had been under-served by the mainstream banking institutions by way of public intervention in the financial markets. 3.3 Given the dynamic nature of the economic and financial structures, DLPs in many countries have evolved over time. Further, the international thinking about directed lending has also influenced the perception about these programmes. While the economic theory after the 1950s bore the influence of Keynesian economics, the period after 1980s was a period of economic liberalism. During the 2000s, the concept of “financial inclusion” gained global currency through its link with the achievement of the Millennium Development Goals (MDGs) set by the United Nations (UN).1 In addition, the global financial crisis of 2008 brought to the fore the informational asymmetries, credit rationing, prevalence of complex products in financial markets requiring regulatory intervention to protect the interests of small customers.2 In response to many of these developments, some countries either liberalised or even discontinued their DLPs, while some others have continued/redefined and even strengthened them in order to deal with a financial/economic crisis. 3.4 The DLPs across countries have taken various forms: Form 1: Sectoral lending programmes – These are public programmes designed to lend to a particular sector/section of the population. These programmes can be implemented through a governmental agency or in collaboration with public/private banking institutions. These may involve sectoral targets, as is the case with the priority sector lending programme in India. Form 2: Administered interest rate programmes – These programmes carry an element of interest subsidy while lending to the targeted sectors/sections. Form 3: Refinance programmes – These programmes involve refinance from apex financing institutions towards lending to the targeted sectors/sections. Form 4: Development financial institutions (DFI)/Public sector banks – Certain institutions are created in the public sector or private banks are nationalised to lend to either exclusively or primarily to the targeted sectors/sections. Form 5: Credit guarantee programmes – These programmes involve credit guarantee with respect to loans advanced to the targeted sectors/sections. 3.5 The existing DLPs in some of the advanced and emerging economies are presented in Table 3.1. 3.6 The review of the existing DLPs indicates: -
Agriculture and micro/small/medium enterprises have been the major sectors targeted by DLPs in most of the reviewed economies primarily owing to their employment potential. -
Credit guarantee (often described as a default subsidy in the literature) is the most commonly used instrument of intervention. However, interest subsidies and sectoral targets too are used as instruments by some of the countries. -
Except in the US, where the Government departments are directly involved, DLPs in other countries are implemented through either public banking institutions or through a mix of public and private banking institutions/cooperatives. -
At present, DLPs can be commonly seen in emerging economies, which have longstanding experience with such programmes. The advanced economies have either narrowed the scope of DLPs over time or have phased them out completely. However, some of the advanced economies from the European Union, which had discontinued these programmes, have re-introduced them to deal with the economic slowdown after 2008. 3.7 Various studies have attempted to ascertain the impact of some of the past and present DLPs on income, private savings, employment, production, productivity and other social outcomes across countries. The evidence from these studies on the impact of DLPs is mixed: -
Directed credit had a desired impact on the access to formal finance, growth of a given sector, private investment and income poverty in many countries.3 -
However, there were problems of targeting the beneficiaries under many of these programmes leading to a misallocation of resources to non-priority sectors.4 -
There were signs of financial stress resulting from directed lending in some of the countries. This stress was on account of either the usage of directed funds by beneficiaries for less productive purposes or deliberate defaults by beneficiaries exploiting the priority sector status.5 However, there were also notable exceptions among the development financial institutions that showed a consistently sound financial performance.6 -
Governments in many countries could not scale down or discontinue the DLPs in order to avoid further misuse of these programmes given the pressures exerted by a given constituency that benefitted from these programmes.7 However, there were also cases where the government discontinued these programmes, particularly the longstanding ones, leading to a serious contraction in credit availability, growth and employment.8 3.8 In sum, the available evidence on DLPs from various countries suggests positive social and economic outcomes from these programmes. In certain cases, however, it raised concerns about the benefits from these programmes, not reaching the targeted sections and resulting in financial stress for the lenders. | Table 3.1: Existing DLPs in select advanced and emerging economies | | Country | Sectors/activities under focus | Implementing agency | | US | Small businesses, students/education,
Low income groups in rural areas/for creation of electricity, waste disposal facilities
Low income groups, elderly and handicapped/housing
(involves credit guarantee in lending to some of these sectors) | US Government Departments (either independently, or in collaboration with private investment companies) | | EU (Denmark and Ireland)9 | Micro enterprises,
Small and Medium Enterprises
(involves sectoral targets, credit guarantee) | Private banking institutions | | Brazil | Industry including SME sector/long-term investment credit,
Rural housing,
Agriculture,
Micro credit (involves credit guarantee, interest subsidy and sectoral targets for some of these sectors) | Public banking institutions (either directly or through local commercial banks) | | People’s Republic of China | Agriculture,
Micro and Small Enterprises
(involves sectoral growth targets, credit guarantee, interest rate subsidy) | Public banking institutions | | Pakistan | Agriculture,
Exports
(involves indicative targets and interest rate subsidy) | Public and private banking institutions | | Russian Federation | Agriculture and agro-based industries,
Rural infrastructure
(involves interest subsidies) | Public banking institutions | | Philippines | Agriculture
(involves credit guarantee) | Public and private banking institutions/cooperatives | | India | Agriculture,
Micro and small enterprises,
Education,
Housing,
Socio-economically weaker sections
(involves aggregate targets and sectoral targets for some sectors, credit guarantees and interest subsidy for some sectors) | Public and private banking institutions | | Source: Circulars at <www.va.gov>, <www.sba.gov>, <www.bndes.gov.br>, China Banking Regulatory Commission – Annual Report 2011, <www.sbp.org.pk>, <www.oecd.org>, <www.rbi.org.in>. | II. Priority Sector Programme in India: An Analysis 3.9 There is a large body of literature examining the impact of financial intermediation on economic growth. Empirical findings broadly support the view that financial development has strong influence on economic growth and financial market imperfections have an impact on investment and growth.10 However, despite being one of the largest and longest public policy intervention programmes in the world, empirical evidence of the efficacy of PSL meeting its final objectives has been limited. It turns out to be a relatively tricky issue, and even referred to as “a gaping hole in the entrepreneurship development literature”.11 3.10 In the case of agriculture credit, when the farmer faces a credit constraint, additional credit supply can raise input use, investment, and hence output. This is the liquidity effect of credit. But credit has another important role. In most developing countries where agriculture still remains a risky activity, better credit facilities can help farmers smooth out consumption and, therefore, increase the willingness of risk-averse farmers to take risks and make agricultural investments. This is the consumption smoothing effect of credit. 3.11 In the case of India, early evidence based on detailed district level data suggest that in agriculture, the output effect of expanded rural finance is not large, despite the fact that credit to agriculture has strongly increased fertilizer use and private investment in machines and livestock. This means that the additional capital investment has been more important in substituting for agricultural labour than in increasing crop output. However, the impact of rural credit and the expansion of the rural financial system on rural wages have been positive, as the creation of non-farm employment has added more to total employment than has apparently been subtracted by the substitution of capital for labour in agriculture.12 Relatively recent evidence suggests that directed lending may have a consumption smoothing effect. However, evidence also suggests that it has contributed towards increased consumption inequality in rural India.13 3.12 Taking a sectoral approach, the Working Group attempted the quantification of the impact of PSL to agriculture and observed positive elasticity of credit to output based on district-level data for four States viz., Maharashtra, Andhra Pradesh, West Bengal and Punjab for the period 2004 to 2009.14 These findings broadly match with those in the literature that bring out a positive role played by agricultural credit in supporting the purchase of inputs and aiding growth in the agricultural sector.15 3.13 Further analysis based on the total credit to agriculture, and then separately for direct and indirect credit to agriculture suggests that the intervention through direct agriculture credit has a positive impact on agriculture output. This effect, however, was not statistically significant for indirect credit reflecting its limited role.16 Finally, the Working Group also examined how changes in growth of agricultural credit affected the growth of gross value added from agriculture based on a SVAR framework.17 The estimated impulse response showed that the increase in growth of agriculture credit positively affects the growth of agricultural value added. 1. Growth and distribution of credit to major priority sectors 1.1 Agriculture 3.14 Agriculture has figured prominently in the list of sectors included under PSL for commercial banks in India right from the inception of this programme. Even though there has been a decline in the contribution of agriculture to India’s domestic product, its share in total employment has remained high. 3.15 Over the last two decades of economic reforms, the share of agricultural credit to total bank credit has shown variations but has broadly remained within the band of 10 to 12 per cent (Chart 3.1). The pattern was broadly of a decline over a major part of the 1990s followed by a revival over the 2000s (Table 3.2). During the 2000s, a notable increase in this share could be seen during the first half of the decade, which was a period when the Comprehensive Credit Policy was initiated by the Central Government for reviving the growth of agricultural credit. The 1990s was a period of slower growth in bank credit to agriculture, which picked up in 2000s marginally exceeding even the overall growth in bank credit during this decade. 3.16 Two noteworthy features of bank credit to agriculture since the early 1990s have been the following: First, there has been a rise in share of indirect agricultural credit in total agricultural credit. This could be gauged from the widening gap between the shares of total and direct credit. | Table 3.2: Rate of growth in agricultural credit, in per cent per annum | | Period | Credit to agriculture | Total bank credit | | 1991-2001 | 4.3 | 4.9 | | 2001-2011 | 15.6 | 15.2 | Source: Calculated using data from Handbook of Statistics on Indian Economy, various issues; Statistical Tables relating to Banks in India, various issues
Notes: 1. Figures refer to compound annual rates of growth.
2. Growth rates have been worked out after deflating the credit figures by GDP deflator. |
 3.17 Secondly, small and marginal cultivators (operating less than 5 acres of land) have not received their due share in the distribution of agricultural credit despite the fact they account for more than 80 per cent of total cultivators in India.18 The increase in the share of small and marginal farmers is, in part, attributable to the subdivision of land given the high land-man ratio. However, given their major contribution to overall agricultural production, food security and diversification within agriculture in India, they remain legitimate claimants for an increased allocation of agricultural credit (Chart 3.2).19 1.2 MSE sector 3.18 Over the last two decades, the share of credit to MSEs showed a broadly similar trend as that of agricultural credit, first posting a decline and then showing some signs of revival with the broadening of the definition of the MSE sector after 2006-07 (Chart 3.3). Further, similar to agriculture, the 1990s was a period of relatively slow growth in credit to SSI sector, a trend that was reversed over the 2000s, particularly after 2006-07 (Table 3.3). | Table 3.3: Rate of growth in credit to MSE sector, in per cent per annum | | Period | Credit to MSE sector | Total bank credit | | 1991-2001 | 4.1 | 4.9 | | 2001-2007 | 7.2 | 16.4 | | 2008-2012 | 12.7 | 8.5 | Source: Calculated using data from Handbook of Statistics on Indian Economy, various issues.
Notes: 1. The periodisation in the 2000s is based on the year of definitional change in the MSE sector.
2. Figures refer to compound annual rates of growth.
3. Growth rates have been worked out after deflating the credit figures by GDP deflator. | 3.19 Notwithstanding the pick up, concerns about a gap in credit allocation to MSE sector have remained. As per the available estimates, the supply of credit to the sector in 2012-13 has been short of the total demand by about 59 per cent.20 The average gap for the entire plan period of the 12th Five Year Plan has been of about 52 per cent. 1.3 “Weaker” Sections 3.20 The category of “weaker” sections as defined under PSL encompasses various socially and economically underprivileged sections. The share of credit to these sections followed a pattern that was similar to agriculture and MSE sectors. There was a steady decline in the share of credit to weaker sections over the 1990s followed by a revival that took the share of credit to these sections back to the level seen in the early 1990s (Chart 3.4). 3.21 Another way of looking at the credit distribution to the underprivileged sections could be to segregate the loan accounts with relatively small credit limits. For this purpose, the accounts with a credit limit of up to Rs.0.2 million (referred to as small borrowal account (SBAs), were separately analysed. The share of such accounts in total number of accounts was 79.7 per cent in 2013 reflecting the predominance of small-sized loans in the Indian banking system. However, these accounts together accounted for only 9.3 per cent of the total credit outstanding. The flip side of this observation was that only 20 per cent of the loan accounts accounted for more than 90 per cent of the total bank credit. More importantly, both in terms of the number of accounts and amount, the share of small accounts were on a steady decline over the last two decades (Table 3.4). 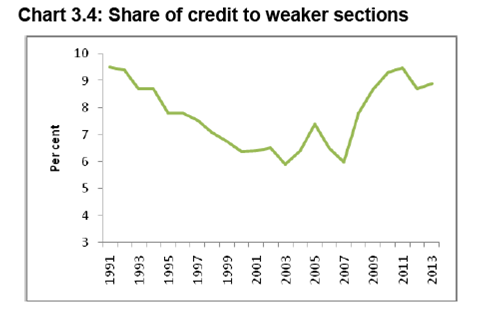 3.22 Inflation could be one of the obvious reasons for this decline. However, even when the cut-off of Rs.0.2 million for 1998 was adjusted using the price levels of 2013 and compared the shares of small accounts for these two years, the decline was evident (Table 3.4).21 The share of small borrowers in total accounts declined from 93.2 per cent in 1998 to 79.7 per cent in 2013. The decline could also be seen in the share of SBAs in the amount of bank credit. On an average, these shares shrank by more than one per cent every year. III. Concluding Observations 3.23 This chapter analysed the impact, growth and distribution of credit to various priority sectors broadly during the period of economic reforms. The analysis suggests while there has been a growth of credit to these sectors, there have been concerns about the distribution of credit and a persistent credit gap in these sectors having national priority. Hence, there is a need to ensure a further increase in the allocation of credit to these sectors and also to design the PSL in a manner such that the allocated credit reaches the desired sections. Towards this end, it is important (a) to undertake a review of the PSL definitions and targets (b) to examine innovative means to incentivize banks to meet these targets. The following chapters of the Report look into these issues. | Table 3.4 : Share of credit to weaker sections | | | Small Borrowal Accounts | All Accounts | Per cent share of SBA in all accounts | | End March | No. of accts. | Amt. Outstanding | Average amt. (SBA) | No. of accts. | Amt. Outstanding | Average amt. (ALL) | No. of accts. (%) | Amt. outstanding (%) | | 1998 | 49,932 | 521.67 | 10.4 | 53,583 | 3299.44 | 61.6 | 93.2 | 15.8 | | Cut-off limit: Rs.200,000 | | 1999 | 50,997 | 882.82 | 17.3 | 52,305 | 3824.25 | 73.1 | 97.5 | 23.1 | | 2000 | 52,856 | 1027.45 | 19.4 | 54,370 | 4600.81 | 84.6 | 97.2 | 22.3 | | 2001 | 50,456 | 1062.94 | 21.1 | 52,364 | 5384.34 | 102.8 | 96.4 | 19.7 | | 2002 | 54,130 | 1256.49 | 23.2 | 56,388 | 6559.93 | 116.3 | 96.0 | 19.2 | | 2003 | 56,527 | 1450.57 | 25.7 | 59,491 | 7559.69 | 127.1 | 95.0 | 19.2 | | 2004 | 61,900 | 1627.00 | 26.3 | 66,390 | 8803.12 | 132.6 | 93.2 | 18.5 | | 2005 | 71,106 | 1998.80 | 28.1 | 77,151 | 11524.68 | 149.4 | 92.2 | 17.3 | | 2006 | 77,122 | 2484.98 | 32.2 | 85,435 | 15138.42 | 177.2 | 90.3 | 16.4 | | 2007 | 84,347 | 2788.95 | 33.1 | 94,442 | 19471.00 | 206.2 | 89.3 | 14.3 | | 2008 | 94,554 | 3310.22 | 35.0 | 106,990 | 24170.07 | 225.9 | 88.4 | 13.7 | | 2009 | 95,801 | 3498.65 | 36.5 | 110,056 | 28477.13 | 258.8 | 87.0 | 12.3 | | 2010 | 102,632 | 3607.45 | 35.1 | 118,648 | 33451.69 | 281.9 | 86.5 | 10.8 | | 2011 | 102,155 | 3838.88 | 37.6 | 120,724 | 40756.47 | 337.6 | 84.6 | 9.4 | | 2012 | 109,111 | 4566.21 | 41.8 | 130,881 | 48032.67 | 367.0 | 83.4 | 9.5 | | 2013 | 102,305 | 5148.33 | 50.3 | 128,286 | 55253.17 | 430.7 | 79.7 | 9.3 | | Source: RBI, Survey of Small Borrowal Accounts, various issues. |
Annex 1 Dynamic Panel (Arellano-Bond) regression coefficients with total agri. credit
(Dependent Variable: Lagged - per capita output) | | Variables | Coef. | Robust SE | z | P>z | 95% Conf.[Interval] | | Lagged - per capita output | 0.512 | 0.124 | 4.140 | 0.000 | 0.270 | 0.755 | | Per capita credit amount | 0.040 | 0.023 | 1.760 | 0.079 | -0.005 | 0.084 | | Per capita number of credit accounts | 0.015 | 0.011 | 1.380 | 0.167 | -0.006 | 0.037 | | Per capita agri. Area | 0.069 | 0.031 | 2.220 | 0.026 | 0.008 | 0.130 | | Rainfall | -0.013 | 0.009 | -1.420 | 0.156 | -0.031 | 0.005 | | Intercept | 0.444 | 0.473 | 0.940 | 0.348 | -0.483 | 1.370 | Number of obs. = 434; Wald chi2(5) = 141.59; Prob> chi2 = 0.0000
Arellano-Bond test that average autocovariance in residuals of order 1 is 0: H0: no autocorrelation z = -2.829 Pr > z = 0.0047
Arellano-Bond test that average autocovariance in residuals of order 2 is 0: H0: no autocorrelation z = -1.39 Pr > z = 0.1632
Sargan test of over-identifying restrictions: chi2(46) = 75.7419 Prob> chi2 = 0.4543 |
| Dynamic Panel (Arellano-Bond) regression coefficients with direct agri. Credit | | Variables | Coef. | Robust SE | Z | P>z | 95% Conf.[Interval] | | Lagged - per capita output | 0.468 | 0.119 | 3.930 | 0.000 | 0.235 | 0.701 | | Per capita direct credit amount | 0.073 | 0.030 | 2.450 | 0.014 | 0.015 | 0.132 | | Per capita number of direct credit accounts | 0.005 | 0.012 | 0.430 | 0.668 | -0.019 | 0.030 | | Per capita agri. Area | 0.068 | 0.030 | 2.240 | 0.025 | 0.009 | 0.127 | | Rainfall | -0.012 | 0.009 | -1.330 | 0.184 | -0.031 | 0.006 | | Intercept | 0.506 | 0.472 | 1.070 | 0.284 | -0.420 | 1.431 | Number of obs. = 434; Wald chi2(5) = 142.90 Prob> chi2 = 0.0000
Arellano-Bond test that average autocovariance in residuals of order 1 is 0: H0: no autocorrelation z = -2.833 Pr > z = 0.0048
Arellano-Bond test that average autocovariance in residuals of order 2 is 0: H0: no autocorrelation z = -1.3005 Pr > z = 0.1934
Sargan test of over-identifying restrictions: chi2(46) = 77.3377 Prob> chi2 = 0.4039 |
| Dynamic Panel (Arellano-Bond) regression coefficients with indirect agri. Credit | | Variables | Coef. | Robust SE | Z | P>z | 95% Conf.[Interval] | | Lagged - per capita output | 0.572 | 0.125 | 4.560 | 0.000 | 0.326 | 0.818 | | Per capita indirect credit amount | 0.028 | 0.030 | 0.930 | 0.351 | -0.031 | 0.086 | | Per capita number of indirect credit accounts | 0.526 | 0.273 | 1.930 | 0.054 | -0.009 | 1.062 | | Per capita agri. Area | 0.093 | 0.033 | 2.800 | 0.005 | 0.028 | 0.159 | | Rainfall | -0.008 | 0.010 | -0.790 | 0.429 | -0.029 | 0.012 | | Intercept | 0.815 | 0.376 | 2.160 | 0.030 | 0.077 | 1.552 | Number of obs. = 434; Wald chi2(5) = 157.05; Prob> chi2 = 0.0000
Arellano-Bond test that average autocovariance in residuals of order 1 is 0: H0: no autocorrelation z = -2.777 Pr > z = 0.0055
Arellano-Bond test that average autocovariance in residuals of order 2 is 0: H0: no autocorrelation z = -1.5919 Pr > z = 0.1114
Sargan test of over-identifying restrictions: chi2(46) = 77.3322 Prob> chi2 = 0.4041 |
Chapter 4 Priority Sector Lending – Targets and Definitions 4.1 This chapter begins by looking at the present targets and definitions for Priority Sector Lending (PSL) and then reviews the achievements by banks in the recent period and while examining the sectors of national priority, suggests revisions in the approach, definitions and targets of PSL. I. Priority Sector 4.2 As per the extant guidelines, domestic banks are required to meet a target of 40 per cent of their Adjusted Net Bank Credit (ANBC) or Credit Equivalent of Off-Balance Sheet Exposure (CEOBE) of the preceding March 31st, whichever is higher, for priority sector lending. Foreign banks with 20 and above branches have also been brought on par with domestic banks w.e.f. July 20, 2012 and these banks have to achieve the targets over a period of five years. The prescription for foreign banks with less than 20 branches is 32 per cent of ANBC or Credit Equivalent of Off-Balance Sheet Exposure (CEOBE) of the preceding March 31st, whichever is higher. 4.3 At the aggregate level, domestic banks have by and large achieved the overall target of 40 per cent in the recent years (Appendix 1.1 and Chart 4.1). Between 2001 and 2014, except for two years, the shortfall has been less than 1 percentage point. Further, the number of years when banks exceeded the target outnumbered the number of years having a shortfall. Notwithstanding the low magnitude of default, there was a discernible decline in the percentage of PSL after 2008, which was somewhat reversed only in 2014. Foreign banks achieved more than the target of 32 per cent during this period. 4.4 Continuance with directed lending programme (DLP) is a necessity in the Indian context. In the absence of such prescriptions, lending to the important sectors like agriculture and Micro and Small Enterprise (MSEs) would not have taken place to the desired extent. In view of the continued need for making credit available to various priority sectors on grounds of growth and equity and the fact that banks have been hovering around the set target in lending to the priority sector leads to the conclusion that the target should be kept intact. The feedback received from bankers underscore the need to continue with a target-based approach to ensure the flow of credit to priority sectors. The Working Group, therefore, recommends that the target for lending to the redefined priority sector may be retained uniformly at 40 per cent of ANBC or Credit Equivalent of Off-Balance Sheet Exposure (CEOBE), whichever is higher, for all scheduled commercial banks. 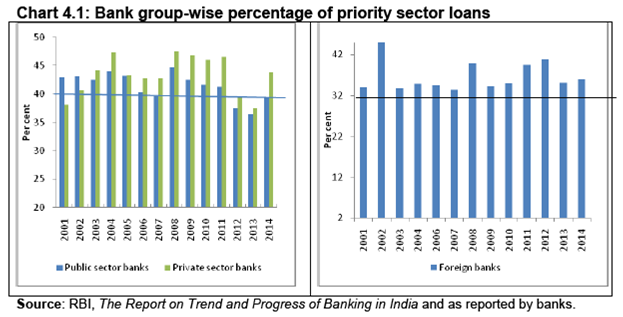 Foreign Banks with more than 20 branches were given the same targets as domestic banks in 2012 giving them time up to March, 2018 to comply. They were also advised to submit the action plans for achieving these targets. Remaining Foreign Banks (with less than 20 branches) continued to have 32 per cent priority sector lending target. Admittedly, there are certain constraints for foreign banks, like their limited presence owing to branch licensing restrictions and lack of experience in lending to certain sectors. However, it is felt that given the enhanced scope and alternative avenues made available for achievement of priority sector targets, they will also be able to achieve the targets similar to those for domestic banks. In Chapter 5, the Working Group has made recommendations for the introduction of Priority Sector Lending Certificates (PSLCs). These instruments would provide a mechanism for banks with lesser number of branches to achieve the prescribed targets and sub-targets. The Working Group, therefore, recommends that all foreign banks (irrespective of number of braches they have) may be brought on par with domestic banks and the same target/ sub-targets may be made applicable to them. The overall target of 40 percent and sub-targets, as mentioned in the following paragraphs, may be made applicable to all the foreign banks. Foreign banks with 20 and above branches may be given time up to March 2018 and other foreign banks may be given time up to March 2020 to comply with the targets/sub-targets as per the action plans submitted by them and approved by the Reserve Bank. II. Agriculture 4.5 Agriculture credit has been considered eligible for priority sector lending for over four decades. Within the priority sector, a sub-target for the direct financing of agriculture and allied activities was set at 15 per cent of net bank credit to be achieved by 1985, which was subsequently raised to 16 per cent by March 1987, 17 per cent by March 1989 and 18 per cent by March 1990. The sub-target of 18 per cent was further bifurcated in 1993 to a minimum of 13.5 per cent for direct loans and a maximum of 4.5 per cent for indirect loans. Indirect lending above 4.5 per cent of ANBC was not taken into account for computation of achievement under the 18 per cent target, but was considered as overall priority sector lending. In April 2001, private sector banks were advised to achieve the target of 18 per cent of net bank credit for lending to agriculture within a time period of two years. Agriculture targets were made applicable to foreign banks with 20 and above branches from April 2013 and were given time till March 2018 to achieve the same. II.1 Trends in Agriculture Credit The Working Group looked at various trends in agricultural credit before making recommendations for this sector. 4.6 The performance of domestic scheduled banks in terms of achievement of agriculture targets was less satisfactory. The shortfall from the targeted level (of 18 per cent) was more than 2 percentage points every year between 2001 and 2014 for all SCBs except for three years between 2008 and 2010. On an average, the percentage of credit to agriculture under PSL was about 16 per cent in the years after 2001. The achievement of agricultural targets was relatively better for public sector banks than private sector banks (Appendix 1.2 and Chart 4.2). II.2 Direct vs. Indirect Agriculture Lending 4.7 Domestic banks as a group have achieved a target of only 12 per cent for direct agriculture as against the target of 13.5 per cent of ANBC. Even the public sector banks with a larger reach in rural areas were not able to achieve the 13.5 per cent target for direct agriculture lending on a sustainable basis since 2001 as may be seen from Appendix 1.3 and Chart 4.3. As against this, the indirect lending (Appendix 1.4 and Chart 4.4) as percentage of ANBC was always been above the cap of 4.5 per cent of ANBC except in 2012 and 2013. II.3 Share of Agriculture in GDP 4.8 The share of agriculture and allied sectors in India's GDP has declined to 13.7 percent in 2012-13 at the 2004-05 prices. The decrease in agriculture’s contribution to GDP however, has not been accompanied by a matching reduction in the share of agriculture in employment. It remains the largest employer in the country and hence, a sector of national priority (Chart 4.5).22 Indian agriculturists, unlike their counterparts in the secondary and tertiary sectors, enjoy fewer avenues of finance, particularly formal finance. Hence, while the need for the banking sector to grow in size is widely recognised, it is also necessary to recognize the need for bank credit expansion in Indian agriculture, justified on the grounds of growth and equity II.4 Short-term vs. Long-term lending 4.9 The Working Group noted that even though credit flow has increased over the years, the long term credit in agriculture or investment credit showed a declining trend over the years. The share of long term credit in overall ground level credit flow reduced from 55 per cent in 2006-07 to 39 per cent in 2012-13 as may be seen from Appendix 1.5 and Chart 4.6. Since investment credit is the major driver of private sector capital formation in agriculture, the persistent decline in its share raises concern about the agricultural production and productivity. 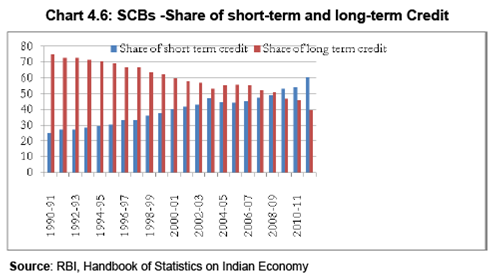 Although this decline in the share of long-term credit had started before the introduction of interest subvention scheme (2006-07), the decline has been much sharper thereafter. Interest Subvention Scheme has created certain distortions in the credit system. While banks have been advised to extend loans not below the Base Rate w.e.f. July 2010, extending interest subvention and compelling banks, through administrative fiat, to lend at 7 per cent distorts the market, impinges on transparency in lending rates and constrains transmission of the policy rates. Besides, this has also led to banks granting agriculture loans against the security of gold without establishing that the end-use is agriculture and claiming interest subvention as well as priority sector benefit. The Committee on Comprehensive Financial Services for Small Businesses and Low Income Households (Chairman : Dr. Nachiket Mor) has also suggested transfer of any benefits by the Government of India to farmers directly and not through the mechanism of subvention and waivers enabling banks to freely price the farm loans based on their risk models. Pricing of loans below Base Rate should be withdrawn. The Working Group recommends that matter may be taken up at the appropriate level with Government of India. II.5 Lending to Small and Marginal Farmers 4.10 As per the Agriculture Census (2010-11), out of 138 million farming holdings in the country, 117 million are small and marginal holdings. From 62 per cent in 1960-61, small and marginal landholdings have come to constitute around 85 per cent of total number of land holdings and hold nearly 44 per cent of the cultivated area in 2010-11.23 Their contribution in crops like rice (58 per cent), wheat (45 per cent), pulses (38 per cent), sugarcane (53 per cent) and oilseeds (37 per cent) has been increasing over time – the figures within brackets indicating their contribution to total output of the respective crops in 2011. They also contributed to 70 per cent of production of vegetables, 55 percent of fruit production and 69 per cent of milk production. As presented in Chapter 3, though the priority sector targets augmented the credit flow to various sectors, the smaller and more vulnerable segments within these sectors did not get adequate attention. Evidently, the extent of financial exclusion remains large within the farming community, which can be countervailed by enhancing the flow of formal credit to this sector. II.6 Integration of agriculture into the macro economy 4.11 The present-day agriculture extends beyond the production of food grains to the entire management of the food economy covering crop production, storage, processing, transport and distribution and hence, does not have a “rural only” orientation. It is far more integrated to the macro economy. It also forms the resource base for a number of agro-based manufacturing and services. The level of processing in India as compared to certain countries such as China and USA is very low. Further, wastage due to inadequate storage and supply chain infrastructure shows significant need for investment in agriculture infrastructure such as storage and processing. A holistic approach to agriculture is needed to create agri-infrastructure which will help in the credit absorption capacity of the sector. The Budget 2014-15 also recognizes that to make farming more competitive and profitable, there is a need to step up investment in agriculture. These features necessitate a comprehensive relook at the sector while redefining it as part of PSL. Recommendations 4.12 Based on the issues and concerns regarding the agriculture sector as discussed above, the Working Group has attempted to focus on ‘credit for agriculture’ rather than ‘credit in agriculture’. While the Working Group recommends retaining the agriculture target of 18 per cent, the approach and thrust has been re-defined to include (i) Farm Credit (which will include short-term crop loans and medium/long-term investment credit to farmers) (ii) Agriculture Infrastructure and (iii) Ancillary Activities and on-lending. An illustrative (and not exhaustive) list of what constitutes the three stages is indicated below: | Table 4.1: Proposed Classification of Agricultural Credit under PSL | | Sl. No. | Type of activity | Illustrative List | | 1. | Farm Credit | I. Loans to individual farmers [including Self Help Groups (SHGs) or Joint Liability Groups (JLGs), i.e. groups of individual farmers, provided banks maintain disaggregated data of such loans], directly engaged in Agriculture and Allied Activities, viz., dairy, fishery, animal husbandry, poultry, bee-keeping and sericulture. This will include: (i) Short-term crop loans to farmers which will include traditional/non-traditional plantations, horticulture and allied activities. (ii) Loans to farmers under Kisan Credit Card Scheme. (iii) Loans to farmers for pre and post-harvest activities, viz., spraying, weeding, harvesting, sorting, grading and transporting of farm produce. (iv) Loans up to Rs. 50 lakh against pledge/hypothecation of agricultural produce (including warehouse receipts) for a period not exceeding 12 months. (v) Loans to distressed farmers indebted to non-institutional lenders. (vi) Medium & long-term loans to farmers for agriculture and allied activities (e.g. purchase of agricultural implements and machinery, loans for irrigation and other developmental activities undertaken in the farm, and development loans for allied activities.) vii) Loans to small and marginal farmers for purchase of land for agricultural purposes. II. Loans to corporates including farmers' producer companies of individual farmers, partnership firms and co-operatives of farmers directly engaged in Agriculture and Allied Activities, viz., dairy, fishery, animal husbandry, poultry, bee-keeping up to an aggregate limit of Rs. 2 crore per borrower. | | 2. | Agriculture infrastructure | i) Loans for construction and running of storage facilities (warehouse, market yards, godowns and silos), including cold storage units/ cold chains designed to store agriculture produce/products, irrespective of their location. ii) Loans for research and development in agriculture/rural sector targeted at enhancing the farm productivity. iii) Soil conservation and watershed development, etc. | | 3. | Ancillary activities/on-lending | (i) Loans up to Rs.5 crore to cooperative societies of farmers for disposing of the produce of members. (ii) Loans up to Rs. 5 crore for transportation and marketing of agriculture produce. (iii) Loans for setting up of Agriclinics and Agribusiness Centres. (iv) Loans for Agri-processing and ginning etc. (v) Loans to PACS/RRBs/MFIs for on-lending to farmers for agricultural and allied activities. | In view of the above classification, distinction between ‘direct’ and ‘indirect credit’ is no longer necessary. 4.13 The question, however, is the extent to which credit should be allocated to agriculture. In order to address the issue of credit allocation to agriculture, the Working Group has followed a model-based approach details of which are furnished in the Annex 2, to this Chapter. While presently the Working Group has recommended that the agriculture lending target be retained at 18 per cent of ANBC, it is suggested that the metric defined in Annex be used to reset this target every three years depending on the function of three variables viz., contribution of agriculture to the GDP, employment and number of credit accounts.. Agri-processing, presently included in MSE Sector, is proposed to be brought into agriculture fold. Considering the needs of small and marginal farmers and based on their share in the operating area as explained in para 4.10 above, within the agricultural target of 18 per cent of ANBC, a sub-target of 8 per cent of ANBC is recommended for small and marginal farmers, which may be achieved in a phased manner within a period two years i.e., 7 per cent by March 2016 and 8 per cent by March 2017. Foreign banks may be given time till the operationalisation of the PSLC Scheme for achieving the sub-target prescribed for Small and Marginal Farmers, given their more limited access to rural areas. 4.14 The remaining 10 per cent of the overall agriculture target of 18 per cent may be utilised by banks for lending for farm credit to other farmers as well as agricultural infrastructure and ancillary activities. Perceiving the huge need to create the rural infrastructure and processing capabilities and to give a fillip to the same, the Working Group has decided to not put any caps on the loan limits for agri-processing and agriculture infrastructure. This will facilitate and develop the credit absorption capacity of the farmers and help to create rural infrastructure and processing capabilities over a reasonable period of time, which will have a multiplier effect on the development of this sector. 4.15 For the purpose of the sub-target of 8 per cent for small and marginal farmers, the Working Group has defined them to include: - Farmers with landholding of up to 1 hectare are considered as Marginal Farmers. Farmers with a landholding of more than 1 hectare but less than 2 hectares are considered as Small Farmers. - Landless agricultural labourers, tenant farmers, oral lessees and share-croppers. - Loans to Self Help Groups (SHGs) or Joint Liability Groups (JLGs), i.e. groups of individual small and marginal farmers, provided banks maintain disaggregated data of such loans, directly engaged in Agriculture and Allied Activities. - Loans to farmers' producer companies of individual farmers, and co-operatives of farmers directly engaged in Agriculture and Allied Activities, where the membership of small and marginal famers is not less than 75 per cent by number and whose land-holding share is also not less than 75 per cent of the total land-holding. III. Micro, Small and Medium Enterprises 4.16 Fostering a dynamic micro, small and medium enterprise sector for sustenance of economic development is a priority for the policy makers, in both developed and emerging economies. In India too, Micro, Small and Medium Enterprise (MSME) sector plays a pivotal role in generating employment, increasing cross - border trade and fostering the spirit of entrepreneurship. As per the data released by the Ministry of MSME, Government of India, there are about 26.1 million enterprises in this sector. The sector accounts for 45 per cent of manufactured output, close to 40 per cent of all exports from the country and employs nearly 59.7 million people, which is next only to the agricultural sector. 4.17 However, the extent of financial exclusion in the sector is very high. The statistics compiled in the Fourth Census of MSME sector (2006-07) revealed that only 5.18 per cent of the units (both registered and unregistered) had availed of finance through institutional sources, 2.05 per cent had finance from non-institutional sources and the majority of units i.e. 92.77 per cent had not availed any external finance or depended on self-finance (Chart 4.7). 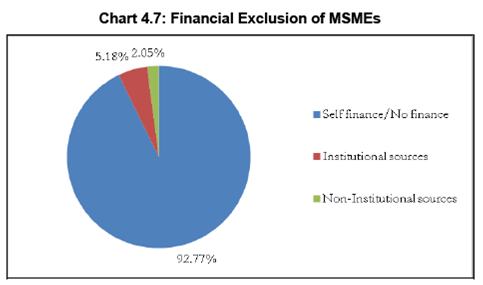 4.18 The Government of India, recognising that the manufacturing sector has a multiplier effect on the creation of jobs, has, in the National Manufacturing Policy, proposed to enhance the share of manufacturing in GDP to 25 per cent by 2022. The share of manufacturing in India’s GDP has stagnated at 15-16 per cent since 1980 while the share in comparable economies in Asia is much higher at 25 to 34 per cent. Given the contribution of the MSME sector in manufacturing and employment generation, it is imperative that the MSME sector as a whole is given priority. 4.19 Medium Enterprises (MEs) were not included in priority sector earlier as it was felt that the sector has access to credit and including the same would crowd out finance to the micro and small enterprises. However, the data on outstanding credit to MEs since March 2011 to March 2014 (Appendix 1.6) shows that while the outstanding credit to these enterprises over the years has increased, the number of units financed has declined. Further, credit to MEs as a proportion to non-food credit has less than halved to 2.4 per cent in 2014 from 5 per cent in 2008 as may be seen from the Chart 4.8. 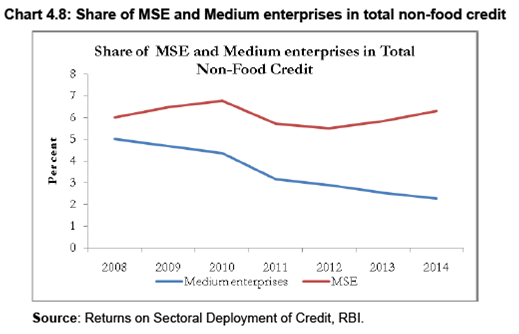 4.20 In November 2013, Reserve Bank of India announced certain measures to increase liquidity support to MSMEs which, inter alia, included extension of the PSL status to incremental loans to medium enterprises (MEs) till March 2014. The feedback from bankers suggested that the measure helped to ease the liquidity pressures faced by the MSME enterprises. In view of the above, the Working Group recommends extending PSL status to medium enterprises in addition to the micro and small enterprises. Thus the MSME sector as a whole may be reckoned for priority sector lending. While all medium enterprises (manufacturing) may be included under PSL, credit to medium enterprises (service) with credit limit up to Rs.10 crore may be made eligible to qualify for PSL as was permitted temporarily in terms of circular dated November 25, 2013. 4.21 To ensure that the smallest segment within the MSME sector i.e. the micro enterprises, are not crowded out with the inclusion of the medium enterprises, the Working Group recommends a sub-target of 7.5 per cent of ANBC for lending to micro enterprises to be achieved in a phased manner in a period of two years i.e. 7 per cent of ANBC by March 2016 and 7.5 per cent of ANBC by March 2017. 4.22 Within the micro enterprises, the present guidelines on Priority Sector Lending and guidelines on Lending to MSME provide that: (i) 40 per cent of total advances to micro and small enterprises sector should go to Micro (manufacturing) enterprises having investment in plant and machinery up to Rs.10 lakh and micro (service) enterprises having investment in equipment up to Rs. 4 lakh; and (ii) 20 per cent of total advances to micro and small enterprises sector should go to Micro (manufacturing) enterprises with investment in plant and machinery above Rs.10 lakh and up to Rs.25 lakh, and micro (service) enterprises with investment in equipment above Rs.4 lakh and up to Rs.10 lakh. As the MSMED Act 2006 does not provide for any such sub-categorization within the definition of micro enterprises and considering that a specific target for micro enterprises is suggested, the Working Group recommends that the same may be dispensed with. 4.23 To ensure that MSMEs do not remain small and medium units merely to be eligible for priority sector status, the Working Group recommends that the priority sector lending status may stay with them for up to three years after they grow out of the category of MSMEs. The Working Group felt that this would be in alignment with the budget announcement made in the Union Budget 2012-13, wherein it was announced that non-tax benefits may be made available to a MSME unit for three years after it graduates to a higher category. 4.24 During the interaction of the Working Group with banks, it was suggested that the existing limit, under the MSMED Act, fixed in 2006, for investment in plant and machinery that qualify a unit as micro/small enterprise needs to be increased considering changes in price index and cost of inputs. A recommendation to this effect was made by the Nair Committee on Priority sector as detailed below: | Table 4.2: Recommendation of M V Nair Committee for Revision of Limits under MSMED Act 2006 | | No. | Activity Description | Investment in Plant and Machinery/Equipment | | Existing | Revised | | 1 | Micro (Manufacturing) Enterprises | Rs.25 lakh | Rs.50 lakh | | 2 | Small (Manufacturing) Enterprises | Rs.5 crore | Rs.8 crore | | 3 | Micro (Service) Enterprises | Rs.10 lakh | Rs.20 lakh | | 4 | Small (Service) Enterprises | Rs.2 crore | Rs.3 crore | 4.25 Any modification, as mentioned above, requires amendment in the statute. Recommendations of the Nair Committee have been referred by Reserve Bank of India to the Government to consider effecting the necessary amendment to the Act. In the announcement made by the Finance Minister in The Union Budget 2014-15, it has been stated that the definition of MSME will be reviewed to provide for a higher capital ceiling. In the light of the Budget announcement, the Working Group recommends that the matter may be pursued with the Government. Any change in definition will automatically apply to PSL norms from the date it is notified. IV. Exports 4.26 In the last five years, India’s export growth has seen ups and downs, being in negative territory twice: in 2009-10 as an aftershock of the 2008 crisis and in 2012-13 as a result of the euro zone crisis and global slowdown. India’s exports were US$ 312.6 billion against a target of US$ 325 billion during 2013-14. 4.27 Export is a sector of national priority. India needs to increase and stimulate its exports as it will help narrow the current account deficit as well as add to our foreign exchange reserves. For this, the Working Group feels that export credit needs to be given a nudge. 4.28 An analysis of export credit data (Appendix 1.7) indicates that while the share of domestic banks, particularly public sector banks, has been declining over a period of years, foreign banks were an exception to this observation: 4.29 The Working Group also observed that the share of foreign banks in export credit to their total credit is much higher than that of the domestic banks. 4.30 As per the extant guidelines, for large foreign banks with over 20 branches, export finance will progressively become an ineligible category with the exception of eligible activities under agriculture and Micro and Small Enterprises (MSEs). For foreign banks with less than 20 branches, export credit continues to be reckoned as an eligible category for priority sector. The issue of export finance was also reviewed earlier by The Technical Committee on Services/Facilities for Exporters (Chairman: Shri G. Padmanabhan) which had recommended priority sector status for exports. Given the importance of exports in the economy, and to give focused attention to export finance within the priority sector lending, the Working Group recommends carving out a separate category of export credit under priority sector. In terms of the BSR data, as 98 per cent of the accounts and 50 per cent of the outstanding amount under export credit comes within the sanctioned limit of Rs 25 crore. The Working Group, therefore, recommends that incremental export credit from a base date (i.e. the outstanding export credit as on the date on reckoning minus outstanding export credit as on the base date) to units having turnover of up to Rs. 100 crore having sanctioned credit limit of up to Rs.25 crore from the banking system may be included in priority sector. Export Credit will include Pre-shipment and post shipment export credit in terms of extant guidelines. The export credit under priority sector may be limited to 2 per cent of ANBC in order to ensure that other segments under priority sector are not crowding out. V. Education 4.31 For a developing country like India that is set to take advantage of the demographic dividend, education undoubtedly figures as an area of national priority. Education loans are considered as part of PSL up to a loan ceiling of Rs 10 lakh for studies in India and Rs 20 lakh for studies abroad as per the extant guidelines. 4.32 The Working Group endorses the need for continuation of educational loans, including loans for vocational courses, under priority sector. It received suggestions from various stakeholders regarding raising the ceiling of education loans under PSL in line with the inflation and rising fee structures. 4.33 However, the recent trends in education loans suggested a concentration in the size class of up to Rs. 5 lakh, notwithstanding the extant ceilings of Rs. 10/20 lakh.24 Taking the trend into account, the Working Group recommends that educational loans up to Rs.10 lakh per borrower, irrespective of the sanctioned limit, be treated as eligible under priority sector for both study in India and abroad. Since the loan limit for studies abroad is presently Rs. 20 lakh, all such existing loans may continue under priority sector till the date of maturity. VI. Housing 4.34 In terms of extant guidelines housing loans to individuals up to Rs. 25 lakh in metropolitan centres (with population above ten lakh) and Rs.15 lakh in other centres, for purchase/construction of a dwelling unit per family are eligible for priority sector classification. The Government has stressed the importance of availability of cheap credit to make housing affordable for the Economically Weaker Sections (EWS), Lower Income Group (LIG) and Medium Income Group (MIG) segments of the population. Accordingly, the Reserve Bank, in terms of its guidelines on ‘Issue of long term bonds by banks-Financing of infrastructure and Affordable housing’, dated July 15, 2014 has eased the way for banks to raise long term resources to finance their long term loans to infrastructure as well as affordable housing. Banks can issue long-term bonds with a minimum maturity of seven years to raise resources for lending to affordable housing. Eligible bonds will also get exemption in computation of Adjusted Net Bank Credit (ANBC) for the purpose of PSL. 4.35 The above guidelines have given the sector the required a policy nudge. However, with a view to ensure that the credit flows to needy persons for affordable housing, the Group recommends that an additional criteria that the overall cost of the dwelling unit in the metropolitan centre and at other centres should not exceed Rs.35 lakh and Rs.25 lakh respectively, be prescribed. Further, with a view to align it with guidelines on Loan to Value Ratio (80 per cent for loans above Rs.20 lakh) prescribed by the Reserve Bank, it recommends that priority sector limits be modified and fixed at Rs.28 lakh in metropolitan centres and Rs.20 lakhs in other centres. As the inclusion of priority sector housing loans which are backed by the long term bonds, would result in ‘double counting’ on account of exemption from ANBC, the Working Group recommends that banks should either include housing loans to individuals up to Rs.28 lakh in metropolitan centres and Rs.20 lakh in other centres under priority sector or take benefit from exemption from ANBC, but not both. All other existing guidelines regarding housing loans may be continued. VII. Weaker Sections 4.36 At present a target of 10 per cent of ANBC or credit equivalent amount of Off-Balance Sheet Exposure, whichever is higher is stipulated for lending to weaker sections. The weaker sections include the following set of borrowers, availing of bank credit under priority sectors : | Table 4.3: Weaker Sections as per the extant guidelines | | | Category | | (a) | Small and marginal farmers; | | (b) | Artisans, village and cottage industries where individual credit limits do not exceed Rs. 50,000; | | (c) | Beneficiaries of Swarnjayanti Gram Swarozgar Yojana (SGSY), now National Rural Livelihood Mission (NRLM); | | (d) | Scheduled Castes and Scheduled Tribes; | | (e) | Beneficiaries of Differential Rate of Interest (DRI) scheme; | | (f) | Beneficiaries under Swarna Jayanti Shahari Rozgar Yojana (SJSRY), now National Urban Livelihood Mission (NULM); | | (g). | Beneficiaries under the Scheme for Rehabilitation of Manual Scavengers (SRMS); | | (h) | Loans to Self Help Groups; | | (i) | Loans to distressed farmers indebted to non-institutional lenders; | | (j) | Loans to distressed persons other than farmers not exceeding Rs. 50,000 per borrower to prepay their debt to non-institutional lenders; | | (k) | Loans to individual women beneficiaries upto Rs. 50,000 per borrower; | | (l) | Loans sanctioned under (a) to (k) above to persons from minority communities as may be notified by Government of India from time to time. In States, where one of the minority communities notified is, in fact, in majority, item (l) will cover only the other notified minorities. These States/Union Territories are Jammu & Kashmir, Punjab, Meghalaya, Mizoram, Nagaland and Lakshadweep. | 4.37 The target for lending to weaker sections has not been achieved by the banks as a whole, although some individual banks have been achieving the target (Appendix 1.8). The following chart shows that in percentage terms, credit to the weaker sections as defined above has been increasing over the years and has come close to the stipulated target of 10 per cent (Chart 4.11). 4.38 The private sectors banks, especially new private sector banks, however, are lagging behind and are far below the set target. The target of weaker section is not applicable to foreign banks with branches less than 20. For the Foreign banks with 20 and above branches, the weaker section target is applicable since July 2012 and they have been given time upto March 2018 to achieve it. 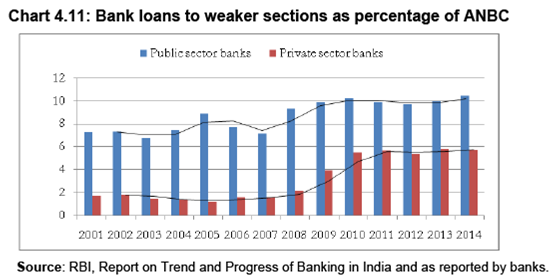 4.39 Considering that, of the priority sector lending, vulnerable sections of the society should get a reasonable share of bank credit, the Working Group recommends that existing categories and the target of 10 per cent of ANBC for loans to weaker sections may continue and be made applicable to all banks. However, it recommends that the extant loan limit up to Rs.50,000 for women as well as artisans and cottage and village industries may be raised to Rs.1,00,000. The Working Group recommends that only those women beneficiaries with a sanctioned loan limit of Rs.1,00,000, who are not covered by any of the other segments in the weaker section, may be eligible for inclusion. VIII. Social Infrastructure 4.40 As suggested by the Working Group earlier in this chapter, finance extended by banks for creation/ development of certain infrastructural facilities relating to agriculture (such as minor irrigation, development of market yards, etc.) is included under priority sector. 4.41 Given the importance of social infrastructure for development and its impact on ultimate credit absorption in rural and urban areas, the Working Group recommends that financing for building infrastructure for certain activities as specified below, in areas below Tier I, i.e., Tier II to Tier VI (Areas with population less than 1 lakh), may be treated as a separate category under priority sector, subject to a ceiling of Rs.5 crore per borrower: - Schools and health care facilities;
- Drinking water facilities and
- Sanitation facilities.
IX. Renewable Energy 4.42 Loans for generation and use of renewable energy, such as solar energy and biogas for households are already included under priority sector. In view of the increasing importance of non-conventional and renewable sources of energy and in order to give further impetus to this segment, it is recommended that bank loans up to Rs.10 crore to borrowers other than households, for purposes like solar based power generators, biomass based power generators, wind mills and micro-hydel plants and for non-conventional energy based public utilities viz. street lighting systems, remote village electrification, etc. be included under priority sector. For household sector the loan limit may be Rs.5 lakh. X. Bank loans for MFIs for on-lending 4.43 The Working Group recommends that the present classification of bank loans to MFIs for on-lending to priority sector categories may be continued. The proposed targets at a glance are as follows: | Targets | As percentage of ANBC or CEOBE | | Overall Priority Sector | 40% | | Agriculture | 18% | | Small and Marginal Farmers | 8% | | Micro Enterprises | 7.5% | | Weaker Sections | 10% | XI. Review of limits 4.44 The Working Group recommends that the various loan limits recommended may be reviewed once in three years. In addition, based on the experience gained, the targets and sub-targets recommended may also be revisited. 4.45 The various limits under priority sector are as follows:- | Sl. No. | Activity/purpose | Loan limit | | 1 | Loans against pledge/hypothecation of agricultural produce (including warehouse receipts) for a period not exceeding 12 months | Rs.50 lakh | | 2 | Loans to corporates including farmers' producer companies of individual farmers, partnership firms and co-operatives of farmers directly engaged in Agriculture and Allied Activities, viz., dairy, fishery, animal husbandry, poultry, bee-keeping, etc. | Rs.2 crore | | 3 | Loans to cooperative societies of farmers for disposing of the produce of members | Rs.5 crore | | 4 | Loans for transportation and marketing of agriculture produce | Rs.5 crore | | 5 | Loans to MSEs (service enterprises) | Rs.5 crore | | 6 | Loans to MEs (service enterprises) | Rs.10 crore | | 7 | Education loans | Rs.10 lakh | | 8 | Housing loans to individuals in metropolitan centres | Rs.28 lakh | | 9 | Housing loans- other centres | Rs.20 lakh | | 10 | Weaker sections- Individual women beneficiaries | Rs.1 lakh | | 11 | Weaker sections- Artisans, village and cottage industries | Rs.1 lakh | | 12 | Social infrastructure | Rs.5 crore | | 13 | Renewable Energy-Households | Rs.5 lakh | | 14 | Renewable Energy-Other than households | Rs.10 crore | XII. Monitoring of PSL 4.46 The current year’s targets for priority sectors and sub-targets will be computed based on Adjusted Net Bank Credit (ANBC) or credit equivalent of Off-Balance Sheet Exposures of preceding March 31st. The outstanding priority sector loans as on March 31st of the current year will be reckoned for achievement of priority sector targets and sub-targets. Presently, PSL compliance is monitored on the last day of March each year. The Working Group recommends that more frequent monitoring of PSL compliance by banks be done. To start with, it may be done on ‘quarterly’ basis. The Working Group recommends that PSL shortfall should be worked out based on the average shortfall (in Rupees) for the four quarters during the financial year. The base for determining the target achievement for each quarter end i.e. ANBC should be as of the corresponding date of the previous year to ensure that banks get sufficient time for planning and achieving the targets. XIII Reporting 4.47 The reporting format for PSL may be modified to capture the achievement of banks on the PSL targets /sub- targets recommended by the Working Group. While monitoring the lending to small and marginal farmers, it may have to be ensured that the format captures lending to Small and marginal farmers directly as well as through SHGs/JLGs, farmer producer organisations, etc. Banks may ensure a robust database on PSL and ensure accurate reporting. XIV Improving the credit culture 4.48 The Working Group observed that it would also be necessary to look at the credit delivery mechanism to ensure that credit reaches the intended beneficiaries and misuse of loans does not take place. The Group therefore, recommends that, to be eligible for PSL status, any borrowal account, including that to individual members of SHGs and JLGs, should necessarily be reported to one of the credit bureaus to qualify for PSL status. The information should also capture the borrower’s Aadhaar number which will help in identification of the borrower. The deadline for ensuring Aadhar seeding may be linked to the UIDAI deadline for completion of Aadhaar enrolment. A system of information sharing may be put in place between the credit bureaus. XIV Non-achievement of target 4.49 Presently, all scheduled commercial banks having shortfall in lending to priority sector and sub-sectors where targets have been stipulated, are required to contribute the allocated amounts, as announced in the Budget Speech every year and as decided by the Reserve Bank from time to time, towards the corpus of Rural Infrastructure Development Fund (RIDF) established with NABARD, and other Funds with NABARD/NHB/SIDBI. For the purposes of allocation to RIDF and other funds, the achievement of banks as on March 31st of the year is taken into account. 4.50 The corpus of RIDF and other funds over the last four years are as under:- | (Rs. crore) | | Particulars | Administering Institution | 2011-12 | 2012-13 | 2013-14 | 2014-15 | | RIDF | NABARD | 16000 | 15000 | 20000 | 25000 | | Separate window under RIDF for financing warehouse infrastructure | NABARD | 2000 | 5000 | - | | | Warehouse Infrastructure Fund | NABARD | - | - | 5000 | 5000 | | MSE Re-finance | SIDBI | 5000 | 5000 | 10000 | | | MSME-India Opportunities Venture Fund | SIDBI | - | 2000 | - | - | | Venture Capital Fund | SIDBI | | | | 10000 | | Rural Housing Fund | NHB | 3000 | 4000 | 6000 | 8000 | | Urban Housing Fund | NHB | - | - | 2000 | | | Affordable Housing Fund | NHB | | | | 4000 | | Short-term Co-operative Rural Credit Fund | NABARD | 10000 | 10000 | 30000 | 50000 | | Short Term RRB Credit Re-Finance Fund | NABARD | - | 10000 | 20000 | 20000 | | Long Term Rural Credit Fund | NABARD | - | - | - | 5000 | | Fund for food processing | NABARD | | | | 2000 | | Total | | 36000 | 51000 | 93000 | 129000 | 4.51 The Rural Infrastructure Development Fund (RIDF) was started in 1995-96, with a view to encouraging quick completion of on-going projects in rural infrastructure space. It was envisaged that creation of rural infrastructure under RIDF would improve the credit absorption capacity and enable banks to lend in these geographical areas and achieve their priority sector targets, obviating the need for such funds in due course. Subsequently, certain other funds, mainly in the nature of refinance funds, have been established with NABARD, SIDBI and NHB since 2008-09, for providing financial assistance to sectors such as MSME and housing, and to institutions such as co-operative banks and RRBs. As would be observed from the Table above, these funds now utilize a major portion of the shortfall of banks and have overshadowed RIDF. These types of funds go against the basic tenets of financial sector reforms initiated in early 1990s, and the recommendations of various committees, including the Committee on Financial System, where it was emphasized that Developmental Financial Institutions should meet their resource requirements through borrowing at market related interest rates. 4.52 The Working Group has recommended the mechanism of PSLCs to improve the efficiency in implementation of the priority sector mandates applicable to all scheduled commercial banks. Each bank can leverage on its strength and get a premium for its efficiency. This may also create the surplus which can be bought by banks that do not have the competence to lend to a certain sector. This demand and supply will create a market for such loans. This will also help to improve the cost efficiency, ensure enhanced credit flow to the desired sectors and would form a very important success element particularly in the area of financial inclusion. 4.53 The Working Group therefore, feels that once the framework suggested in the Report is implemented, banks may be better placed to achieve the target and sub-targets resulting in enhancement of direct credit by the banking system to the priority sector(s) as a whole. However, in case of shortfall, the prevailing penal provisions would continue. The need for more stringent measures such as imposition of monetary penalties could be considered either independently or in combination with the existing provisions after a period of three years of operationalisation of the PSLC market and based on the performance of banks in achievement of targets. Annex 2: Framework for Re-setting Agriculture Credit Target under PSL The leading considerations behind PSL can be broadly classified as: (a) economic and developmental - with the objective of aligning credit flows with Plan priorities; and (b) social - to ensure employment growth and equitable distribution of credit, particularly among small and vulnerable groups of population. In this milieu, there has been an argument that the share of agriculture in GDP is low and declining, and also that there is not enough credit absorption capacity for agriculture credit and hence, the PSL target for direct agriculture should be reduced. As against, standard argument put forward is like this – ‘the declining share of agriculture in GDP cannot be accepted as a valid reason for prescribing lower targets, as agriculture is an important sector considering the livelihood it generates for almost two-third of India’s population. It is also critical for ensuring food security and poverty alleviation. Besides, it needs to be borne in mind that this sector does not have recourse to other sources of finance such as equity, commercial papers, etc. The inherent weakness in the co-operative structure restricts its ability to cater the credit needs of the agricultural sector (Chakrabarty, 2012).25 In this context, taking the above into consideration, the Working Group presents a dynamic framework and defined a metric for setting agriculture credit target under PSL. It is based on the dynamics of data behaviour of agriculture’s contribution to growth (x1), employment (x2), and equity/distribution that are linked to agriculture credit as measured by its share in total credit in terms of number of accounts (x3). The trend of these 3 variables indicates that the shares of agriculture in GDP, employment and in number of credit accounts are declining over time (Chart 1). Over 31% of GDP was contributed by agriculture in 1988-89, which declined sharply to about 14% in 2011-12. During the same time, its share in employment (in total) declined from 67% to 48%. Share of number of agriculture loan accounts also fell but with a slower pace – from 45% in 1988-89 to 39% in 2011-12. 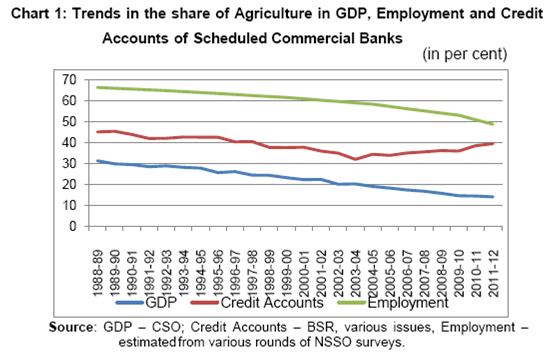 The metric in the form of an index is defined as the weighted aggregate of all 3 variables. As the purpose is to capture the variability, weights are derived using principal components analysis (PCA). Also all these variables pair-wise have high positive and statistically significant correlations. This feature helped to summarise the data well. First principal components explains more than 87% variance of the data and the weights assigned are: GDP – 0.614, employment – 0.584, and number of credit accounts – 0.53226. In terms of importance, as the data shows that all 3 variables play fairly equal role. Therefore, the index for the year ‘t’ is defined as: I(t) = 0.614xX1(t)+ 0.584xX2(t)+ 0.532xX3(t), xs are defined earlier but used in normalised form here. With this weighting structure, the Working Group recommends updating the agriculture PSL target of 18% dynamically with the following formula: target for the next year (t+1) = [1-{I(t+1) – I(t)}/I(t)] x18%. I(t) can go up or down depending on the trajectory of xs. But generally I(t) will have declining trend and the change between two consecutive years is expected to be marginal. So the Working Group recommends updating this every 3 years based on the average of xs. However, a degree of subjectivity could be warranted as the priority sector targeting in agriculture, as per the present framework, has still left a major part of the population untouched.
Chapter 5 Priority Sector Lending Certificates 5.1 The priority sector guidelines have evolved over a period of time. Besides direct lending by banks, investments in securitised assets and assignments/outright purchases of pool of assets, Inter Bank Participation Certificates (IBPCs) bought by banks on a risk sharing basis, credit to MFIs for on-lending to individuals and members of SHGs / JLGs for certain purposes, etc. have been allowed to be categorised as priority sector advances. Due to concerns regarding actual end use of lending through NBFCs, the avenue of on-lending through NBFCs was disallowed in 2011. Nevertheless, direct origin of credit has been the primary mechanism for banks to achieve their priority sector targets. 5.2 Direct credit origination may not be the most efficient method of credit delivery as it does not leverage the strengths of different banks in their respective areas of specialisation. Specialisation helps in efficient and optimal allocation of resources to bring down costs –a very important success element particularly in the area of financial inclusion. As stated in the Discussion Paper on the Banking Structure in India - The Way Forward (August 27, 2013), country‐level studies show that small, regional and local banks may perform very differently from large banks. In India also, some banks have built up expertise in credit appraisal and lending to target sectors. However, due to their smaller size, their ability to raise resources is limited. On the other hand, larger commercial banks and especially foreign banks (due to their limited presence), find it difficult to push credit to these segments. Their inability to manage smaller transactions and associated risks and lack of understanding of customer needs is often limited resulting in shortfall in achieving PSL targets. 5.3 Presently, investments by banks in Inter Bank Participation Certificates (IBPCs) on a risk sharing basis are eligible for classification under respective categories of priority sector, subject to certain conditions. However, as a route to achieve priority sector lending targets, it has remained confined primarily to issue of IBPCs by Regional Rural Banks (RRBs) to their sponsor banks. Some of the reasons for the IBPC scheme not taking off as emerged in discussions with NABARD and commercial banks are as under: -
Opacity of the market - As IBPCs are issued in the OTC market, there is no transparency and no structure in place to assess the volume available for issue, appropriate pricing or the potential counterparties; and - Credit Risk - The IBPCs have to be bought on risk- sharing basis for being eligible to be categorized as priority sector which reduces the incentive for the buying banks.
5.4 The Committee on Financial Sector Reform (CFSR) (Chairman: Dr Raghuram G Rajan) had proposed a concept of Priority Sector Lending Certificates (PSLCs) to allow a more efficient implementation of the priority sector lending mandate. The PSLCs were envisaged to separate the objective of transferring priority sector obligations from the credit risk transfer and refinancing aspects, which are co-mingled in the IBPC. While the PSLCs will be sold, the loans would continue to be on the books of the original lender. The deficient bank would only be buying a right to undershoot its priority sector-lending requirement by the amount of the certificate. If the loans default, for example, no loss would be borne by the certificate buyer. As stated in the CFSR, the merit of a scheme of this nature is that it would allow the most efficient lender to provide access to the poor, while finding a way for banks to fulfil their norms at lower cost. Essentially, the PSLC will be a market-driven interest subsidy to those who make priority sector loans. 5.5 The Working Group felt that Priority Sector Lending Certificates (PSLCs) will enable banks to meet their PSL requirements and allow leveraging of their comparative advantage. The market driven pricing of these certificates would make credit available at optimal cost through the originating bank and at the same time remove any unnecessary price arbitrage and inefficiency that bilateral transactions (in IBPCs) today entail. In the proposed model for PSLCs, the buyer (i.e. deficient bank) will pay a ‘price/fee’ to the seller bank for purchasing a specified amount of PSL obligation applicable for a particular date after which it will automatically be extinguished. 5.6 It would not be necessary for an issuer to have underlying assets on his books at the time of issue of PSLC or for the buyer to have a shortfall in obligation of that amount. The issuer could assess possible credit achievement during the year and issue PSLCs of the estimated surplus. The buyer could also estimate possible credit shortfall without the need for waiting till the time of such shortfall or he could also buy PSLCs with a view to trading it when premiums are higher. However, at the time of reporting PSL achievement to the Reserve Bank, the amount of PSLCs issued would be deducted from the achievement of the issuer. Hence, it would be necessary for him to have those loans on his books at the time of reporting or alternatively he would have to purchase PSLCs to meet any shortfall. This would add to efficiency in meeting targets, and create a deep and liquid forward market. However, to avoid possible risks of over estimation and to enable the smooth functioning of the market, banks would have to monitor their PSL target on a quarterly basis, in line with the recommendations of the Mor Committee. This would avoid bunching of issuances in the last quarter. 5.7 Further, in view of the fact that the PSL target is for a particular year and the PSLCs are issued to enable the buyers to take advantage of the overall surplus in the system for that year, PSLCs cannot be carried forward to the next year. Thus, the benefit for PSLCs would be given only in the year of origination. 5.8 In the future, the Reserve Bank may also intervene in the market for PSLCs to encourage further lending to a particular sector. Structure of the Scheme Purpose: To enable banks failing to achieve the priority sector lending target and sub-targets to do so through purchase of these instruments. Nature of the Instruments: A certificate that gives the buyer a credit right to undershoot its priority sector-lending requirement by the amount of the certificate. These certificates would be tradable in nature, and would have a date (quarter end) when they can be used. Issuers: Scheduled Commercial Banks (SCB), Regional Rural Banks (RRB), Local Area Banks (LAB), and Urban Cooperative Banks (UCB) who have originated PSL eligible category loans. In future, Small Finance Banks would also be eligible as issuers. Subscribers: Any bank which has PSL targets. Sector Specific: PSLCs would count specifically towards PSL achievement and thus would be sector – sub-sector specific where particular targets have been mandated. Therefore different kinds of PSLCs would be issued – PSLC overall (which would count for overall target of 40 per cent); PSLC – Agriculture (which would count for achieving the 18 per cent Agriculture lending target; PSLC-SF/MF (which would count towards the 8 per cent SF/MF sub target, PSLC-Micro Enterprises which would count towards the Micro target of 7.5 per cent and PSLC-Weaker Sections which would count towards the 10 per cent target for Weaker Sections). The issuer would have to have excess PSL assets in the relevant category, equivalent to the amount of PSLC issued, in its books at the time of reporting to the Reserve Bank regarding PSL achievements, or would have to purchase PSLCs of corresponding amount, or would have report a shortfall. Amount counting for achievement: The amount of issue outstanding on the reporting date would be deducted from the PSL achievement, sub-sector wise, of the issuer/seller. For the buyer, the amount purchased and outstanding on the reporting date would be added to his PSL achievement, sub-sector wise. However, there would be no limit on the amount of PSLCs that could be purchased for achievement of various targets. Amount issued: As the PSLCs could be issued without an underlying, there is a risk that the issuing bank may overestimate its achievement and fall short on reporting date, thereby subjecting itself to penalties. Therefore, no bank can issue PSLCs of more than 50 percent of last year’s PSL achievement or excess over the last year’s PSL achievement, whichever is higher. Credit Risk: There will be no transfer of credit risk. Maturity of the instruments: The PSLC will be issued to be applicable as on a specific date within the financial year and will automatically expire after that date as the benefit would only accrue to the year of issue. Pricing: The purchaser of PSLCs will be purchasing only a credit right of a determined amount through payment of an upfront market determined fee to the issuer/seller of PSLCs. Trading: The PSLCs can be issued and traded through an on-line platform where both issuers and buyers are registered. Documentation: Would be standardised. Standard lot size would be prescribed. Disclosures: Both issuer and buyer would be required to report amount of PSLCs issued/bought in their annual report. Reporting: This would be reported to the Reserve Bank on reporting dates for assessing PSL achievements. 5.9 A Flow Chart of the process is given below:
Appendix | Appendix 1.1: Outstanding Credit to Priority Sector | | (Rs.crore) | | Year | PSBs | As % of ANBC | Pvt Bks | As % of ANBC | Foreign Bks | As % of ANBC | All banks | | 2001 | 146,546 | 43.0 | 21,549 | 38.2 | 11,835 | 34.1 | 179,930 | | 2002 | 171,185 | 43.1 | 25,709 | 40.8 | 13,414 | 46.7 | 210,308 | | 2003 | 203,095 | 42.5 | 36,705 | 44.2 | 14,848 | 33.8 | 254,648 | | 2004 | 245,672 | 44.0 | 52,860 | 47.4 | 18,276 | 34.8 | 316,808 | | 2005 | 310,093 | 43.2 | 69,384 | 43.3 | 23843 | 35.3 | 403320 | | 2006 | 410,379 | 40.3 | 106,566 | 42.8 | 30,439 | 34.6 | 547,384 | | 2007 | 521,180 | 39.6 | 143,768 | 42.7 | 37,835 | 33.4 | 702,783 | | 2008 | 608,963 | 44.6 | 163,223 | 47.5 | 50,301 | 39.8 | 822,487 | | 2009 | 719,497 | 42.5 | 190,303 | 46.8 | 55,483 | 34.2 | 965,283 | | 2010 | 864,562 | 41.7 | 215,551 | 46.0 | 60,290 | 35.1 | 1,140,403 | | 2011 | 1,028,615 | 41.3 | 248,828 | 46.6 | 66,618 | 39.6 | 1,344,061 | | 2012 | 1,129,990 | 37.4 | 286,420 | 39.4 | 80,538 | 40.9 | 1,496,949 | | 2013 | 1,284,880 | 36.4 | 327,317 | 37.5 | 85,011 | 35.2 | 1,697,208 | | 2014 | 1,618,971 | 39.4 | 464,456 | 43.9 | 90,723 | 36.0 | 2,174,150 | | Source: RBI, The Report of Progress of Banking in India and as reported by banks |
| Appendix 1.2: Total Agriculture Credit-Domestic Banks | | (Rs. crore) | | Year | PSBs | As % of ANBC | Pvt Bks | As % of ANBC | ASCBs | Y-O-Y
% Growth | % Total Agri to ANBC | | 2001 | 53,685 | 15.7 | 5,394 | 9.6 | 59,079 | | 14.9 | | 2002 | 63,082 | 15.9 | 8,022 | 12.7 | 71,104 | 20 | 15.5 | | 2003 | 73,507 | 15.4 | 11,872 | 14.3 | 85,378 | 20 | 15.2 | | 2004 | 86,186 | 15.4 | 17,651 | 15.8 | 103,837 | 22 | 15.5 | | 2005 | 112,474 | 15.7 | 21,472 | 13.4 | 133,947 | 29 | 15.3 | | 2006 | 154,900 | 15.2 | 36,185 | 14.5 | 191,084 | 43 | 15.1 | | 2007 | 205,090 | 15.6 | 52,055 | 15.5 | 257,144 | 35 | 15.5 | | 2008 | 248,685 | 18.2 | 57,702 | 16.8 | 306,386 | 19 | 17.9 | | 2009 | 296,856 | 17.5 | 76,164 | 18.7 | 373,032 | 22 | 17.8 | | 2010 | 370,729 | 17.9 | 89,768 | 19.2 | 460,452 | 23 | 18.1 | | 2011 | 414,990 | 16.6 | 92,136 | 17.3 | 507,125 | 10 | 16.8 | | 2012 | 475,148 | 15.7 | 100,900 | 13.9 | 582,439 | 15 | 15.6 | | 2013 | 532801 | 15.1 | 111,970 | 12.8 | 646,335 | 11 | 14.7 | | 2014 | 687,242 | 16.7 | 146,687 | 13.9 | 905,807 | 40 | 17.5 | | Source: RBI, The Report of Progress of Banking in India and as reported by banks |
| Appendix 1.3: Direct Agriculture Credit-Domestic Banks | | (Rs. crore) | | Year | PSBs | As % of ANBC | Pvt Bks | As % of ANBC | ASCBs | Y-O-Y
% Growth | % to ANBC | | 2001 | 38,003 | 11.15 | 2,269 | 4.0 | 40,272 | | 10.1 | | 2002 | 44,909 | 11.31 | 2,533 | 4.0 | 47,442 | 18 | 10.3 | | 2003 | 51,799 | 10.84 | 5,201 | 6.3 | 57,000 | 20 | 10.2 | | 2004 | 61,957 | 11.09 | 8,717 | 7.8 | 70,674 | 24 | 10.5 | | 2005 | 82,613 | 11.52 | 12,157 | 7.6 | 94,770 | 34 | 10.8 | | 2006 | 111,636 | 10.97 | 22,317 | 9.0 | 133,953 | 41 | 10.6 | | 2007 | 146,941 | 11.15 | 28,013 | 8.3 | 174,954 | 31 | 10.6 | | 2008 | 176,135 | 12.91 | 37,349 | 10.9 | 213,484 | 22 | 12.5 | | 2009 | 215,635 | 12.73 | 46,511 | 11.4 | 262,146 | 23 | 12.5 | | 2010 | 265,071 | 12.78 | 52,112 | 11.1 | 317,183 | 21 | 12.5 | | 2011 | 300,084 | 12.03 | 60,043 | 11.3 | 360,127 | 14 | 11.9 | | 2012 | 366,396 | 12.14 | 73,971 | 10.2 | 440,367 | 22 | 11.8 | | 2013 | 449,193 | 12.72 | 87,225 | 10.0 | 536,418 | 22 | 12.2 | | 2014 | 525,088 | 12.77 | 100,753 | 9.5 | 625,841 | 17 | 12.1 | | Source: RBI, The Report of Progress of Banking in India and as reported by banks |
| Appendix 1.4: Indirect Agriculture Credit-Domestic Banks | | (Rs.crore) | | Year | PSBs | As % of ANBC | Pvt Bks | As % of ANBC | ASCBs | Y-O-Y
% Growth | % to ANBC | | 2001 | 15,682 | 4.6 | 3,125 | 5.5 | 18,807 | | 4.7 | | 2002 | 18,173 | 4.6 | 5,489 | 8.7 | 23,662 | 31 | 5.1 | | 2003 | 21,707 | 4.5 | 6,671 | 8.0 | 28,378 | 26 | 5.1 | | 2004 | 24,229 | 4.3 | 8,934 | 8.0 | 33,163 | 22 | 4.9 | | 2005 | 29,862 | 4.2 | 9,315 | 5.8 | 39,177 | 25 | 4.5 | | 2006 | 43,264 | 4.3 | 13,867 | 5.6 | 57,131 | 60 | 4.5 | | 2007 | 58,149 | 4.4 | 24,041 | 7.1 | 82,190 | 58 | 5.0 | | 2008 | 72,550 | 5.3 | 20,352 | 5.9 | 92,902 | 18 | 5.4 | | 2009 | 81,223 | 4.8 | 29,663 | 7.3 | 110,886 | 25 | 5.3 | | 2010 | 105,658 | 5.1 | 37,611 | 8.0 | 143,269 | 40 | 5.6 | | 2011 | 114,906 | 4.6 | 32,092 | 6.0 | 146,998 | 4 | 4.9 | | 2012 | 111,872 | 3.7 | 30,200 | 4.2 | 142,072 | (4) | 3.8 | | 2013 | 83,607 | 2.4 | 26310 | 3.0 | 109,917 | (29) | 2.5 | | 2014* | 192,699 | 4.7 | 87267 | 8.2 | 279,966 | 203 | 5.4 | Source: RBI, The Report of Progress of Banking in India and as reported by banks.
*2014 figures include RIDF and other deposits outstanding with NABARD. |
| Appendix 1.5: Share of short term and long term loans to agriculture | | (Rs.crore) | | Year | Short Term Loans | Long term Loans | Total | Share of short term loans (% to total) | Share of Long Term loans (% to total) | | 1990-91 | 42.35 | 127.97 | 170.32 | 24.87 | 75.13 | | 1991-92 | 46.31 | 123.51 | 169.82 | 27.27 | 72.73 | | 1992-93 | 49.88 | 133.00 | 182.88 | 27.28 | 72.72 | | 1993-94 | 54.25 | 136.88 | 191.13 | 28.38 | 71.62 | | 1994-95 | 61.54 | 147.66 | 209.20 | 29.42 | 70.58 | | 1995-96 | 71.73 | 162.55 | 234.28 | 30.62 | 69.38 | | 1996-97 | 87.66 | 175.61 | 263.27 | 33.30 | 66.70 | | 1997-98 | 95.22 | 189.24 | 284.46 | 33.47 | 66.53 | | 1998-99 | 108.21 | 189.98 | 298.19 | 36.29 | 63.71 | | 1999-00 | 126.10 | 208.32 | 334.42 | 37.71 | 62.29 | | 2000-01 | 154.42 | 228.28 | 382.70 | 40.35 | 59.65 | | 2001-02 | 188.82 | 262.24 | 451.06 | 41.86 | 58.14 | | 2002-03 | 232.11 | 305.93 | 538.04 | 43.14 | 56.86 | | 2003-04 | 319.82 | 361.21 | 681.03 | 46.96 | 53.04 | | 2004-05 | 427.98 | 527.21 | 955.19 | 44.81 | 55.19 | | 2005-06 | 599.71 | 756.32 | 1356.03 | 44.23 | 55.77 | | 2006-07 | 760.06 | 930.12 | 1690.18 | 44.97 | 55.03 | | 2007-08 | 961.52 | 1066.44 | 2027.96 | 47.41 | 52.59 | | 2008-09 | 1262.85 | 1298.34 | 2561.19 | 49.31 | 50.69 | | 2009-10 | 1676.23 | 1478.13 | 3154.36 | 53.14 | 46.86 | | 2010-11 | 1932.62 | 1643.22 | 3575.84 | 54.05 | 45.95 | | 2011-12 | 2690.30 | 1742.68 | 4432.98 | 60.69 | 39.31 | | Source: Handbook of Statistics of Indian Economy |
| Appendix 1.6: Bank Loans to Medium Enterprises | | (Number of accounts in lakh and amount Rs.crore) | | Quarter Ended | Public Sector Banks | Private Sector Banks | Foreign Banks | All Scheduled Commercial banks | | No. of A/c | Amt. O/s | No. of A/c | Amt. O/s | No. of A/c | Amt O/s | No. of A/c | Amt O/s | | March 2011 | 0.46 | 109145.61 | 1.40 | 18858.76 | 0.01 | 1023.11 | 1.87 | 129027.48 | | March 2012 | 0.68 | 136285.93 | 0.25 | 15742.88 | 0.00172 | 1592.27 | 0.9318 | 153621.08 | | March 2013 | 0.77 | 141065.93 | 0.37 | 27516.00 | 0.04528 | 13233.47 | 1.18 | 181815.40 | | March 2014 | 0.46 | 138414.69 | 0.37 | 45887.40 | 0.01166 | 4339.11 | 0.84 | 188641.19 | | Source: As reported by banks |
| Appendix 1.7: Export credit outstanding | | (Rs.crore) | | Bank Group | 2009 | 2010 | 2011 | 2012 | 2013 | 2014 | | Public | 92171.70 | 130800.62 | 110719.05 | 128994.05 | 135724.22 | 149072.86 | | Private Sector Banks | 11301.32 | 16975.92 | 16990.29 | 20696.16 | 24335.21 | 35446.81 | | Foreign | 26530.65 | 46661.05 | 41290.06 | 55072.22 | 62787.55 | 67799.72 | | Total | 130003.67 | 194437.59 | 168999.40 | 204762.43 | 222846.98 | 252319.39 | | Source: As reported by banks |
| Appendix 1.8: Credit to Weaker Sections under priority sector | | (Rs.crore) | | Year | PSBs | As % of ANBC | Pvt Bks | As % of ANBC | ASCBs | Y-O-Y
% Growth | % o ANBC | | 2001 | 24,805 | 7.3 | 958 | 1.7 | 25,763 | | 6.5 | | 2002 | 28,975 | 7.3 | 1,142 | 1.8 | 30,117 | 17 | 6.5 | | 2003 | 32,303 | 6.8 | 1,223 | 1.5 | 33,526 | 11 | 6.0 | | 2004 | 41,588 | 7.4 | 1,495 | 1.3 | 43,083 | 29 | 6.4 | | 2005 | 63,492 | 8.9 | 1,914 | 1.2 | 65,406 | 52 | 7.5 | | 2006 | 78,379 | 7.7 | 3,909 | 1.6 | 82,288 | 26 | 6.5 | | 2007 | 94,285 | 7.2 | 5,229 | 1.6 | 99,514 | 21 | 6.0 | | 2008 | 126,935 | 9.3 | 7,228 | 2.1 | 134,163 | 35 | 7.9 | | 2009 | 166,843 | 9.9 | 15,844 | 3.9 | 182,687 | 36 | 8.7 | | 2010 | 212,214 | 10.2 | 25,691 | 5.5 | 237,905 | 30 | 9.4 | | 2011 | 246,316 | 9.9 | 30,097 | 5.6 | 276,413 | 16 | 9.1 | | 2012 | 293,960 | 9.7 | 38,929 | 5.4 | 332,889 | 20 | 8.9 | | 2013 | 351,034 | 9.9 | 50,537 | 5.8 | 401,571 | 21 | 9.1 | | 2014 | 433,943 | 10.6 | 60,104 | 5.7 | 494,047 | 23 | 9.6 | | Source: As reported by banks |
List of Abbreviations | ANBC | Adjusted Net Bank Credit | | ASCBS | All Scheduled Commercial Banks | | BSR | Basic Statistical Return | | BVAR | Bayesian Vector Auto Regression | | CAGR | Compounded Annual Growth Rate | | CEOBE | Credit Equivalent of Off-Balance Sheet Exposure | | DFI | Development Financial Institutions | | DRI | Differential Rate of Interest | | DGFT | Directorate General of Foreign Trade | | DLP | Directed Lending Programmes | | EWS | Economically Weaker Sections | | GDP | Gross Domestic Product | | GoI | Government of India | | GVA | Gross Value Added | | IBPC | Inter Bank Participation Certificate | | JLG | Joint Liability Group | | LIG | Lower Income Group | | MDGs | Millennium Development Goals | | ME | Medium Enterprise | | MIG | Medium Income Group | | MFI | Micro Finance Institution | | MSE | Micro and Small Enterprise | | MSME | Micro, Small and Medium Enterprise | | MSMED Act | Micro, Small and Medium Enterprise Development Act | | NBFC | Non-Banking Finance Company | | NRLM | National Rural Livelihoods Mission | | NULM | National Urban Livelihoods Mission | | OTC | Over The Counter | | PACS | Primary Agricultural Credit Societies | | PSL | Priority Sector Lending | | PSLC | Priority Sector Lending Certificates | | RIDF | Rural Infrastructure Development Fund | | RRB | Regional Rural Bank | | SBA | Small Borrowal Account | | SCB | Scheduled Commercial Bank | | SME | Small and Medium Enterprises | | SHG | Self-Help Group | | SRLM | State Rural Livelihoods Mission | | SVAR | Structural Vector Auto Regression | | UN | United Nations |
|