The overall risks to the banking sector remained elevated due to asset quality concerns. Between March and September 2017, the gross non-performing advances (GNPA) ratio of scheduled commercial banks (SCBs) increased from 9.6 per cent to 10.2 per cent and the stressed advances ratio marginally increased from 12.1 per cent to 12.2 per cent. Public sector banks (PSBs) registered GNPA ratio at 13.5 per cent and stressed advances ratio at 16.2 per cent in September 2017. The macro stress test for credit risk indicates that under the baseline macro scenario, the GNPA ratio may increase to 10.8 per cent by March 2018 and further to 11.1 per cent by September 2018. The network analysis indicates that the degree of interconnectedness in the banking system has decreased gradually since 2012. The joint solvency-liquidity contagion analysis shows that losses due to default of a bank have declined. Section I Scheduled commercial banks 2.1 In this section, the soundness and resilience of scheduled commercial banks (SCBs) is discussed under two broad sub-heads: i) performance and ii) resilience, the latter using macro stress tests through scenarios and single factor sensitivity analyses1. Performance Credit and deposit growth 2.2 Credit growth of SCBs, on a y-o-y basis, increased from 4.4 per cent to 6.2 per cent between March and September 2017. The public sector banks’ (PSBs) credit growth increased from 0.7 per cent to 2.2 per cent during the same period reversing the declining trend observed during past two years. Emerging risks due to muted credit growth have been discussed in Chapter 1 (para 1.10). On the other hand, deposit growth of SCBs, on a y-o-y basis, decelerated from 11.1 per cent to 7.8 per cent between March and September 2017. The decline in deposit growth is observed across all bank groups (Chart 2.1). Soundness – Capital adequacy and leverage ratio 2.3 Capital to risk-weighted asset ratio (CRAR) of SCBs increased from 13.6 per cent to 13.9 per cent between March and September 2017 largely due to an improvement for private sector banks (PVBs). Common equity tier (CET) 1 leverage ratio2 of SCBs also improved from 6.0 per cent to 6.2 per cent during the same period (Chart 2.2). Asset quality 2.4 The gross non-performing advances (GNPA) ratio3 of SCBs increased from 9.6 per cent to 10.2 per cent between March and September 2017, whereas, their restructured standard advances (RSA) ratio declined from 2.5 per cent to 2.0 per cent. The stressed advances (SA) ratio4 rose marginally from 12.1 per cent to 12.2 per cent during the same period. GNPA ratio of PSBs increased from 12.5 per cent to 13.5 per cent between March and September 2017. Stressed advances ratio of PSBs rose from 15.6 per cent to 16.2 per cent during the period (Chart 2.3a). 2.5 The net non-performing advances (NNPA) as a percentage of total net advances increased from 5.5 per cent to 5.7 per cent between March and September 2017. PSBs recorded distinctly higher NNPA ratio of 7.9 per cent (Chart 2.3b). 2.6 The GNPAs of all SCBs increased by 18.5 per cent on a y-o-y basis in September 2017. PVBs registered a higher increase in GNPAs (40.8 per cent) as compared to their public sector counterparts (17.0 per cent) (Chart 2.4a). NNPAs of all SCBs increased by 11.1 per cent on a y-o-y basis in September 2017 (Chart 2.4b). 2.7 From an analysis of the slippage ratio5 of 27 banks (accounting for about 87 per cent of the total assets of the banking system), the median as well as the tails are showing signs of moderation. The right tail observations (indicating a high conversion to NPAs) mostly pertain to PSBs (Chart 2.5). 2.8 The asset quality of SCBs deteriorated across broad sectors between March and September 2017 with the industrial sector leading this cohort (Chart 2.6). 2.9 Among the major industry sub-sectors, mining and quarrying, food processing, engineering, construction and infrastructure registered increase in their stressed advances ratios between March and September 2017. The asset quality of sub-sectors such as textiles, rubber, cement, basic metals and vehicles, however, improved during the same period (Chart 2.7). Credit quality of large borrowers6 2.10 The share of large borrowers both in total SCBs’ loans as well as GNPAs declined between March and September 2017 (Chart 2.8). 2.11 The total stressed advances of large borrowers increased by 2.4 per cent between March and September 2017. Advances to large borrowers classified as special mention accounts-27 (SMA-2) also increased sharply by 56.5 per cent during the same period (Chart 2.9). 2.12 The GNPA ratio of large borrowers increased from 14.6 per cent to 15.5 per cent between March and September 2017. The GNPA ratios went up for both PSBs and PVBs, whereas, the same came down for foreign banks (FBs) (Chart 2.10). 2.13 The share of standard advances (excluding restructured standard advances) in total funded amount outstanding of large borrowers declined from 80.9 per cent to 80.6 per cent between March and September 2017. The top 100 large borrowers (in terms of outstanding funded amounts) accounted for 15.5 per cent of credit and 25.0 per cent of GNPAs of SCBs (Chart 2.11 and 2.12).
Asset quality vis-à-vis capital adequacy of SCBs 2.14 Banks which have relatively lower asset quality, also tend to have lower capital adequacy as shown by the negative correlation between CRAR and the stressed advances ratio. This negative association between asset quality and capital adequacy which was low at (-)0.18 in March 2011 increased sharply to (-)0.74 by September 2017 (Chart 2.13). 2.15 While assessing the risk absorbing capacity of banks, it was found that all PSBs and some PVBs had a negative provisioning gap assuming a benchmark provision coverage (PC) at 50 per cent.8 In addition, negative returns on the assets of under-provisioned PSBs may hinder their ability to further build-up their loss absorption capacity (Chart 2.14). Profitability 2.16 SCBs’ return on assets (RoA) remained unchanged at 0.4 per cent between March and September 2017 while their return on equity (RoE) declined from 4.3 per cent to 4.2 per cent. PSBs have continued to record negative profitability ratios since March 2016 (Chart 2.15). Risks Banking stability indicator 2.17 The banking stability indicator (BSI)9 shows that the risks to the banking sector remain at an elevated level weighed down by further asset quality deterioration (Charts 2.16 and 2.17).
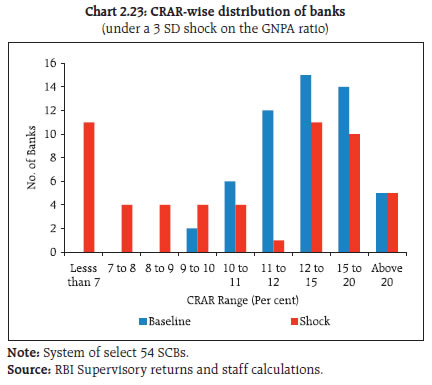
Resilience – Stress tests Macro stress test – Credit risk 2.18 The Indian banking system’s resilience to macroeconomic shocks was tested through a macro stress test for credit risk. This test assumed baseline and two (medium and severe) adverse macroeconomic risk scenarios (Chart 2.18). The adverse scenarios were derived based on standard deviations in the historical values of the macroeconomic variables: up to 1 standard deviation (SD) for medium risk and 1.25 to 2 SD for severe risk (10-year historical data). 2.19 The stress test indicated that under the baseline scenario, the GNPA ratio of all SCBs may increase from 10.2 per cent in September 2017 to 10.8 per cent by March 2018 and further to 11.1 per cent by September 2018. However, if the macroeconomic conditions deteriorate, the GNPA ratio may increase further under such consequential stress scenarios (Chart 2.19). 2.20 Under the assumed baseline macro scenario, six banks have CRAR below the minimum regulatory level of 9 per cent by September 2018. However, if the macro conditions deteriorate, CRAR of more banks in the stress test goes below the minimum regulatory requirements. Under the severe stress scenario, the system level CRAR declines from 13.5 per cent in September 2017 to 11.5 per cent by September 2018. The recent capitalisation plan announced by the GoI for PSBs is expected to significantly augment capital buffers of affected banks as also the credit growth (Chart 2.20). 2.21 Under the severe stress scenario, seven banks have common equity tier (CET) 1 capital to risk-weighted assets ratio below the minimum regulatory required level of 5.5 per cent by September 2018. The system level CET 1 capital ratio declines from 10.2 per cent in September 2017 to 8.7 per cent by September 2018 (Chart 2.21). Sensitivity analysis: Bank level11 2.22 A number of single factor sensitivity stress tests12 (top-down) were carried out on SCBs13 to assess their vulnerabilities and resilience under various scenarios14. The resilience of SCBs with respect to credit, interest rate, equity prices and liquidity risks was studied through the top-down sensitivity analysis by imparting extreme but plausible shocks. The results are based on September 2017 data. Credit risk 2.23 A severe credit shock is likely to impact the capital adequacy and profitability of a significant number of banks, mostly PSBs. The impact of various static credit shocks for banks showed that the system level CRAR will remain above the required minimum of 9 per cent. Under a severe shock of 3 SD15 (that is, if the average GNPA ratio of select SCBs moves up to 16.6 per cent from 10.6 per cent), the system level CRAR and tier-1 CRAR will decline to 10.6 per cent and 8.1 per cent respectively. The capital losses at the system level could be about 23.6 per cent. Reverse stress tests results show that a shock of 4.54 SD would bring down the system level CRAR to 9 per cent. On the other hand, the SCBs would lose their entire profit if the GNPA ratio moves up by 0.77 SD to 12.1 per cent. At the individual bank-level, the stress test results show that 19 banks having a share of 39.1 per cent of SCBs’ total assets fail to maintain the required CRAR under the shock of a 3 SD increase in GNPAs. PSBs were found to be severely impacted with the CRAR of 17 PSBs going down below 9 per cent (Charts 2.22 and 2.23). 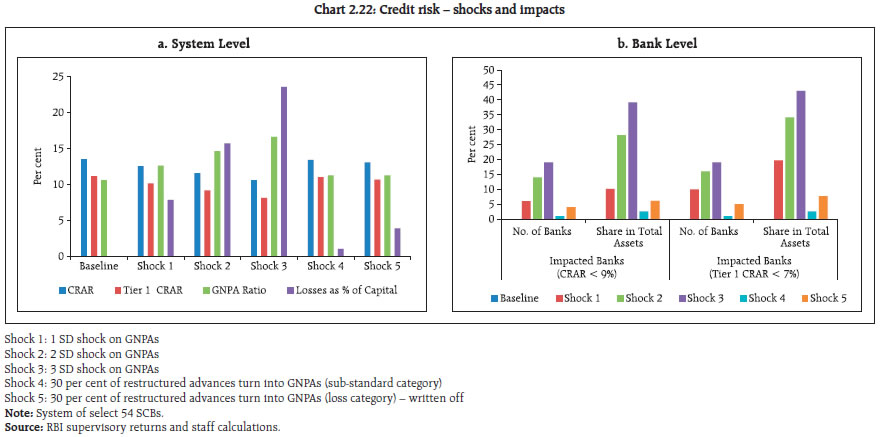
 Credit concentration risk 2.24 Stress tests on banks’ credit concentration risks, considering top individual borrowers according to their stressed advances showed that the impact16 (under three different scenarios) was significant for nine banks, comprising about 15 per cent of the assets. These banks fail to maintain a 9 per cent CRAR in at least one of the scenarios. The impact could be 87 per cent of the profit before tax (PBT) under the scenario of a default by the topmost stressed borrower. The impact17 on CRAR at the system level under the assumed scenarios of failure of the top one, two and three stressed borrowers will be 64, 102 and 127 basis points (Chart 2.24). 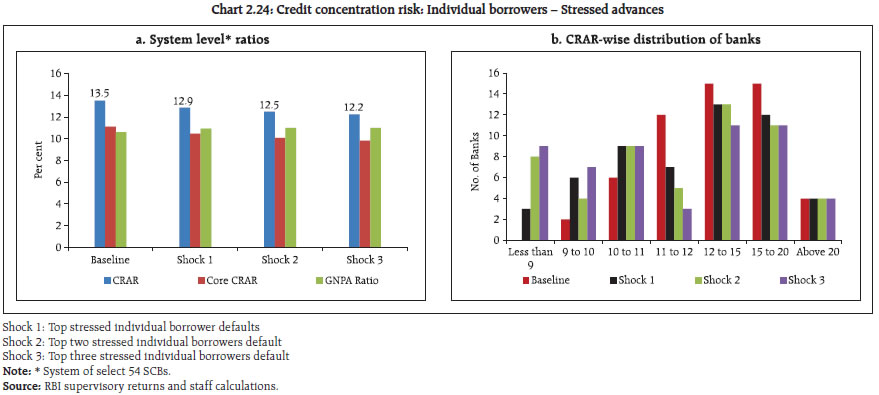 2.25 Stress tests on banks’ credit concentration risks, considering top individual borrowers according to their exposure, showed that the impact18 (under three different scenarios) was significant for one bank, accounting for about 2.6 per cent of total assets, which fail to maintain the mandated 9 per cent CRAR. The losses could be 45 per cent of PBT under the scenario of a default by the topmost individual borrower of each bank. There will be a complete erosion of the profits of the banking sector under the scenario of a default by the topmost 3 borrowers of each bank. The impact on CRAR at the system level under the assumed scenario of default by the top three individual borrowers of each bank (shock 3) will be around 77 basis points (Chart 2.25).  2.26 Stress tests on credit concentration risks on account of assumed failure of group borrowers show that the losses could be around 6 per cent of the aggregated capital of banks under the assumed scenarios of default19 by the top group borrower. The losses could be about 11 per cent in case of default by the top 2 group borrowers. As many as six banks will not be able to maintain their CRAR at 9 per cent if top 3 group borrowers of each individual bank default (Table 2.1). | Table 2.1: Credit concentration risk: Group borrowers – Exposure | | Shocks | System level* | Bank level | | CRAR | Core CRAR | GNPA ratio | Losses as % of Capital | Impacted Banks (CRAR < 9%) | | Baseline (Before shock) | 13.5 | 11.1 | 10.6 | --- | No. of Banks | Share in Total Assets of SCBs (in %) | | Shock 1 The top 1 group borrower defaults | 12.7 | 10.3 | 14.4 | 6.3 | 2 | 4.2 | | Shock 2 The top 2 group borrowers default | 12.1 | 9.7 | 17.3 | 11.1 | 4 | 7.1 | | Shock 3 The top 3 group borrowers default | 11.6 | 9.2 | 19.8 | 15.1 | 6 | 11.4 | Note: * System of select 52 SCBs.
Source: RBI supervisory returns and staff calculations | Sectoral credit risk 2.27 Credit risk arising from exposure to the infrastructure sector (specifically power, transport and telecommunications) was examined through a sectoral credit stress test where the GNPA ratio of the sector was assumed to increase by a fixed percentage point impacting the overall GNPA ratio of the banking system. The results show that shocks to the infrastructure segment will considerably impact the profitability of banks, with the most severe shocks (15 per cent of restructured standard advances and 10 per cent of standard advances becoming NPAs and moving to the sub-standard category) wiping out about 87 per cent of the profits. The most significant effect of the single factor shock appears to be on the power sector (Chart 2.26). Interest rate risk 2.28 For investments under available for sale (AFS) and held for trading (HFT) categories (direct impact) a parallel upward shift of 2.5 percentage points in the yield curve will lower CRAR by about 123 basis points at the system level (Table 2.2). At the disaggregated level, four banks accounting for 5.3 per cent of the total assets were impacted adversely and their CRAR fell below 9 per cent. The total loss of capital at the system level is estimated to be about 10.3 per cent. The assumed shock of a 2.5 percentage points parallel upward shift of the yield curve on the held to maturity (HTM) portfolios of banks, if marked-to-market, reduces the CRAR by about 280 basis points resulting in 19 banks’ CRAR falling below 9 per cent. | Table 2.2: Interest rate risk – Bank groups – shocks and impacts | | (under a shock of 250 basis points parallel upward shift of the INR yield curve) | | (per cent) | | | Public sector banks | Private sector banks | Foreign banks | All SCBs | | AFS | HFT | AFS | HFT | AFS | HFT | AFS | HFT | | Modified duration | 3.5 | 6.1 | 2.0 | 1.6 | 1.4 | 2.0 | 1.4 | 2.0 | | Share in total investments | 41.9 | 0.3 | 32.6 | 5.1 | 91.0 | 9.8 | 42.5 | 2.1 | | Reduction in CRAR (bps) | 165 | 53 | 116 | 123 | | Source: RBI supervisory returns and staff calculations. | Equity price risk 2.29 Under the equity price risk, the impact of a shock due to fall in the equity prices on bank capital and profit was examined. The system-wide CRAR declines by 41 basis points from the baseline under the scenario of 55 per cent drop in equity prices (Chart 2.27). At the individual bank-level, CRAR of only one bank falls marginally below 9 per cent, while two banks, accounting for 4.4 per cent of the total assets, have their tier 1 CRAR below the regulatory mandate of 7 per cent. Stressed profit of five banks turns negative. Liquidity risk: Impact of deposit run-off on liquid stocks 2.30 The liquidity risk analysis captured the impact of deposit run-off and increased demand for the unutilised portions of credit lines which were sanctioned/committed/guaranteed. Banks, in general, are in a position to withstand liquidity shocks with their high quality liquid assets (HQLA)20. In assumed scenarios, there will be increased withdrawals of uninsured deposits21. Simultaneously, there will also be increased demand for credit resulting in an attempt to withdraw unutilised portions of sanctioned working capital limits as well as utilisation of credit commitments and guarantees extended by banks to their customers. 2.31 Using their HQLAs required for meeting day-to-day liquidity requirements, most banks (49 out of the 54 banks in the sample) remain resilient in a scenario of assumed sudden and unexpected withdrawals of around 12 per cent of deposits along with the utilisation of 75 per cent of their committed credit lines (Chart 2.28). Stress testing the derivatives portfolio of banks: Bottom-up stress tests 2.32 A series of bottom-up stress tests (sensitivity analysis) on derivative portfolios were conducted for select sample banks22 with the reference date as September 30, 2017. The shocks on interest rates ranged from 100 to 250 basis points, while 20 per cent appreciation/depreciation shocks were assumed for foreign exchange rates. The stress tests were carried out for individual shocks on a stand-alone basis. 2.33 In the sample, the derivatives portfolio for most of the PSBs and PVBs (barring one bank) registered small marked-to-market (MTM) values, while FBs had a relatively large positive as well as negative MTM. Most of the PSBs and PVBs had positive net MTM, while most of the FBs recorded negative net MTM (Chart 2.29). 2.34 The stress test results show that the average net impact of interest rate shocks on sample banks was negligible. The results of foreign exchange shock scenarios show that the effect of a shock seemed to be normalising in September 2017 after a previous spike (Chart 2.30). Section II Scheduled urban co-operative banks Performance 2.35 At the system level,23 the CRAR of scheduled urban co-operative banks (SUCBs) declined maginally from 13.7 per cent in March 2017 to 13.6 per cent in September 2017. However, at a disaggregated level, CRAR of five banks was below the minimum required level of 9 per cent. GNPAs of SUCBs as a percentage of gross advances increased from 6.9 per cent to 8.5 per cent. Their provision coverage ratio24 (PCR) decreased from 55.3 per cent to 47.1 per cent. RoA increased from 0.7 per cent to 0.9 per cent. Liquidity ratio25 declined marginally from 35.9 per cent to 35.7 per cent (Table 2.3). | Table 2.3: Select financial soundness indicators of SUCBs | | (per cent) | | Financial soundness indicators | Mar 2017 | Sep 2017 | | 1. CRAR | 13.7 | 13.6 | | 2. Gross NPAs to gross advances | 6.9 | 8.5 | | 3. Return on assets (annualised) | 0.7 | 0.9 | | 4. Liquidity ratio | 35.9 | 35.7 | | 5. PCR | 55.3 | 47.1 | | Source: RBI supervisory returns. | Resilience – Stress tests Credit risk 2.36 The impact of credit risk shocks on the CRAR of SUCBs was observed under four different scenarios.26 The results show that under a severe shock, which assumes increase in GNPAs by 2 SD (and turning into loss advances), the system level CRAR of SUCBs comes down below the minimum regulatory requirement. At an individual level, a larger number of banks (39 out of 54) are not able to maintain the minimum CRAR. Liquidity risk 2.37 A stress test on liquidity risk was carried out for 54 SUCBs using two different scenarios; i) 50 per cent and ii) 100 per cent increase in cash outflows, in one to 28 days’ time bucket. It was further assumed that there was no change in cash inflows under both the scenarios. The stress test results indicate that 22 banks in the first scenario and 40 banks in the second scenario are significantly impacted. Section III Non-banking financial companies 2.38 As of September 2017, there were 11,469 non-banking financial companies (NBFCs) registered with the Reserve Bank, of which 172 were deposit-accepting (NBFCs-D). There were 220 systemically important non-deposit accepting NBFCs (NBFCs-ND-SI). 27 All NBFCs-D and NBFCs-ND-SI are subjected to prudential regulations such as capital adequacy requirements and provisioning norms along with reporting requirements. Performance 2.39 The aggregate balance sheet size of the NBFC28 sector was at ₹ 13.8 trillion in September 2017, expanding by 15.6 per cent, as compared to ₹ 11.9 trillion in September 2016. Loans and advances increased by 15.7 per cent, whereas, investments increased by 15.8 per cent (Table 2.4). | Table 2.4: Aggregated balance sheet of NBFC sector: y-o-y growth | | (per cent) | | | Mar-17 | Sep -17 | | 1. Share capital | 15.2 | 8.8 | | 2. Reserves and surplus | 12.2 | 18.1 | | 3. Total borrowings | 15.0 | 15.1 | | 4. Current liabilities and provisions | 16.0 | 26.7 | | Total Liabilities / Assets | 14.5 | 15.6 | | 1. Loans and advances | 16.4 | 15.7 | | 2. Investments | 11.9 | 15.8 | | 3. Others | 7.9 | 15.2 | | Income/Expenditure | | | | 1. Total income | 8.9 | 15.3 | | 2. Total expenditure | 9.6 | 18.1 | | 3. Net profit | -2.9 | 4.7 | | Source: RBI supervisory returns. | 2.40 Net profit increased by 4.7 per cent in September 2017 (y-o-y). RoA was at 1.9 per cent in September 2017 (Table 2.5). | Table 2.5: Select ratios of NBFC sector | | (per cent) | | | Mar-17 | Sep-17 | | 1. Capital market exposure (CME) to total assets | 7.8 | 10.8 | | 2. Real Estate Exposure (REE) to total assets | 5.6 | 9.0 | | 3. Leverage ratio | 2.8 | 3.0 | | 4. Net Profit to total income | 14.0 | 14.8 | | 5. RoA | 1.8 | 1.9 | | 6. RoE | 6.8 | 7.6 | | Source: RBI supervisory returns. | Asset quality and capital adequacy 2.41 GNPAs of the NBFC sector as a percentage of total advances increased from 4.4 per cent in March 2017 to 4.9 per cent in September 2017. NNPAs as a percentage of net advances also increased from 2.2 per cent to 2.4 per cent between March and September 2017 (Chart 2.31). 2.42 As per extant guidelines, NBFCs29 are required to maintain a minimum capital consisting of tier 130 and tier 2 capital, of not less than 15 per cent of their aggregate risk-weighted assets. CRAR of NBFCs decreased from 22.8 per cent in March 2017 to 22.5 per cent in September 2017 (Chart 2.31). Resilience – Stress tests System level 2.43 Stress test on credit risk for NBFCs31 is carried out for the period ended September 2017 under three scenarios: increase in GNPAs by (i) 0.5 SD, (ii) 1 SD and (iii) 3 SD. The results indicate that in the first scenario, the sector’s CRAR declines marginally to 22.4 per cent from 22.5 per cent. In the second scenario, the CRAR goes down to 22.3 per cent and in the third scenario, it declines to 21.9 per cent. Individual NBFCs 2.44 The stress test results for individual NBFCs indicate that under scenarios (i) and (ii), around 7 per cent of the companies are not able to comply with the minimum regulatory capital requirements of 15 per cent. Around 10 per cent of the companies are not able to comply with the minimum regulatory CRAR norm under the third scenario. Section IV Interconnectedness32 Inter-bank33 market 2.45 The inter-bank market is a major source of funding for banking institutions, though its size decreased from around ₹ 8 trillion in March 2017 to ₹ 7 trillion in September 2017. The inter-bank market continued to be predominantly fund-based (close to 86 per cent of total exposure) and constituted nearly 5.3 per cent of the total assets of the banking system in September 2017 (Chart 2.32). 2.46 PSBs continued to be the biggest player in the inter-bank market with a share of 62 per cent followed by PVBs at 26 per cent and FBs at 12 per cent (Chart 2.33). 2.47 A substantial portion of fund based exposure in the inter-bank34 market is short-term in nature. The composition of short-term (ST) fund based interbank exposure shows that the highest share was of short-term deposits followed by short-term loans in September 2017. Similarly, composition of long-term (LT) fund based inter-bank exposure shows highest share of loans and advances followed by long-term deposits and long-term debt instruments (Chart 2.34). Network structure and connectivity 2.48 The network structure35 of the banking system36, which is tiered in nature, reveals that the number of dominant banks declined from nine to five during the period from March 2012 to September 2017 (Chart 2.35). 2.49 The degree of interconnectedness in the banking system (SCBs), measured by the connectivity ratio37, has decreased gradually since 2012 indicating that the links/ connections between the banks have reduced over time. The cluster coefficient38 which depicts local interconnectedness, however, remained consistent during the period from March 2012 to September 2017 indicating that clustering/ grouping within the banking network has not changed much over time (Chart 2.36). Network of the financial system 2.50 SCBs are the dominant players in the entire financial system,39 accounting for nearly 47 per cent of the bilateral exposure, followed by asset management companies managing mutual funds (AMC-MFs) at around 15 per cent. Non-banking financial companies (NBFCs) had bilateral exposure of 12 per cent, whereas, insurance companies as well as housing finance companies (HFCs) each had around 9 per cent exposure. All-India financial institutions (AIFIs) accounted for 7 per cent exposure. SUCBs and pension funds (PFs) together accounted for nearly one per cent of the bilateral exposure in the financial system. 2.51 In inter-sectoral40 exposure, AMC-MFs followed by the insurance companies were the biggest fund providers in the system, while NBFCs followed by HFCs and SCBs were the biggest receiver of funds. Within SCBs, however, both PVBs and FBs had a net payable position vis-à-vis the entire financial sector, whereas PSBs had a net receivable position (Chart 2.37 and Table 2.6).
| Table 2.6: Inter-sector assets and liabilities – September 2017 | | (₹ billion) | | Fin. Entity | Receivables | Payables | | PSBs | 6163.2 | 2798.1 | | PVBs | 2633.4 | 7328.8 | | FBs | 802.5 | 1000.9 | | AMC-MFs41 | 7723.6 | 629.6 | | Insurance companies42 | 4684.2 | 158.7 | | NBFCs43 | 453.5 | 6321.1 | | SUCBs44 | 143.8 | 28.8 | | AIFIs (NABARD, EXIM, NHB, SIDBI) | 1906.3 | 2266.6 | | PFs | 491.0 | 8.2 | | HFCs45 | 368.2 | 4827.2 | Note: Based on a sample. The receivable and payable amounts do not include transations among entities of same group.
Source: RBI supervisory returns and staff calculations. | 2.52 Among the lenders (i.e. those who have a net receivable position against the rest of the financial system), the funds lent by AMC-MFs, SUCBs, PFs and PSBs increased, whereas, for insurance companies it decreased in September 2017 as compared to March 2017. Among the borrowers, the funds borrowed by AIFIs (NABARD, EXIM, NHB and SIDBI) and FBs decreased, whereas, those by NBFCs, PVBs and HFCs increased (Chart 2.38). Interaction among SCBs, AMC-MFs and insurance companies46 2.53 As at the end of September 2017, the gross receivables of AMC-MFs from the financial system were around 38.2 per cent of their average assets under management (AUM), while the gross receivables of the banking system were around 9.8 per cent of their total assets. 2.54 The banking sector had a gross exposure (receivables) of nearly ₹ 238 billion in September 2017 towards the insurance and mutual fund sectors taken together (as against ₹ 154 billion in March 2017). At the same time, the combined exposure (gross receivables) of AMC-MFs and insurance companies towards the banking sector was nearly ₹ 5.12 trillion (as against ₹ 4.8 trillion in March 2017). Exposure to NBFCs 2.55 NBFCs were the largest net borrowers of funds from the financial system with highest funds received from SCBs (40 per cent), followed by AMCMFs (at 37 per cent) and insurance companies (at 19 per cent). SUCBs, AIFIs, HFCs and PFs together accounted for 4 per cent of the borrowings by NBFCs within the financial system47 (chart 2.39). Exposure to HFCs 2.56 HFCs were net borrower of funds from the financial system. AMC-MFs (36 per cent), SCBs (35 per cent), insurance sector (19 per cent) and AIFIs (8 per cent) largely contributed to the funds raised by HFCs. SUCBs, NBFCs and PFs together accounted for 2 per cent of the borrowings by HFCs (Chart 2.40). Exposure of pension funds48 2.57 Pension funds were net lenders in the financial system. Within the financial system, nearly 35 per cent of the pension funds’ exposure (gross receivables) was to NBFCs and 35 per cent to SCBs, followed by HFCs (20 per cent) and AIFIs (10 per cent) (Chart 2.41).49 Contagion analysis SCBs and SUCBs 2.58 A contagion analysis using network tools was used to estimate potential losses in the event of failure of one or more banks due to solvency and liquidity risks in the banking system (Chart 2.42).50 The assessment of impact of joint solvency51- liquidity52 contagion was carried out for a system of combined SCBs and SUCBs.53 2.59 The analysis shows that the failure of a SCB (trigger bank) would not only cause further distress to other SCBs but also to SUCBs, whereas, the impact of failure of a SUCB is contained within SUCBs54 (Table 2.7). A further analysis shows that the impact of solvency is more critical for SUCBs and the impact of liquidity contagion is low. | Table 2.7: Top 5 banks with maximum contagion impact – September 2017 | | (joint solvency-liquidity contagion) | | Trigger bank (SCB) | Number of default banks | Solvency losses
(% of tier-1 capital) | Liquidity losses
(% of liquid assets) | | SCBs + SUCBs | SUCBs | | Bank 1 | 17 | 1 | 10.45 | 10.93 | | Bank 2 | 10 | 0 | 4.45 | 9.55 | | Bank 3 | 9 | 0 | 5.12 | 9.59 | | Bank 4 | 6 | 0 | 3.17 | 6.51 | | Bank 5 | 2 | 0 | 4.49 | 5.58 | Note: 1. Capital loss is shown as % of tier 1 capital of the system (SCBs+SUCBs)
2. Liquidity loss is shown as % of total liquid assets of the system (SCBs+SUCBs)
3. Top five banks have been selected on the basis of number of default banks in contagion.
Source: RBI supervisory returns and staff calculations | Contagion impact after macroeconomic shocks to SCBs 2.60 The contagion impact of the failure of a bank is likely to be magnified if macroeconomic shocks result in distress in the banking system in a situation of a generalised downturn in the economy. To assess the contagion impact55, the initial impact of macroeconomic shocks on individual banks was taken from the macro stress tests, where a baseline and two (medium and severe) adverse scenarios were considered (ref. Chart 2.18).56 2.61 Contagion impact on the outcome of macro stress test reveals that additional solvency losses due to the contagion (excluding initial loss of the macro shock) to the banking system in terms of tier 1 capital would be limited to 5.5 per cent in the baseline, 8.1 per cent in medium stress and 8.8 per cent in severe stress scenarios. The number of default banks after the contagion (including the initially default banks due to macro shocks) would be 8 in baseline, 16 in medium stress and 18 in severe stress scenarios (Chart 2.43).
|