A Introduction The Reserve Bank of India (RBI) has developed an Economic Capital Framework (ECF) to provide an objective, rule-based, transparent methodology for determining the appropriate level of risk provisions to be made under Section 47 of the Reserve Bank of India Act, 1934. The framework was developed in 2014–15, and while it was used to inform the risk provisioning and surplus distribution decisions for that year, it was formally operationalized in 2015–16. The ECF was supplemented by a Staggered Surplus Distribution Policy (SSDP) in 2016-17 to smoothen the cyclicality in RBI’s economic capital and incorporate a certain degree of flexibility in surplus distribution. 2. As decided by the Central Board of the RBI in its meeting held on November 19, 2018, the RBI, in consultation with the Government of India (Government), constituted an Expert Committee to review the extant ECF of the RBI. Shri Subhash Chandra Garg, the then Secretary, Department of Economic Affairs, was initially a member of the Committee. Subsequently, with the appointment of Shri Rajiv Kumar, Finance Secretary, the composition of the Committee is as under: | (i) Dr. Bimal Jalan | Chairman | | (ii) Dr. Rakesh Mohan | Vice-Chairman | | (iii) Shri Bharat N. Doshi | Member | | (iv) Shri Sudhir Mankad | Member | | (v) Shri Rajiv Kumar | Member | | (vi) Shri N.S. Vishwanathan | Member | The terms of reference (ToR) of the Committee are given below: 2.1 Keeping in consideration (i) statutory mandate under Section 47 of the RBI Act that the profits of the RBI shall be transferred to the Government, after making provisions ‘which are usually provided by the bankers’, and (ii) public policy mandate of the RBI, including financial stability considerations, the Expert Committee would: -
review status, need and justification of various provisions, reserves and buffers presently provided for by the RBI; and -
review global best practices followed by the central banks in making assessment and provisions for risks which central bank balance sheets are subject to; 2.2 To suggest an adequate level of risk provisioning that the RBI needs to maintain; 2.3 To determine whether the RBI is holding provisions, reserves and buffers in surplus / deficit of the required level of such provisions, reserves and buffers; 2.4 To propose a suitable profits distribution policy taking into account all the likely situations of the RBI, including the situations of holding more provisions than required and the RBI holding less provisions than required; 2.5 Any other related matter including treatment of surplus reserves, created out of realized gains, if determined to be held. The Memorandum of Constitution of the Expert Committee is at Annex I. 3. The Committee held eleven meetings during the course of its deliberations. The first meeting was held on January 8, 2019. As the Committee was required to submit its report within a period of 90 days from the date of its first meeting, an extension was granted by the RBI. 4. These meetings were also attended by Dr. Deepak Mohanty (Executive Director, RBI), Shri Amit Agrawal (Joint Secretary, Department of Financial Services) and Dr. Shashank Saksena (Adviser, Department of Economic Affairs) as special invitees in light of their expertise and long-standing association with the ECF. 5. Shri Rohit P. Das (General Manager, RBI) was the nodal officer to the Committee and provided outstanding secretariat support to the Committee. 6. The Committee expresses its appreciation to Dr. Deepak Mohanty, Shri Amit Agrawal, Dr. Shashank Saksena and Shri Rohit P. Das for the extensive contribution and support provided to the Committee. 7. The Committee expresses its appreciation to the Government officials Dr. C. S. Mohapatra (Additional Secretary, DEA), Shri Abhishek Anand (Deputy Director, DEA), Shri Shubham Bhatia (Officer on Special Duty, DFS) and Ms. Meetu Aggarwal (Officer on Special Duty), who extensively supported the Committee. 8. The Committee records its appreciation to the supporting RBI team comprising of Smt./Shri Minal A. Jain, Saurabh Aggarwal, Kaustubh Jambhulkar, Ashish Gupta, Sangeetha Mathews, Dr. N. K. Unnikrishnan, Dr. D. Bhaumik, Indranil Bhattacharya, Shriti Das, Jaikish, Manoranjan Padhy, Indranil Chakraborty, S. S. Ratanpal, Purnima S. Lakra, Dr. S. Gayen, Dr. Jai Chander, Dr. Saurabh Ghosh, Shailaja Singh, Savitha Rajeevan, Meenakshi S. Seet, Pradeep Kumar and Saket Kumar. 9. The Committee expresses its appreciation to RBI, New Delhi for providing logistic support. 10. The Committee finalized its recommendations after, inter alia, taking an overview of the role of the central bank’s financial resilience, reviewing cross-country practices, and assessing the impact of RBI’s public policy mandate and operating environment on its balance sheet and risks. 11. Finally, the Committee would like to thank Shri Shaktikanta Das (Governor, RBI), for entrusting it with this responsibility.
B Executive Summary The Expert Committee constituted to review the RBI’s extant ECF, was guided by the principle that the alignment of the objectives of the Government and the RBI is important. As a central bank is a part of the Sovereign, ensuring the credibility of the RBI is as important, if not more, to the Government as it is to the RBI itself. The Committee also noted that while there may occasionally arise a difference of views in the conduct of the central bank’s operations, there always needs to be harmony in the objectives of the Government and the RBI. In recognition of the fact that the RBI forms the primary bulwark for monetary, financial and external stability, the Committee was of the view that the financial resilience of the RBI needs to be maintained above the level of peer central banks, as would be expected of the central bank of one of the fastest growing economies of the world. Towards this end, the Committee recommended adopting the Expected Shortfall (ES) methodology (in place of the extant Stressed-Value at Risk) for measuring market risk on which there was growing consensus among central banks as well as commercial banks over the recent years. While central banks are seen to be adopting ES at 99 per cent confidence level (CL), the Committee recommended adoption of a target of ES 99.5 per cent CL and a range defined between the target and downward risk tolerance of 97.5 per cent (both under stress conditions). The range is considered appropriate to address the cyclical volatility of RBI’s valuation balances based on historical analysis. The Committee recognized that the RBI’s Contingency Risk Buffer (CRB) is, inter alia, the country’s savings for a ‘rainy day’ (a financial stability crisis) which has been consciously maintained with RBI in view of its role as Lender of Last Resort (LoLR). Financial stability risks are those rarest of the rare, fat tail risks whose likelihood can never be ruled out, especially in light of the Global Financial Crisis (GFC) and whose impact can be potentially devastating. Public policy prudence and extant statutory provisions require the RBI to maintain appropriate level of risk buffers for this purpose. The Committee recommended that the same be maintained at a range of 5.5 per cent to 6.5 per cent of the RBI’s balance sheet which is above the available level of 2.4 per cent of balance sheet as on June 30, 2018 (vis-à-vis a target of 3.7 per cent of balance sheet). Application of these recommendations to RBI’s 2017-18 balance sheet is seen to result in RBI’s risk equity levels in a range of 25.4 per cent to 20.8 per cent of balance sheet which will enable the RBI to retain one of the highest levels of financial resilience among central banks globally. The Committee recognized that the opportunity cost of RBI’s capital is minimal as the RBI returns a major part of the coupon interest on the Government of India Securities (G-Sec) held against its capital, reserves and risk provisions as surplus transferable to Government. Further, the composition and size of RBI’s balance sheet is determined by public policy considerations and generates positive externalities of fostering monetary and financial stability. The Committee has recommended a surplus distribution policy which targets not only the total economic capital (as per the extant framework) but also the realized equity level of the RBI’s capital. This will help bring about greater stability of surplus transfer to the Government, with the quantum of the latter depending on balance sheet dynamics as well as the risk equity positioning by the Central Board. There will be no transfer of unrealized valuation buffers and these will be used as risk buffers against market risks. In view of the above recommendation, the excess realized equity as on June 30, 2018 ranges from ₹ 26,280 crores (at upper bound of CRB) to ₹ 62,456 crores (at lower bound of CRB). The excess realized equity as on June 30, 2019 will need to be determined on the basis of RBI’s finalized annual accounts for the financial year 2018-19 as well as the realized equity level decided upon by the RBI’s Central Board. The Committee recommends the alignment of the financial year of RBI with the fiscal year of the Government for greater cohesiveness in various projections and publications brought out by RBI. Further, in the following years, interim dividend to the Government may be paid only under exceptional circumstances. The Committee recommends that the framework may be periodically reviewed every five years. Nevertheless, if there is a significant change in the RBI’s risks and operating environment, an intermediate review may be considered. | 1. The Reserve Bank of India (RBI) is one of the pioneers in the area of central bank capital, starting with the Subrahmanyam Group which submitted its report in early 1997. This was followed by the Thorat Committee in 2004 (recommendations of which were not accepted), the Malegam Committee in 2014 (recommendations of which were accepted) and the Economic Capital Framework (ECF) which was developed between 2014 - 2015 and operationalized by the RBI in 2015-16, so as to operate concurrently with the Malegam Committee’s recommendations which were valid for a three-year period, i.e. 2013-14 to 2015-16. 2. This periodic assessment indicates the importance that the Government of India (Government) and the RBI have placed on finding the right balance between the opportunity cost of central bank capital vis-à-vis the socio-economic cost and the negative externalities of having an undercapitalized central bank, making it imperative that a holistic and comprehensive perspective be taken based on what is in the best interest of the country as a whole. Central bank capital and its role in monetary and financial stability 3. Central banks do not require capital to carry on operations, as being the managers of domestic liquidity, they can do so simply by printing currency/ creating liquidity. The Committee recognised that central banks require financial resilience to absorb the risks that arise from their operations and the delivery of their public policy mandate of buffering the economy from monetary shocks and financial stability headwinds (by virtue of them being the monetary authority as well as LoLR). Emerging Market and Developing Economy (EMDE) central banks have an additional role of managing external stability in the face of volatile capital flows, and the spillover effect of monetary policy changes by Advanced Economies (AE) central banks. 4. The Committee is of the view that there is an important link between central banks’ financial resilience and its policy efficacy. A survey of international literature also reveals that this is the predominant view in the academia and the central banking community. Central banks’ unique risk environment and their risk management frameworks 5. Central banks are exposed to some similar risks as commercial banks, though their operating risk environment is also unique on account of the following: -
Being public policy institutions, central banks’ focus is on ensuring efficacy of their policy actions even if such actions entail assuming significant balance sheet risks. This, in effect, impacts the central banks’ balance sheet and its management significantly. -
Central banks may also be required to adopt a ‘counter-intuitive’ approach to risks during crises wherein they relax their risk tolerance limits (RTL) and collateral standards to act as LoLR as well as market maker of last resort (MMLR), precisely at the time when commercial entities are strengthening their risk management standards. -
On the other hand, there are certain inherent strengths in a central bank’s balance sheet, i.e. being the creators of domestic liquidity they cannot run out of it even during a crisis. Seigniorage income adds to the strength of the balance sheet and central banks are believed to have the implicit (or, in some cases, explicit) support of the government. 6. Among central banks, given the considerable variation in their roles and responsibilities, the environments they operate in, their financial relationship with the Sovereign and their accounting frameworks, there is no internationally laid down risk capital framework for central banks. Central banks, therefore, develop and adapt risk management frameworks to their own specific conditions and requirements. This also means that international comparisons will only reveal global trends and averages, but not a generally agreed international norm. 7. The broad approach that most central banks have followed is to draw a distinction between risks arising out of monetary policy/ financial stability operations and other risks. Many of the central banks actively monitor the risks arising from their monetary policy operations, but do not seek to limit or offset those risks for reasons relating to policy efficacy, while risks arising from non-monetary operations are actively managed. Institutional mechanisms are put in place to ensure that financial resilience is appropriate to absorb the impact of policy risks. Review of central banking practices 8. The Committee was informed by a cross-country analysis of 53 central banks and the salient observations are outlined below. -
Capital structure: Several leading central banks have adopted holistic risk capital frameworks to assess the adequacy of their reserves and provisions. The RBI’s ECF is in line with this approach. -
Risk methodologies: The methodologies adopted by central banks for assessing risks have evolved with the operating environment and the developments in risk assessment. Initially, Value-at-Risk (VaR) was used by central banks, but after the GFC, it has been increasingly supplemented with/ replaced by Stressed Value at Risk (S-VaR) or Expected Shortfall (ES). More recently, ES is emerging as the risk model of choice and the Committee’s recommendation to adopt this model is a move with the times. -
Risk transfer mechanisms: While certain central banks (including the RBI) supplement their financial resilience with risk transfer mechanisms (RTM), the efficacy of RTM can be truly assessed only during an actual crisis when the fiscal space available to the government could also get significantly reduced. In view of the same, the preference of a central bank could normally be to expect ex ante capitalization. -
Credit ratings of central banks: It was observed that wherever central banks were rated, the credit ratings of central banks which were not a part of any currency union were predominantly at the same level as their respective Sovereigns. It was also observed that the Credit Rating Agencies (CRA) in their assessment of Sovereign ratings assign weightage to areas which generally fall within the purview of central banking operations, i.e., exchange rate management and monetary policy. Comparison of central banks’ risk buffer levels 9. The Committee noted that the RBI had an overall fifth rank in 2018 at 26.8 per cent of its balance sheet with respect to central banking economic capital, largely emanating from revaluation balances accumulated by rupee depreciation vis-à-vis the US dollar. Among the EMDEs, the RBI’s position was fourth in 2018, with the other concerned central banks also having large revaluation buffers. 10. The RBI’s realized equity (the component which is actually determined by the central bank’s management) was 7.2 per cent of its balance sheet in 2018 as revaluation balances account for 73 per cent of RBI’s economic capital. 11. The Committee noted that drawing definitive conclusions from simple comparative analysis with equity levels of other central banks is difficult because of the following reasons: -
A central bank’s economic capital requirements will vary according to its roles and responsibilities, operating environment, reserve currency status, currency convertibility status, exchange rate regime, financial stability responsibilities, accounting frameworks, availability of fiscally credible RTMs, and vulnerabilities on the macroeconomic and financial sector front, etc. -
Inter-temporal variations in balance sheet size and the consequent impact on the capital size, e.g. the capital of the US Federal Reserve (US FED) and the Swiss National Bank (SNB) was around 4 per cent and 50 per cent before the GFC which have reduced to about one percent and 16 per cent, respectively. -
During periods of stress and currency depreciation, the revaluation balances of central banks typically go up which is not truly reflective of financial resilience. -
Negative equity central banks cannot be reckoned in arriving at an estimate of target level of equity since they tend to reduce the measure of central tendency. Such central banks may be treated as exceptions as there are not many negative equity central banks. The RBI’s public policy mandate and their impact on its balance sheet and risks 12. The RBI is a full service central bank. Among its varied functions, the role of monetary authority, forex reserve management and fostering of financial stability can particularly give rise to balance sheet and contingent risks for the RBI. The most significant impact of public policy considerations on the RBI’s balance sheet is the size of the forex reserves maintained to manage the volatility in the exchange rate. While these reserves provide the economy with a buffer against external stress, they give rise to significant risks for the RBI, as they have to be maintained as open, unhedged positions thereby exposing the RBI to currency risk on more than three-fourths of its balance sheet. In the past, mark-to-market (MTM) losses of 1.1 to 1.5 per cent of the gross domestic product (GDP) have been experienced during certain periods. Moreover, the materialization of sterilization risks has caused large variability in RBI’s surplus during years of strong foreign inflows, when the balance sheet is already under strain due to the MTM losses. Nevertheless, the RBI has never suffered an overall loss in any year. RBI’s rationale for risk parameterization 13. As part of the review of the extant ECF, the Committee took into consideration the RBI’s rationale for risk parameterization: (i) The RBI had adopted the then prevailing Basel methodologies for market, credit and operational risks as these represented the most widely accepted risk assessment methodologies. At the time of adoption, the S-VaR represented the latest risk management standard as it was introduced globally in 2009 by the Basel Committee on Banking Supervision (BCBS) in the aftermath of the GFC to address the limitations observed in the VaR methodology during the crisis. Other leading central banks were seen to be using this approach at that point of time. The actual risk parameterization of the ECF - return period, time horizon, size of data set, distribution assumptions, components of economic capital, etc. was carried out keeping in mind RBI-specific considerations. (ii) The 99.99 per cent CL was selected in recognition of the fact that the RBI is the external face (international counterparty) of the Government and also forms the primary bulwark during external crises for which it requires financial resilience to match the highest credit rating in international markets in light of the following: -
The country’s EMDE status. -
Rising vulnerabilities associated with a progressively open capital account, global spillovers, volatility of markets and capital flows. -
These vulnerabilities being aggravated by India’s persistent twin (current account and fiscal) deficits. -
The lack of flexibility on the external front due to the rupee not being a reserve currency. - The need to ensure credibility of RBI’s policy actions by being able to bear the risks and costs of these actions on its own.
(iii) The objective of RBI having the financial resilience to match the highest credit rating in international markets was to be seen as an unimpeachable counterparty in international transactions and convey its ‘creditworthiness’ to the external sector, even during times of crises. (The importance of financial resilience can be seen as an important learning from the success of the FCNR (B) swap scheme during the Taper Tantrum of 2013); (iv) The financial stability risks are those rarest of the rare, fat tail risks whose likelihood can never be ruled out and whose impact can be potentially devastating. The ECF takes cognizance of the fact that emergency liquidity assistance (ELA) operations would be riskier in banking sectors with high non-performing asset (NPA) levels. The NPA crisis has thrown light on the challenges that arise if a sizable majority of the banking sector needs to be recapitalized during a financial stability crisis. This necessitates the need for RBI’s balance sheet to be demonstrably credible to discharge the LoLR function. The extant ECF-SSDP and risk provisioning 14. The Committee, thereafter, reviewed the trends in RBI’s surplus distribution under the ECF-SSDP framework from a historical perspective, as well as in comparison with other central banks. In this regard, the Committee noted the following: -
The risk provisioning by RBI, as a percentage of total net income, has come down from around 50 per cent earlier to 10 per cent since the adoption of Malegam Committee recommendations/ ECF as modified by SSDP. The RBI has transferred ₹2.65 trillion (90 per cent of its net income) to the Government over the same period. -
At 90 per cent transfer of net income to the Government, the ECF-SSDP compares well with other central banks. -
The practice of paying interim dividend commenced in 2016–17. -
While the RBI does not calculate seigniorage income, the surplus transferred over the years has been substantially higher than the seigniorage income, as the Issue Department balance sheet, historically, accounts for only around 50 per cent of the RBI’s balance sheet. -
RBI’s surplus distribution since the adoption of Malegam Committee recommendations/ ECF as modified by SSDP compared favourably with other EMDEs which have even higher economic capital levels than the RBI due to their currency depreciation. Quality of RBI’s risk buffers 15. Consequent to the transfer of surplus as indicated above, the RBI’s realized equity (Capital, Reserve Fund, Contingency Fund [CF] and Asset Development Fund [ADF]) as a proportion of balance sheet is at similar levels as in the late 1990s, though significant amount of unrealized revaluation balances are now available to act as risk buffers against market risks. 16. The RBI’s economic capital has also undergone a significant transformation over the past 20 years, with the unrealized revaluation balances now accounting for almost 73 per cent of the RBI’s economic capital in 2017-18 vis-à-vis 37.9 per cent in 1997. The Committee’s observations and recommendations 17. The Committee reviewed the extant ECF and its associated SSDP. The Committee has made the following observations/ recommendations. Economic capital levels 18. The Committee observed that even if the RBI’s economic capital could appear to be relatively higher, it is largely on account of the revaluation balances which are determined by exogenous factors such as market prices, and the RBI’s discharge of its public policy objectives. The proportion of realized equity to balance sheet has come down through the surplus distribution – balance-sheet expansion adjustment process since the adoption of Malegam Committee recommendations/ ECF as modified by SSDP. Review of status, need and justification of RBI’s buffers 19. The status, need and justification of various reserves, risk provisions and buffers maintained by the RBI were reviewed by the Committee, which recommended their continuance. The Committee recommended that the RBI should explicitly recognize the ADF not only as a provision for capital expenditure but also as a risk provision in case of need. Treatment of revaluation balances 20. The Committee recommended the inclusion of the revaluation balances as a part of RBI’s overall risk buffers, but with the recognition of its special character in view of their volatility, limited usability, significant strategic and operational constraints on their monetization. The principles of non-distribution of revaluation balances, mapping these only against market risks, and one-way fungibility vis-à-vis realized equity would need to be continued. Transparency in accounts 21. In view of the distinction sought to be made between realized equity and revaluation balances, the Committee recommended a more transparent presentation of the RBI’s Annual Accounts with regard to the components of economic capital (Table E.1). | Table E.1: Extant and suggested presentation of the liability side of RBI’s balance sheet | | Existing liabilities format | Proposed liabilities format | | -
Capital -
Reserve Fund -
Other Reserves -
Risk Provisions -
Contingency Fund -
Asset Development Fund -
Revaluation Accounts -
Deposits -
Other Liabilities -
Notes in Circulation | Articulation of financial resilience of the RBI 22. Going forward, the desired financial resilience for the RBI may be articulated by the Central Board in terms of the risk protection desired for its balance sheet. Selection of the risk model to be used 23. Given that ES is a better risk measure for tail risk as well as a coherent risk measure unlike VaR and S-VaR and that there is an increasing convergence on the use of ES, adoption of the ES methodology for the RBI’s market risk provisioning was recommended. Selection of risk parameters 24. Keeping in view, the historical incidence of stress and the need to maintain high level of financial resilience for RBI as well as to take into account the volatility and cyclicality in revaluation balances, the Committee considered various alternate risk parameterizations and selected the ES 99.5 per cent CL under stress conditions as the target resilience for market risk. The Committee noted that this was higher than other central banks who were seen to be using ES 99. The Committee also articulated a risk tolerance limit of ES 97.5 per cent CL based on historical analysis to impart the necessary flexibility to account for the cyclical volatility in RBI’s valuation buffers. Risk provisioning to cover shortfall in market risk would be triggered only if the tolerance limit of ES at 97.5 per cent CL is breached. 25. The Committee was also of the view that even when capital flows and the rupee are strong, government finances buoyant and the country prospering, the RBI will need to have adequate financial resilience to absorb the risks of the challenging monetary policy conditions which would arise in such a scenario caused by large inflows. Assessing off-balance sheet exposures 26. The RBI should assess the risk of its off-balance sheet exposures in view of their increasing significance. The country’s rainy-day savings 27. The Committee recognized that the RBI’s financial stability risk provisions need to be viewed for what they truly are, i.e., the country’s savings for a rainy day (a financial stability crisis), built up over decades, and maintained with the RBI in view of its role as the LoLR. Its balance sheet, therefore, has to be demonstrably credible to discharge this function with the requisite financial strength. Assessing financial stability risks 28. Globally, central banks are seen to be key custodians of financial stability. While they are known to use scenario analysis to assess risks arising from such actions, this is an area where most central banks, including the RBI, are relatively more discreet because of the associated moral hazard in spelling it out upfront. In India, the position of law is such that the RBI is not only the monetary authority, but also the regulator and supervisor, inter alia, of commercial banks, NBFCs and payment systems, and the debt manager of the Government. The Committee agreed that the RBI has one of the widest financial stability mandates deeply entrenched in the RBI’s statute and it is also bound by Section 47 of the RBI Act, 1934 to maintain the financial resources commensurate with the task. While the potentially destabilizing events have been skilfully handled through successful mergers, acquisitions and recapitalization in the past, the Committee acknowledged that the possibility of financial stability risks materializing can never be ruled out, especially in view of the lessons learnt from the GFC. 29. Given that the Government’s manoeuvrability on recapitalization of commercial banks or of the RBI could be constrained during a financial stability crisis, the Committee recognized the need for the RBI to maintain adequate risk buffers to ensure appropriate level of financial resilience in such circumstances. 30. The assessment made in the initial implementation stages of the extant ECF using peak liquidity scenario analysis had suggested that this risk buffer should be between 2 to 6.5 per cent of the RBI’s balance sheet. In light of the same, the Central Board had previously decided to maintain the buffer at 3 per cent with a medium-to-long term target of 4 per cent of the balance sheet. The Committee was also informed by a separate scenario analysis to assess the RBI’s ELA requirements using the European Central Bank’s (ECB) methodology for the liquidity stress-testing of commercial banks under its jurisdiction. Thereafter, a recovery rate ranging from 60 percent to 80 percent on the ELA was applied to estimate the RBI’s LoLR risks. The Committee considered the scenario of ELA to top 10 commercial banks with an 80 per cent recovery rate which results in a risk estimate of 4.6 per cent of the balance sheet. This analysis did not take into consideration the interconnectedness in the financial sector, the risks arising out of Indian banks’ overseas operations or the risks arising from the Deposit Insurance and Credit Guarantee Corporation (DICGC) which is a wholly-owned subsidiary of the RBI. In light of the above, the Committee recommended that the size of the financial and monetary stability risk provisions should be maintained at 4.5 to 5.5 per cent of the balance sheet. The scale of provisioning was moderate when assessed against the scale of costs of financial stability crises globally. Monetary stability risks 31. The CRB represents the cushion for both financial stability as well as monetary stability risks in view of their low correlation. Assessing credit and operational risks 32. The Committee recommended the adoption of the Basel III Standardised Approach for assessing credit risk of the forex portfolio (which also covers off-balance sheet exposures) and the new Standardised Approach for operational risk. Joint credit-market risk modelling 33. The RBI should consider joint credit-market risk modelling as this would help simulate the combined impact of a crisis and may lead to lower risk provisioning due to diversification. Size of realized equity 34. This should cover the requirements of the CRB (i.e., sum of credit risk, operational risk, and financial and monetary stability risks) as well as any shortfall in revaluation balances vis-à-vis the market RTL. Given that, as on June 30, 2018, there was no shortfall in revaluation balances, the size of the realized equity should be 6.5 per cent of the balance sheet, with a lower bound of 5.5 per cent. This represents 1.2 to 1.4 per cent of the GDP. 35. The net position of the risk provisions as determined by applying the recommendations of the Committee is summarized in Table E.2. Application of the Committee’s recommendations to the RBI’s balance sheet for the year 2017-18 results in excess revaluation balances of 0.7 per cent of balance sheet and excess realized equity ranging from 0.7 per cent at the upper bound of CRB to 1.7 per cent of balance sheet at the lower bound of CRB. | Table E.2: Risk provisions as per extant and proposed ECF (June 30, 2018) | | | Extant ECF | Proposed ECF | | Available risk buffers | Required risk buffers | Net position | Available risk buffers | Required risk buffers | Net position | Excess | | Market risk | 19.6* plus 4.8** | 24.4 | - | 19.6 | 18.9
{RTL: 15.3} | (+) 0.7 | VB: 0.7 | | Financial & monetary stability risk | 1.7 | 3
[medium term target: 4] | (-) 1.3
[(-) 2.3] | 6.3 | 4.5 to 5.5 | (+) 0.8 to (+) 1.8 | RE: 0.8 to 1.8 | | Credit risk | 0.4 | 0.4 | - | 0.6 | 0.6 | - | - | | Op risk | 0.3 | 0.3 | - | 0.3 | 0.3 | - | - | | Total risks/ risk buffers | 26.8 | 28.1
[29.1] | (-) 1.3
[(-) 2.3] | 26.8 | 20.8 to 25.4 # | (+) 1.5 to (+) 2.5^ | VB: 0.7+ RE: 0.7 to 1.7# | * VB: Revaluation balances ** RE: Realized equity ^ Excess is in the form of 0.7 per cent revaluation balances and 0.8 to 1.8 per cent realized equity. {}: Risk Tolerance Limit
# As the lowest estimate of RBI’s LoLR risk is 4.6 per cent (Table 4.9) and the sum of credit and operational risk is 0.9 per cent, the lower bound of the CRB is to be maintained at 5.5 per cent with an upper bound of 6.5 per cent. Consequently, the excess RE is 0.7 to 1.7 per cent. | Treatment of excess realized equity 36. The excess realized equity as on June 30, 2018 ranges from ₹ 26,280 crores (at upper bound of CRB) to ₹ 62,456 crores (at lower bound of CRB). The excess realized equity as on June 30, 2019 will need to be determined on the basis of RBI’s finalized annual accounts for the financial year 2018-19 as well as the realized equity level decided upon by the RBI’s Central Board. Opportunity cost of RBI’s capital 37. The Committee was also of the view that the return/ cost of RBI’s capital, which is held for public policy objectives involves considerable positive externalities. If these do need to be assessed, it may be done on two broad principles viz. (i) the difference in the overall return on the assets held and the average debt servicing cost of the Government and (ii) the opportunity cost of capital which is the return that the Government would have generated had RBI’s capital been redeployed. With regard to overall return, the assets held against risks buffers could include both a portion of the Net Foreign Assets (NFA) and the Net Domestic Assets (NDA), depending on the composition of the RBI’s balance sheet at any given time. On NDA, RBI receives coupon interest on the G-sec it holds, which is predominantly returned to the Government in the form of surplus transfers. On NFA, the coupon returns may be lower than on NDA, but are typically augmented by valuation returns that accrue to the revaluation balances. The positive impact of NFA on the sovereign rating reduces Government’s overall borrowing costs, and hence has an indirect pecuniary benefit. 38. With regard to the opportunity cost of RBI’s capital and retained earnings, given that G-sec are held against it, the fiscal impact of RBI’s realized equity is minimal1 as RBI predominantly returns the coupon received on the G-sec. Further, given the large size of India’s GDP, the transfer of RBI’s ‘excess’ capital will not have a material impact on its debt-GDP ratio, while negatively impacting other rating criteria used by the CRAs. With regard to the possibility of the debt held against central bank’s capital crowding out the private sector borrowings, the Committee noted that Meyer (2000) had observed that government debt held by the private sector is not affected by the existence or the level of the surplus held by central banks. The opportunity cost of RBI’s capital is, thus, seen to be relatively small, even without taking into consideration the positive externalities of monetary and financial stability which these buffers facilitate. The Surplus Distribution Policy going forward 39. The surplus distribution policy (SDP) should move away from targeting total economic capital alone (as under the extant SSDP), to one where it has a dual set of targets: -
The total economic capital of the RBI; and -
The level at which realized equity is to be maintained. 40. Given that market risk was mapped against revaluation balances and only a shortfall in these balances needs to be provided for, the SDP, in effect, will be required to target the required level of realized equity (‘requirement’) for covering: -
monetary and financial stability risks -
credit risk -
operational risk -
A shortfall, if any, in revaluation balances vis-à-vis market risk RTL. 41. The ‘available realized equity’ (ARE), i.e., Capital, Reserve Fund, CF and ADF, will be compared with the ‘requirement’ to determine surplus distribution on the following lines: -
Entire net income shall be transferred to the Government, if the RBI’s ARE is equal to or greater than upper bound of the ‘requirement’. -
Subject to ARE lying within the range of ‘requirement’, the Central Board may consider risk provisioning in a manner so as to maintain the RBI’s ARE within the range of ‘requirement’, till the next periodic review. -
If the ARE falls short of the lower bound of ‘requirement’, appropriate risk provisioning should be made by the RBI to augment the realized equity to the lower bound of ‘requirement’ and only the residual net income (if any) should be transferred to the Government. -
If any risk provisioning from net income has been made previously for market risk, the excess realized risk provisioning over the target level of market risk buffers (ES 99.5 stress), caused by an increase in revaluation balances, may be reversed. -
There shall be no distribution of unrealized revaluation balances. Consistency in the level of risk provisioning 42. The Committee noted that on making reasonable allowance for volatility (± 0.5 SD and ± 1 SD) in the RBI’s net income relative to its balance sheet size, average risk provisioning over the five year period of 2018-19 to 2022-23 for CRB of 5.5 and 6.5 per cent could range from 8.1 to 16.6 per cent of net income in the normal scenario with a range of 5.4 to 11.1 per cent of net income in case of a positive shock and 16.0 to 32.8 per cent of net income in case of a negative shock respectively. The Committee also noted that these were illustrative and not exhaustive scenarios. Treatment of excess revaluation balances 43. The Committee was of the view that it should not concern itself with the issue of alternative deployment of excess accumulated revaluation balances as it did not fall within the Committee’s ToRs. The Committee recommended that these may continue to remain on the balance sheet till such time that they may be realized through the sale or maturity of the underlying asset. Interim dividend and aligning RBI’s financial year with the Government’s fiscal year 44. The Committee recommended that the RBI accounting year (July to June) may be brought in sync with the fiscal year (April to March) from the financial year 2020-21 for the following reasons: -
The RBI would be able to provide better estimates of the projected surplus transfers to the Government for the financial year for budgeting purposes; -
It could reduce the need for interim dividend being paid by the RBI. The payment of interim dividend may then be restricted to extraordinary circumstances; -
It would obviate any timing considerations that may enter into the selection of open market operations (OMO)/ Market Stabilization Scheme (MSS) as monetary policy tools; and -
It would also bring about greater cohesiveness in the monetary policy projections and reports published by the RBI which mostly use the fiscal year as the base. Periodicity of review 45. The Committee recommended that the framework may be periodically reviewed every five years. Nevertheless, if there is a significant change in the RBI’s risks and operating environment, an intermediate review may be considered.
1 An Overview of the Role and Relevance of Central Banks’ Financial Resilience 1.1 The RBI is one of the pioneers in the area of central bank capital, starting with the Subrahmanyam Internal Working Group which submitted its report in early 1997. This preceded the publication of Dr. Peter Stella’s seminal paper ‘Do Central Banks Need Capital’ (Stella, 1997), which subsequently triggered considerable research in this area. This was also before the creation of the European System of Central Banks (ESCB) in 1998 – a framework which explicitly laid emphasis on the financial resilience of its member central banks as a means of ensuring their functional independence. 1.2 The Subrahmanyam Group was followed by the Usha Thorat Committee in 2004 (recommendations of which were not accepted), the Malegam Committee in 2014 (recommendations of which were accepted) and the ECF which was developed during 2014-15 and operationalized by the RBI in 2015-16, so as to operate concurrently with the Malegam Committee’s recommendations which were valid for a three-year period, i.e., 2013-14 to 2015-16. 1.3 Given that the role and adequacy of central bank capital is an issue which generally receives greater attention only during crises, the continued attention on this issue in India reveals the importance that the Government and the RBI have placed on finding the right balance between the opportunity cost of central bank capital vis-à-vis the socio-economic cost and the negative externalities of having an undercapitalized central bank, making it imperative that a holistic and comprehensive perspective be taken based on what is in the best interests of the country as a whole. The challenge in finding this right balance arises primarily from the fact that the opportunity cost of central bank capital is relatively easier to measure than the benefits of having a well-capitalized central bank for fostering ‘monetary and financial stability’, given that these are a public good and, therefore, difficult to measure during normal times. I. Central bank capital and its role in monetary and financial stability 1.4 Central banks do not require capital to carry on operations, as being the managers of domestic liquidity they can do so simply by printing currency/creating liquidity. However, central banks require financial resilience2 to absorb the risks that arise from their operations and delivery of their public policy mandate.3 To fully appreciate the importance of the same, one needs to view central banks as macro-level risk managers, mandated with the public policy objective of buffering the economy from monetary shocks and financial stability headwinds (by virtue of they being the monetary authority as well as the LoLR). Emerging market central banks have an additional role of managing external stability in the face of volatile capital flows and the spillover effect of monetary policy changes by AE central banks. The role of central banks’ financial resilience is to enable these institutions to focus on their primary function of fostering monetary, financial and external stability, even in the midst of crisis, without being diverted by balance sheet concerns. This is particularly important given that central bank capital generally represents public resources and the central bank’s management can be held accountable for its losses. II. Survey of literature 1.5 There are varied views on the role of central banks’ capital/financial resilience. On the issue of central banks being able to carry on operations even with negative capital, Stella and Lönnberg (2008) drew a distinction between ‘technical insolvency’ and ‘policy insolvency’, i.e., a central bank may be able to carry on day-to-day operations with negative equity but may not be effective in the implementation of its policy objectives. Adler, Castro, and Tovar (2016), Klüh and Stella (2008), and Perera, Ralston, and Wickramanayake (2013) had observed a negative relationship between central banks with weak financial resilience and the discharge of their policy mandate. Dalton and Dziobek (2005) concluded that failure to address ongoing losses, or any ensuing negative net worth, will interfere with monetary management and may jeopardize the central bank’s independence and credibility. Sims (2013) also concluded that the LoLR role of the central bank may not be credible if the central bank equity position is not strong. 1.6 Bindseil, Manzanares, and Weller (2004) found that as a fully automated and credible rule of recapitalization of the central bank by the government is difficult to implement in practice, positive capital4 seems to remain a key tool in ensuring that independent central bankers always concentrate on price stability in their monetary policy decisions. Archer and Moser-Böehm (2013) observed that the mere act of seeking recapitalization from the government might cause central banks to give up an authority that had been purposefully delegated to them. 1.7 Specifically, Friedman and Schwartz (1963) observed that the US FED’s concern about its own balance sheet weighed on the decision which prevented an aggressive monetary expansionary response to the emerging Great Depression. Krugman (1998) and Cargill (2005) have argued that Bank of Japan (BoJ) committed similar policy errors as it was concerned with its net worth position. Amador et al. (2016) observed that the dilemma between the desire to maintain currency pegs and the concern about future losses can lead the central bank to first accumulate a large amount of reserves, and then to abandon the peg, as observed in the Swiss case. Hall and Reis (2015) arrived at a similar conclusion. 1.8 On the other hand, according to Subramanian et al. (2018), central banks can always deliver on their domestic operations regardless of their net worth because they can always issue liabilities (‘print money’); and that central banks are a part of the government, hence it is the broader government balance sheet that matters, not that of any of its constituents. In this regard, Buiter (2008), states that a central bank’s balance sheet is uninformative about the financial resources it has at its disposal and about its ability to act as an effective LoLR and MMLR, and, therefore, the equitable insolvency (the failure to pay obligations as they fall due) is more relevant for central banks than balance sheet insolvency, i.e., liabilities exceeding assets. He, however, noted that the scale of recourse to seigniorage to safeguard central bank solvency may undermine price stability. Benecka et al. (2012) did not find any significant link between central bank financial strength and inflation. Frait (2005) as well as Dalton and Dziobek (2005) sought to differentiate between central banks with operating losses from those with valuation losses caused by currency appreciation. Ernhagen, Vesterlund, Viotti (2002) broadly agreed that as long as overall conditions are reasonable, the ‘seigniorage’ income of a central bank will add to the financial strength of the central bank. A central bank would be able to ensure its solvency through seigniorage as long as it does not have significant foreign exchange-denominated liabilities or index-linked liabilities. For these reasons, a number of central banks such as those of Israel, Chile, the Czech Republic and Mexico have continued to operate quite successfully for long periods with negative capital. Restrepo et al (2008), on the other hand, in relation to the Chilean case, observed that it would take at least 25 years for its net worth to reach positive levels, with a high chance of it being negative equity even after 25 years. 1.9 In this regard, an EMDE central bank which is one of the most cited examples of an effective central bank despite having negative equity over a prolonged period, cited the following reasons for central banks to maintain sufficient capital in its 2006 annual report, while mentioning that the International Monetary Fund (IMF) has for several years recommended its recapitalization and that risk-rating agencies mention the central bank’s negative capital as something that should be corrected: -
If a central bank enjoys healthy capitalization, the market will consider it financially fit to act and meet its policy goals and deal with any unforeseen occurrences. -
In contrast, if a central bank is perceived as suffering from weak equity, raising concern about the effects this could have on decisions and therefore financial statements, it could lead to loss of credibility and policies becoming less effective. Credibility is important because it enhances the stabilizing effect of monetary policy. -
A central bank’s financial independence is necessary to safeguard the technical nature of its decisions. Autonomy could be seriously hurt if a central bank had to urgently request resources from the General Treasury, especially to deal with financial or BoP crises. (The central bank’s current credibility and sound reputation ensure that it will be able to fulfil its duties.) -
A well-capitalized central bank reduces the risk of having to issue money to finance itself amidst instability (e.g., to meet its obligations as LoLR). Thus, the country and the central bank are better prepared to deal with a range of critical situations. 1.10 The Committee noted that the aforementioned central bank continues to operate with negative equity as a recapitalization programme launched in 2006 could not be completed in 2009 due to a worsening of the government’s fiscal position. 1.11 With regard to RBI specifically, Subramanian et al. (2018), using the approaches of ‘modal’ risk parameterization and regression analysis, concluded that it is overcapitalized by 13 to 22 percentage points. Similar conclusions were drawn in the Economic Survey 2016–17 and Economic Survey 2017–18. Lahiri et al. (2018), on the other hand, concluded that the RBI was undercapitalized by 5 per cent compared to the average of emerging economies. III. Central banks’ unique risk environment and their risk management frameworks 1.12 Even though central banks are exposed to some similar risks as commercial banks, i.e., policy and strategic risk, market risk, credit risk, liquidity risk (at least, on forex reserves), information security risk, operational risk, reputation risk, etc., their operating environments are rather unique, resulting in a need for adopting risk management frameworks which are specifically adapted to their environment and public policy mandate: (i) Being public policy institutions, the focus of central banks is on ensuring efficacy of their policy actions even if such actions entail assuming significant balance sheet risks—an approach which is referred to within the RBI as the Principle of Public Policy Predominance (PPPP). (ii) This principle impacts the central bank balance sheet and its management significantly. For instance, common risk management tools such as hedging may not be available to central banks and risk-return considerations will figure low in priority in important decisions such as balance sheet composition (the size of forex reserves being more of a strategic decision), keeping the forex reserves as an open position (as they need to be available for intervention purposes), the absence of duration management for the domestic securities portfolio (as it could impact monetary policy operations), etc. (iii) Some of the largest risks, i.e., monetary and financial stability risks, are specific to central banks and they have been seen to materialize at scales which account for a significant portion of an economy’s GDP. If these risks do indeed materialize and lead to a situation where central banks need recapitalization support, the ability to conduct monetary policy may get eroded, thereby constraining their independence. Moreover, given their scale of operations, central banks are difficult to recapitalize as evidenced by several central banks which operate with negative capital. (iv) Given their public policy objectives, central banks may also be required to adopt a ‘counter-intuitive’ approach to risks during crises, wherein they relax their RTL and collateral standards to act as LoLR as well as MMLR, precisely at the time when commercial entities are strengthening their risk management standards. (v) On the other hand, there are certain inherent strengths in a central bank’s balance sheet which are: -
Being the creators of domestic liquidity, central banks cannot run out of it even during a crisis. They thus cannot become ‘technically’ insolvent. (While a commercial bank may be faced with liquidity stress, due to various triggers such as asset-liability mismatch, materialization of other risks, contagion, etc., a central bank under similar circumstances will always be able to carry out operations without disruption by printing currency/creating liquidity). However, this approach may not only compromise their monetary policy objectives, but being the providers of domestic liquidity also brings with it the responsibility of being the LoLR and its own attendant risks; -
Central banks earn ‘seigniorage income’5 from their delegated role as issuer of currency which adds to their financial resilience, unless it is predominantly transferred to the government; - Central banks are seen to have the implicit (and, in some cases, explicit) support of the Sovereign.
1.13 Given that roles and responsibilities of central banks vary considerably, as do the environments they operate in, their financial relationship with the Sovereign (RTMs and surplus distribution policies) and their accounting frameworks, there is no internationally laid down risk capital framework for central banks. Central banks, therefore, develop and adapt risk management frameworks to their own specific conditions and requirements. This also means that international comparisons will only reveal international trends and averages but not a generally agreed international norm. Nevertheless, the broad approach that most central banks have followed for developing their risk frameworks is along the following lines: -
A distinction is drawn between risks arising out of monetary policy/financial stability operations and other risks. -
Many of the central banks actively monitor the risks arising from monetary policy operations, but do not seek to limit or offset those risks for policy reasons. -
Non-monetary operations risks (forex reserve risks, operational risks, etc.) are actively managed. -
Institutional mechanisms are put in place to ensure financial resilience is appropriate to absorb the impact of policy risks through adequate equity (economic capital)6/ RTMs/ profit transfer mechanisms. 1.14 In the following chapter, international practices adopted by central banks with regard to risk management as well as economic capital and financial resilience are examined. 2 Review of Central Banking Practices 2.1 ‘Economic capital is defined as the methods or practices that allow banks to consistently assess risk and attribute capital to cover the economic effects of risk-taking activities’ (Bank for International Settlements [BIS], 2009). Prior to the development of its own ECF, the RBI conducted a cross-country survey of the frameworks used by 36 leading advanced and emerging economy central banks. The purpose of this exercise was to evaluate the frameworks used by other central banks to assess their own risk capital and provisioning requirements. This was further supplemented by technical workshops held with the BIS and the ECB as well as detailed discussions with Banco Central do Brasil (BCdB), Bank of England (BoE), BNM, Reserve Bank of Australia (RBA), Reserve Bank of New Zealand (RBNZ), South African Reserve Bank (SARB), and Sveriges Riksbank amongst others. More recently, the Government has also conducted a survey of 51 central banks with regard to their total equity levels and risk models used. The Committee was informed by the findings of both these surveys, as well as an extended analysis of 53 central banks (covering all the central banks by the Government and the RBI) on their economic capital, realized equity and other sources of financial resilience and their relative position with regard to macroeconomic and financial stability indicators. I. Various approaches towards strengthening the central banks’ financial resilience 2.2 Archer and Moser-Böehm (2013) identified capital targets, accounting policies, risk-sharing arrangements, profit distribution and recapitalization mechanisms as key determinants of central bank financial strength. Interestingly, following the GFC, a number of leading central banks strengthened their financial resilience by adopting at least one of these measures as brought out in Box 2.1. Box 2.1: Different ways central banks strengthened their financial resilience following the Global Financial Crisis
(i) The Monetary Authority of Singapore (MAS) increased its capital by SGD 8 billion to SGD 25 billion in March 2012. (ii) In 2009, the SNB doubled the provisioning requirements to equal double of the average nominal economic growth rate. In 2016, a minimum annual allocation of 8 per cent of the provisions was further stipulated. (iii) The Australian government in 2013-14 increased the RBA’s Reserve Fund (treated as its capital) from 3.6 per cent of assets at risk to 15.7 per cent of assets at risk. (iv) The ECB increased its subscribed capital from €5.76 bn to €10.76 bn in 2010. Its reserves which are capped at the level of capital also increased accordingly. The paid-up capital presently stands at € 7.74 bn.7,8 (v) The Bank of Korea Act was amended in 2011 and the amount to be allocated to reserves was increased from 10 per cent to 30 per cent of net profit. (vi) The BoE’s Quantitative Easing (QE) is undertaken by a subsidiary of the central bank with the risk-return being transferred to the Treasury. (vii) The US FED introduced an accounting change wherein losses would be treated as an intangible asset to be recovered before transfers to the Treasury recommence. | 2.3 Accordingly, the survey sought to identify key central banking practices in this regard, which are discussed below: (i) Capital Structure: The amount of central bank capital is generally stipulated by their respective statutes, while reserves/ risk provisions are seen to be the dynamic components of a central bank’s capital structure, changing over time and circumstances. It was observed that several leading central banks, e.g. BoE, ECB, RBA and RBNZ, have adopted holistic risk capital frameworks to assess the adequacy of their reserves and provisions. The RBI’s ECF is, thus, in line with current central banking practices. The salient features of BoE, ECB, RBA and RBNZ’s capital frameworks are presented in Annex III. Other than these, there are a number of other central banks which use targeted levels of reserves/ risk provisions such as the Banque de France (BdF), BoJ, US FED, Norges Bank and the SNB, amongst others. The targeted levels of reserves/ risk provisions of these central banks are also given in Annex III. (ii) Evolution of risk methodologies: The survey also brings out the fact that central banks are increasingly adopting a model-based approach for assessing risks and that these risk methodologies evolve with the operating environment and the developments in risk assessment. Table 2.1 shows that a number of central banks had started adopting VaR for risk management/capital purposes well before the GFC. However, the crisis revealed severe shortcomings of the VaR (Crotty, 2007; Gopalkrishna, 2013) and central banks strengthened their risk frameworks with the BoE9, RBNZ and the RBI adopting the S-VaR methodology which was prescribed by the BCBS to replace VaR for commercial banks in 2009. 10 A number of other central banks started moving to ES, which has been prescribed by the BCBS to replace S-VaR in 2016. While the risk parameters range from VaR 95 per cent (Hong Kong), S-VaR 99.9 per cent (New Zealand), S-VaR 99.99 per cent (India) to ES 99 per cent (ECB), etc., ES 99 per cent appears to be emerging as the risk parameter of choice among several central banks presently. Table 2.1: Risk methodologies adopted by central banks | | S. No. | Country | Risk Methodology | | 1. | Australia | Stress test and historical analysis replaced VaR in 2017. | | 2. | Austria | ES (99 per cent) introduced in 2012. VaR also used. | | 3. | Belgium | ES introduced in 2015. VaR also used. | | 4. | Canada | Scenario-based stress tests augments VaR. | | 5. | Chile | VaR | | 6. | Denmark | ES | | 7. | ECB | ES (99 per cent) main measure since 2017. VaR also used. | | 8. | Finland | ES (99 per cent) introduced in 2016. VaR also used. | | 9. | Germany | ES augmented VaR | | 10. | Hong Kong | VaR 95 per cent since 2005. | | 11. | India | S-VaR 99.99 per cent adopted in 2015. | | 12. | Italy | ES augmented VaR | | 13. | Norway | ES | | 14. | Netherlands | ES in 2012. Scenario analysis also used. | | 15. | New Zealand | VaR/ S-VaR at 99.9 per cent adopted in 2014. | | 16. | Poland | VaR | | 17. | Spain | VaR 99 per cent to 99.9 per cent. | | 18. | Sweden | VaR | | 19. | United Kingdom | Stress tests replaced S-VaR in 2017. | | 20. | Basel norms for commercial banks/ BIS | BCBS prescribes ES 97.5 per cent in place of S-VaR 99 per cent in 2016 (which itself replaced VaR in 2009). BIS, itself, uses 99.995 per cent S-VaR since 2010–11. | (iii) Risk transfer mechanisms: Certain central banks (including the RBI which has the MSS) supplement their financial resilience with RTMs with the government which are detailed in Annex IV. These RTMs include setting up of Special Purpose Vehicles (SPVs) where the risk return of quasi-fiscal actions are transferred directly to the government; the direct transfer of losses exceeding the available reserves to the government; making accounting changes whereby central bank losses are treated as a future claim on the government; and ad hoc measures such as issue of bonds by the governments to the central banks to cover their losses. (iv) Efficacy of RTMs: The efficacy of RTMs can truly be assessed only during an actual crisis when the fiscal space available to the government could also get significantly reduced. Post-GFC developments have shown that sovereign debt crises can be quickly triggered when large-scale public sector actions are initiated. There are other specific instances where RTMs have been less effective than initially expected. During the Asian Crisis, an East Asian government issued inflation-indexed government bonds (amounting to around 16 per cent of GDP) to its central bank in exchange for the latter’s claims on banks arising due to the liquidity assistance extended by it. However, the bonds were restructured in tranches prior to any payment being made thereon by the government so as to yield 0.1/1.0 per cent with no fixed repayment date/ 20 years maturity. Incidentally, the stipulation that a charge be paid by the government to the central bank should the central bank’s ratio of capital to monetary obligations fall below 3 per cent was abolished in 2011. There have been other instances where recapitalization of central banks has been done through non-interest bearing bonds. In view of the same, the preference of a central bank could normally be to expect ex ante capitalization. Even in the case of a Asian central bank, which has statutory provision for automatic (ex post) recapitalization, surplus ranging from 41 per cent to 59 per cent was transferred (ex ante) to the risk reserves during 2008–2010, which was higher than the required level of 10 per cent. This requirement has since been raised to 30 per cent. The recent introduction of the capital framework in an AE central bank also points towards the merits of ex ante capitalization, even though the SPV route provides it with one of the strongest RTMs (whereby certain significant central banks’ risks do not enter into the central bank’s books). (v) Treatment of revaluation balances: The cross-country survey suggests that while a few central banks do not recognize valuation gains on their balance sheets or in the profit and loss (P&L), most central banks treat the revaluation balances either as ‘limited-use risk provisions’ or as ‘risk capital’. The spectrum of the varied approaches is outlined below. -
Central banks which do not have revaluation balances: Central banks which do not mark-to-market their assets/ liabilities do not have revaluation balances. The same is the case with central banks following Lower of Book or Market (LoBoM) accounting which may not have revaluation balances as they do not recognize any appreciation in the value of the concerned assets. The question of such central banks using these as risk capital/ provisions, therefore, does not arise. Such central banks are a very small minority. -
Central banks which treat revaluation balances as limited-use risk provisions: Central banks such as the members of the ESCB recognize revaluation balances and record them directly in their balance sheet and use them to offset valuation losses to the extent of the existing balances. Losses exceeding previously recorded unrealized gains are taken to P&L; and losses on assets cannot be offset against revaluation balances of other assets. These are also not distributable. The RBI’s framework belongs to this category. - Central banks which treat valuation gains as reserves: It was observed that central banks which take their valuation gains to P&L (such as the central banks which have adopted International Financial Reporting Standards [IFRS])11 generally treat them as reserves (as most central banks do not distribute unrealized gains but some do) (Bunea et al., 2016). The issue of volatility in central banks’ income, especially those with large forex holdings, is addressed through surplus smoothening mechanisms as in the case of an AE central bank, presented in Annex V.
(vi) Credit ratings of central banks: The survey revealed that a number of central banks had been rated by CRAs in the past, with many of these ratings having been unsolicited, though in certain cases such as the SNB, the rating was obtained in view of issuance of foreign currency denominated debt. Nevertheless, it was observed that the credit ratings of central banks which were not a part of any currency union were predominantly at the same level as their respective sovereigns. Rating methodology of the various CRAs (S&P, Moody’s and Dominion Bond Rating Service [DBRS]) are given in Annex VI. In this regard, the Sovereign rating methodology of S&P was updated in December 2017 to cover both the Sovereign government and monetary authorities. (The monetary authorities were till such time addressed by a separate ‘monetary authorities rating methodology’.) (vii) Central bank operations and Sovereign ratings: It was noted that CRAs in their assessment of sovereign ratings assign weightage to areas which generally fall within the purview of central banking operations. For instance, the S&P’s sovereign credit analysis rests on five pillars of institutional assessment, economic assessment, external assessment, fiscal assessment and monetary assessment. Of these, monetary assessment depends on exchange rate policy and monetary policy. While the criteria for exchange rate assessment is whether the country has a reserve currency and its exchange rate regime; the criteria for monetary policy assessment were the following: -
Monetary authority independence (strong and long-established track record of full independence with clear objectives); -
Availability of monetary policy tools and effectiveness; -
Price stability; -
Ability to act as a LoLR for the financial system; and, -
Development level of local financial system and capital markets. Source: Sovereign Rating Methodology by S&P global ratings (Dec 18, 2017), https://www.spratings.com/documents/20184/4432051/Sovereign+Rating+Methodology/5f8c852c-108d-46d2-add1-4c20c3304725 2.4 There was a view that as none of the rating parameters covers the level of economic capital held by a central bank, rating of a central bank, based on the economic capital is a misnomer. The alternative view was that global experience, as brought out in survey of literature, showed that financial resilience of a central bank was an important facilitator for achieving quite a few of the above rating criteria. The Committee noted both views. II. Central banks’ economic capital levels as defined under the ECF 2.5 Given that one of the main points supporting the perspective that the RBI is overcapitalized is a cross-country survey based on median as the ‘measure of central tendency’ published in the Economic Survey 2016 and 2017, the Committee considered the same. 2.6 For this purpose, central banks’ economic capital, as defined under the RBI’s ECF (i.e., capital, reserves, risk provisions and revaluation balances), were assessed for all the surveyed central banks. This number does not necessarily reflect what the central banks themselves consider their own economic capital to be.12 In this regard, the RBI has an overall fifth rank at 26.8 per cent of its balance sheet in 2018 with respect to central banking economic capital, which largely emanates from revaluation balances accumulated by rupee weakness vis-à-vis the US dollar. Incidentally, RBI’s position has moderated from 2013 when it had the second highest economic capital level. Among the EMDEs, the RBI’s position is fourth. The average and median among the surveyed countries on this metric when revised for incorporating latest information as well correction of discrepancies are 8.4 per cent and 8.0 per cent respectively. The relatively high level of economic capital in the case of all the above four EMDEs is primarily on account of their substantial revaluation balances arising from currency depreciation on their forex reserves. The relatively high economic capital thus does not necessarily represent a source of strength, but rather is the imprint of previous episodes of external stress. 2.7 The Committee also reviewed the position of the central bank’s realized equity as this is the component which is actually determined by the central bank management (revaluation balances being determined in a largely autonomous manner by market price movements). The RBI’s realized equity was observed to be 7.2 per cent of the balance sheet in 2018 as revaluation balances account for 73 per cent of RBI’s economic capital. 2.8 The Committee, however, noted that drawing definitive conclusions from such comparative analysis would be difficult for the following reasons: -
A central bank’s economic capital requirements will vary according to its roles and responsibilities, operating environment, reserve currency status, currency convertibility status, exchange rate regime, financial stability responsibilities, accounting framework, availability of fiscally credible RTMs, etc. The impact of these factors cannot be adjusted for in the ‘measure of central tendency’ analysis. -
The ‘measure of central tendency’ analysis also fails to take into consideration inter-temporal variations in balance sheet size and the consequent impact on the capital size. For instance, balance sheet expansion of AE central banks, post-GFC, has resulted in the lowering of levels of capital for these central banks. The capital size of two AE central banks was around 4 per cent and 50 per cent before the GFC which has reduced to about one per cent and 16 per cent, respectively. Similar trends can be seen in the case of many other AE central banks. Further, such analysis generally fails to take into consideration that during periods of external stress and currency depreciation, the revaluation balances of the central banks typically go up - thus, high level of revaluation balances would actually be reflective of currency weakness rather than financial resilience. -
Central bank equity also needs to be assessed vis-à-vis vulnerabilities on the macroeconomic and financial sector front, i.e., trade balance, current account position, gross fiscal position, forex reserves, NPAs and regulatory capital/ profitability of the banking sector, to determine the adequacy of central bank equity. -
Central banks with negative equity should not be used for arriving at an indicative norm for the RBI as the negative capital balances would not have been consciously targeted but would have resulted from the central banking operations as well as their public policy mandate. Similarly, even among the central banks which have positive capital levels, several of them have suffered losses, the impact of which has not been captured in the analysis of the targeted level of realized equity. 2.9 The Committee noted the varied central banking practices arising due to, inter alia, the differences in their mandates, accounting frameworks, balance sheet structures and operating environments. The Committee, thereafter, reviewed the RBI-specific environment. 3 The RBI’s Public Policy Mandate, the Impact on its Balance Sheet and its Risks 3.1 Having reviewed international practices, the Committee deliberated on the RBI’s specific environment, keeping in consideration the statutory mandate under Section 47 of the Reserve Bank of India Act, 1934 and public policy mandate of the RBI, including financial stability considerations. The functions of the RBI, its public policy mandate and their implications on the balance sheet and the attendant risks are discussed ahead. The RBI’s management of its risk, its risk provisioning under the ECF and the distribution of surplus under Section 47 of the RBI Act, 1934 are covered in Chapter 4. I. The RBI’s functions 3.2 The RBI is a full service central bank and its varied functions are briefly outlined below: -
Monetary authority: Formulate, operationalize and monitor the implementation of monetary policy in order to maintain price stability while keeping in mind the objective of growth. -
Regulator and supervisor of the financial system: Maintain public confidence in the system, protect depositors' interest and provide cost-effective banking services to the public. -
Regulator and supervisor of the Payment and Settlement Systems: Regulate and oversee all the payment and settlement systems in the country. -
Fostering of financial stability: Effecting macro-prudential policy; acting as the LoLR; developing and strengthening the deposit insurance framework within the country. -
Manager of foreign exchange: Administers the Foreign Exchange Management Act, 1999 (FEMA), which aims at facilitating external trade and payment and promote orderly development and maintenance of foreign exchange market in India. -
Reserve management: Acts as the custodian of foreign exchange reserves and manages them to calm volatility in the forex markets and provide adequate liquidity for ‘sudden stop’ or reversals in capital flows. -
Issuer of currency: The RBI Act confers RBI with the sole right to issue bank notes in India. The RBI’s objective is the supply and distribution of adequate quantity of currency and ensuring the quality of banknotes in circulation by continuous supply of clean notes and timely withdrawal of soiled notes. -
Developmental functions: Consumer protection, financial inclusion and development of institutions. -
Banker to the government: Banker to the Central Government vide statutory stipulations under the RBI Act, and to the state governments through various agreements. -
Debt manager to central and state governments: As the debt manager of central and state governments, RBI works to minimize the long-term borrowing costs, ensure sustainability of debt, and to deepen and widen the market for Government securities. -
Banker to banks: Maintains banking accounts of all scheduled banks and provides an efficient means of transferring funds for banks and settling inter-bank transactions. II. Impact of the RBI’s functions and public policy objectives on its balance sheet A broad overview of the RBI’s balance sheet dynamics 3.3 The size and composition of the RBI’s balance sheet is determined largely by the prevailing economic conditions, the external sector, its policy objectives and policy stance. To bring these inter-linkages, the balance sheet is presented in stylized form in Table 3.1. | Table 3.1: The stylized RBI balance sheet | | Liabilities | Per cent | Assets | Per cent | | Capital + Reserve Fund + risk provisions + revaluation balances + other liabilities (A) | 29 | Foreign Currency Assets (D) | 73 | | Gold (E) | 4 | | Government, bank deposits (B) | 18 | Domestic securities (F) | 17 | | Notes in Circulation (C) | 53 | Loans, advances, other (G) | 6 | | Total | 100 | Total | 100 | Liabilities 3.4 Being the provider of domestic liquidity, the RBI’s liabilities largely consist of reserve money (typically accounting for about 70 per cent of total liabilities) and its net non-monetary liabilities (which largely represent the RBI’s economic capital). Assets 3.5 On the asset side, the RBI’s balance sheet comprises mainly all its NFA representing, largely, the forex and gold reserves, and its NDA comprising mainly government securities. The share of NFA has varied between 65 and 90 per cent of total assets over the last 10 years. In June 2018, the share was about 77 per cent. The size, acquisition and sale of foreign assets are independent of considerations related to the balance sheet. Increases take place when the overall BoP is in surplus, either through current account surpluses or through capital account surpluses, or both; but in our context BoP surplus mostly emanates from surplus on the capital account. The foreign exchange reserves decrease sharply in years of substantial deficit on the capital account, e.g., in 2008–09. 3.6 The NFA are held in the interest of maintaining external and domestic financial and economic stability of the country. The composition of these forex reserves is determined in consultation with the Government; the reserves are spread over a basket of currencies to incorporate benefits of diversification, and the weights of currencies and the maturity of assets reflect the RBI’s long-term risk and return preferences, while ensuring their safety and liquidity. (Even here, the risk-return preferences have to take into consideration factors such as the need to maintain a major portion of reserves in the intervention currency, etc.) 3.7 The magnitude of NDA on the RBI’s balance sheet depends on the behaviour of the NFA. While accretion to the NFA results in the reserve money growth being met by such accretion, the RBI has to inject liquidity in the economy through OMO purchases in years of low growth in NFA, thereby increasing the magnitude of NDA. Overall trends in balance sheet size and growth 3.8 The size of the RBI’s balance sheet has been around 20 per cent of the country’s nominal GDP on a relatively stable basis, with a slight downward trend over the last decade or so. It is reasonable to assume that growth in reserve money (M0) which constitutes 70 per cent of the RBI’s balance sheet will approximate growth in nominal GDP in the foreseeable future. The RBI calibrates monetary expansion on the basis of income elasticity of broad money (M3) which used to range between 1.3 and 1.4 until 2010. This, however, has reduced to about 1 over the last five to ten years. The reduction in this elasticity is consistent with the significant reduction in financial savings of households observed over this period. However, reserve money growth may witness acceleration if financial savings start increasing again. 3.9 However, while the reserve money increases by nominal GDP growth rate, the movement in Net Non-Monetary Liabilities is predominantly on account of revaluation changes in the assets of the RBI whose growth or fall depends on the changing magnitude of the NFA, exchange rate and gold price movements, interest rate movements and other developments in international financial markets and the risk provisioning by the RBI. Impact of the RBI’s functions on its balance sheet Monetary policy 3.10 The primary objective of monetary policy is to maintain price stability while keeping in mind the objective of growth. With the RBI adopting the Flexible Inflation Targeting (FIT) framework since 2015, the target level of inflation is sought to be achieved by influencing the level of interest rates in the economy. The objective of monetary policy operations is to enable the smooth transmission of monetary policy impulses to the financial system by ensuring that primary liquidity is consistent with the demand in the economy, such that the resulting interest rates can enable the RBI to achieve the objective of price stability, while being cognizant of growth concerns. In assessing primary liquidity (reserve money) requirements, the RBI has to meet the demand for currency from the public and liquidity needs of banks for statutory reserves. The size and growth of the RBI’s balance sheet is thus determined primarily by liability size considerations, i.e., reserve money. The balance sheet has had an annual growth of around 9.5 per cent over the past 10 years, and about 8.6 per cent in the past five-year period 2013-14 to 2017-18. The last five years’ average was low because of demonetization carried out in 2016–17. The impact of the monetary policy operations is on the following lines: Liquidity Adjustment Facility and Open Market Operations -
The effect of Liquidity Adjustment Facility (LAF) and OMO on the balance sheet depends on the purpose of the action. If OMOs are conducted to increase the reserve money, it increases the size of the RBI’s balance sheet, i.e., items (B) and (F) in Table 3.1 would increase. In case these are done for sterilization purpose (mopping up the liquidity impact of capital inflows), it contracts the balance sheet, i.e., items (B) and (F) in Table 3.1 would decrease. -
In the case of repo operations LAF, the balance sheet expands with items (B) and (G) in Table 3.1 increasing. However, in the case of reverse repo, the size of the balance sheet is not impacted as the inter-liability accounts adjust amongst themselves. -
The conduct of OMO and LAF operations also impacts the profitability and surplus of the RBI, depending upon the profit/ loss incurred and interest income earned/ foregone in the case of OMOs and the interest earned/ paid in case of repurchase collateralized operations. -
Interestingly, even though both OMO purchase and repo operations increase the size of the balance sheet, there is considerable difference in the impact on the RBI’s risks given that the former increases the interest rate risk on the balance sheet (due to the increased size of the domestic securities portfolio) while there are no valuation risks in the repo operations as ‘loans and advances’ are not marked to market. -
Similarly, if OMO operations are carried out to sterilize the increase in liquidity due to forex intervention operations in the wake of capital inflows, it changes the composition of the balance sheet by increasing the forex component. This not only increases the currency risk of the RBI, but also reduces its income as it replaces high yielding domestic securities with lower yield foreign securities. This increase in risk, of course, is offset to a limited extent as the duration on the forex portfolio is shorter than the domestic portfolio, which reduces the impact of the interest rate risk. Statutory Liquidity Ratio (SLR) and Cash Reserve Ratio (CRR) -
A change in CRR will change the size of the RBI balance sheet notwithstanding the fact that the CRR is now looked upon more as an instrument of prudential regulation. While any reduction in CRR is generally associated with a reduction in the liability side of the balance sheet in the form of statutory reserves maintained by banks with the RBI, the increase in CRR may increase the size of the liability side. The corresponding changes in the asset side are mainly through changes in NDA. -
There is limited impact of SLR change on the RBI’s balance sheet.13 Exchange rate management 3.11 While operationally the exchange rate is determined by the market, i.e., forces of demand and supply, and the level of reserves is essentially a result of sale and purchase transactions, the level also needs to be seen in the overall context of exchange rate management. The conduct of exchange rate policy is guided by the objective of modulating undue volatility and discouraging speculative activities in the foreign exchange market, while ensuring that exchange rate movements are orderly and calibrated. In this regard, the RBI interventions are not governed by a predetermined target or band around the exchange rate. To illustrate this, we look at the BoP relationship which lists all transactions made between entities in a country and the rest of the world over a defined period of time which is reflected as: | Capital Account Flows + Current Account Flows + Changes in Official Reserves Account = 0 | 3.12 Out of the three components of the BoP, capital flows by nature tend to be the most dominant factor in influencing the exchange rates in the short term, as capital flows tend to be larger and more volatile than the current account flows. The impact of capital inflows on the balance sheet is along the following lines: -
Capital inflows can be expected to increase the balance sheet size of the RBI [items (B) and (D) in Table 3.1 will increase], unless the interventions in the forex market are perfectly sterilized [items (B) and (F) will reduce]. The composition will be altered in favour of NFA in either case. -
The size of the NDA is then contingent upon the magnitude and direction of forex flows. During capital flight, NDA would accumulate as the central bank has to infuse liquidity. On the contrary, inflows would imply reduction of NDA to sterilize the liquidity impact of such inflows. -
If there are valuation gains in the forex assets due to exchange rate or interest rate movements, there is a simultaneous increase in the revaluation balances on the liability side and forex assets on the asset side resulting in an increase in the balance sheet by the same amount. -
Large capital inflows will lead to increase in the NFA in the balance sheet, thereby increasing currency risk. Credit risk also increases with the size of the reserves as central banks will be pressed to bring about an appropriate level of return even at the cost of taking more risk. If the central bank decides not to compromise in its counterparty standards, concentration risks could arise on the portfolio. -
Incidentally, the risks to RBI arising out of intervention/ sterilization operations is captured under the ECF using scenario analysis as brought out in Annex VIII. The issue of whether the adoption of the FIT regime will bring about a change in scale of RBI’s forex interventions/sterilization operations is examined in Box 3.1. Box 3.1: Scale of RBI’s foreign market interventions /sterilization operations under the Flexible Inflation Targeting regime The primary objective of monetary policy in India is to maintain price stability while keeping in mind the objective of growth. Price stability is a necessary precondition to sustainable growth. In May 2016, the RBI Act, 1934 was amended to provide a statutory basis for the implementation of the FIT framework. It also provided for the inflation target to be set by the Government, in consultation with the RBI, once every five years. Accordingly, the Government notified a Consumer Price Index (CPI) based inflation of 4 per cent as the target for the period August 5, 2016 to March 31, 2021 with the upper tolerance limit of 6 per cent and the lower tolerance limit of 2 per cent. 2. There is a view that with the implementation of the FIT framework, the need for carrying out foreign exchange market interventions and subsequent sterilization operations may have reduced considerably. In terms of the uncovered interest-rate parity (UIP) hypothesis, currencies with higher interest rates are expected to depreciate in order to equalize returns across currencies. The theoretical reasoning could, therefore, be that with the stabilization of inflation expectations through the implementation of FIT, there will be stability in exchange rates and the need for subsequent forex market interventions/sterilization operations will be minimal. In other words, the objective of stabilizing exchange rates is subsumed within the FIT framework and does not merit separate consideration. In reality, however, this need not be the case given that empirical evidence indicates that UIP typically holds in the medium and long run. In the short run, however, UIP is unsubstantiated, i.e., currencies with higher interest rates tend to exhibit appreciation, driven by capital flows, arbitrage opportunities and carry trade. Increasing vulnerabilities associated with a progressively open capital account, global spillovers, volatility of markets and sudden stops/ starts in capital flows are unlikely to significantly reduce the need for the RBI from intervening in the forex market in the foreseeable future, given that such interventions are addressed to quell speculative activities and maintain orderly conditions in the foreign exchange market. This is especially true in light of the vulnerability of India’s twin deficits to exogeneous factors such as global crude oil prices and change in the monetary policy stance of AEs. | Issuer of currency 3.13 The banking system would have to fund cash flows as currency is a leakage from the banking system to the extent it is held by the public as a direct claim on the central bank. -
If cash withdrawals are accommodated by changes in bank reserves, there is no change in the size of the balance sheet (and reserve money) although a decline in excess reserves could put pressure on interest rates. -
If the banking system has to take recourse to the RBI either through standing facilities or repo operations, there would be a similar expansion in the balance sheet (and reserve money) without any change in bank liquidity or interest rates. Maintenance of financial stability 3.14 The LoLR role of the RBI can potentially have a significant impact on its balance sheet size and composition. The primary risk arising from ELA operations would be on credit exposures to distressed entities. In addition to the credit losses, the ELA operations shall have an expansionary impact on the balance sheet and would be expected to increase the share of NDA in RBI’s total assets, not only on account of the increase in the RBI’s ‘loans and advances’ portfolio but also a decrease in forex reserves in dollar terms which could be expected in view of capital flight during financial stability crises. A depreciating rupee would make the reduction in forex reserves appear to be smaller in rupee terms. These scenarios have been captured under the ECF as brought out in Annex VIII. Banking regulator and supervisor of banks, non-banking financial companies (NBFCs) and primary dealers 3.15 This function is not expected to impact the RBI’s balance sheet directly. Nevertheless, even with an effective regulatory and supervisory framework, black swan events cannot be truly eliminated giving rise to ELA risks. Debt manager of both central and state governments 3.16 With the Fiscal Responsibility and Budget Management Act, 2003 (FRBM Act) precluding the RBI’s operations from the primary market for government securities, this function does not significantly impact the RBI’s balance sheet. Nevertheless, it does give rise to significant operational risk. Operating the Deposit Insurance and Credit Guarantee Corporation 3.17 As per Deposit Insurance and Credit Guarantee Corporation Act, 1961 the amount outstanding advanced by the RBI to the DICGC at any one time shall not exceed ₹5 crore rupees. Therefore, in normal times, DICGC operations will not have a significant impact on RBI’s balance sheet. However, in times of crisis, significant ELA to the DICGC cannot be ruled out. Further, the DICGC being a wholly owned subsidiary, significant losses beyond its capital could be expected to be borne by the RBI. Development role refinance to National Bank for Agriculture and Rural Development (NABARD), National Housing Bank (NHB), Small Industries Development Bank of India (SIDBI), India Infrastructure Finance Company Limited (IIFCL) 3.18 The RBI’s development role is not expected to have any significant impact on its balance sheet. The refinance support to these entities has been discontinued since a long time. III. The RBI’s risks 3.19 Having discussed the impact of the RBI’s functions on its balance sheet and contingent liabilities, the Committee, thereafter, reviewed the risks to which the RBI is exposed to. Currency risk 3.20 The most significant impact of public policy considerations on the RBI’s balance sheet is the size of the forex reserves maintained to manage the volatility in the exchange rate. While these reserves provide the economy with a buffer against external stress (a public good), they give rise to significant risks for the RBI. Given that these reserves represent a ‘war chest’, they have to be maintained as open, unhedged positions14 thereby exposing the RBI to currency risk15 on more than three-fourths of its balance sheet. Consequently, the RBI suffers losses when the rupee appreciates against the USD and/ or the other currencies in its forex portfolio and it gains when the rupee depreciates against them. Thus, counter-intuitively, the RBI suffers valuation losses during times when the economy is witnessing strong growth and large capital inflows which normally are associated with rupee appreciation.16 Table 3.2 brings out the large episodes of rupee appreciation in three distinct but relatively recent time periods. | Table 3.2: Historical episodes of large USD-INR appreciation | | Date | Period | USD INR | Rupee appreciation | | 24/07/2006 | 16 months* | 46.93 | 19.51%
(16.63% within a 12 month period) | | 07/11/2007 | 39.27 | | | | | | | 05/03/2009 | 13 months | 52.06 | 17.38%
(13.71% within a 12 month period) | | 09/04/2010 | 44.35 | | | | | | | 28/08/2013 | 9 months | 68.36 | 17.00% | | 19/05/2014 | 58.42 | 3.21 Conversely, the RBI witnesses considerable accretion to its revaluation balances (i.e., Currency and Gold Revaluation Account [CGRA]) during periods of external stress (i.e., 2008, 2011 and 2013) when the trend towards depreciation is markedly strong. This is brought out in Chart 3.1. 3.22 The currency risks on the balance sheet also increases if the share of forex reserves increases as a percentage of the balance sheet. Chart 3.2 shows the changing composition of the RBI’s balance sheet with the share of forex reserves peaking in the mid 2000s due to strong capital inflows. Thereafter, there has been a fall in the share of forex reserves due to interventions during 2008, 2011 and 2013. There has been a marginal rise since then. 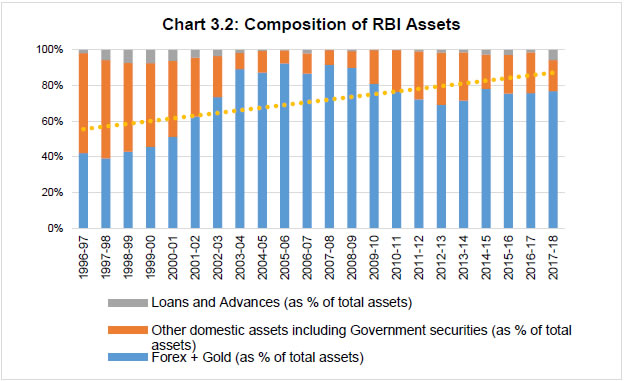 3.23 The Committee noted that given the expanding net negative International Investment Position (IIP) of India, the magnitude of foreign exchange reserves provides confidence in international financial markets. At present, the foreign exchange reserves (more than $400 billion) are significantly lower than the country’s total external liabilities ($1 trillion) and even lower than total external debt ($500 billion). This position is in contrast to that in 2008 when India’s foreign exchange reserves, at $310 billion, exceeded the then total external debt of about US$224 billion and provided a much larger coverage of total external liabilities that amounted to about $426 billion. This needs to be taken into account in assessing the external risk being faced by the country and the possibility that the RBI may be required to increase the size of its forex reserves with its concomitant implications for the balance sheet, risks and desired economic capital. This is especially important given that the RBI’s public policy objectives of maintaining external stability during a crisis would have to be pursued irrespective of the adequacy of its risk buffers. It is, therefore, imperative that the RBI maintains a forward-looking view on the adequacy of its risk buffers even during normal times. The Committee also noted that the RBI, in consultation with the Government, periodically reviews the adequacy of the country’s forex reserves. Further, a separate internal group of the RBI is looking into the question of developing a formal framework to assess the adequacy of the forex reserves. 3.24 The Committee also deliberated on the issue of whether as the central bank, the RBI has potentially an infinite capacity to prevent rupee appreciation as it can print money to purchase foreign currency. It noted that the RBI’s interventions are carried out in line with its exchange rate policy and not to prevent losses, which would go against its public policy mandate. Further, while the RBI has significant (not infinite) ability to intervene in the market, its capability to prevent its own losses during periods of rupee appreciation was not so. It was noted that sterilization operations in 2003–04 and 2009–10 following its intervention operations caused a significant decline in its gross income. Gold Price risk 3.25 The gold reserves are seen as strategic assets and not actively managed. The gold price risk, therefore, is fully provisioned for. This risk resulted in a valuation loss of (-) ₹16,370 crore in 2012–13 due to decrease in gold price. There is no interest rate risk for this asset. Interest rate risks 3.26 In addition to currency risks, the RBI has significant interest rate risks on both its forex as well as its domestic securities portfolio. While the RBI does actively manage the interest rate risk on its forex portfolio, this is not possible in the case of the domestic portfolio as such operations could conflict with monetary policy operations. These risks (including residual forex interest rate risks), therefore, need to be covered by RBI’s risk provisioning. The impact of simultaneous materialization of currency and interest rate risks 3.27 It was also observed that there have been occasions when increasing yields and appreciating rupee have materialized concurrently as indicated in Chart 3.3, resulting in considerable erosion of the RBI’s risk provisioning as seen from Table 3.3. For instance, in 2006–07, 75 per cent of RBI’s revaluation balances were wiped out amounting to 1.5 per cent of the GDP. In 2016–17, RBI’s revaluation balances fell more than ₹1 trillion due to an appreciating rupee and cross-currency movements. The only reason the markets, government fiscal balance and the economy as a whole are not impacted was that the RBI had sufficient risk provisioning to absorb these risks.
| Table 3.3: Decline in Revaluation Balances | | Year | YoY % decline | As % of B/S | As % of GDP | | 2004–05 | -56.8% | -5.2% | -1.1% | | 2006–07 | -75.0% | -6.5% | -1.5% | | 2009–10 | -35.4% | -4.5% | -1.1% | | 2014–15 | -3.1% | -0.6% | -0.1% | | 2016–17 | -14.7% | -3.1% | -0.7% | | Source: RBI, Bloomberg, Reuters, and Economic Survey 2017–18. | Do valuation risks matter or are they paper risks as they are essentially book entries? Do they require risk provisioning? 3.28 The answer is relatively straightforward: valuation risks are very real and can trigger substantial losses for the central bank. Undoubtedly, there is greater flexibility in their handling, given that they can be offset against previously accumulated valuation gains (in addition to previously accumulated realized surplus) and the concerned revaluation balances can operate in the negative through the year—till the balance sheet date (as has happened for the RBI in the case of IRA-FS in 2016–17 and 2017–18). On balance sheet date, all losses, whether they are valuation losses, credit losses, operational losses or ELA losses, have to be recognized. 3.29 In this connection, it was noted that a number of central banks have negative capital today, precisely because of their valuation losses. Credit risk 3.30 The credit risk of the RBI is generally believed to be low on account of the following reasons: -
It maintains its forex reserves in high quality liquid assets (HQLA) which present low credit risks and its assets are largely in sovereign or sovereign guaranteed assets with very low default probabilities. -
Its domestic liquidity operations are collateralized with G-secs with margins. 3.31 The RBI's forex reserves are invested in bonds/ treasury bills that represent debt obligations of highly rated sovereigns, central banks and supranational entities. Further, deposits are placed with central banks, the BIS and overseas branches of commercial banks. Nevertheless, the measurement, monitoring and management of credit risk by a central bank is important to restrict counterparty credit risk and to ensure that the overall level of portfolio credit risk is consistent with the risk appetite of the central bank. Further, it was also recognized that complete elimination of any form of risk may not be possible (or even considered desirable from the risk-return perspective) as risks can metamorphize into unexpected forms, in unanticipated areas. The same principle applies for credit risk as well. An expanding forex portfolio, a conservative investible universe and the need for maintaining reserves in high quality and liquid assets places limitations on the possibility of diversification. This has resulted in the rising concentration of risks, with the Hirschman–Herfindahl Index (HHI) of the portfolio approximated to be 47 per cent (the HHI indicates the diversification benefits are more pronounced when the HHI has a value below 20 per cent). Further, risk also emerges from the swap facilities entered into with some of the central banks as well as the off-balance transactions entered into with domestic counterparties. Risk provisioning is required for the residual credit risk from the forex portfolio. 3.32 With regard to domestic lending operations, as indicated above, there is little credit risk as RBI’s lending operations under normal conditions are collateralized with haircuts being maintained. However, significant credit risk can arise from ELA operations during periods of stress, which is captured separately under financial stability risks. Operational risks 3.33 Substantial operational risks emanate from the conduct of various operations of the RBI, particularly those outlined below: -
Management of a multi-currency portfolio across multiple time zones and legal jurisdictions as around 75 per cent of the RBI’s assets are custodized abroad. -
Significant market operations in domestic markets. -
Management and operation of a significant portion of the country’s payment and settlement systems. -
Large currency management operations spread across the country, etc. Monetary and financial stability risks Monetary operations 3.34 In addition to above market risks, the RBI’s monetary policy (sterilization) operations can significantly impact its income year-on-year as was seen in 2003–04 (-) ₹8,860 crore (a fall of 38 per cent vis-à-vis the previous year); 2009–10: (-) ₹27,848 crore (a fall of 46 per cent vis-à-vis the previous year); 2016–17: (-) ₹19,052 crore (a fall of 24 per cent vis-à-vis the previous year). Incidentally, these risks materialize when the balance sheet is already under strain due to the appreciating rupee (Chart 3.4). The RBI, nevertheless, did not suffer an overall loss during these years. 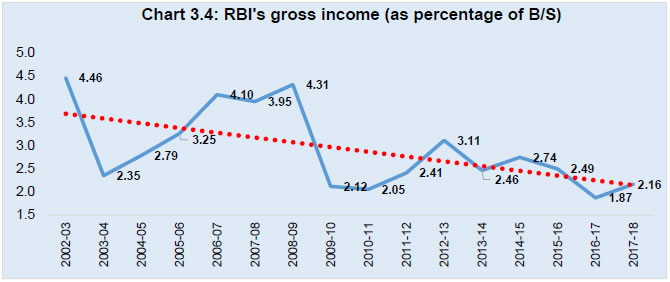 3.35 The MSS does form a RTM for the RBI, though fiscal pressures can limit the extent of its use. Going forward, even with the expected implementation of the Standing Deposit Facility (SDF), sterilization risks may not necessarily be reduced as interest will have to be paid on these deposits, and unlike the OMO which were effectively limited by the extent of G-sec held by the RBI, this would not be a constraint under the SDF. Risks arising out of financial stability mandate 3.36 While the RBI has one of the widest LoLR roles among central banks under Section 18 of the RBI Act, 1934, the ECF assesses the ‘more traditional of the ELA risks’ arising from Section 17 of the said Act. There is a view that these risks need not be covered as they have never materialized in the past and a substantial portion of the country’s banking sector is in the public sector domain. 3.37 There was another view that this represented a low probability but very high impact risk for the RBI, especially as international experience has demonstrated the vast scale of these risks as well as that contagion could spread very fast even if triggered by external sources in these days of interconnected markets. Further, the experience from GFC and more recent experiences such as Russia have shown that the ownership of the banking sector becomes more public sector oriented during periods of crisis, as the government may be required to support systemically important financial institutions to prevent contagion. This would significantly constrain the fiscal space available to the Government to recapitalize the RBI were it to suffer ELA losses. The financial stability risks of the RBI are discussed extensively in Chapter 4. The natural smoothening of central banks’ requirement for economic capital across the business cycle 3.38 Mention may also be made of a broad smoothening of the central bank’s economic capital requirements over the various stages of the business/ economic cycle. During periods of growth, the economy can be expected to receive relatively high capital inflows, thereby increasing the size of the NFA in the balance sheet and, in the face of currency appreciation, triggering valuation losses. During periods of downturn, the size of the NDA may increase which would normally suggest a reduction in the level of currency risk and, hence, the requirement for economic capital. However, the reduction in the NFA could be a result of capital outflows/ flight or the drying of the capital inflows into the country, suggesting growing systemic risk in the economy for which central banks also require economic capital in view of the enhanced financial stability risks. 3.39 The Committee, having reviewed the RBI’s public policy mandate and impact on its balance sheet and its risks, reviewed the RBI’s extant ECF in light of the same. 4 Review of the Economic Capital Framework and Staggered Surplus Distribution Policy of RBI 4.1 As highlighted earlier, the RBI has over the years developed a number of frameworks to assess its risks and the optimal level of risk provisioning. The frameworks evolved as the balance sheet expanded both in terms of size and complexity in addition to the underlying risk profile. They were also informed by developments in methodologies for identification and measurement of risk. The Committee, having deliberated on the international practices and the implications of the RBI’s public policy mandate on its balance sheet and the risks thereof, broadly reviewed the various approaches adopted in the past to assess risk provisioning to distil useful learnings for the future. The outline of this chapter is as follows: -
A historical perspective of risk provisioning in the RBI -
The extant Economic Capital Framework -
The Staggered Surplus Distribution Policy -
Developments subsequent to the introduction of the SSDP -
Certain concerns with regard to the extant ECF -
RBI’s rationale for ECF parameterization -
ECF–SSDP and risk provisioning -
Quality of RBI’s economic capital -
The ECF going forward -
The opportunity cost of RBI’s economic capital -
The Surplus Distribution Policy going forward -
Determining whether available risk provisions are in excess of required risk provisions -
Treatment of excess unrealized revaluation balances -
Treatment of excess realized risk provisions -
Interim dividend and aligning RBI’s financial year with the Government’s fiscal year -
Periodicity of review of the ECF I. A historical perspective of risk provisioning in the RBI 4.2 The salient recommendations of the various frameworks used to determine the risk provisioning of the RBI are summarized below, with a more detailed write-up presented in Annex VII. Further, in view of the extensive deliberations which took place in the Committee as to whether revaluation balances should be treated as risk buffers under the ECF, the Committee reviewed the approach adopted under all three methodologies: -
Subrahmanyam Group (1997): The Group proposed building up the CF and ADF to 12 per cent of the RBI’s balance sheet size out of the realized income of the RBI by 2005. Of this, 5 per cent was earmarked to meet shocks arising out of open market operations, 5 per cent to absorb external shocks from exchange rate volatility; and the remaining 2 per cent was proposed towards a systemic risk/developmental role. With regard to the treatment of the revaluation balances as a risk provision, the Group recognized that, in effect, while the Exchange Fluctuation Reserve (EFR), the erstwhile CGRA, absorbs the fall in gold prices, appreciation of dollar against non-dollar currencies and/or appreciation of the rupee, it may not be able to absorb large exchange rate shocks. Hence, an EFR of 5 per cent was deducted to arrive at the 5 per cent requirement of the CF for external sector risks. -
Malegam Committee (2014): The Committee, having reviewed apparent worst-case scenarios, proposed that no further transfers be made to CF and ADF for a period of three years (2013-14 to 2015-16), as the balances therein were in excess of assessed target requirements. This methodology, like the Subrahmanyam Group, recognized the principle that treated the revaluation balances as limited-use risk buffers against specific risks. For instance, the CGRA was treated as a risk buffer for exchange rate risk and gold price risk, while the IRA was treated as a risk buffer for interest rate risk. Any revaluation balances in excess of the specific risks were ignored. -
ECF (2015): Given the time frame of three years set by the Malegam Committee, work on the ECF was initiated early, which is the current framework to assess risk provisioning by the RBI. Basel methodologies are used to assess the risk provisioning requirements of the RBI. The ECF has adopted a broader approach towards revaluation balances compared to the Subrahmanyam Group or the Malegam Committee. The framework treats the revaluation balances as fungible and these are mapped against valuation risks as a whole for the RBI.17 4.3 The Thorat Committee (2004) recommendations were not accepted by the RBI. 4.4 A historical perspective (1990–91 to 2017–18) of the movement in the economic capital of the RBI (Box 4.1) was also considered. Box 4.1: RBI’s economic capital, risk provisioning and surplus distribution (1990–91 to 2017–18) While the concept of economic capital was first introduced in mid-2014, the various components of economic capital have been on RBI’s balance sheet for long. Certain salient points emerging from the above chart are as follows: -
The impact of the RBI’s risks materializing in the wake of the 1990–91 crisis is clearly visible as the CF declined from 4.5 per cent in 1990–91 to 0.5 per cent in 1992–93. Consequent to this, the Subrahmanyam Committee recommended that CF plus ADF should be built up to reach 12 per cent of the balance sheet by 2005. -
It is seen, post-1997, that there was a marked build-up of the CF plus ADF to 11.71/11.7 per cent of the balance sheet by 2001–02/2002–03. However, the target of 12 per cent was never reached. Thereafter, the level of CF declined (in relative terms) and stabilized at around 10 per cent of the balance sheet till around 2007–08. -
Between 2000–01 and 2011–12, very high volatility in the level of revaluation balances is witnessed with CGRA levels ranging from 2 per cent in 2006–07 to 14 per cent in 2008–09. During this period, the Thorat Committee report recommending that CF plus ADF plus CGRA be maintained at 18 per cent of the balance sheet was rejected in 2004–05, considering CGRA as an adjustment account and not a reserve which can be reckoned to arrive at an appropriate level of internal reserves. -
A renewed push towards the 12 per cent benchmark is discernible during 2008–09—the year of the GFC. However, this is short-lived and there is an almost secular downtrend of CF plus ADF to 7.05 per cent by 2017–18. The few years where there were minor upticks were during the period of high market volatility of ‘Taper Tantrum’ in May–August 2013 and then again following ‘Demonetization’ in 2016–17. -
The Subrahmanyam Group methodology, however, failed to take into consideration the possibility of a very sharp and sustained increase in revaluation balances which occurred in 2011–12 when the CGRA reached 22 per cent of the balance sheet. This resulted in relatively higher retention for two years, i.e. 2011–12 and 2012–13, than would have happened under ECF. Nevertheless, over the entire 18 year review period, it is only these two years where it is possible to conclude, with the benefit of hindsight, that the Subrahmanyam Committee recommendations resulted in suboptimal surplus distribution levels. The Committee noted that given the volatility in the CGRA during the previous years and the enhanced risk environment at that point in time (post US-downgrade and Taper Tantrum volatility), it may not have been anticipated that the sharp rise in revaluation balances would not be reversed, as had happened in the past. -
The drawdown of CF plus ADF through balance sheet expansion on the basis of the recommendations of the Malegam Committee after 2013–14 (which was supplemented by the ECF analysis from 2014–15) can be discerned. | 4.5 Some of the key takeaways from the analysis presented in Box 4.1 are: -
The revaluation balances act as the first line of defence against market risks, as can be seen clearly between 2001–02 and 2009–10. This is particularly important given that market risk comprises the largest risk on RBI’s balance sheet. -
The non-inclusion of revaluation balances as market risk buffers could demonstrably result in suboptimal levels of realized risk provisioning, particularly when revaluation balances are high (as was the case from 2011–12 to 2012–13). 4.6 In light of the above, the Committee reviewed the status, need and justification of the various reserves, risk provisions and risk buffers maintained by the RBI and recommended their continuance. The Committee recommended that the RBI should explicitly recognize the ADF not only as a provision for capital expenditure, but also as a risk provision in case of need, and that appropriate disclosures to that effect may be made in its annual report. With regard to revaluation balances, the Committee recommends the following: -
Inclusion of the revaluation balances as a part of RBI’s overall risk buffers with the recognition of its special character. -
Mapping market (MTM) risks against revaluation balances (which are accumulated net MTM gains). -
Limited one-way fungibility between revaluation balances and realized equity to continue, whereby a shortfall in revaluation balances can be met through increased realized risk provisioning but not vice-versa. -
In view of international practice and RBI’s specific circumstances, the extant principle of non-distribution of revaluation balances would need to be continued as a part of the ECF. 4.7 The Committee recommends the need to draw a distinction between realized equity and revaluation balances for the following reasons: -
Revaluation balances are highly volatile, and whose levels move autonomously depending on RBI’s discharge of its public policy objectives of maintaining price, financial and external stability, coupled with international market developments reflected in movements in the price of foreign assets, exchange rate, interest rate and gold price. -
Revaluation balances cannot be used to cover risks which are not valuation risks as this can, in effect, result in the distribution of unrealized revaluation gains were such ‘non-valuation risks’ to materialize. Revaluation balances can, therefore, be treated as limited purpose risk buffers to be used against market risks only. -
There are significant strategic and operational constraints in the monetization of the revaluation balances (Annex VIII). 4.8 In view of the distinction sought to be made between realized equity and revaluation balances, the Committee was of the view that clearer presentation of information was required in the RBI’s Annual Accounts. This is important in light of the very different estimates of RBI’s capital which has been mentioned in the public domain.18 In the RBI’s balance sheet, while Capital and Reserve Fund are explicitly shown on the balance sheet, other sources of financial resilience are grouped under ‘Other Liabilities and Provisions’ and enumerated via Schedules making it difficult to arrive at total risk provisions. The Committee, therefore, recommends a more transparent presentation of the RBI’s Annual Accounts with regard to the components of economic capital, on the lines as indicated in Table 4.1. The Committee noted that changes in the format of presentation of balance sheet would require necessary amendments to the RBI General Regulations. The information may, therefore, be presented as a Schedule to the balance sheet till such time the processes for completing change in style of balance sheet presentation are formalized. | Table 4.1: Extant / suggested presentation of liability side of RBI’s balance sheet | | Existing liabilities format | Proposed liabilities format | | -
Capital -
Reserve Fund -
Other Reserves -
Risk Provisions -
Contingency Fund -
Asset Development Fund -
Revaluation Accounts -
Deposits -
Other Liabilities -
Notes in Circulation | 4.9 After incorporating the aforementioned changes, the balance sheet of the RBI as on June 30, 2018 would appear as given in Table 4.2. | Table 4.2: Extant / suggested presentation of liability side of RBI’s balance sheet as on June 30, 2018 | | (₹ billion) | | Existing liabilities format | Proposed liabilities format | | Capital | 0.05 | Capital | 0.05 | | Reserve Fund | 65.00 | Reserve Fund | 65.00 | | Other Reserves | 2.28 | Other Reserves | 2.28 | | Deposits | 6,525.97 | Risk Provisions | | | Other Liabilities and Provisions | 10,463.04 | • Contingency Fund | 2,321.08 | | Notes in Circulation | 19,119.60 | • Asset Development Fund | 228.11 | | | | Revaluation Accounts | 7,081.88 | | | | Deposits | 6,525.97 | | | | Other Liabilities | 831.97 | | | | Notes in Circulation | 19,119.60 | | Total | 36,175.94 | Total | 36,175.94 | 4.10 The Committee was of the view that given the inclusion of the revaluation balances in the RBI’s overall risk buffers, measures to address volatility will have to be introduced. After examining the various options, it was decided that this would be done by articulating RTLs. II. The extant Economic Capital Framework 4.11 Following the submission of the Malegam Committee, the RBI started developing the ECF. The ECF was first considered by the RBI’s Central Board in its March 2015 (New Delhi) meeting and, thereafter, extensively discussed at the May 2015 (Goa) meeting and a number of subsequent Central Board meetings. Discussions were also held with the Government, including meetings at the Secretary level. While the ECF analysis underpinned the surplus distribution decision for the year 2014–15, after extensive discussions at the Central Board in the August 2015 (Mumbai) meeting and finalized at the October 2015 (Aizawl) meeting, the financial resilience target for the RBI was formalized as a provisioning framework which would be consistent with the Board's aspiration to achieve, in the medium to long run, an aggregate level of provisions as usually made by bankers in order to enable it to match the highest credit rating available in international capital markets and to have sufficient additional provisions to meet financial system contingencies that may arise. 4.12 In view of the Government’s request for further discussion on the framework, extensive deliberations were held with the Government on the risk methodologies adopted under the ECF and all information sought was provided. Thereafter, the framework was formally adopted in the year 2015–16 with the transfer of RBI’s surplus to the Government for the year being unanimously approved by the Central Board at its meeting held on August 2016 (Mumbai), based explicitly on the ECF methodology, using the following parameters: S-VaR 99.99 per cent CL and a CRB target of 3 per cent with a medium-to long-term target of 4 per cent of the balance sheet. 4.13 In both the years (2014–15 and 2015–16), the ECF facilitated the almost full transfer of surplus to the Government by providing the Central Board an assurance of the RBI’s continued financial resilience at the desired levels, thereby also complying with the recommendation of the Malegam Committee that full transfer should take place for three years (2013–14 to 2015–16). The surplus distribution decision for the first year of Malegam Committee’s recommendations, i.e. 2013–14, was back-tested under the ECF and it was observed that the full transfer was also in line with ECF’s recommendations. Thus, there were no marked differences in the implied surplus transfer as per the ECF and those recommended by the Malegam Committee for the years 2013–14 to 2015–16. The ECF assessments from June 30, 2014 to June 30, 2018 are given in Table 4.3. | Table 4.3: The level of risk exposures and available risk buffers – Evolution | | Risk and buffers held | As of | | June 30, 2014 | June 30, 2015 | June 30, 2016 | June 30, 2017 | June 30, 2018 | | % of B/S* | % of B/S | % of B/S | % of B/S | % of B/S | | 1. Market risk (@99.99% CL) | 24.5 | 25.3 | 25.1 | 24.3 | 24.4 | | 2. Credit risk | 0.4 | 0.4 | 0.4 | 0.4 | 0.4 | | 3. Operational risk | 0.4 | 0.4 | 0.4 | 0.4 | 0.3 | | 4. Contingent risks | 2.0 | 2.0 | 3.0 | 3.0 | 3.0 | | 5. Total risk [1+2+3+4] | 27.3 | 28.1 | 28.9 | 28.1 | 28.1 | | 6. Realized equity (prior to risk provisioning for the year) | 9.5 | 8.6 | 7.7 | 7.4 | 6.8 | | 7. Risk provisioning for the year | 0 | 0 | 0 | 0.4 | 0.4 | | 8. Realized equity (after risk provisioning for the year) [6+7] | 9.5 | 8.6 | 7.7 | 7.8 | 7.2 | | 9. Revaluation balances | 22.1 | 19.5 | 21.3 | 17.9 | 19.6 | | 10. Overall risk buffers [8+9] | 31.6 | 28.1 | 29.0 | 25.7 | 26.8 | | 11. Net risk buffers (vis-à-vis target) (after transfer to GoI) [10-5] | (+) 4.3 | 0 | (+) 0.1 | (-) 2.4 | (-) 1.3 | The technical aspects of the ECF 4.14 A detailed write-up on the ECF is given in Annex IX, with the salient features outlined in Box 4.2. Box 4.2: The ECF of the RBI The ECF defines a risk-based economic capital benchmark for the RBI based on international practices and its public policy mandate. The objective of holding risk equity as articulated by the RBI under the ECF is to ensure the following: The RBI has sufficient financial resilience to ensure the credibility of its policy actions, domestically and internationally, by demonstrating its financial strength to deter the markets from seeking to ‘game’ the central bank’s willingness to carry out loss-making policy actions. -
The RBI is seen as an unimpeachable counterparty in international transactions, even in times of stress. -
Sufficient buffers are maintained which may be used as a financial-stability safeguard in times of need, i.e., the country’s ‘rainy day’ provision for a financial stability crisis.
The ECF has been developed as an integral part of the Enterprise Risk Management (ERM) framework being implemented by the RBI in a phased manner since 2012. As part of this framework, the RBI has articulated its risk philosophy formally (Annex X) which, inter alia, states: ‘As financial risk considerations remain subordinate to the Bank's public-policy objectives, adequate provision is sought to be built to absorb the risks that could materialize from various eventualities.’ Accordingly, the ECF assesses this risk provisioning requirement as per the provisions of Section 47 of the RBI Act, 1934.
Risks covered under the framework and their assessment
For the balance sheet risks, i.e. market, credit and operational risks, the RBI adapted the prevailing Basel methodologies as these represented possibly the most widely accepted risk assessment methodologies. -
Stressed Value at Risk for market risk at 99.99 per cent CL using a 10-day return, over a time horizon of one year, using parametric distribution with a decay factor of 0.995. -
Standardized Approach used for credit risk. -
Basic Indicator Approach used for operational risk. -
The Contingent Risks of the RBI comprise the monetary and financial stability risks which are central bank specific and assessed using scenario analysis. The scenario analyses capture risks arising out of both ELA operations and sterilization operations. Risk exclusions -
The ECF, while assessing ELA risks of the RBI, does so only under Section 17 of the RBI Act, 1934 and not under the very wide ambit of Section 18. This risk is not assessed as it is virtually impossible to assess wider liquidity provisions required from the RBI in the event of a grave crisis. Nevertheless, this statutory provision can give rise to very significant risks for the RBI. -
The market and credit risk of off-balance sheet exposures are not covered. It was noted that the ECF does not explicitly assess liquidity risk (one of the largest risks for commercial banks) either for its rupee assets (as RBI being the provider of rupee liquidity is not exposed to this risk), or for its forex portfolio (as the market risk time horizon of one year covers this risk). Components of risk equity under the ECF
The various components of risk equity under the ECF are: -
Capital and Reserve Fund. -
Realized risk provisions retained as CF and ADF. -
Revaluation balances which include CGRA, IRA-FS, IRA-RS, FCVA. The treatment of revaluation balances under the ECF: (i) No haircuts are applied on these balances while assessing the economic capital. (ii) The framework treats all the revaluation balances as fungible and these are mapped against valuation risks as a whole for the RBI. This approach has been adopted for two reasons: -
The market risk of the entire market portfolio (foreign assets, domestic securities and gold) is assessed in a combined manner to maximize the benefits of diversification. There is, therefore, a single risk number representing market risk which is mapped against the combined revaluation balances. -
Further, the complex interplay of RBI’s diversified portfolio and market prices can result in various revaluation balances moving in different directions. (iii) The ECF does not permit the distribution of revaluation balances. Thus, revaluation balances cannot be used to cover non-valuation risks. Requirement for realized equity
Non-valuation risks, i.e. credit risk, operational risks and contingent risks are required to be covered by realized equity. Further, any shortfall in the revaluation balances in covering market risks will need to be covered by realized equity.
Fungibility between realized equity and revaluation balances
There is only limited fungibility in this regard as market risks can also be covered by realized equity, while revaluation balances cannot be used to cover non-market risks. | III. The Staggered Surplus Distribution Policy 4.15 The surplus distribution policy is determined by Section 47 of the RBI Act, 1934, which provides the following: Allocation of surplus profits. After making provision for bad and doubtful debts, depreciation in assets, contributions to staff and superannuation funds and for all other matters for which provision is to be made by or under this Act or which are usually provided for by bankers, the balance of the profits shall be paid to the Central Government. 4.16 As the RBI shifted away from targeting the relatively stable level of realized risk provisions (CF and ADF), as per the Subrahmanyam Group recommendations, to a framework which targeted economic capital (containing the volatile revaluation balances), the need for a surplus smoothening mechanism was perceived. This was particularly so as a fall in revaluation balances which reduces the economic capital and consequently surplus transferable in one year can be quickly reversed, resulting in excess economic capital in the very next year (instances highlighted in blue in Chart 4.1). 4.17 Accordingly, a surplus smoothening mechanism was initially proposed with the ECF in 2015 but was not proceeded upon in view of the Government’s objections to the same. The ECF was operationalized with the ‘default’ surplus distribution policy under Section 47 of the RBI Act, 1934. 4.18 In 2016–17, however, there was a reduction in the RBI’s equity levels due to a sharp fall in the revaluation balances brought about by the strengthening of the rupee and tightening of international yields. Further, there was a reduction in the RBI’s surplus due to the large cash management and liquidity operations carried out following the demonetization of the Specified Bank Notes. In view of these adverse balance sheet developments, no surplus would have been transferable to the Government for the year under the extant surplus distribution policy associated with the ECF. 4.19 The SSDP was developed which took into account the cyclicality in the RBI’s economic capital so that a certain degree of flexibility in surplus distribution was ensured, as outlined in Table 4.4. | Table 4.4: The Staggered Surplus Distribution Policy of the RBI | | Level of RBI’s Available Equity (AvE) (excluding current year’s profit) as a proportion to Target Equity Requirement (TER) | Proportion of risk provisioning by the RBI | | AvE > TER | 10% | | AvE > 70% of TER | 30%* | | AvE < 70% of TER but > 40% of TER | 60%* | | AvE < 40% of TER but > 10% of TER | 90%* | | AvE < 10% of TER | 100% * | | * The amount to be retained may be even less if a lower amount of retention is sufficient to restore the RBI’s equity to the level of the TER. | Acceleration of retention schedule: -
If the RBI’s risk buffers, after the retention as suggested in the table above, remain below the target levels for two consecutive years, then an additional surplus equivalent to 10 percentage points over and above the percentage required to be held back as per the above table, shall be retained as risk provisions.19 -
Notwithstanding anything stated above, if the Central Board is of the view that it is imperative that the proportion of risk provisioning needs to be higher than that laid out in the above schedule, then it may decide to retain the appropriate level of risk provisions prior to the transfer of surplus, if any, to the Government of India. | | This framework shall be reviewed after three years. | 4.20 The SSDP was placed before the Central Board in its August 2017 meeting for approval, along with a proposal for 70 per cent transfer of net income for the year 2016–17 (vis-à-vis 0 per cent under the earlier policy), which was deliberated upon and, thereafter, approved by the Central Board. IV. Developments subsequent to the introduction of the SSDP 4.21 At the Government’s request, a system of interim dividend was initiated in 2016–17 and continued in 2017–18. Further, the annual surplus distribution for the year 2017–18 amounted to ₹500 billion against the amount of ₹385.1 billion as determined by the ECF-SSDP. Further, fresh discussions on the ECF were initiated with the Government. V. Certain concerns with regard to the extant ECF 4.22 During the initial discussions, a concern was raised with regard to the market risk component of the extant ECF. While the ECF is an advance on the previous methodologies used by the RBI and is in line with the practice followed by some other major central banks, it was ‘risk-averse’ as no central bank was seen to be using S-VaR at 99.99 CL. Further, the correlation of RBI’s major market risks, i.e., currency risk and G-sec interest rate risk was low. As per international practice, VaR at 99 per cent CL should be used to assess the RBI’s risks. 4.23 With regard to risk provisioning for RBI’s contingency risks, there was a view that the RBI, which has never experienced any losses related to financial stability in its 84-year history has estimated the maximum level of this risk to be at 6.5 per cent of the balance sheet. It was mentioned that other central banks provided extensive liquidity support 2008 onwards without setting aside capital for ELA/LoLR for financial stability risk. Accordingly, a lower provisioning for financial stability risk was seen to be appropriate. 4.24 With regard to credit risk, there was a view that the RBI uses a combination of Basel II and loss given default (LGD) methodology of international CRAs with significant variations to estimate credit risk to arrive at a requirement of 0.4 per cent. 4.25 Regarding operational risk, there was a view that the RBI used Basel II norms while arriving at a risk provision requirement of 0.3 per cent of the balance sheet even though the likelihood of operational risk materializing was negligible. 4.26 In view of the above adopted methodologies, the RBI had one of the highest economic capital even when the RBI has never suffered a single year of realized loss. Further, seigniorage is a healthy source of income for the RBI. VI. RBI’s rationale for ECF parameterization 4.27 The ECF was developed to assess the risk provisioning requirements for the RBI’s market risk, credit risk, operational risk and contingent risk which are generally provided for by central banks (as well as commercial banks, though their contingent risks are very different). 4.28 The RBI had adopted the then prevailing Basel methodologies for market, credit and operational risks as these represent the most widely accepted risk assessment methodologies. These were adapted, where considered necessary, to meet RBI/central banking specific conditions. The contingent risks of central banks (arising from their role as the monetary authorities and LoLR) are central bank-specific risks and scenario analyses are used to assess such risks. Adoption of S-VaR 4.29 The RBI adopted the S-VaR approach for its ECF in 2014, after extensive discussions with the BIS: -
The S-VaR, at that point of time, reflected the risk management standards of the period as it was introduced globally in 2009 by the BCBS in the aftermath of the GFC to strengthen the market risk framework by addressing the limitations observed in the VaR methodology during the crisis. S-VaR is, in effect, VaR calculated using historically experienced stress conditions. This was relevant as central bank capital, in particular, should cover extreme tail risks. -
The RBNZ, a pioneer in the area of ECF among central banks, adopted the S-VaR for its ECF (Fraser, 2013), as had the BoE (BoE, 2017, p. 126) and the BIS (BIS, 2017, p. 236). -
Central banks are also known to supplement their VaR calculations with stress testing/ more stringent methodologies such as ES. Adoption of the S-VaR was in line with the use of stress factors in the determination of capital requirements. 4.30 The Committee noted that both central and commercial banks draw a distinction between the models and confidence levels used for portfolio risk management and for capital determination. For instance, the RBI uses VaR 99 per cent CL for management of its forex portfolio internally, while it uses S-VaR 99.99 per cent CL for risk provisioning. The need for greater stringency with regard to capital determination purposes is well accepted. Selection of 99.99 per cent CL 4.31 This parameterization was chosen with the objective of RBI having the financial resilience to match the highest credit rating in international markets so as to be seen as an unimpeachable counterparty in international transactions, even in the times of crises in light of the following: -
The country’s EMDE status. -
Rising vulnerabilities associated with a progressively open capital account, global spillovers, volatility of markets and capital flows. -
These vulnerabilities are aggravated by India’s persistent twin deficits, i.e. both domestic fiscal and external current account deficit, with a substantial trade deficit. -
The lack of flexibility on the external front due to the rupee not being a reserve currency. -
The need to ensure credibility of RBI’s policy actions by being able to bear the risks and costs on its own. The importance of financial resilience was seen as a relevant learning from the success of the FCNR (B) swap scheme during the Taper Tantrum of 2013 (Rajan, 2016). Given that it is the RBI’s ‘creditworthiness’ which is to be conveyed to the external sector, the framework envisages suitably providing not only for RBI’s credit risk alone but for all of its risks, including market risk, which is its most significant risk. Need for a holistic perspective of risk parameterization to determine ‘risk averseness’ 4.32 Further, the entire risk parameterization of the ECF, i.e., return period, time horizon, size of data set, distribution assumptions, components of economic capital, etc., needs to be kept in mind, and focusing only on risk model and confidence level in isolation, will lead to erroneous comparisons. For instance, using a daily return period with a lower CL such as 99.9 per cent would result in higher provisioning requirements than a 10-day return with 99.99 per cent CL.20 Similarly, a number of central banks do not treat revaluation balances as economic capital, which raises their requirement for realized equity. More importantly, it was noted that the ECF-SSDP combine permitted the RBI to continue to transfer a significant portion of its surplus to the Government even when there was significant divergence from its target levels, thereby demonstrating the risk tolerance of the RBI. 4.33 With regard to risk averseness of the credit risk methodology, it will be seen that the credit risk assessments under the extant ECF may actually be under-estimates, as concentration risk and risks of the off-balance sheet exposures are not covered therein. 4.34 With regard to operational risks, estimates using the new Standardised Approach as recommended by the latest Basel guidelines also suggest risk provisioning at similar levels as assessed using the Basic Indicator Approach under the extant methodology. VII. ECF-SSDP and risk provisioning 4.35 Section 47 of the RBI Act, 1934 does not specify the level of financial resilience, risk models or confidence levels to be used and only specifies that the RBI has to make provisions ‘usually provided for by bankers…’. Given the interplay of risk parameters as brought out above, it is important to review the trends in surplus distribution under the ECF-SSDP framework from a historical perspective, as well as in comparison with the surplus distribution with other central banks. In this regard, the Committee noted the following: -
The risk provisioning by RBI, as a per cent of net income, has come down from around 50 per cent earlier to 10 per cent since the adoption of Malegam Committee recommendations/ ECF as modified by SSDP (Chart 4.2 and Table 4.5). -
The RBI has transferred ₹2.65 trillion (90 per cent of its net income)21 to the Government during the same period. A comparison of the surplus transferred to the government since 1996-97 is provided in Chart 4.3 and Table 4.5.
| Table 4.5: Surplus distribution by the RBI | | Period | Surplus transferred to Government
(₹ billion) | Surplus transferred to Government
(% of net income) | | 1997–200322 | 535.7 | 53.1 | | 2004–08 | 799.3 | 50.2 | | 2009–13 | 1,078.0 | 51.3 | | 2014–18 | 2,651.1 | 90.0 |
- While the RBI does not calculate seigniorage income, the surplus transferred to the Government is substantially more than the seigniorage income, given that the transfers to the Government over the last 5, 10 and 20 years (Chart 4.4) have been 90 per cent, 74 per cent and 66 per cent, respectively, which is higher than what the RBI’s seigniorage income would be, given that Issue Department’s balance sheet size has been around 51 per cent of the RBI’s balance sheet during these periods (Chart 4.5).
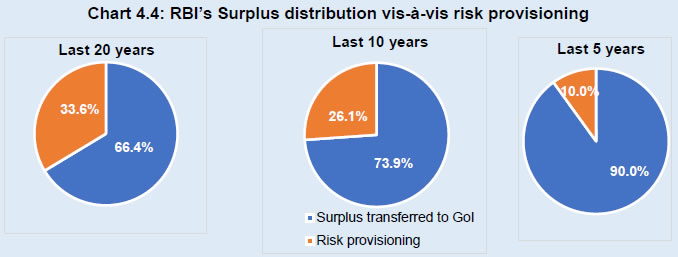
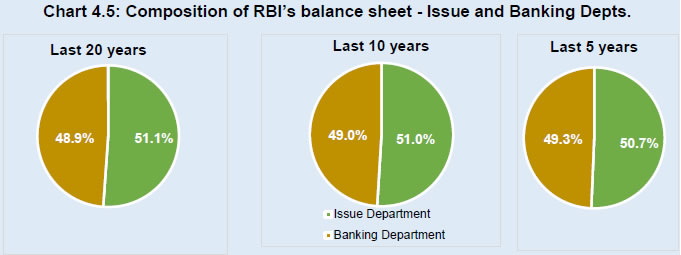 -
International comparison: At 90 per cent surplus transfer to the Government, the ECF-SSDP compares well with most other central banks. -
Surplus distribution among comparable EMDEs: RBI’s surplus distribution since the adoption of Malegam Committee recommendations/ ECF as modified by SSDP was compared with that of two other EMDE central banks which have higher economic capital levels than the RBI due to precisely the same reason, i.e. high revaluation balances due to currency depreciation. A comparison of the surplus transfers to the Government over the same period shows that the RBI has made the lowest risk provisioning among these three EMDEs (Table 4.6). | Table 4.6: Equity position and surplus distribution of Reserve Bank of India and two other EMDE central banks | | Country | As on | Risk Equity
(% of B/S) | Net income | Profit retained
(% of net income) | Surplus transfer
(% of net income) | | EMDE 1 (in billion of local currency) | 31 Dec ’14 | 16.0 | 6.4 | 53.0 | 47.0 | | 31 Dec ’15 | 29.8 | 7.8 | 61.5 | 38.5 | | 31 Dec ’16 | 32.1 | 6.5 | 61.4 | 38.6 | | | 31 Dec’ 17 | 29.7 | 7.5 | 66.5 | 33.5 | | | 31 Dec’ 18 | 28.7 | 7.5 | 66.7 | 33.3 | | Weighted Avg. | | | | 62.1 | 37.9 | | EMDE 2 (in billion of local currency) | 01 Jan ’14 | 14.1 | 69.1* | 25.0 | 75.0 | | 01 Jan ’15 | 27.6 | 183.3 | 10.0 | 90.0** | | 01 Jan ’16 | 35.8 | 112.3 | 10.0 | 90.0 | | 01 Jan ’17 | 29.9 | 43.6 | 10.0 | 90.0 | | | 01 Jan’ 18 | 27.2 | 0.0*** | 0.0 | 0.0 | | Weighted Avg. | | | | 12.5 | 87.5 | | India (₹ billion) | 30 Jun ’14 | 31.6 | 526.8 | 0.0 | 100.0 | | 30 Jun ’15 | 28.1 | 669.0 | 1.5 | 98.5 | | 30 Jun ’16 | 29.0 | 668.8 | 1.5 | 98.5 | | 30 Jun ’17 | 25.7 | 438.5 | 30.0 | 70.0 | | | 30 Jun’ 18 | 26.8 | 641.9 | 22.1 | 77.9 | | Weighted Avg. | | | | 10.0 | 90.0 | * After transfer of 60 billion in local currency to a deposit insurance agency of EMDE 2.
** Includes a transfer of 27.5 billion in local currency (15% of net profit) to a development bank of EMDE 2.
*** EMDE 2 central bank made a loss in 2018 and, therefore, the same is excluded from the calculation of surplus retained/ transferred.
Source: Annual reports of the concerned central banks | VIII. Quality of RBI’s economic capital 4.36 Consequent to the transfer of 90 per cent surplus since the adoption of Malegam Committee recommendations/ ECF as modified by SSDP, the RBI’s realized risk provisions have been reduced below the levels equivalent to 1998–99, when a conscious decision was taken to augment them in light of 1990–91 BoP crisis and Subrahmanyam Committee recommendations. The risk provisions of RBI since 1990–91 are presented in Chart 4.6. 4.37 The RBI’s economic capital has undergone a significant transformation over the past 20 years, with unrealized revaluation balances now accounting for almost 73 per cent of RBI’s economic capital. Chart 4.7 brings forth the aforementioned change. 4.38 The Committee observed that even if the RBI’s economic capital could appear to be relatively higher, it is largely on account of the revaluation balances which are determined by exogenous factors such as market prices and the RBI’s discharge of its public policy objectives. The proportion of realized equity to balance sheet has come down through the surplus distribution – balance-sheet expansion adjustment process since the adoption of Malegam Committee recommendations/ ECF as modified by SSDP. IX. The ECF going forward 4.39 The Committee, thereafter, deliberated on the benchmark for articulating the financial resilience of the RBI, the appropriate risk assessment methodology, risk model and associated parameterization to be adopted for assessing the various risks of the RBI under the ECF. Articulation of the financial resilience of the RBI 4.40 The Committee noted that the parameterization of financial resilience under the extant ECF was guided by the Central Board’s aspiration to match the highest credit rating available in international capital markets. As brought out earlier in Chapter 2, a number of central banks had been rated by CRAs in the past, with many of these ratings being unsolicited. Nevertheless, it was observed that the credit ratings of central banks which were not a part of any currency union were predominantly at the same level as their respective Sovereign. In view of the same, the Committee recommends that, going forward, the financial resilience of the RBI may be articulated by the Central Board in terms of the risk protection desired for its balance sheet. Selection of the risk model to be used 4.41 With regard to the risk model, the discussions focussed on the S-VaR, VaR and ES approaches and the Committee noted the following: -
The BCBS has recommended, under Basel III for commercial banks, the shift from S-VaR to ES. (The latter continues to be assessed under stressed conditions.) -
A number of central banks have moved to ES methodology and, as observed in Chapter III, there is a growing consensus on the use of ES 99 per cent CL. -
ES is a better risk measure for tail risk and is a coherent risk measure unlike VaR and S-VaR. -
The RBI has been estimating ES on a parallel basis. Thus, the necessary skill sets, application software and data sets required for migrating to ES are already in place, which marks a generational jump in risk assessment methodology and is consistent with prevalent international practices. 4.42 Given that the ECF is expected to continue serving as the RBI’s framework for assessing its risk provisioning requirement over the medium term (with suitable periodic enhancements), it is important to adopt the ES at this juncture, otherwise the ECF risks falling behind the curve in the next few years. In view of the above, the Committee recommends the adoption of the Expected Shortfall methodology for assessing the RBI’s market risk provisioning in order to secure RBI’s financial resilience. Selection of risk parameters 4.43 The Committee considered three alternate parameterizations for ES, viz. (i) ES at 99.5 per cent CL (under stressed conditions), (ii) ES at 97.5 per cent CL (under stressed conditions), and (iii) ES at 99 per cent CL (under normal conditions). The protection provided by the three different parameterizations of ES was then assessed for adequacy in terms of a 20 per cent appreciation of INR-USD and 300 bps yield jump in the G-secs. These assessments of adequacy of financial resilience were carried out without making allowances for cross-currency risk, gold price risk, yield risk in foreign securities and forward contracts valuation risks. The Committee noted the following: -
The ES 99.5 per cent CL left a residual revaluation balance of 3.6 per cent for covering the excluded risks. The Committee noted that this parameterization was comparable to the overall levels suggested by the Subrahmanyam Group of 19 per cent (25 per cent of foreign assets which comprise 76 per cent of the balance sheet as on June 30, 2018) and the Malegam Committee’s recommendations which would amount to a total of around 18 per cent requirement of buffers for market risk. -
ES 97.5 per cent CL (under stressed conditions) provided adequate protection to meet the simultaneous occurrence of the rupee appreciation and yield jumps. -
The ES 99 per cent CL (under normal conditions) fell short of providing adequate protection against the identified parameters. 4.44 The results of the scenario analysis are presented in Chart 4.8. The rationale for selection of these criteria is given in Box 4.3. 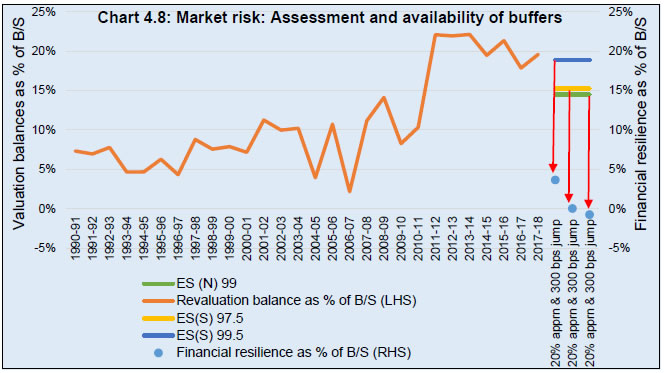 Box 4.3: Rationale for the selection of criteria for back-testing of ES 99.5-97.5 20 per cent rupee appreciation As brought out in Table 3.2 (page 23), there have been several historical episodes of large rupee appreciation vis-à-vis the USD, ranging from 17.0 per cent appreciation in a nine-month period to 19.5 per cent in a distinct sixteen-month period (during the latter episode, the appreciation which took place within a 12-month horizon was 16.6 per cent). In view of the historical experience, a 20 per cent appreciation has been considered as the worst-case scenario. 300 bps yield jump in Government securities Around 200 to 250 bps of yield jumps have been observed, at least three times in the past 15 years (Table 4.7) within a 12-month horizon. A 300 bps has, therefore, been taken as the worst-case scenario. Incidentally, if the 2009 episode horizon is expanded to 16 months, a yield jump of 294 bps is evident. | Table 4.7: Large yield jumps in 10-year G-secs | | Period | G-sec 10 year yield | Yield Jump | | 20-04-04 to 08-11-04 | 5.062 – 7.265 | 220 bps | | 05-01-09 to 21-12-09 | 5.172 – 7.739 | 257 bps | | 04-06-13 to 19-08-13 | 7.192 – 9.228 | 204 bps | Simultaneous occurrence of exchange rate and interest rate risk The simultaneous occurrence of rupee appreciation and yield jumps (or the occurrence of one risk without the second risk factor negating it), though counter-intuitive, has been seen multiple times over the previous years, as brought out in the previous chapter (Chart 3.3, page 25). As seen therein, MTM losses up to 1.1–1.5 per cent of GDP have been experienced during these periods. One of the episodes is presented in Chart 4.9. During this period, a 200 bps yield jump and 17.4 per cent rupee appreciation was witnessed almost concurrently. In a forward-looking approach, given that India is one of the fastest growing economies in the world, the Government’s ongoing economic reforms programme and the operationalization of FIT, the possibility of strong rupee appreciation in the medium term cannot be ruled out. The Committee also considered whether the central bank suffering market losses in a period when the capital flows were strong, government finances buoyant and the country is prospering was a cause of concern. In this context, the Committee noted that the RBI suffering losses beyond its capacity, precisely at a time when monetary policy conditions were challenging due to capital inflows, would not be a desirable scenario. The Committee noted that while the stress scenarios reflected the target financial resilience for the RBI, necessary flexibility in the framework has also been built in through the risk tolerance limit. | 4.45 Shri Rajiv Kumar recalled and raised the issue flagged earlier that the stress scenario of substantial yield hardening and significant rupee appreciation over one year is not highly likely and therefore, risk tolerance range may be higher or, alternatively, trigger for realised equity to meet shortfall may be lower. 4.46 The Committee deliberated on the issue and observed that the range of ES 99.5 per cent CL to 97.5 per cent CL under stressed conditions provided adequate protection against the simulated scenarios while also providing a risk tolerance range of around 19 per cent. This compared well against the 17 per cent decline in CGRA/ 15 per cent decline in revaluation balances which occurred in 2016-17 but was reversed in the subsequent year, indicating the range of cyclical movement in recent years. The Committee was of the view that the range was an appropriate one. 4.47 In recognition of the considerations based on which the Central Board had earlier articulated the need for a high level of financial resilience for the RBI, the Committee recommends a range based on ES at a target of 99.5 per cent CL under stressed conditions with a downward tolerance threshold of ES at 97.5 per cent CL under stressed conditions. This risk parameterization was seen to provide the necessary financial resilience against the RBI’s market risks while also imparting the necessary flexibility to account for the cyclical volatility in RBI’s revaluation balances. 4.48 To take into account the volatility and cyclicality in revaluation balances, the Committee recommends: -
The revaluation balances may be retained as risk buffers for market risk, when revaluation balances exceed ES at 99.5 per cent CL under stressed conditions. Alternate deployment or distribution of excess revaluation balances should not be considered. -
Even if revaluation balances were to fall short of ES at 99.5 per cent CL under stressed conditions, additional risk provisioning will be triggered only if the RTL of ES at 97.5 per cent CL under stressed conditions is breached. 4.49 The complete parameterization for market risk recommended by the Committee is: -
Risk methodology: Expected Shortfall -
Confidence level: 99.5 (target) 97.5 (downward risk tolerance) -
Stress variance-covariance matrix: A period of maximum stress observed in August 2013 -
Time horizon: One year -
Return period: 10-day (non-overlapping) -
Data set: 10 years -
EMWA (decay) factor: 0.995 -
Distribution: Parametric -
Portfolio: Market portfolio comprising foreign assets, domestic securities and gold 4.50 The Committee also recommends that RBI should put in place a framework for assessing the market risk of its off-balance sheet exposures in view of their increasing significance. 4.51 The position as per extant parameterization and ES 99.5 per cent–97.5 per cent is given in Table 4.8: | Table 4.8: Market risk as per extant/ proposed ECF (as % of B/S) | | Risk | 2014
S-VaR
99.99 | 2015
S-VaR
99.99 | 2016
S-VaR
99.99 | 2017
S-VaR
99.99 | 2018
S-VaR
99.99 | 2018
ES 99.5 – 97.5 | | Market risk | 24.5 | 25.3 | 25.1 | 24.3 | 24.4 | 18.9 – 15.3 | Assessing contingent risks - financial and monetary stability risks 4.52 The financial stability risks are those rarest of rare fat tail risks which, if they do occur, can potentially devastate the economy. Central banks across the world are seen as key custodians of financial stability. Notwithstanding the formal position, as micro-prudential authority (regulator and supervisor of banks) and regulator of payment systems, the responsibility of financial stability overwhelmingly falls on the central bank. In times of stress, central banks are seen to be the LoLR (as well as MMLR), roles which are seen to be quite distinct from that of the Government’s role of ‘Recapitalizer of Last Resort’. 4.53 The Committee observed that central banks map capital, reserves and risk provisions against market risks, credit risks, operational risks as well as contingency/monetary and financial stability risks. While provisioning for financial and operational risks was relatively well acknowledged by central banks, risk assessment/provisioning for contingency/monetary and financial stability risks was an area where most central banks, including the RBI, were relatively more discreet because of the associated moral hazard in spelling it out upfront. Nevertheless, the number of central banks which strengthened their capital position after the GFC (Box 2.1) is an important indicator that central banks hold protection against such tail events in the form of capital, the highest form of risk buffers. This is also explicitly brought out in BoE’s recently implemented capital framework which stipulates that the central bank’s objectives of maintaining monetary and financial stability should be backed by its own capital, unless those operations bear a level of risk beyond the tolerance approved by Governors and Court.23 Similarly, it was observed that the ECB cited the need to provide an adequate capital base in a financial system that has grown considerably as one of the considerations for its capital increase in 2010.24 In addition, in the initial years following the GFC, a number of AE central banks made specific provisions for monetary policy operations. An East Asian central bank which increased its capital by almost 50 per cent in 2012, manages its capital and reserves at an appropriate and adequate level, in pursuit of its principal objects which include, inter alia, maintaining price stability conducive to sustainable economic growth, fostering a sound and reputable financial centre, etc. Other AE and EMDE central banks also make provisions for monetary/financial stability considerations. 4.54 In India, the position of law is such that the RBI is not only the monetary authority, but also the regulator and supervisor, inter alia of commercial banks, NBFCs, payment systems and the debt manager of the Government. The Committee agreed that the RBI has one of the widest financial stability mandates deeply entrenched in the RBI’s statute and it is also bound by Section 47 of the RBI Act, 1934 to maintain the financial resources commensurate with the task. While the potentially destabilizing events have been skilfully handled through successful mergers, acquisitions and recapitalization in the past, the Committee acknowledged that the possibility of financial stability risks materializing can never be ruled out, especially in view of the lessons learnt from the GFC. 4.55 Under normal circumstances, central banks lend mainly to banks and other eligible entities against high quality collateral, such as government securities, for a short period with adequate margin so that credit risk on central bank balance sheet is negligible. Even for the RBI, in normal times, liquidity operations pose no risks as they are collateralized with G-sec with margins. However, in a crisis of significant magnitude, banks and financial entities may exhaust their high-quality collaterals and, thereafter, would have to turn to the central bank with low-quality collateral for liquidity. In such a scenario, in the interest of financial stability, the central banks have been seen to assume substantial credit risk in its provision of ELA. The history of dilution of the collateral standards is evident among AEs as early as the 1980s when an AE central bank completely did away with the collateral requirements following the 1986 forex crisis, but then had difficulty in reintroducing them after it suffered a credit loss in 1989. This was, also, amply in evidence in the recent GFC, and exemplified by the dilution of collateral standards by leading AE central bank during the crisis (Annex XI). Incidentally, the IMF had also advised the RBI to dilute the quality of collateral during the GFC. 4.56 In addition, a crisis situation often triggers a fire sale, hampering the discovery of the fair value of a security thereby jeopardizing healthy institutions and thus intensifying the crisis. In such a situation, the central bank may have to take a security onto its books at a value higher than its crisis market value thus assuming potential credit risk in its books in the interest of systemic stability. The central bank balance sheet should have necessary resilience to address such contingencies. 4.57 Another source of contingent financial stability risk arises out of Indian banks’ global operations. Globally, the Indian banks, typically rated around BBB and below given the country’s Sovereign rating, borrow money at a spread over the respective currency London Inter-bank Offer Rate (LIBOR) tenor. The spread at which Indian banks borrow is a function of global liquidity, as also sudden developments in perceived country risk which are not quickly reflected in the country ratings. For example, in the wake of the Taper Tantrum in 2013, as also during a major banking fraud episode more recently, there were instances of tightening of ‘counterparty credit lines’ and widening of spreads. Although some of the major overseas banking regulatory jurisdictions have instituted liquidity coverage ratio (LCR) to take care of a sudden liquidity crisis, with regard to a part of Indian banks’ foreign currency liabilities (Non-Resident Indian [NRI] deposits) being carried in an onshore balance sheet, maintenance of LCR in convertible currency liquid assets is not mandatory, thus exposing them to rollover risks. In times of severe stress there is the possibility that the RBI, through deployment of its foreign exchange reserves, mitigates such rollover risks in the interest of external stability. This entails carrying risks on RBI’s balance sheet and hence may require bolstering contingent capital provisions. 4.58 Further, another critical aspect in financial stability consideration is the interconnectedness between banks and non-bank financial entities. Such interconnectedness in Indian markets is enlarging rapidly, thus increasing the risk of contagion in a financial crisis. According to the June 2019 issue of Financial Stability Report, ‘The total outstanding bilateral exposures among the entities in the financial system increased from ₹ 31.4 trillion in March 2018 to ₹ 36.3 trillion in March 2019. The public-sector banks have a net receivable position vis-à-vis the non-bank financial sector’ (RBI, 2019). In the event of a stress in the non-bank financial sector, the banking sector, and particularly the public sector banks, is likely to come under stress.25 Further, both the Government and the RBI also need to be mindful that new potential sources of financial instability, from systematically important financial institutions cannot be ruled out. 4.59 The Committee discussed the possibility of the RBI making ELA losses, even when a major part of the banking sector is in the public sector. The Committee was of the view that prudence would necessitate risk provisioning under Section 47 for the following reasons: (i) The losses could materialize from ELA support to the private sector banks. (ii) Having a public sector dominated banking sector does not make an economy immune to bank runs. The 2002 crisis in a Latin American economy largely involved public sector banks (PSB). Further, the experience from GFC (Annex XII) has shown that the ownership of the banking sector becomes more public sector oriented during the periods of crisis. (iii) While large public sector ownership has been seen as a positive in preventing bank runs in the past, the NPA crisis has thrown light on the challenges that arise if a sizable majority of the banking sector looks at the Government for recapitalization. Herein lies the challenge of assessing the risk provisioning requirements of the RBI. The RBI would theoretically not be exposed to ELA losses if the Government recapitalizes these banks. However, the European debt crisis has demonstrated that private sector debt crises can transform into a Sovereign debt crisis if the Government over-stretches itself in recapitalizing the distressed banks. The position could be even more severe in India for the following reasons: -
Given that the Indian Sovereign’s rating is at the lowest investment grade - any downgrade, due to fiscal slippages caused by recapitalization, could exacerbate the capital flight caused by the financial crisis. -
The rupee not being a reserve currency will greatly limit India’s capability to manage financial crises. The fact that ELA operations by the AE central banks did not result in losses for them should not draw the central banking community into any false sense of complacency about the riskiness of such actions. Had the AEs, which are ‘issuers of reserve currencies’, not followed up their ‘qualitative easing’ programmes with the very significant ‘quantitative easing’, it is possible that their ELA operations could have ended very differently.26 Thus, Jacome et al. (2011) observes that EMDEs should be cautious in adopting the policies pursued by the AEs in the aftermath of the GFC as they would be vulnerable to currency depreciations and volatility, thereby triggering a ‘twin crisis’, i.e. a financial stability crisis as well as a BoP crisis. It is in recognition of this very vulnerability that the Central Board had previously articulated the aspiration for the highest levels of financial resilience for the RBI, which is seen as the external face of the Sovereign and the primary bulwark against external crises. 4.60 Given that the Government manoeuvrability on recapitalization of commercial banks or of the RBI could be constrained during a financial stability crisis. The Committee recognized the need for the RBI to maintain its realized equity at an appropriate level to ensure that the country is not battling a financial stability crisis with a level of financial resources that is not perceived as credible by the market. The Committee, therefore, recognized that the RBI’s financial stability risk provisions need to be viewed for what they truly are, i.e. the country’s savings for a rainy day (a financial stability crisis), built up over decades and maintained with the RBI in view of its role as the LoLR. Its balance sheet, therefore, has to be demonstrably credible to discharge this function with the requisite financial strength. 4.61 With regard to size of the CRB, various scenarios can be built and analysed. The peak liquidity scenario27 analysis approach adopted under the extant ECF suggested that the buffer should be between 2 to 6.5 per cent of the RBI’s balance sheet. The Central Board had previously decided to maintain the buffer at 3 per cent with a medium-to-long term target of 4 per cent. 4.62 The Committee was informed by the ‘peak liquidity support’ estimates arrived at in the initial implementation stages of the extant ECF as well as a separate scenario analysis to assess RBI’s ELA requirements using the methodology used by the ECB for the liquidity stress testing of commercial banks under its jurisdiction (ECB, 2019). After assessment of ELA requirements using the ECB methodology, a recovery rate ranging from 60 percent to 80 percent on the poorly collateralized borrowings which banks need to resort to after exhausting their HQLA is applied to estimate the RBI’s LoLR risks. As brought out in Table 4.9, the potential losses of the RBI range from 4.6 per cent of RBI’s balance sheet to 8.2 per cent if India’s top 10 banks get into a liquidity problem. If the crisis is bigger, widening the scenario to 55 banks, the potential losses to RBI’s balance sheet could be in the range of 6.6 per cent to 11.8 per cent. If the recovery rate is assumed lower at 60 per cent, the losses could range from 9.3 per cent to 16.4 per cent for top 10 banks and from 13.1 per cent to 23.5 per cent for 55 banks. | Table 4.9: Assessment of RBI’s LoLR risks (using ECB’s liquidity stress testing methodology for commercial banks to compute ELA) | | Recovery rate (%) | Adverse shock scenario (%) | Extreme shock scenario (%) | | | All banks (55) | Top 10 banks | All banks (55) | Top 10 banks | | 60 | 13.1 | 9.3 | 23.5 | 16.4 | | 80 | 6.6 | 4.6 | 11.8 | 8.2 | 4.63 The Committee considered the scenario of ELA to top 10 commercial banks with an 80 per cent recovery rate which results in a risk estimate of 4.6 per cent of the balance sheet. This analysis did not take into consideration the interconnectedness in the financial sector, the risks arising out of Indian banks’ overseas operations or the risks arising from the DICGC which is a wholly-owned subsidiary of the RBI. Accordingly, there is a need to make appropriate provisions to address the financial stability risks under the ECF. In this context, the Committee considered the following additional factors: (i) The scale and cost of banking crises between 1970 and 2011, culled from the survey Systemic Banking Crises Database (Laeven and Valencia, 2013) is presented in Table 4.10. The scale and cost of these crises are enormous, and the risk provisioning under the ECF is, at best, moderate by these standards. | Table 4.10: Cost of financial stability – International experience | | Countries | Peak NPLs | Fiscal costs | Duration | Peak liquidity | Liquidity support | | | % of total loans | Recapitalization/ asset purchase as % of GDP | Years | In % of deposits and foreign liabilities | | All | 25 | 6.8 | 4 | 20.1 | 9.6 | | Advanced | 5 | 4.2 | 5 | 11.6 | 6 | | Emerging | 29.5 | 8.3 | 3 | 22.2 | 10.3 | | Developing | 35 | 10 | 2 | 22.6 | 11.7 | (ii) Chart 4.10 brings out the comparison of NPA to gross loans ratio for the countries included in the cross-country assessment, wherein India is at seventh position among the countries surveyed, indicating relatively high stress in the banking sector. Further, recent developments in the NBFC sector have indicated high levels of stress in this segment as well. The Committee also observed that a number of central banks which maintained similar capital, reserves and risk provisions as the RBI had lower NPA ratios. 4.64 The Committee further noted the following: -
These simulations were strictly restricted to the commercial banking sector and do not cover the NBFCs to which liquidity lines have been extended recently and mutual fund segments to which liquidity lines have been offered by the RBI in the past. -
The simulations neither cover the risks arising from the DICGC (which is wholly owned by the RBI), as its Deposit Insurance Fund may prove insufficient to meet claims during a financial crisis, nor does it take into consideration the risks which may arise if ELA operations were to be carried out in a foreign currency. -
This risk provisioning represents the cushion for both financial stability as well as monetary stability risks (and was not a summation of the two sets of risks) in view of the low correlation of these risks. 4.65 Shri Rajiv Kumar recalled the issue raised earlier regarding other central banks providing extensive liquidity support 2008 onwards without setting aside capital for ELA/LoLR for financial stability risk and proposed that the provision for monetary and financial stability risk may be maintained at 3 per cent. 4.66 The matter was deliberated upon and the Committee noted that the central banks were increasingly providing for financial and monetary stability risks. This was best exemplified by the BoE’s recent MoU with the Her Majesty’s Treasury wherein they provide capital for operations that lie within its monetary and financial stability objectives, including for secured loans in normal as well as severe but plausible scenarios. 4.67 The Committee was of the view that given the importance of these risk provisions, their size should be appropriate to meet a relatively adverse financial stability shock, while ensuring the same is not excessive. The Committee recommends that the size of the monetary and financial stability risk provisions should be maintained between 4.5 to 5.5 per cent of the balance sheet. 4.68 This represented a range determined by an adverse financial stability shock lasting a month, involving the top 10 banks with an 80 per cent recovery rate. Credit risk 4.69 The Committee reviewed the credit risk methodology and recommended the adoption of Basel III norms, given that these represented latest guidelines for assessing credit risk. Given a member’s concern, the hybrid approach was not used as had been done in the extant framework. Incidentally, the hybrid approach did not increase capital requirements while imparting dynamism to the risk estimate. The assessment of credit risk using Basel III which also covers off-balance sheet exposures leads to an increase in the provisioning requirement from the extant 0.4 per cent to 0.6 per cent of the balance sheet. The Committee recommends adopting the Basel III Standardised Approach for assessing credit risk of the forex portfolio which also covers the off-balance sheet exposures. 4.70 The Committee recommends that a suitable methodology may be developed to incorporate concentration risks into the assessment of credit risk. 4.71 The High-Level Strategy Committee for the management of forex reserves may also consider monitoring this aspect on a periodic basis. 4.72 The Committee recommends that the RBI should consider developing joint credit-market risk modelling as this would help simulate the combined impact of a crisis and may lead to lower risk provisioning due to the benefits of diversification. Given that the ECB took three to four years to put in place such a framework, if the RBI were to initiate the process now, a fully tested model could be ready within the RBI by the next review of the ECF. Operational Risk 4.73 Under the extant ECF, provisioning for operational risk is measured with the help of Basic Indicator Approach recommended under Basel II capital adequacy rules for banking institutions. As per revised Basel III norms, the new Standardised Approach for measurement of operational risk is to be adopted. Initial estimates put the estimates under the new Standardised Approach at a marginally lower level of ₹108.1 billion from the extant position of ₹111.0 billion (as on June 30, 2018) amounting to 0.3 per cent of the balance sheet. Further, as the strengthening of the risk management framework continues, translating over time into lesser number of loss events, a decrease in operational risk provisioning can be envisaged under this approach. The Committee recommends the adoption of the new Standardised Approach for measurement of operational risk. Size of realized equity, Contingent Risk Buffer 4.74 The Committee recommends that the size of realized equity should be adequate to provide for financial and monetary stability risks, as also credit and operational risks and recommends the size of the realized equity in the form of Contingent Risk Buffer should be 6.5 per cent of the balance sheet, with a lower bound of 5.5 per cent. This represented 1.2 to 1.4 per cent of the GDP. The recommended range may need to be supplemented in case there is any shortfall in the revaluation balances for covering market risk below the RTL of ES 97.5 per cent (stress). 4.75 The RBI’s economic capital requirement under the recommended parameters vis-à-vis the extant parameters is reflected in Table 4.11 below. | Table 4.11: RBI’s economic capital requirement | | Extant ECF | ECF going forward | | | Market risk | Contingent risk buffer | | | Market risk | CRB | Credit risk | Op risk | Total | Financial & monetary stability risk | Credit risk | Op Risk | Total | | 24.4 | 3–4 | 0.4 | 0.3 | 28.1–29.1 | 18.9–15.3 | 4.5–5.5 | 0.6 | 0.3 | 25.4–20.8 # | | # The CRB requirement has been rounded-up from 5.4 - 6.4 per cent to 5.5 – 6.5 per cent, as the lowest estimate of RBI’s LoLR risk is 4.6 per cent (Table 4.9) and the sum of credit and operational risk is 0.9 per cent. Thus, the lower bound of the CRB is to be maintained at 5.5 per cent with an upper bound of 6.5 per cent | X. The opportunity cost of RBI’s capital 4.76 The Committee felt that it may not be appropriate to assess the return on a central bank’s assets in pecuniary terms since the assets held by a central bank are the consequence of its variegated policy mandates, and not for pecuniary objectives. As brought out in Chapter 3, NFA are held in the interest of maintaining external and domestic financial and economic stability of the country and are independent of considerations related to the balance sheet. Similarly, NDA are also held as a consequence of the RBI’s policy mandates, inter alia, for monetary policy and liquidity management purposes, and are again independent of considerations related to the balance sheet. The RBI needs an adequate stock of G-sec for monetary policy purposes, based on its inflation targeting framework due to the following reasons: -
In order to operate the LAF, in times when there is excess liquidity it needs a certain stock of government securities to conduct reverse repos. -
In times of excess systemic liquidity, as in recent times, it conducts OMO, and sells government securities on its balance sheet. -
In times of excess foreign exchange flows it needs to undertake sterilization operations through the sale of government securities. 4.77 Nevertheless, if the return/ cost of RBI’s capital were to be assessed, it could be done on two broad principles: -
The difference in the overall return on the assets held by RBI and the average debt servicing cost for the Government -
The opportunity cost of capital which is the return that the Government would have generated had RBI’s capital been redeployed. 4.78 The implication of the same on the fiscal cost in terms of return on assets; the impact on debt-GDP ratio and its consequent impact on the Sovereign ratings; and the positive externalities of RBI’s risk buffers was considered by the Committee. The fiscal cost in terms of return/ costs on assets 4.79 With regard to overall return, the assets held against risks buffers could include both a portion of the NFA and the NDA, depending on the composition of the RBI’s balance sheet at any given time. On NDA, RBI receives coupon interest on the government securities it holds, which is predominantly returned to the Government in the form of surplus transfers. On NFA, the coupon returns may be lower than on NDA, but are typically augmented by valuation returns that accrue to the revaluation balances. The positive impact of NFA on the sovereign rating reduces Government’s overall borrowing costs, and hence has an indirect pecuniary benefit. 4.80 With regard to the opportunity cost of RBI’s realized equity, given that G-sec are held against it, the fiscal impact of RBI realized equity is minimal28. No significant impact on interest expenditure would be seen if RBI’s capital is used to redeem G-sec held by it as the interest on these securities is anyway transferred back to the Government as a part of surplus transfer. Further, any transfer of RBI’s capital will reduce the future dividend transfers to the Government. Even if the Government were to redeploy RBI’s capital to fund its expenditure, contrary to expectations, the beneficial impact on Government’s interest outgo would be smaller than expected, given that the RBI may have to sell G-sec through OMOs in the market for liquidity management in line with its monetary policy stance. These OMOs could result in an increase in the interest payable by the Government to the non-RBI segment which, unlike RBI, would possibly not return the higher interest income as dividend. Thus, the opportunity cost of maintaining RBI’s capital is minimal. In this regard, Archer and Moser-Böehm (2013) also mention that capital of a central bank which is invested in government securities need not be costly when viewed from the perspective of the whole public sector. The impact on debt-GDP ratio and its consequent impact on the Sovereign ratings 4.81 There is a view that redemption of securities held by the RBI will help to reduce India’s debt-GDP ratio, which in turn may improve the country’s credit rating. Further, the transfer of ‘excess’ capital, if any, may have a marginal impact on the country’s debt-GDP ratio29, while negatively impacting other rating criteria used by the CRAs. There was a view that the debt held against central bank’s capital could crowd out the private sector borrowings. In this regard, the Committee also noted that Meyer (2000) had observed that Government debt held by the private sector is not affected by the existence or the level of the surplus/ capital held by central banks. 4.82 Incidentally, the Malegam Committee in 2014, while recommending that no transfers be made to the CF and ADF, also recommended that the balance of surplus profits payable to the Government out of the available surplus may be restricted, at least for the next three years, to the higher of: -
60% of the surplus profit (being slightly higher than the average payout ratio of the last 5 years) and; -
₹35,000 crore (being slightly higher than the highest transfer to the Government in the last 5 years) And the balance of the surplus profits may be used for redemption of part of the Government of India bonds held by RBI. This recommendation of the Malegam Committee was not implemented, and the entire net income of the RBI was transferred to the Government. The positive externalities of RBI’s risk buffers 4.83 As mentioned earlier, the benefits of having a well-capitalized central bank for fostering ‘monetary and financial stability’ are difficult to measure during normal times, given that these are a public good. The opportunity cost of RBI’s capital is thus seen to be relatively small, even without taking into consideration the positive externalities of monetary and financial stability which these buffers facilitate. XI. The Surplus Distribution Policy going forward 4.84 The Committee, having recommended the target level of financial resilience for the RBI, deliberated on the surplus distribution policy which could be adopted by the RBI. Given that the ToRs require the requisite level of surplus reserves created out of realized gains to be articulated and that revaluation balances tend to be volatile, cyclical and are non-distributable, the Committee recommends that the surplus distribution policy should move away from targeting total economic capital alone, to one where it has a dual set of targets: -
The total economic capital of the RBI. -
The level at which realized equity is to be maintained. 4.85 As the market risks are mapped against revaluation balances, only the shortfall in available revaluation balances (vis-à-vis the RTL) may need to be provided as risk provisioning. The Committee, therefore recommends that, in effect, the surplus distribution policy will be required to target the ‘required realized equity’ (requirement) for covering: -
monetary and financial stability risks -
credit risk -
operational risk -
a shortfall, if any, in revaluation balances vis-à-vis market risk RTL (ES 97.5 stress). 4.86 The Committee recommends that the minimum level of realized equity to be maintained should be the sum of the monetary and financial stability risks, credit risk and operational risk. 4.87 In view of the above, the Committee recommends that the RBI move away from the SSDP, towards one which compares the ‘available realized equity’ (ARE), i.e., Capital, Reserve Fund, CF and ADF, with the ‘requirement’ and proposes surplus distribution on the following lines: -
Entire net income be transferred to the Government, if the RBI’s ARE is equal to or greater than upper bound of the ‘requirement’. -
Subject to ARE lying within the range of ‘requirement’, the Central Board may consider risk provisioning in a manner so as to maintain the RBI’s ‘ARE’ within the range of ‘requirement’ till the next periodic review. -
If the ARE falls short of lower bound of ‘requirement’, appropriate risk provisioning should be made by the RBI to augment realized equity to the lower bound of ‘requirement’ and only the residual net income (if any) should be transferred to the Government. -
If any risk provisioning from net income has been made previously for market risk, the excess realized risk provisioning over the target level of market risk buffers (ES 99.5 stress), caused by an increase in revaluation balances, may be reversed. -
There shall be no distribution of unrealized revaluation balances. 4.88 Box 4.4 below provides an illustration of the plausible risk provisioning requirements/surplus distribution over the next five years were the balance sheet to grow along the lines discussed therein. Box 4.4: Assessment of requirement for risk provisioning under the proposed Surplus Distribution Policy Going forward, the surplus distribution policy may be guided by the maintenance of ARE as recommended by the Committee. Given that the desired ‘ARE’ would be required to lie within the range of ‘requirement’ of 5.5 to 6.5 per cent, the Central Board’s decision regarding the positioning of the CRB within the range would have implications on the risk provisioning and surplus transferable to the Government. The requisite risk provisioning and surplus transferable to Government for various scenarios have been provided in table 4.12 to provide guidance both to the Central Board with regard to the extent of risk provisioning required and to the Government on the surplus to be expected every year. While the actual net income in any year would be determined by the exact magnitude and composition of assets in the balance sheet, a simulation was carried out to assess the expected levels of risk provisioning which may be required for illustrative purposes. The Committee also observed that the growth rate of RBI’s balance sheet and income can vary significantly as seen during 1990-91 to 2017-18 (Chart 4.11). However, the trend can varies over different periods of time as brought in Annex- XIII. 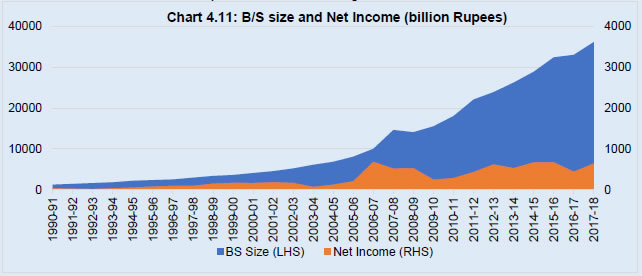 The size of the RBI’s balance sheet is predominantly determined by the sum of Reserve Money and movement in revaluation balances besides realized equity with the ‘residual items’ (superannuation and gratuity fund, other provisions, etc.) being relatively small. The projection for RBI’s balance sheet was carried out using a two-year lag auto regressive (AR) model. The model was chosen based on its robustness which met the requisite statistical criteria (Annex-XIII). The RBI’s balance sheet showed a substantial structural transformation with the NFA to balance sheet ratio rising from 0.08 in 1990-91 to a peak of 0.92 in 2005-06 before coming down to 0.72 by 2018-19. It is seen to undergo a structural break in its composition around 2000-01 (identified using the Chow test). Consequently, the regression analysis was carried out for the 2000-01 to 2018-19 period. The range of projection of surplus retention for the baseline (BL) scenario bound by positive shock (BL + 0.5 SD and BL + 1 SD) and negative shock (BL – 0.5 SD and BL - 1 SD) to allow for possible year-to-year volatility under immediate drawdown of realized equity to 5.5 per cent and under gradual glide path from 6.5 to 5.5 per cent of balance sheet is given in Charts 4.12 - 4.13. 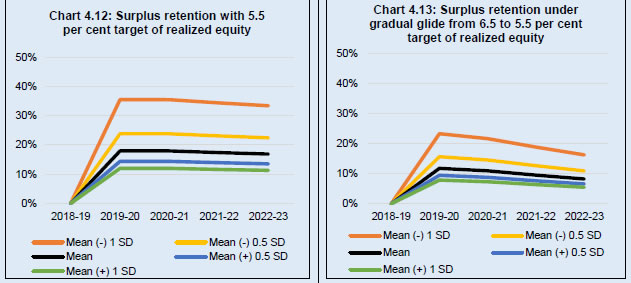 The results are summarised in Table 4.12. | Table 4:12: Envisaged risk provisioning for meeting ‘requirement’ of realized equity under mean circumstances | | Requirement for Realized Equity | Average rate of risk provisioning as per cent of net income from 2018-19 to 2022-23 under smooth glide down path | | 5.5 per cent | 8.1 per cent (14.0 per cent)* | | 6.5 per cent | 16.6 per cent | | * Represents the average risk provisioning till 2022-23 if the realized equity is immediately drawn down to 5.5 per cent in 2018-19. In the case of 6.5 per cent target, given the extant realized equity levels, there will be no significant difference between a one-time movement in 2018-19 and a glide down path. | The Committee noted that on making reasonable allowance for volatility (± 0.5 SD and ± 1 SD) in the RBI’s net income relative to its balance sheet size, average risk provisioning over the five year period of 2018-19 to 2022-23 for CRB of 5.5 and 6.5 per cent could range from 8.1 to 16.6 per cent of net income in the normal scenario with a range of 5.4 to 11.1 per cent of net income in case of a positive shock and 16.0 to 32.8 per cent of net income in case of a negative shock respectively. The Committee also noted that these were illustrative and not exhaustive scenarios. Assumptions underlying risk provisioning requirements -
The balance sheet size and net income move on the lines assumed in the model which is given in Annex XIII -
There may be no shortfall in revaluation balances, thus not requiring any additional risk provisioning. | XII. Determining whether available risk provisions are in excess of required risk provisions 4.89 In view of the requirements for market risk buffers and realized equity, the Committee arrived at the net position of overall risk buffers in line with the ToR 2.3. | Table 4.13: Net risk provisions as per extant and proposed ECF (June 30, 2018) | | | Extant ECF | Proposed ECF | | | Available risk buffers | Required risk buffers | Net position | Available risk buffers | Required risk buffers | Net position | Excess | | Market risk | 19.6* plus 4.8** | 24.4 | - | 19.6 | 18.9
{RTL: 15.3} | (+) 0.7 | VB: 0.7 | | Financial & monetary stability risk | 1.7 | 3
[medium term target: 4] | (-) 1.3
[(-) 2.3] | 6.3 | 4.5 to 5.5 | (+) 0.8 to (+) 1.8 | RE: 0.8 to 1.8 | | Credit risk | 0.4 | 0.4 | - | 0.6 | 0.6 | - | - | | Op risk | 0.3 | 0.3 | - | 0.3 | 0.3 | - | - | | Total risks/ risk buffers | 26.8 | 28.1
[29.1] | (-) 1.3
[(-) 2.3] | 26.8 | 20.8 to 25.4 # | (+) 1.5 to (+) 2.5^ | VB: 0.7+ RE: 0.7 to 1.7# | * VB: Revaluation balances ** RE: Realized equity ^ Excess is in the form of 0.7 per cent revaluation balances and 0.8 to 1.8 per cent realized equity. {}: Risk Tolerance Limit
# As the lowest estimate of RBI’s LoLR risk is 4.6 per cent (Table 4.9) and the sum of credit and operational risk is 0.9 per cent, the lower bound of the CRB is to be maintained at 5.5 per cent with an upper bound of 6.5 per cent. Consequently, the excess RE is 0.7 to 1.7 per cent. | 4.90 The Committee noted that application of its recommendations to the RBI’s balance sheet for the year 2017-18 results in excess revaluation balances of 0.7 per cent of balance sheet and excess realized equity ranging from 0.7 per cent at the upper bound of CRB to 1.7 per cent of balance sheet at the lower bound of CRB. XIII. Treatment of excess unrealized revaluation balances 4.91 The Committee was of the view that it should not concern itself with the issue of alternative deployment of excess accumulated revaluation balances as it did not fall within the Committee’s ToRs. 4.92 As a part of the cross-country survey, the Committee noted the findings of a survey conducted by Bunea et al. (2016) pertaining to the practices followed by central banks for distribution of revaluation gains. It observed that the majority of central banks (42 out of 57) do not transfer revaluation gains, and that they record unrealized revaluation changes either on the balance sheet or, when recorded in the P&L account, they are excluded from the distributable profit. The remaining nine central banks distributed only a part of their valuation gains, while for six central banks all valuation gains were transferrable. 4.93 The survey pointed out that unrealized gains are likely to be low in the case of central banks with relatively small or actively traded portfolios similar to many commercial banks which also follow IFRS rules, while adding that the portfolio of many central banks tend to be very large and inactive. The survey highlighted that distribution of unrealized gains by central banks is increasingly not being seen as good practice. It was also stated that there is significant risk that the unrealized gains will not be realized in the future due to interest rate and exchange rate volatility resulting in losses on the eventual sale or maturity of the instruments in question which could then deplete equity and therefore have an adverse impact on the financial independence of the central bank. 4.94 The Committee noted that about half of the 53 central banks surveyed by it as a part of its own cross-country survey had a negative annual result at least once over the last five years. These were largely on account of most of these central banks taking valuation gains and losses to P&L and the valuation losses exceeding their realized net income. Incidentally, were RBI to be following this accounting approach, it too would have suffered a loss, at least in 2004–05, 2006–0730, 2009–10 and 2016–17, as valuation losses would have exceeded the RBI’s surplus in those years. 4.95 The Committee recommends that ‘excess’ revaluation balances, if any, should continue to remain on the balance sheet as risk buffers for market risk, till such time that they are realized through the sale or maturity of the underlying asset. XIV. Treatment of excess realized risk provisions 4.96 In view of ToR 2.5 which provides that the Committee was mandated to consider any other related matter including treatment of surplus reserves, created out of realized gains, if determined to be held, given that the Committee has recommended a CRB of 5.5 to 6.5 per cent of balance sheet, the excess realized equity as on June 30, 2018 was determined to be ₹262.80 billion at 6.5 per cent and ₹624.56 billion at 5.5 per cent. The excess realized equity as on June 30, 2019 will need to be determined on the basis of RBI’s finalized annual accounts for the financial year 2018-19 as well as the level of realized equity decided upon by the RBI’s Central Board. XV. Interim dividend and aligning RBI’s financial year with Government’s fiscal year 4.97 With regard to distribution of interim dividend, the Committee recommends that the RBI accounting year (July to June) may be brought in sync with the fiscal year (April to March) from the financial year 2020-21. Historically, the July-June year would have been linked to the agricultural seasons which is not a consideration in these times. The benefits from such a transition are manifold: -
The RBI would be able to provide better estimates of the projected surplus transfers to the Government for the financial year for budgeting purposes; -
It could reduce the need for interim dividend being paid by the RBI. The payment of interim dividend may then be restricted to extraordinary circumstances. -
It would obviate any timing considerations that may enter into the selection of OMO/ MSS as monetary policy tools. -
It would also bring about better cohesiveness in monetary policy projections, reports published by the RBI, etc., many of which are using the fiscal year as the base. XVI. Periodicity of review of the ECF 4.98 The Committee recommends that the framework may be periodically reviewed every five years. Nevertheless, if there is a significant change in the RBI’s risks and operating environment, an intermediate review may be considered. 5 Summary of Recommendations 5.1 The Committee reviewed the status, need and justification of the various reserves, risk provisions and risk buffers maintained by the RBI and recommended their continuance. The Committee recommended that the RBI should explicitly recognize the ADF not only as a provision for capital expenditure, but also as a risk provision in case of need, and that appropriate disclosures to that effect may be made in its annual report. With regard to revaluation balances, the Committee recommends the following: -
Inclusion of the revaluation balances as a part of RBI’s overall risk buffers with the recognition of its special character. -
Mapping market (MTM) risks against revaluation balances (which are accumulated net MTM gains). -
Limited one-way fungibility between revaluation balances and realized equity to continue, whereby a shortfall in revaluation balances can be met through increased realized risk provisioning but not vice-versa. -
In view of international practice and RBI’s specific circumstances, the extant principle of non-distribution of revaluation balances would need to be continued as a part of the ECF. (Para 4.6) 5.2 The Committee recommends the need to draw a distinction between realized equity and revaluation balances for the following reasons: -
Revaluation balances are highly volatile, and whose levels move autonomously depending on RBI’s discharge of its public policy objectives of maintaining price, financial and external stability, coupled with international market developments reflected in movements in the price of foreign assets, exchange rate, interest rate and gold price. -
Revaluation balances cannot be used to cover risks which are not valuation risks as this can, in effect, result in the distribution of unrealized revaluation gains were such ‘non-valuation risks’ to materialize. Revaluation balances can therefore be treated as limited purpose risk buffers to be used against market risks only. -
There are significant strategic and operational constraints in the monetization of the revaluation balances (Annex VIII). (Para 4.7) 5.3 The Committee recommends a more transparent presentation of the RBI’s Annual Accounts with regard to the components of economic capital, on the lines as indicated in Table 5.1. The Committee noted that changes in the format of presentation of balance sheet would require necessary amendments to the RBI General Regulations. The information may, therefore, be presented as a Schedule to the balance sheet till such time the processes for completing change in style of balance sheet presentation are formalized. | Table 5.1: Extant / suggested presentation of liability side of RBI’s balance sheet | | Existing liabilities format | Proposed liabilities format | | -
Capital -
Reserve Fund -
Other Reserves -
Risk Provisions -
Contingency Fund -
Asset Development Fund - Revaluation Accounts
- Deposits
- Other Liabilities
- Notes in Circulation
| (Para 4.8) 5.4 The Committee was of the view that given the inclusion of the revaluation balances in the RBI’s overall risk buffers, measures to address volatility will have to be introduced. After examining the various options, it was decided that this would be done by articulating RTLs. (Para 4.10) 5.5 The Committee observed that even if the RBI’s economic capital could appear to be relatively higher, it is largely on account of the revaluation balances which are determined by exogenous factors such as market prices, and the RBI’s discharge of its public policy objectives. The proportion of realized equity to balance sheet has come down through the surplus distribution – balance-sheet expansion adjustment process since the adoption of Malegam Committee recommendations/ ECF as modified by SSDP. (Para 4.38) Articulation of the financial resilience of the RBI 5.6 The Committee recommends that, going forward, the financial resilience of the RBI may be articulated by the Central Board in terms of the risk protection desired for its balance sheet. (Para 4.40) Selection of the risk model to be used 5.7 The Committee recommends the adoption of the Expected Shortfall methodology for assessing the RBI’s market risk provisioning in order to secure RBI’s financial resilience. (Para 4.42) Selection of risk parameters 5.8 In recognition of the considerations based on which the Central Board had earlier articulated the need for a high level of financial resilience for the RBI, the Committee recommends a range based on ES at a target of 99.5 per cent CL under stressed conditions with a downward tolerance threshold of ES at 97.5 per cent CL under stressed conditions. This risk parameterization was seen to provide the necessary financial resilience against the RBI’s market risks while also imparting the necessary flexibility to account for the cyclical volatility in RBI’s revaluation balances. (Para 4.47) 5.9 To take into account the volatility and cyclicality in revaluation balances, the Committee recommends: -
The revaluation balances may be retained as risk buffers for market risk, when revaluation balances exceed ES at 99.5 per cent CL under stressed conditions. Alternate deployment or distribution of excess revaluation balances should not be considered. -
Even if revaluation balances were to fall short of ES at 99.5 per cent CL under stressed conditions, additional risk provisioning will be triggered only if the RTL of ES at 97.5 per cent CL under stressed conditions is breached. (Para 4.48) 5.10 The complete parameterization for market risk recommended by the Committee is: -
Risk methodology: Expected Shortfall -
Confidence level: 99.5 (target) 97.5 (downward risk tolerance) -
Stress variance-covariance matrix: A period of maximum stress observed in August 2013 -
Time horizon: One year -
Return period: 10-day (non-overlapping) -
Data set: 10 years -
EMWA (decay) factor: 0.995 -
Distribution: Parametric -
Portfolio: Market portfolio comprising foreign assets, domestic securities and gold (Para 4.49) 5.11 The Committee also recommends that RBI should put in place a framework for assessing the market risk of its off-balance sheet exposures in view of their increasing significance. (Para 4.50) Assessing financial stability risks 5.12 The Committee recognized that the RBI’s financial stability risk provisions need to be viewed for what they truly are, i.e. the country’s savings for a rainy day (a financial stability crisis), built up over decades and maintained with the RBI in view of its role as the LoLR. Its balance sheet, therefore, has to be demonstrably credible to discharge this function with the requisite financial strength. (Para 4.60) 5.13 The Committee recommends that the size of the monetary and financial stability risk provisions should be maintained between 4.5 to 5.5 per cent of the balance sheet. (Para 4.67) 5.14 This represented a range determined by an adverse financial stability shock lasting a month, involving the top 10 banks with an 80 per cent recovery rate. (Para 4.68) Credit risk 5.15 The Committee recommends adopting the Basel III Standardised Approach for assessing credit risk of the forex portfolio which also covers the off-balance sheet exposures. (Para 4.69) 5.16 The Committee recommends that a suitable methodology may be developed to incorporate concentration risks into the assessment of credit risk. (Para 4.70) 5.17 The High-Level Strategy Committee for the management of forex reserves may also consider monitoring this aspect on a periodic basis. (Para 4.71) 5.18 The Committee recommends that the RBI should consider developing joint credit-market risk modelling as this would help simulate the combined impact of a crisis and may lead to lower risk provisioning due to the benefits of diversification. (Para 4.72) Operational Risk 5.19 The Committee recommends the adoption of the new Standardised Approach for measurement of operational risk. (Para 4.73) Size of realized equity, Contingent Risk Buffer 5.20 The Committee recommends that the size of realized equity should be adequate to provide for financial and monetary stability risks, as also credit and operational risks and recommends the size of the realized equity in the form of Contingent Risk Buffer should be 6.5 per cent of the balance sheet, with a lower bound of 5.5 per cent. This represented 1.2 to 1.4 per cent of the GDP. The recommended range may need to be supplemented in case there is any shortfall in the revaluation balances for covering market risk below the RTL of ES 97.5 per cent (stress). (Para 4.74) RBI’s economic capital requirement under the recommended parameters vis-à-vis the extant parameters 5.21 The RBI’s economic capital requirement under the recommended parameters vis-à-vis the extant parameters is reflected in Table 5.2 below. | Table 5.2: RBI’s economic capital requirement | | Extant ECF | ECF going forward | | | Market risk | Contingent risk buffer | Total | | Market risk | CRB | Credit risk | Op risk | Total | Financial and monetary stability risk | Credit risk | Op Risk | | 24.4 | 3–4 | 0.4 | 0.3 | 28.1–29.1 | 18.9–15.3 | 4.5–5.5 | 0.6 | 0.3 | 25.4–20.8 # | | # The CRB requirement has been rounded-up from 5.4 - 6.4 per cent to 5.5 – 6.5 per cent, as the lowest estimate of RBI’s LoLR risk is 4.6 per cent (Table 4.9) and the sum of credit and operational risk is 0.9 per cent. Thus, the lower bound of the CRB is to be maintained at 5.5 per cent with an upper bound of 6.5 per cent. | (Para 4.75) The Surplus Distribution Policy going forward 5.22 The Committee recommends that the surplus distribution policy should move away from targeting total economic capital alone, to one where it has a dual set of targets: -
The total economic capital of the RBI. -
The level at which realized equity is to be maintained. (Para 4.84) 5.23 The Committee, therefore recommends that, in effect, the surplus distribution policy will be required to target the ‘required realized equity’ (requirement) for covering: -
monetary and financial stability risks -
credit risk -
operational risk -
a shortfall, if any, in revaluation balances vis-à-vis market risk RTL (ES 97.5 stress). (Para 4.85) 5.24 The Committee recommends that the minimum level of realized equity to be maintained should be the sum of the monetary and financial stability risks, credit risk and operational risk. (Para 4.86) 5.25 In view of the above, the Committee recommends that the RBI move away from the SSDP, towards one which compares the ‘available realized equity’ (ARE), i.e., Capital, Reserve Fund, CF and ADF, with the ‘requirement’ and proposes surplus distribution on the following lines: -
Entire net income be transferred to the Government, if the RBI’s ARE is equal to or greater than upper bound of the ‘requirement’. -
Subject to ARE lying within the range of ‘requirement’, the Central Board may consider risk provisioning in a manner so as to maintain the RBI’s ‘ARE’ within the range of ‘requirement’ till the next periodic review. -
If the ARE falls short of lower bound of ‘requirement’, appropriate risk provisioning should be made by the RBI to augment realized equity to the lower bound of ‘requirement’ and only the residual net income (if any) should be transferred to the Government. -
If any risk provisioning from net income has been made previously for market risk, the excess realized risk provisioning over the target level of market risk buffers (ES 99.5 stress), caused by an increase in revaluation balances, may be reversed. -
There shall be no distribution of unrealized revaluation balances. (Para 4.87) Determining whether available risk provisions are in excess of required risk provisions 5.26 In view of the requirements for market risk buffers and realized equity, the Committee arrived at the net position of overall risk buffers in line with the ToR 2.3. | Table 5.3: Risk provisions as per extant and proposed ECF (June 30, 2018) | | | Extant ECF | Proposed ECF | | Available risk buffers | Required risk buffers | Net position | Available risk buffers | Required risk buffers | Net position | Excess | | Market risk | 19.6* plus 4.8** | 24.4 | - | 19.6 | 18.9
{RTL: 15.3} | (+) 0.7 | VB: 0.7 | | Financial & monetary stability risk | 1.7 | 3
[medium term target: 4] | (-) 1.3
[(-) 2.3] | 6.3 | 4.5 to 5.5 | (+) 0.8 to (+) 1.8 | RE: 0.8 to 1.8 | | Credit risk | 0.4 | 0.4 | - | 0.6 | 0.6 | - | - | | Op risk | 0.3 | 0.3 | - | 0.3 | 0.3 | - | - | | Total risks/ risk buffers | 26.8 | 28.1
[29.1] | (-) 1.3
[(-) 2.3] | 26.8 | 20.8 to 25.4 # | (+) 1.5 to (+) 2.5^ | VB: 0.7+ RE: 0.7 to 1.7# | * VB: Revaluation balances ** RE: Realized equity ^ Excess is in the form of 0.7 per cent revaluation balances and 0.8 to 1.8 per cent realized equity. {}: Risk Tolerance Limit
# As the lowest estimate of RBI’s LoLR risk is 4.6 per cent (Table 4.9) and the sum of credit and operational risk is 0.9 per cent, the lower bound of the CRB is to be maintained at 5.5 per cent with an upper bound of 6.5 per cent. Consequently, the excess RE is 0.7 to 1.7 per cent. | (Para 4.89) 5.27 The Committee noted that application of its recommendations to the RBI’s balance sheet for the year 2017-18 results in excess revaluation balances of 0.7 per cent of balance sheet and excess realized equity ranging from 0.7 per cent at the upper bound of CRB to 1.7 per cent of balance sheet at the lower bound of CRB. (Para 4.90) Treatment of excess unrealized revaluation balances 5.28 The Committee recommends that ‘excess’ revaluation balances, if any, should continue to remain on the balance sheet as risk buffers for market risk, till such time that they are realized through the sale or maturity of the underlying asset. (Para 4.95) Treatment of excess realized risk provisions 5.29 Given that the Committee has recommended a CRB of 5.5 to 6.5 per cent of balance sheet, the excess realized equity as on June 30, 2018 was determined to be ₹262.80 billion at 6.5 per cent and ₹624.56 billion at 5.5 per cent. The excess realized equity as on June 30, 2019 will need to be determined on the basis of RBI’s finalized annual accounts for the financial year 2018-19 as well as the level of realized equity decided upon by the RBI’s Central Board. (Para 4.96) Interim dividend and aligning RBI’s financial year with Government’s fiscal year 5.30 With regard to distribution of interim dividend, the Committee recommends that the RBI accounting year (July to June) may be brought in sync with the fiscal year (April to March) from the financial year 2020-21. Historically, the July-June year would have been linked to the agricultural seasons which is not a consideration in these times. The benefits from such a transition are manifold: -
The RBI would be able to provide better estimates of the projected surplus transfers to the Government for the financial year for budgeting purposes; -
It could reduce the need for interim dividend being paid by the RBI. The payment of interim dividend may then be restricted to extraordinary circumstances. -
It would obviate any timing considerations that may enter into the selection of OMO/ MSS as monetary policy tools. -
It would also bring about better cohesiveness in monetary policy projections, reports published by the RBI, etc., many of which are using the fiscal year as the base. (Para 4.97) Periodicity of review of the ECF 5.31 The Committee recommends that the framework may be periodically reviewed every five years. Nevertheless, if there is a significant change in the RBI’s risks and operating environment, an intermediate review may be considered. (Para 4.98)
References 1. Adler, Gustavo, Castro, Pedro, and Tovar, Camilo E. (2016). “Does Central Bank Capital Matter for Monetary Policy?”, Open Economies Review, 27(1), 183–205. 2. Amador, Manuel, Bianchi, Javier, Bocola, Luigi, & Perri, Fabrizio (2016). ‘Reverse Speculative Attacks’, NBER Working Paper No. 22298. Retrieved from https://www.nber.org/papers/w22298. 3. Anand, Abhishek, Felman, Josh, Sharma, Navneeraj, & Subramanian, Arvind (2018). “Paranoia or Prudence? How Much Capital is Enough for the RBI?”, Economic & Political Weekly, 53, (48). 4. Archer, David & Moser-Böehm, Paul (2013). “Central Bank Finances”; BIS Papers No. 71, April. Retrieved from https://www.bis.org/publ/bppdf/bispap71.pdf. 5. Banco Central de Chile Annual Report various issues. 6. Bank for International Settlements Annual Report various issues. 7. Bank for International Settlements (2013). ‘Market volatility and foreign exchange intervention in EMEs: what has changed?’ Retrived from https://www.bis.org/publ/bppdf/bispap73.pdf 8. Bank Indonesia Annual Report various issues. 9. Bank Negara Malaysia Annual Report various issues. 10. Bank of England (2017). Annual Report and Accounts – 2017; p 126. Retrieved from https://www.bankofengland.co.uk/-/media/boe/files/annual-report/2017/boe-2017.pdf?la=en&hash=32D14F11EF6AA4E3D708C168819F112FAC1D3681 11. Bank of England (2018). ‘Financial relationship between HM Treasury and the Bank of England: Memorandum of Understanding.’ Retrieved from https://www.bankofengland.co.uk/-/media/boe/files/memoranda-of-understanding/financial-relationship-between-hmt-and-the-boe-memorandum-of-understanding.pdf 12. Bank of Korea Annual Report various issues. 13. Bank of Russia Annual Report various issues. 14. Basel Committee on Banking Supervision (2016). ‘Minimum capital requirements for market risk’, published January 14, 2016. Retrieved from https://www.bis.org/bcbs/publ/d352.pdf 15. Benecká, S., Holub, T., Kadlčáková, N.L., & Kubicová I. (2012). “Does Central Bank Financial Strength Matter for Inflation? An Empirical Analysis”, Czech National Bank Working Papers, series 3, Czech National Bank. 16. Bindseil, Ulrich, Manzanares, Andres & Weller, Benedict (2004). ‘The Role of Central Bank Capital Revisited’, ECB Working Paper No. 392, September. Retrieved from https://www.ecb.europa.eu/pub/pdf/scpwps/ecbwp392.pdf?e7bba27cdd7b653529fc35400ff0a3c0. 17. Buiter, Willem H. (2008). ‘Can Central Banks Go Broke?’, CEPR Discussion Papers No. 6827, London, Centre for Economic Policy Research. Retrieved from https://cepr.org/active/publications/discussion_papers/dp.php?dpno=6827 (last accessed 4 June 2019). 18. Bunea, Daniela, Karakitsos, Polychronis, Merriman, Niall, & Studener, Werner (2016). ‘Profit Distribution and Loss Coverage Rules for Central Banks’, ECB Occasional Paper Series, No. 169, April. Retrieved from https://www.ecb.europa.eu/pub/pdf/scpops/ecbop169.en.pdf?f7073b79c2f6f62c79918dc24088dd00 (last accessed 4 June 2019). 19. Crotty James (2009). ‘Structural Causes of the Global Financial Crisis: A Critical Assessment of the ‘New Financial Architecture’’, Cambridge Journal of Economics 2009, 33, 563–580 20. Dziobek Claudia, Dalton John (2005). ‘Central bank losses and experiences in selected countries’, IMF Working Paper No. 05/72. Retrieved from https://www.imf.org/external/pubs/ft/wp/2005/wp0572.pdf 21. Ernhagen, Tomas, Vesterlund, Magnus, & Viotti, Staffan (2002). ‘How Much Equity Does a Central Bank Need?’, Sveriges Riksbank Economic Review. Retrieved from http://archive.riksbank.se/Upload/Dokument_riksbank/Kat_publicerat/Artiklar_PV/er02_2_artikel1.pdf. 22. European Central Bank Annual Report various issues. 23. European Central Bank (2019). ‘Sensitivity Analysis of Liquidity Risk – Stress Test’. 24. Frait, J. (2005). ‘Exchange Rate Appreciation and Negative Central Bank Capital: Is There a Problem?’, Speech presented at Expert Forum: Central Bank Finances and Impact on Independence, Centre for Central Banking Studies, Bank of England, London. 25. Fraser (2013). ‘The Reserve Bank's Capital Adequacy Framework’, The Reserve Bank of New Zealand Bulletin, September 2013, Volume 76, No. 3. 26. Friedman, M., and Schwartz, A.J. (1963). A Monetary History of the United States, 1867–1960, A Study by The National Bureau of Economic Research, Princeton: Princeton University Press. 27. Gopalakrishna, G. (2013). Inaugural speech at ‘Federal Reserve System Market Risk Analysis Seminar’ at New Delhi, January 21, 2013. Retrieved from https://rbi.org.in/scripts/BS_SpeechesView.aspx?Id=771 28. Hall, R.E., & Reis, R. (2015). ‘Maintaining Central-Bank Financial Stability under New-Style Central Banking’, NBER Working Paper No. 21173. Retrieved from https://www.nber.org/papers/w21173. 29. Hastowo,M. Agung, & Indarto, Tonny (2016). ‘Fundamental Principles of Central Bank Financial Reporting: A Preliminary Study in SEACEN Economies’. Retrived from https://www.seacen.org/publication-research.php?pid=702004-100391 30. Jacome, H., Luis, I., Sedik, Tahsin, Saadi & Townsend Simon (2011). ‘Can Emerging Market Central Banks Bail Out Banks? A Cautionary Tale From Latin America’, IMF Working Paper No. 11/258. Retrieved from https://www.imf.org/en/Publications/WP/Issues/2016/12/31/Can-Emerging-Market-Central-Banks-Bail-Out-Banks-AL4848-Cautionary-Tale-From-Latin-America-25334 31. Kathleen McDill (2004). ‘Resolution Costs and the Business Cycle’, FDIC Working Paper 2004-01, March 2004 32. Klüh, U. & Stella, P. (2008). ‘Central Bank Financial Strength and Policy Performance: An Econometric Evaluation’, IMF Working Papers No. 08/17 International Monetary Fund, Washington, DC. 33. Krugman, Paul R. (1998). ‘It's Baaack: Japan's Slump and the Return of the Liquidity Trap’, Brooking Papers on Economic Activity, 29(2), 137–87. 34. Lahiri, Amartya, Bandyopadhyay, Sujan, Devnani, Rishab & Ghosh, Sudipta (2019). ‘Central Bank Equity: Facts and Analytics’, CAFRAL and University of British Columbia. 35. Luc Laeven, Fabián Valencia (2013). ‘Systemic Banking Crises Database’, IMF Economic Review, June 2013, Volume 61, Issue 2, pp 225-270. 36. Meyer, Laurence H. (2000). ‘Payment of interest on reserves and Fed surplus’, testimony dated May 3, 2000 before the Committee on Banking and Financial Services, U.S. House of Representatives. (https://www.federalreserve.gov/boarddocs/testimony/2000/20000503.htm) 37. Perera, A., Ralston, D., & Wickramanayake, J. (2013). ‘Central Bank Financial Strength and Inflation: Is There a Robust Link?’, Journal of Financial Stability, 9, 399–414. 38. Rajan, Raghuram G. (2016). ‘The Independence of the Central Bank’, Speech dated 3 September 2016 at St. Stephen’s College, Delhi. Retrieved from https://www.rbi.org.in/Scripts/BS_SpeechesView.aspx?Id=1021 39. Reserve Bank of India (2019). ‘Financial Stability Report June 2019’. Retrieved from https://rbidocs.rbi.org.in/rdocs/PublicationReport/Pdfs/FSRJUNE2019E5ECDDAD7E514756AFEF1E71CB2ADA2B.PDF 40. Reserve Bank of Australia Annual Report various issues. 41. Reserve Bank of New Zealand Annual Report various issues. 42. Restrepo Jorge, Salomó Luis & Valdés Rodrigo (2008). ‘Macroeconomics, Monetary Policy and the Central Bank´s Net Worth’, Working Papers Central Bank of Chile 497, Central Bank of Chile. 43. Sims, C.A. (2013). ‘Paper Money’, American Economic Review, 103(2), 563–84. 44. South African Reserve Bank Annual Report various issues. 45. Stella, Peter (1997). ‘Do Central Banks Need Capital?’, IMF Working Paper No. 97/83. Retrieved from https://www.imf.org/en/Publications/WP/Issues/2016/12/30/ Do-Central-Banks-Need-Capital-2260. 46. —(2005). ‘Central Bank Financial Strength, Transparency, and Policy Credibility’, IMF Staff Papers, vol. 52, International Monetary Fund, Washington, DC, pp. 335–65. 47. Stella, Peter & Lönnberg, Åke (2008). ‘Issues in Central Bank Finance and Independence’, IMF Working Paper No. 08/37. Retrieved from https://www.imf.org/external/pubs/ft/wp/2008/wp0837.pdf. 48. Sveriges Riksbank Annual Report various issues. 49. Swiss National Bank Annual Report various issues. 50. The Riksbank’s Financial Independence (2007). Commission of Inquiry report (SOU2007: 51) 51. Thomas F. Cargill (2005): “Is the Bank of Japan's Financial Structure an Obstacle to Policy?”; IMF Staff Papers Vol. 52, Number 2, 311–34. In addition to the above given central banks, annual reports of many other central banks were examined.
Annex III Economic Capital Framework of other central banks 1. Bank of England The objective of the BoE capital framework is to provide a robust and transparent process to ensure that the BoE has the financial resources needed to undertake the financial operations necessary to deliver its objectives even under severe but plausible scenarios. The purpose of BoE capital is that operations that lie within the BoE’s objectives of maintaining monetary and financial stability should be backed by its own capital, unless those operations bear a level of risk beyond the tolerance approved by Governors and Court. The following types of operations should be backed by capital: -
Secured lending in line with the BoE’s published frameworks, including against eligible collateral; -
Asset purchase operations to support conventional monetary policy implementation, the BoE’s official customer business or the funding of the BoE. The actual level of the BoE’s loss-absorbing capital at any point in time should allow it to continue to undertake the operations, both in normal market and liquidity conditions and under a set of severe but plausible scenarios, without falling below the capital floor. These scenarios are approved by Governors and Court. The financial backing for other operations, including those covered under the ‘Memorandum of Understanding on resolution planning and financial crisis management’, unconventional monetary policy asset purchases and MMLR operations should be assessed on a case-by-case basis. The parameters of the BoE’s capital framework will be formally reviewed by the BoE and the Treasury at least every five years. However, in circumstances where the risk environment faced by the BoE changes fundamentally, an intermediate review may be warranted. Capital requirements will be set considering both the BoE’s current balance sheet and its contingent commitments to provide liquidity insurance to the financial system. Other factors, such as potential future changes to BoE facilities that the BoE indicates may be necessary to enable it to achieve its objectives, will also be considered. The parameters of the capital framework include a target, a floor, and a ceiling. Target (i) The target will be calculated using a forward-looking, scenario-based approach to assess potential losses in a set of severe but plausible events, for activities that are backed by the BoE’s capital. When the BoE’s capital is below the target, whether above or below the floor, the BoE will not make payments in lieu of dividends to the Treasury until such time as the target is reached. Floor (ii) The floor will be set as the level below which the credibility of the BoE’s ability to deliver its mission would be in sufficient jeopardy to warrant timely action. Should the BoE’s capital fall below that floor, it will be important to take rapid and decisive steps to restore the BoE’s capital to underpin confidence in the BoE. Ceiling (iii) This will be set at a level that enables the BoE’s capital to withstand substantial losses without falling below the target by the end of the five-year period. Specifically, the distance between the ceiling and the target will be no less than two-thirds of the distance between the target and the floor and no more than the distance between the target and the floor. Once the BoE’s capital is above the ceiling, no further income is retained, and 100 per cent of net profits for the financial year in which the ceiling is exceeded and for any future years that it is exceeded will be paid in lieu of dividend by the BoE to the Treasury. If the BoE’s capital is above the target, but below the ceiling, the BoE will pay 50 per cent of net profits for the financial year in which the capital target is exceeded and for any future years that it is exceeded, in lieu of dividend to the Treasury. Source: https://www.bankofengland.co.uk/letter/2018/banks-financial-framework-june-2018 2. European Central Bank Since 2007, the ECB has reported in its Annual Accounts the financial risks relating to all of its portfolios combined, as measured by the financial VaR at a 95 per cent CL over a one-year horizon. As on 31 December 2018 - as reported in the 2018 Annual Accounts – the subscribed and paid-up capital amounted to €10.8 billion and €7.7 billion respectively. In recent years the ECB has enhanced its risk modelling framework. Some of the changes implemented include the following: -
The ECB now uses the ES at a 99 per cent CL as the main measure for risk calculations, with other risk measures and confidence levels being used to provide complementary information. -
An ‘accounting approach’ has been devised in addition to the existing ‘financial approach’. Under the financial approach, the revaluation accounts are not considered as a buffer in the calculation of risks, whereas under the accounting approach risks are quantified after considering the revaluation accounts, in line with the applicable accounting rules. Therefore, the two approaches reflect two different ways of looking at risks: the financial approach considers their impact on the ECB’s net equity, whereas the accounting approach considers their impact on the ECB’s P&L account. The accounting approach is deemed more appropriate in the context of the Annual Accounts as it offers a clearer picture of the risks in terms of their accounting consequences. Therefore, also seeking to align published data with the internal risk modelling and reporting approach, the ECB’s Annual Accounts will, henceforth, report the ES at a 99 per cent CL following the accounting approach, instead of the VaR at a 95 per cent CL following the financial approach. Depending on the size of the ECB’s revaluation accounts, the financial and accounting approaches for measuring risks can result in significantly different risk estimates in terms of their size and composition. In particular, the financial approach, using the same risk measure and confidence level, results in larger risk estimates, mainly dominated by sizeable market risks associated with foreign reserve holdings. Since significant revaluation accounts exist for such exposures, the accounting approach results in lower risk figures, mainly driven by potential credit risk events. The changeover from the financial VaR 95 per cent to the accounting ES 99 per cent in the Annual Accounts for 2017 results in a higher risk estimate in nominal terms as the increase in the risk estimate from choosing a higher confidence level (99 per cent instead of 95 per cent) and a more conservative risk measure (ES instead of VaR) more than compensates for the reduction in the risk estimate brought about by considering the revaluation accounts as a buffer. Source: ECB Annual Report 2017 3. Reserve Bank of Australia The RBRF is the RBA’s general reserve and is the main component of the RBA’s capital. This reserve is funded from transfers from earnings available for distribution. Its purpose is to provide the capacity to absorb losses when it is necessary to do so. The Reserve Bank Board has a framework to assess the target balance of the RBRF by assessing and appropriately assigning capital to exposures of different risk. The largest potential for loss from the RBA’s assets comes from market risk, comprising foreign exchange and interest rate risk. The capital assigned to each component of market risk is derived from the RBA’s historical experience of loss and stress tests of the balance sheet, which incorporate significant adverse movements in exchange rate and interest rates drawn from historical experience. Since the largest potential for loss is associated with the RBA’s unhedged holdings of foreign exchange assets, materially more capital is assigned to exchange rate risk than to interest rate risk. While the RBA has no history of loss from credit risk, credit risk is also incorporated into the capital framework. The capital held against credit risk is currently a small sum, reflecting the quality of assets the RBA holds, the soundness of counterparties with which it deals, the fact that repurchase agreements and foreign exchange swaps are well collateralized and that the RBA follows a set of conservative policies to manage credit risk, consistent with its very low appetite for such risk. Capital, therefore, is held only against the RBA’s very small exposures to commercial banks that are not collateralized. This overall approach to credit risk is consistent with the practice of a range of major central banks. The balance of the unrealized profits reserve stood at $5,860 million on 30 June 2018, a rise of $3,178 million from the previous year. This movement largely reflects unrealized revaluation gains associated with the depreciation of the Australian dollar. The balance of this reserve is available either to absorb future revaluation losses or to be distributed over time as the gains are realized when relevant assets are sold. The current balance in the RBRF ($14,119 million) slightly exceeded the Reserve Bank Board's target at the end of 2017/18. Accordingly, the Board viewed the balance sheet as being very strong and members saw no need to seek further capital from 2017/18 profits. The Treasurer, after consulting the Board, therefore determined that all earnings available for distribution in 2017/18, a sum of $669 million, would be paid as a dividend to the Commonwealth. Source: Reserve Bank of Australia Annual Report 2018 4. Reserve Bank of New Zealand The RBNZ employs an ECF that ensures that the Bank is unlikely, within a 99.9 per cent CL, to suffer a financial loss through credit, market or operational risks that would result in negative equity. The RBNZ uses market and credit risk models using both standard and S-VaR models, and applies them to its traded and non-traded portfolios to model the its capital requirement. An allowance for operational risk is also added. Key inputs in capital modelling include interest rate and foreign currency positions and limits, foreign and local currency investments and counterparty credit exposures, as well as the probability of loss with respect to each of these factors. The calculation of required capital is assessed by the Bank’s Asset and Liability Committee and the Governing Committee. In making that assessment, consideration is given to whether a capital buffer needs to be retained for hypothetical events such as an extreme economic shock or foreign currency market event. No additional capital buffers were provided as at the reporting date (2017). The Board and Minister review the RBNZ’s assessment of required capital when considering its annual dividend recommendation. To ensure that unrealized gains are not distributed, after a provision for dividend is made, Net Assets/Equity Excluding Unrealized Gains should not be less than required capital. Source: RBNZ Annual Report 2017–18 5. Central banks with target-level reserves and risk provisions -
The Norges Bank requires allocations to be made from its profit to the Adjustment Fund until the Fund has reached 5 per cent of the Bank’s holdings of Norwegian securities and 40 per cent of the Bank’s net forex reserves (Page 66, Annual Report – 2017). -
The SNB, which till recently linked its reserve calculations to the average growth of nominal GDP over the preceding five years, now does so at twice that rate, given the heightened risks (Page 159, Annual Report – 2017). -
BdF, in addition to its General Fund, must also maintain a reserve which must be equal to at least 12 per cent of its gold and foreign currency position; this must also be sufficient to cover the losses that would arise from a fall in prices equivalent to the worst price fall of the past ten years (Page 113, Annual Report – 2017). -
In the case of the US FED System, each member commercial bank of the 12 Federal Reserve Banks (FRB), each of which is a separate legal entity, subscribes to the capital stock of the respective FRB in an amount equal to 6 per cent of its own capital and surplus, adjusted each year as per the changes in capital and surplus of the member banks. Each FRB also maintains a ‘Surplus Account’ which is equivalent to the level of its respective capital. -
BoJ’s accounting rules require it to maintain a capital adequacy ratio of 10 ± 2% of its outstanding banknotes (Accounting rules of BOJ, Article 18).
Annex IV Central banks with risk transfer mechanisms (i) NCBs of the ESCB, for whom the losses caused by the ELA extended by the NCBs to the banks, are often seen to be guaranteed by the sovereign. (ii) BoE, where the risk/returns of the QE programme are borne by the Treasury through a SPV. (iii) BoK, for which any losses exceeding its reserves are to be borne by the Government, as provided for in the BoK’s statute. (iv) SARB, where foreign-exchange profits or losses are borne by the Government while investment returns on foreign-exchange reserves and interest paid on foreign loans are accounted for in the central bank’s P&L account. (v) RBNZ, where the financial consequences of forex interventions ordered by the Government are expressly borne by the Government. (vi) RBI, for which the MSS enabled the sharing of sterilization costs between the Government (through the MSS) and the RBI (through OMOs). (vii) BCdB, where the carrying cost of international reserves and the risks/rewards of forex swaps conducted in the domestic market are transferred to the Government. (viii) US FED, which, in 2011, introduced an accounting change whereby losses incurred by it are to be treated as an asset representing a claim on the Treasury, which need to be offset before transfer of surplus to the Treasury can recommence. Further, the Treasury had also indemnified the US FED on its risk exposures arising from some of its bailout operations during the financial crisis; (ix) Bank Indonesia and Banco Central de Reserva del Peru are instances where ad hoc RTMs were adopted during a period of crisis.
Annex V Surplus distribution by an AE central bank A major challenge which could arise for central banks having large forex holdings and taking valuation gains/losses to P&L, is that there would be considerable volatility in the P&L statement. This is best exemplified by the concerned central bank’s position in the post-GFC period. This central bank has, consequently, put in a stringent surplus distribution policy involving a distribution reserve which contains profits that have not yet been distributed. It can also be used to offset against losses and can therefore also be negative.
Annex VI Rating methodologies/ relevant ratings of Standard & Poor’s (S&P), Moody’s and DBRS S&P (i) S&P’s ‘monetary authorities rating methodology’ states that ‘The ratings on monetary authorities outside of monetary and currency unions are at the same level as their respective sovereign because we consider that they are analytically inseparable from one another’. This principle has been used by them to rate the Federal Reserve System (FRS), Federal Reserve Bank of New York (FRBNY), SNB, Sveriges Riksbank, and Bangko Sentral ng Pilipinas. (ii) Incidentally, even though the US Sovereign and the FRS were already rated, S&P separately rated the FRBNY in 2010 (albeit at the same level of the Sovereign and the FRS). The S&P states in its rating paper that ‘in light of recent criteria updates, we believe it is useful to clarify that, in our opinion, the FRBNY, as one entity within the FRS, shares the FRS's credit quality. We are therefore explicitly assigning our ratings to reflect our view of the FRBNY's credit quality.’ (iii) In 1999, ratings were issued to the national central banks of Belgium, Finland, Ireland, Italy, Portugal, and Spain which were higher than those of their national governments based on the strong operational and policy making independence as per Maastricht Treaty and they being shareholders of ECB and part of monetary union. (iv) The Sovereign rating methodology of S&P was updated in December 2017 to combine both the sovereign government and monetary authorities. Moody’s Moody’s has informed that in general they assign the same rating to central banks as the sovereign, given the important public policy role of central banks and have assigned ECB AAA ratings to have an anchor for their country ceilings for euro area member states. DBRS DBRS has also issued a rating methodology for central banks dated December 2013. While it specifies that the main factors for finalizing the rating include Sovereign creditworthiness, independence, performance, support and financial strength, it also mentions that sovereign rating is used to provide a preliminary assessment of a central bank’s creditworthiness and they may rate central banks above the level of the sovereign given its unparalleled financial flexibility and critical public policy and mandate.
Annex VII Previously adopted methodologies for assessment of risk provisioning requirements of the RBI Subrahmanyam Group (1997) • CF plus ADF to be 12 per cent of assets of the RBI by the year 2005, subject to review, if considered essential • Out of this 12 per cent, 5 per cent be earmarked for meeting shocks arising out of open market operations carried out by RBI under monetary policy operations assuming 10 per cent volatility in domestic assets. • 5 per cent earmarked to absorb external shocks due to exchange rate volatility. • General rule of thumb followed that internal reserves should be at least 25 per cent of the foreign assets to ascertain the exchange rate risk. Considering foreign assets as 40 per cent of total assets, the implied reserves required to absorb external sector shocks would be at least 10 per cent of total assets, of which EFR (equivalent to CGRA) constituted 5 per cent of total assets. • The remaining 2 per cent was proposed towards systemic risk/developmental role. Out of this 2 per cent, 1 per cent was proposed to be earmarked and retained under ADF for meeting capital expenditure and investment in subsidiaries. Malegam Committee (2014) • RBI should maintain at all times buffers for risks which shall not be less than the amounts indicated below: -
For coverings risks of future rupee appreciation to FCA, 17 per cent of the carrying value of FCA but not less than the unrealized gains lying to the credit of CGRA. -
For gold price risk, 34 per cent of the carrying value of gold may be provided for. The total buffer for gold should not be less than the unrealized gain lying to the credit of GRA. -
For depreciation in the market value of foreign securities, buffer equivalent to the impact of the maximum jumps in yields in foreign currency holdings by the value of such holdings, converted into rupees based on a study of the risk of such investments and of the past volatility in yields. -
For risks arising out of depreciation in the market value of rupee securities to be at 7.5 per cent of the carrying value of investment in rupee securities. -
Operational risks and systemic risks to be provided as 15 per cent of the annual gross income of RBI. • Since the balances in the CF and ADF are currently in excess of the buffers needed, there was no need to make any further transfers to CR and ADR for the next three years after which the position may be reviewed. • The benchmarks for determining the level of reserves/buffers to be maintained should be reviewed at the end of each three-year period. Economic Capital Framework (2015) • Risk covered under ECF and assessment methodologies: -
Stressed Value at Risk engine to capture market risk. The risk parameters are 99.99 per cent CL, one year time horizon, 10-day return period, and Exponentially Weighted Moving Average (EWMA) decay factor of .995. -
Standardised Approach to capture credit risk. -
Basic Indicator Approach to capture operational risk. -
The ‘peak liquidity’ methodology adopted for capturing Contingency Risks. The methodology has been adapted to account for the low correlations between market risk and Contingency Risks. • Components of equity under the ECF: Capital and Reserve Fund, risk provisions built up from retained earnings (CF and ADF) and revaluation balances.
Annex VIII Constraints on monetization of revaluation balances by the RBI Revaluation balances held by commercial entities can be monetized by selling the assets in case of need. This option may not, however, be open to central banks. RBI transferring ‘what it has not received’ could be seen as monetization of fiscal deficit. Also, the transfer of valuation balances is not permitted under the RBI General Regulations. Given that most of the revaluation balances represent gains made due to the depreciation of the rupee against the USD, trying to realize these revaluation gains would involve selling a substantial portion of the RBI’s USD assets which could result in the following: (i) RBI’s intervention capabilities will be severely limited increasing forex vulnerability. (ii) Unsustainable temporary rupee appreciation: the domestic forex market will not have the capacity to absorb the USD sales, which will: -
Impact the economy. -
Reduce RBI’s CGRA which is being monetized. - Lead to selling of USD to realize CGRA which could result in realization of losses in IRA-FS.
(iii) Compromised monetary policy stance with severe liquidity and credit squeeze which will have an adverse impact on growth and stability. (iv) Other central banks could have an issue with this, especially if their currency is impacted. (v) The realized surplus will be used to retire GoI securities which will greatly reduce the RBI’s domestic portfolio, and thereby the effectiveness of monetary policy operations. (vi) Increased reliance on MSS for monetary policy operations will lead to increasing fiscal expenditure. (vii) Weakened RBI balance sheet: As the currency composition of the forex portfolio becomes highly skewed, RBI will become very vulnerable to a negative CGRA balance. (viii) Substantially lower future RBI income as income generating assets will be sold to monetize valuation gains. (ix) Moral hazard issue: Precedent will be set for using rupee depreciation funding fiscal expenditure.
Annex IX An outline of the methodologies used in the ECF Economic capital buffers 1. The EC has been defined as the difference between total assets and external liabilities of RBI. It includes Capital, Reserve Fund, CR, ADR, CGRA, IRA, FCVA and current year’s surplus. No hair cut is applied on the revaluation account balances. Market Risk methodology a) Concept of S-VaR introduced under Basel 2.5 has been used. Under S-VaR, current portfolio of the RBI is subjected to risk conditions of historically-identified stress period. The approach captures the diversification benefit of the consolidated portfolio i.e., forex, gold and G-Sec. (If correlation between two assets is less than 1, there will be diversification benefit in the form of reduced equity requirements.) b) The VaR engine of the Department of External Investments and Operations (DEIO) was modified to serve as RBI’s S-VaR engine. Parameterisation of the S-VaR was modified in line with discussions with BIS officials. c) Two scenarios were considered as stress period viz., a 10-year period ended August 2013 and a six-year period ended December 2008. The 10-year period ended August 2013 was taken for EC assessment. d) Exponentially-Weighted Moving Average (EWMA) was used with a decay factor of 0.995 (used by BIS) to assign greater weightage to recent observations. A decay factor of 0.995 allows for a much longer data coverage and, therefore, ‘normalises’ the S-VaR vis-à-vis a decay factor of (say) 0.97 used in the DEIO model. e) Time horizon for computing S-VaR was taken as one year. Though the capital planning for the RBI should be carried out with at least a medium-term perspective (say, 3-5 years), given the immediate challenges in risk modelling, the time horizon has been restricted to only one year. Further, the EC literature as well as available information on EC frameworks in commercial banks and CBs indicates that oneyear time horizon is taken for calculating EC. f) To prevent over-estimation of risk while using one-year time horizon, 10-day return (instead of daily return) is used in the S-VaR engine. Parametric S-VaR is used instead of historic S-VaR since the lesser number of data points impacts historic SVaR. g) Certain minor forex portfolios have not been inputted into S-VaR model due to technical reasons. These are normalized by applying the S-VaR percentages across entire forex, g-sec and gold portfolios. Loans and advances have not been covered under market risk. h) The Basel 2.5 recommendation of using multiplication factor of 3 in S-VaR has not been applied to prevent over-estimation of risk in view of parameterisation. Credit Risk methodology 3. Pending building up of a credit-VaR model, the Standardised Approach for credit risk under Basel II has been adopted, and the risk weights have been assigned accordingly to the RBI’s domestic and foreign exposures (viz., foreign commercial bank exposures and supranational exposures). For foreign sovereigns, we have used default probability of .01% for credit rating of AAA, .02% for AA+, etc. rated exposures, and applied 0.50 as Loss Given Default (LGD) to all foreign sovereign exposures. For the domestic exposures of the RBI, the exposure to the GoI were applied zero risk weight. In the absence of a credit-VaR model for the RBI, its Capital Adequacy Ratio was taken to be nine per cent for determining the capital charge for credit risk. Operational Risk methodology 4. The Basel Basic Indicator Approach (BIA) has been adopted. Liquidity Risk 5. Given the possibility of overlap of liquidity risk with the market risk, liquidity risk has not been included in the proposed EC framework at this stage. The one year time horizon for market risk is expected to cover this risk. Correlation of balance sheet risks 6. Within market risk, the S-VaR engine takes into consideration various risk factors captured from the historical data and generates a 78 x 78 correlation matrix. With regard to correlation between market risk, credit risk and operational risk, other central banks are seen to assume this to be 1, as correlations can change considerably during stress periods. Hence, we have also assumed a correlation of 1 between market risk, credit risk and operational risk. Contingent Risks arising from monetary and financial stability mandate 7. The following types of risks have been considered under the category of “Contingent Risk” of the Bank: -
Risks arising from ELA operations due to RBI’s LoLR role and its impact on balance sheet; -
Risks arising from sterilisation/ exchange rate operations and their impact on balance sheet; and -
Risks arising from monetary policy mandate for managing inflation risks I) ELA operations (considered for Scheduled Commercial Banks only) and the associated risks: a) To facilitate generation of various scenarios, liquidity shortage is simulated for scenarios ranging from the liquidity crisis affecting the top 5 networked banks to the entire banking system. b) Maximum net daily liquidity injection (outstanding) by the RBI was INR 2.1 trillion (July 16, 2013). Since in severe crisis periods, the peak liquidity requirement may continue for several days, a period of ten days has been taken in this exercise. c) SLR is assumed to be at 10% (over and above LCR). This is based on a medium-term assumption that with the introduction of the LCR, the SLR requirements will be brought down to broad international levels. d) A 10% haircut/ margin has been assumed on the eligible collateral of commercial banks. It has been assumed that the banks would be required to meet the funding needs using their stock of liquid assets only and there will be no external/ market borrowing/ funding. e) It is assumed that the RBI first provides the collateralised funding to commercial banks as per their requirements, and as the crisis escalates, ELA would be extended with relaxed collateral norms. f) LoLR losses incurred by the RBI through ELA are assessed by assuming a recovery rate of 80% on the liquidity support on the poor-quality collateral. There is little experience of bank bankruptcies in India, but statistics from the USA show that recovery from bank bankruptcies is often high. A study of over 1,500 bank bankruptcies in the USA between 1984 and 2002 showed that the average degree of recovery was 79 percent.31 g) The capital charge will be converted into a metric of percentage of the combined banking sector balance sheet and going forward, this metric will be used for determining capital charge for determining ELA risk. Assessment of ELA risks for NBFCs, UCBs, etc. will be estimated as the model is refined in the days ahead. h) ELA operations could be expected to have an expansionary impact on the balance sheet to the extent of liquidity provided under the ELA operations (in some scenarios up to 50% expansion). Further, during a period of financial stress, 15% Rupee depreciation is assumed (due to likely capital outflows), as well as concomitant USD 75 billion reduction in forex reserves on account of likely market interventions to reduce exchange rate volatility (which would lead to a contraction in balance sheet size). The underlying presumption is that in the face of a financial stability crisis, reducing exchange rate volatility through use of forex reserves would be a policy objective. Reckoning all these complex interlinkages (including depreciation of the Rupee also having an expansionary impact, movement of collateral into balance sheet in case of default, etc.) between the expansionary and contractionary impacts of ELA operations, a net 25% increase in balance sheet size is assumed for enhanced market risk. For the less severe ELA scenarios, forex reduction of USD 30 billion and 10% rupee depreciation is assumed. i) Results of scenario analysis and correlations: The scenario analysis indicates a maximum capital charge of around 6.5% of balance sheet for the ELA risks of the Bank. The impact of Rupee depreciation (and the consequent rising CGRA balance) on ELA risks is simulated in the above exercise and its mitigating impact on the capital requirement is factored in and the correlation between market risk and ELA risk has been assumed to be low. The rationale for assuming a low correlation of ELA risk and appreciation of Rupee is that during a banking crisis, there could be capital outflow thereby putting pressure on the Rupee. However, given that the scenarios where ELA losses as well as valuation losses arise concurrently cannot truly be ruled out32, such scenarios are also taken into consideration while determining the overall size of the ‘Contingent Buffer’. II) Risks arising from monetary policy/ sterilisation/ exchange rate operations: a) Consequent to the responsibility of exchange rate management, the RBI has to maintain an adequate level of forex reserves (the issue of adequacy of forex reserves does not fall within the purview of this exercise). However, the RBI’s operations can quickly alter composition and size of the forex reserves, thereby changing its risk profile and capital requirement. b) Further, a rapidly appreciating Rupee can force the RBI to intervene, increasing the size and currency mismatch of the balance sheet as well as depleting the CGRA. If liquidity absorption operations become warranted, there could be substantial decrease in the RBI’s income as OMO reduce holdings of G-Sec and interest outgo on account of reverse repo operations (though it may counteract to an extent the increased balance sheet size). This risk is mitigated to an extent by the MSS. Rising yields can also cause increased depreciation. c) For this scenario, balance sheet expansion by 20% is simulated. Instances of high balance sheet growth during certain periods of forex inflows were 2007-08 (46%) and 2006-07 (23%). However a lower proxy has been used which incidentally is relatively close to the CAGR of 15.5% over the past 10 year period. d) Periods of high inflows of 2003-04 and 2009-10 saw a fall of 38% and 46%, respectively, in income levels due in part to sterilisation costs. However, as MSS is available, a reduced fall in income of 10% is simulated. e) These dynamic balance sheet risks, including earnings risks have been assumed (0.64) to have a strong, positive correlation with the market risk of the RBI (unlike the ELA risks) as these occur during times of Rupee appreciation.33 f) Though there will be an increase in the riskiness of the RBI balance sheet as currency mismatch increases, the SVaR percentage is kept constant as on balance sheet date. Results of scenario analysis: The capital charge for these ‘contingent risks’ after adjusting for correlation with market risks is 3.5% of the balance sheet. III) Monetary policy risks arising out of inflation management operations a) The RBI as the monetary authority is responsible for managing inflation within the mandated levels. This mandate is to be implemented without concern to the impact of attendant risks on the RBI balance sheet. Managing high inflation would require raising policy rates which would, in turn, bring about a rising interest rate environment in the country, leading to depreciation in the G-Sec portfolio. b) This impact is modelled looking at yield jumps which are over and above those provided for in the VaR estimations. On the other hand, high inflation would also cause a depreciation (say, 15%) in the Indian Rupee thereby building CGRA valuation buffers, but also necessitating market interventions which could lead to a decline in the level of forex reserves (say, USD 75bn). Thus, the net increase in CGRA will be offset by the valuation losses caused by rising yields on G-Sec, to arrive at the capital charge required. Results of simulation: The Rupee appreciation and high inflation would be negatively correlated. We have, therefore, in view of our market risk provision, taken the capital charge for inflation risk as zero. IV) Size of Buffer for Contingent Risk We observe that the maximum capital charge for ELA risk is 6.5% of balance sheet size, though it is difficult to assign probability for the occurrence for a financial stability crisis. However, this probability as well as correlation with market risk is non-zero given other central bank’s experience in this regard. The capital charge for sterilisation risk (which has high correlation with market risks) works out to be 3.5%. In view of the above, a contingent-risk buffer of 4% of balance sheet is recommended over the medium term. This target may be periodically reviewed (say, every 5 years).
Annex X Risk Tolerance Statement (Risk Philosophy) of the Reserve Bank of India “The Reserve Bank of India (‘Bank’), in pursuit of its core objectives of fostering monetary and financial stability conducive to sustainable economic growth, and to ensure the development of an efficient and inclusive financial system, is exposed to considerable risks including policy, strategic, reputational, financial, and operational risks. The Bank is a risk-sensitive institution and recognizes that failure to effectively manage these risks may adversely impact the achievement of its core objectives. The Bank, therefore, seeks to manage its risks appropriately, consistent with the risk tolerance limits articulated from time to time: -
The Bank takes a considered view on policy and strategic risks, which are managed through institutional frameworks aimed at effectiveness, transparency, and accountability. -
The financial risks arising out of policy and market operations are accepted as significant by the Bank. -
The financial risks of reserves management are addressed within a framework of safety, liquidity, and returns. -
The Bank has a low tolerance for operational risks, which are sought to be minimized. As financial risk considerations remain subordinate to the Bank's public policy objectives, adequate provision is sought to be built to absorb the risks that could materialize from various eventualities.”
Annex XI Expansion of eligible assets classes by select central banks following the GFC | Central Bank | Public securities | Private assets | | Domestic | Foreign | Corporate bond | ABS | Short-term bank debt | Bank loans | | Fed–OMO | Eligible | Added | Added | Added | Added | Added | | -Standing facility | Eligible | Eligible | Eligible | Eligible | Eligible | Eligible | | ECB | Eligible | Added | Expanded | Eligible | Expanded | Eligible | | BoE | Eligible | Expanded | Added | Added | Not eligible | Not eligible | | BoJ | Expanded | Added | Expanded | Expanded | Not eligible | Expanded | | BOC – OMO | Expanded | Added | Added | Not eligible | Added | Added | | - Standing facility | Eligible | Added | Eligible | Not eligible | Eligible | Added | | RBA | Eligible | Not eligible | Added | Added | Added | Not eligible | | Eligible: Continuing from prior to crisis and no change; Added: Made eligible during the crisis; Expanded: Indicates the asset class has been eligible since pre-crisis and eligible type of security was expanded during the crisis; Not eligible: asset class has continued to be ineligible through the crisis period. | | Source: IMF Paper (2010) of Monetary and Capital Markets Department; Approved by José Viñals |
Annex XII Recapitalization of commercial banks by national treasuries | Country | Bank | Recapitalization support | | US | Bank of America | USD 15 bn | | | Citigroup | USD 45 bn | | | Merrill Lynch | USD 30 bn | | | Wachovia | USD 10 bn | | Belgium | Dexia | EUR 8.5 bn | | Switzerland | UBS | CHF 6 bn | | Germany | Aareal Bank AG | EUR 0.5 bn | | | Commerzbank AG | EUR 18.2 bn | | | West LB AG | EUR 3 bn | | UK | Banking sector (4) | Pounds 137 bn | | Netherlands | Fortis | EUR 19.8 bn | | | ING | EUR 10 bn | | Ireland | AIB | EUR 5.5 bn | | | Bank of Ireland | EUR 5.5 bn | | | Anglo | EUR 5.5 bn | | (Source: 1) The European Union’s Response to the 2007-2009 Financial Crisis, Walter W. Eubanks, August 13, 2010; 2) Recapitalisation of failed banks – some lessons from the Irish experience, Address by Mr Patrick Honohan, Governor of the Central Bank of Ireland, at the 44th Annual Money, Macro and Finance Conference, Trinity College, Dublin, 7 September 2012; 3) Historical Losses and Recapitalisation Needs Findings Report, Financial Stability Board, 9 November 2015; 4) Bank rescues of 2007-09: outcomes and cost, Federico Mor, Briefing Paper, House of Commons, Number 5748, October 8, 2018) |
Annex XIII Projection of RBI’s balance sheet and net income till 2022-23 (1) Dataset on RBI’s balance sheet size, net income and net foreign assets: 1990-91 to 2018-19 | (in ₹ Billion) | | Table AXIII.1: RBI’s balance sheet size, net income and net foreign assets | | Year | Balance Sheet (BS) | Net Foreign Assets (NFA) | Net Income (NI) | NFA-to- BS ratio | NI-to- BS ratio | | (1) | (2) | (3) | (4) | (3) / (2) | (4) / (2) | | 1990-91 | 1236 | 98 | 33 | 0.08 | 0.03 | | 1991-92 | 1426 | 251 | 24 | 0.18 | 0.02 | | 1992-93 | 1618 | 324 | 15 | 0.20 | 0.01 | | 1993-94 | 1812 | 620 | 34 | 0.34 | 0.02 | | 1994-95 | 2182 | 733 | 51 | 0.34 | 0.02 | | 1995-96 | 2355 | 744 | 76 | 0.32 | 0.03 | | 1996-97 | 2503 | 1051 | 95 | 0.42 | 0.04 | | 1997-98 | 2933 | 1146 | 93 | 0.39 | 0.03 | | 1998-99 | 3365 | 1442 | 147 | 0.43 | 0.04 | | 1999-00 | 3600 | 1641 | 166 | 0.46 | 0.05 | | 2000-01 | 4075 | 2084 | 163 | 0.51 | 0.04 | | 2001-02 | 4536 | 2836 | 181 | 0.63 | 0.04 | | 2002-03 | 5198 | 3822 | 165 | 0.74 | 0.03 | | 2003-04 | 6098 | 5436 | 66 | 0.89 | 0.01 | | 2004-05 | 6828 | 5953 | 122 | 0.87 | 0.02 | | 2005-06 | 8088 | 7472 | 205 | 0.92 | 0.03 | | 2006-07 | 10020 | 8676 | 682 | 0.87 | 0.07 | | 2007-08 | 14630 | 13381 | 517 | 0.91 | 0.04 | | 2008-09 | 14082 | 12644 | 525 | 0.90 | 0.04 | | 2009-10 | 15531 | 12571 | 245 | 0.81 | 0.02 | | 2010-11 | 18047 | 13790 | 284 | 0.76 | 0.02 | | 2011-12 | 22089 | 15944 | 430 | 0.72 | 0.02 | | 2012-13 | 23907 | 16535 | 618 | 0.69 | 0.03 | | 2013-14 | 26244 | 18770 | 527 | 0.72 | 0.02 | | 2014-15 | 28892 | 22575 | 669 | 0.78 | 0.02 | | 2015-16 | 32430 | 24455 | 669 | 0.75 | 0.02 | | 2016-17 | 33041 | 25004 | 439 | 0.76 | 0.01 | | 2017-18 | 36176 | 27791 | 642 | 0.77 | 0.02 | | 2018-19 | 41029 | 29527 | - | 0.72 | .. | (2) Growth rate of RBI’s balance sheet and net income across various periods | Table AXIII.2: Growth rate of RBI’s balance sheet and net income across various periods | | Period | No. of years | Balance Sheet growth rate
(A) | Net Income growth rate
(B) | | 2014-15 to 2018-19 | 5 | 9.16% | 11.11% | | 2009-10 to 2018-19 | 10 | 11.40% | 17.18% | | 2004-05 to 2018-19 | 15 | 13.67% | 16.36% | | 1999-00 to 2018-19 | 20 | 13.66% | 10.02% | | 1994-95 to 2018-19 | 25 | 13.00% | 13.33% | (3) Chow-test Results Given the sharp structural change in the balance sheet composition over the years, a Chow-test was done to identify structural breaks in the series based on net foreign asset- to- balance sheet ratio, so as to identify the period for the purpose of projection. The test results (Table AXIII.2) indicate a break point during 2000-01. Therefore, data from 2000-01 onwards was considered for further analysis. | Table AXIII.3: Chow Test | | Chow Breakpoint Test: 2000-01 | | Null Hypothesis: No breaks at specified breakpoints | | Varying regressors: All equation variables | | Equation Sample: 1991-92 to 2018-19 | | F-statistic | 2.83663 | | Prob. F(2,24) | 0.0784 | | Log likelihood ratio | 5.94139 | | Prob. Chi-Square(2) | 0.0513 | | Wald Statistic | 5.673261 | | Prob. Chi-Square(2) | 0.0586 | (4) Balance sheet projection Balance sheet (BS) projection is done using an autoregressive model, AR(2). The fitted model is, The projected balance sheet, in accordance with the aforementioned model is given in table AXIII.4. | Table AXIII.4: Projected balance sheet of RBI till 2022-23 | | (in ₹ Billion) | | Year | Projected Balance Sheet size | | 2019-20 | 44,915 | | 2020-21 | 49,166 | | 2021-22 | 53,663 | | 2022-23 | 58,420 | The lag length of AR model was chosen based on the residual diagnostics, which indicate that two lags are optimal. In particular, the Breusch-Godfrey serial correlation LM test was done to test the null hypothesis, H0: No serial correlation of residuals upto 2 lags. The test results (Table AXIII.2) yielded a p-value of 0.545 (higher than 0.05), by which there is no reason to reject the null hypothesis, showing that there is no serial correlation left in the residuals. Further, the Correlogram Q-Statistics also confirm this. Forecast efficiency: To examine forecast efficiency, the model was worked out based on data from 2000-01 to 2015-16 for out-of-sample forecast which was used to forecast values for 3 years from 2016-17 to 2018-19. The measures of out-of-sample forecasts are given below. The root mean square error (RMSE) for the out-of-sample forecasts is 0.075, which is quite low and closer to the RMSE for in-sample forecast efficiency, 0.078. (5) Projection of Net Income Net Income is projected using net income-to- balance sheet ratio for the period 2000-01 to 2018-19 and the projected values of balance sheet as provided in table AXIII.4. | Table AXIII.5: Net income- to- balance sheet ratio | | Mean | 0.0265 | | SD | 0.0131 | | Mean - 1SD | 0.0134 | | Mean + 1SD | 0.0395 | The projected net income using the mean net income to balance sheet ratio is given in table AXIII.6 | Table AXIII.6: Projected net income of RBI till 2022-23 | | (in ₹ Billion) | | Year | Using mean net income to balance sheet ratio | Using mean (-) 0.5 SD net income to balance sheet ratio | | 2019-20 | 1190 | 896 | | 2020-21 | 1303 | 981 | | 2021-22 | 1422 | 1071 | | 2022-23 | 1548 | 1165 |
| Table AXIII.7: Projected risk provisioning with immediate move to target realized equity of 5.5% of BS | | Year | Mean | Mean-0.5 SD | Mean+0.5 SD | Mean-1 SD | Mean+1 SD | | 2018-19 | 0% | 0% | 0% | 0% | 0% | | 2019-20 | 18% | 24% | 14% | 36% | 12% | | 2020-21 | 18% | 24% | 14% | 35% | 12% | | 2021-22 | 17% | 23% | 14% | 34% | 12% | | 2022-23 | 17% | 22% | 14% | 33% | 11% | | Average for 2019-23 | 14%*
(18%)# | 19%
(23%) | 11%
(14%) | 28%
(35%) | 9%
(12%) | *This represents the average risk provisioning for the five year period of 2018-19 to 2022-23 including zero per cent risk provisioning for 2018-19
# This represents the average risk provisioning for the four year period of 2019-20 to 2022-23 excluding zero per cent risk provisioning for 2018-19 |
| Table AXIII.8: Projected risk provisioning with a gradual glide down of target realized equity from 6.5% to 5.5% of BS | | Year | Mean | Mean-0.5 SD | Mean+0.5 SD | Mean-1 SD | Mean+1 SD | | 2018-19 | 0% | 0% | 0% | 0% | 0% | | 2019-20 | 12% | 16% | 9% | 23% | 8% | | 2020-21 | 11% | 15% | 9% | 22% | 7% | | 2021-22 | 10% | 13% | 8% | 19% | 6% | | 2022-23 | 8% | 11% | 7% | 16% | 6% | | Average for 2019-23 | 8%*
(10%)# | 11%
(14%) | 7%
(8%) | 16%
(20%) | 5%
(7%) | *This represents the average risk provisioning for the five year period of 2018-19 to 2022-23 including zero per cent risk provisioning for 2018-19
# This represents the average risk provisioning for the four year period of 2019-20 to 2022-23 excluding zero per cent risk provisioning for 2018-19 |
| Table AXIII.9: Projected risk provisioning with immediate move to target realized equity of 6.5% of BS | | Year | Mean | Mean-0.5 SD | Mean+0.5 SD | Mean-1 SD | Mean+1 SD | | 2018-19 | 0% | 0% | 0% | 0% | 0% | | 2019-20 | 21% | 28% | 17% | 42% | 14% | | 2020-21 | 21% | 28% | 17% | 42% | 14% | | 2021-22 | 21% | 27% | 16% | 41% | 14% | | 2022-23 | 20% | 27% | 16% | 39% | 13% | | Average for 2019-23 | 17%*
(21%)# | 22%
(28%) | 13%
(17%) | 33%
(41%) | 11%
(14%) | *This represents the average risk provisioning for the five year period of 2018-19 to 2022-23 including zero per cent risk provisioning for 2018-19
# This represents the average risk provisioning for the four year period of 2019-20 to 2022-23 excluding zero per cent risk provisioning for 2018-19 |
| Table AXIII.10: Projected risk provisioning under various scenarios | | Net income to balance sheet ratio scenarios | Illustrative average rate of risk provisioning as per cent of net income from 2018-19 to 2022-23 under various scenarios* | | Uniform CRB target of 6.5 per cent of balance sheet till 2022-23 | CRB target of 6.5 to 5.5 per cent of balance sheet under a gradual glide path till 2022-23 | Uniform CRB target of 5.5 per cent of balance sheet till 2022-23 | | Mean | 16.6 (20.7) | 8.1 (10.1) | 14.0 (17.5) | | Mean + 0.5 SD | 13.3 (16.6) | 6.5 (8.1) | 11.3 (14.1) | | Mean – 0.5 SD | 22.0 (27.5) | 10.8 (13.5) | 18.6 (23.3) | | Mean + SD | 11.1 (13.9) | 5.4 (6.8) | 9.4 (11.7) | | Mean – SD | 32.8 (41.0) | 16.0 (20.0) | 27.8 (34.7) | | * Given that the risk provisioning could be low during 2018-19, the figure in parenthesis represent the risk provisioning required in the remaining 4 years |
Select Abbreviations and Definitions | ADF | Asset Development Fund | | AE | Advanced Economies | | AvE | Available Equity | | ARE | Available Realized Equity | | BCBS | Basel Committee on Banking Supervision | | BCdB | Banco Central do Brasil | | BCdC | Banco Central de Chile | | BdF | Banque de France | | BIA | Basic Indicator Approach | | BIS | Bank for International Settlements | | BNM | Bank Negara Malaysia | | BoE | Bank of England | | BOFC | Bank Otkritie Financial Corporation PJSC | | BoJ | Bank of Japan | | BoK | Bank of Korea | | BoP | Balance of Payment | | BoR | Bank of Russia | | bps | Basis Points | | CAGR | Compound Annual Growth Rate | | CB | Central Bank | | CF | Contingency Fund | | CGRA | Currency and Gold Revaluation Account | | CL | Confidence Level | | CPI | Consumer Price Index | | CRA | Credit Rating Agency | | CRB | Contingent Risk Buffer | | CRR | Cash Reserve Ratio | | DBRS | Dominion Bond Rating Service | | DEIO | Department of External Investments & Operations | | DICGC | Deposit Insurance and Credit Guarantee Corporation | | EC | Economic Capital | | ECB | European Central Bank | | ECF | Economic Capital Framework | | EFR | Exchange Fluctuation Reserve | | ELA | Emergency Liquidity Assistance | | EMDE | Emerging Market and Developing Economy | | EWMA | Exponentially Weighted Moving Average | | ERM | Enterprise Risk Management | | ES | Expected Shortfall | | ES(N) | Expected Shortfall(Normal) | | ESCB | European System of Central Banks | | FCA | Foreign Currency Assets | | FCVA | Foreign Exchange Forward Contracts Valuation Account | | FEMA | Foreign Exchange Management Act | | FER | Foreign Exchange Reserves | | FIT | Flexible Inflation Targeting | | FRB | Federal Reserve Bank | | FRBM Act | Fiscal Responsibility and Budget Management Act | | FRBNY | Federal Reserve Bank of New York | | FRS | Federal Reserve System | | GDP | Gross Domestic Product | | GFC | Global Financial Crisis | | GoI | Government of India | | GRA | Gold Revaluation Account | | G-sec | Government of India securities | | HHI | Hirschman-Herfindahl Index | | HMT | Her Majesty’s Treasury | | HQLA | High Quality Liquid Assets | | IBC | Insolvency and Bankruptcy Code | | IFRS | International Financial Reporting Standards | | IIFCL | India Infrastructure Finance Company Limited | | IIP | International Investment Position | | IMF | International Monetary Fund | | IRA-RS | Investment Revaluation Account-Rupee Securities | | IRA-FS | Investment Revaluation Account-Foreign Securities | | LAF | Liquidity Adjustment Facility | | LCR | Liquidity Coverage Ratio | | LGD | Loss Given Default | | LIBOR | London Inter-bank Offer Rate | | LoBoM | Lower of Book or Market | | LoLR | Lender of Last Resort | | MAS | Monetary Authority of Singapore | | MMLR | Market Maker of Last Resort | | MSS | Market Stabilisation Scheme | | MTM | Marked to Market | | NABARD | National Bank for Agriculture and Rural Development | | NBFC | Non Banking Financial Company | | NCB | National Central Banks | | NDA | Net Domestic Assets | | NDTL | Net Demand and Time Liabilities | | NFA | Net Foreign Assets | | NHB | National Housing Bank | | NPA | Non-Performing Assets | | NRI | Non-Resident Indian | | OMO | Open Market Operations | | Op risk | Operational Risk | | P&L | Profit and Loss | | PFCVA | Provision for Forward Contracts Valuation Account | | PPPP | Principle of Public Policy Predominance | | PSB | Public Sector Banks | | QE | Quantitative Easing | | RBA | Reserve Bank of Australia | | RBI | Reserve Bank of India | | RBNZ | Reserve Bank of New Zealand | | RBRF | Reserve Bank Reserve Fund | | RTL | Risk Tolerance Limit | | RTM | Risk Transfer Mechanism | | S&P | Standard & Poor’s | | SARB | South African Reserve Bank | | SDF | Standing Deposit Facility | | SDR | Special Drawing Rights | | SIDBI | Small Industries Development Bank of India | | SLR | Statutory Liquidity Ratio | | SNB | Swiss National Bank | | SPV | Special Purpose Vehicle | | SSDP | Staggered Surplus Distribution Policy | | S-VaR | Stressed Value at Risk | | TALF | Term Asset-Backed Securities Loan Facility | | TER | Total Equity Required | | ToR | Terms of Reference | | UCB | Primary (Urban) Co-operative Bank | | UIP | Uncovered Interest-rate Parity | | US Fed | US Federal Reserve | | VaR | Value at Risk | Select Definitions in context of the RBI’s ECF: | Economic capital / Risk buffers | The RBI’s risk equity comprising of its Capital, Reserve Fund, risk provisions [Contingency Fund (CF) and Asset Development Fund (ADF)], and revaluation balances (CGRA, IRA-RS, IRA-FS and FCVA). | | Risk provisions/ Realized risk provisions/ Retained earnings | Provisions made towards CF and ADF under Section 47 of the RBI Act. | | Realized equity/ Available realized equity (ARE) | The component of RBI’s economic capital comprising its Capital, Reserve Fund and risk provisions (CF and ADF) | | Requirement for realized equity (RRE) | The Contingent Risk Buffer plus any shortfall in revaluation balances vis-à-vis their target requirement. | | Contingent Risk Buffer (CRB) | Component of RBI’s economic capital required to cover its monetary and financial stability, credit and operational risks. | | Revaluation balances | The unrealized gains, net of losses resulting from exchange rate, gold price and interest rate movements, on account of periodic marking to market of RBI’s foreign currency assets, gold, foreign dated securities and rupee securities | | Capital | Paid-up capital in accordance with section 4 of the RBI Act, 1934 (Notes to Accounts [XII.5.1(i)] in RBI’s Annual Report 2017-18) | | Reserve Fund | Reserve Fund of ₹ 5 crore provided for in terms of Section 46 of the RBI Act which was supplemented with the valuation gains which accrued on account of an amendment to Section 33 (4) of the RBI Act in 1990-91 (Notes to Accounts [XII.5.1(ii)] in RBI’s Annual Report 2017-18) | | Contingency Fund | Provisions for meeting unexpected and unforeseen contingencies, including depreciation in the value of securities, risks arising out of monetary/ exchange rate policy operations, systemic risks and any risk arising on account of the special responsibilities enjoined upon the RBI (Notes to Accounts [XII.5.1(v)(a)] in RBI’s Annual Report 2017-18) | | Asset Development Fund | Provisions for investments in subsidiaries and associated institutions and to meet internal capital expenditure (Notes to Accounts [XII.5.1(v)(b)] in RBI’s Annual Report 2017-18) | | CGRA | Unrealized gains/losses on Foreign Currency Assets and gold due to movement in exchange rate and prices of gold (Notes to Accounts [XII.5.1(v)(c)] in RBI’s Annual Report 2017-18) | | IRA- Foreign Securities | Unrealized gains/losses on foreign dated securities on periodic revaluation (Notes to Accounts [XII.5.1(v)(d)] in RBI’s Annual Report 2017-18) | | IRA- Rupee Securities | Unrealized gains/ losses on rupee securities on periodic revaluation (Notes to Accounts [XII.5.1(v)(e)] in RBI’s Annual Report 2017-18) | | FCVA | Unrealized gains/ losses on outstanding forward contracts (Notes to Accounts [XII.5.1(v)(f)] in RBI’s Annual Report 2017-18) | | Net income | Gross income net of expenditure, prior to risk provisioning. |
|