Letter of Transmittal September 06, 2019 Shri Shaktikanta Das
Governor
Reserve Bank of India
Central Office
Mumbai 400 001 Dear Sir, Report of the Internal Working Group to Review Agricultural Credit We are pleased to submit the Report of the Internal Working Group to Review Agricultural Credit. We hope that the recommendations will be useful in improving the credit flow to agriculture sector. Yours sincerely, Sd/-
(Mahesh Kumar Jain)
Chairman | | | | | | | Sd/-
(Ashok Gulati)
Member | Sd/-
(Surekha Marandi)
Member | Sd/-
(R. Amalorpavanathan)
Member | | | | | Sd/-
(Rajiv Ranjan)
Member | | Sd/-
(J.P. Sharma)
Member | | | Sd/-
(Sonali Sen Gupta)
Convener |
ACKNOWLEDGEMENTS The Report of the Internal Working Group to Review Agricultural Credit was made possible with the support of individuals and organizations. The Internal Working Group (IWG) would like to gratefully acknowledge Dr. K.L. Prasad, Economics Statistics Advisor, Ministry of Agriculture, GoI; Shri. Adikesavan. S, CGM, State Bank of India; Shri Amresh Ranjan, General Manager, RBI; Dr. Nirupam Mehrotra, General Manager, NABARD; Dr. Purvi Mehta, South Asia Head, Bill and Melinda Gates Foundation; Shri Jatin Singh, MD, SKYMET and Shri Sudhakar Manda, Head of Remote Sensing, SKYMET for their valuable inputs and suggestions. In order to have an international perspective on agricultural issues, the team consisting of officials from RBI and NABARD visited China and held meetings with Mr. Hu Beihai, CEO, Bank of China and senior executives and officials of Agriculture Development Bank of China (ADBC), State Agriculture Credit Guarantee Co. Ltd. and Bank of China Fullerton Community. The working group would like to acknowledge the support provided by Bank of China (India Operations) officials Shri A.G. Ray, Chief Compliance Officer; Mr. Qian Wei, Chief Risk Officer; Mr. Xu Min, Chief Technology Officer; Mr. Ling Sheng, VP, for coordinating and organizing the meetings scheduled at China. The Working Group would like to thank all Regional offices of the Reserve Bank of India for the studies conducted and inputs provided within due timelines. The IWG also acknowledges the valuable support provided by Ms. Ritika Juneja, Consultant, ICRIER. The Working Group would like to commend Shri Ashish Jaiswal, Deputy General Manager and Shri Yogendra Kumar, Manager, both from Financial Inclusion and Development Department (FIDD) for their efforts towards data analysis and inputs. The Working Group also acknowledges the research work and analytical inputs of Shri Rahul Agarwal and Smt. D. Suganthi, Managers from research team of Department of Economic and Policy Research (DEPR). Further, inputs received from Shri. Prasanna Rao, MD and his team from Arya Collateral Warehousing Services Pvt. Ltd and Shri Amit Salunkhe from Cropin Technologies were also useful for the report. The IWG was ably supported by the Secretariat team from FIDD led by Smt. Nengneikim Guite, General Manager and assisted by Smt. Vandana Maheshwari, Deputy General Manager, Smt. M.P. Kotwal, Assistant General Manager, Shri Madhav Joshi, Dr. V. Pradeep Chandra and Shri Ashish Ambade, Managers.
PREFACE Agriculture is a key sector of Indian economy in view of its contribution to employment and GDP. Agricultural credit plays a vital role in farm sector development and facilitates adoption of new technologies. However, any amount of credit even at the most reasonable rates cannot guarantee higher productivity or adequate income among the farmers, as the success depends upon many other supporting factors including the availability of agricultural inputs, services and remunerative markets for the products. The agricultural credit policies designed and implemented in India are mainly supply driven through targeted ground level credit, interest subvention scheme and directed lending by way of regulatory prescription under Priority Sector Lending guidelines. These policies along with other policy interventions at the level of Government and RBI have yielded commendable results in the field of agricultural credit. However, agricultural sector still faces challenges such as lack of capital formation, regional disparity, dependence of farmers especially small and marginal farmers, tenant farmers, landless labourers and share croppers on non-institutional sources of credit at significantly higher rates, non-realization of the fair price for agricultural produce causing farmers’ distress and farm loan waivers impacting credit culture and weakening state finances. The Internal Working Group in this report has highlighted the findings supported by data and research and recommended suitable measures to address the issues being faced by farmers in accessing agricultural credit. I hope that this report will help in addressing the gaps in credit delivery to agriculture sector. M.K.Jain
Chairman
INTRODUCTION The agriculture sector is an important component of the Indian economy as it provides livelihood to a large section of the population. According to Census 2011, out of the total workers of 481.7 million, there are 118.7 million cultivators and 144.3 million agricultural labourers, which means approximately 55 per cent of the total workers were employed in agriculture and allied sector. However, the percentage share of workers engaged in agriculture sector has been declining. As per Labour Bureau Report 2015-16, 46.1 per cent of the working population was employed in agriculture and allied sector. Further, as per an ILO estimate1 employment in agriculture sector as percentage of the total employment was approximately 44 per cent in the year 2018. 2. As per Agriculture Census 2015-16, the total number of operational holdings in the country was 146 million and total operated area was 157.14 million hectares in 2015-16. The small and marginal holdings taken together (0.00-2.00 ha) constituted 86.21 per cent, while their share in the operated area stood at 47.34 per cent in 2015-16. The average size of land holding in 2015-16 was 1.08 hectare. 3. Agriculture plays a significant role in the development of the Indian economy. However, the contribution of agriculture to GDP has gone down from 52 per cent in the 1950s to 30 per cent in the1990s and further below 20 per cent from 2010 onwards2. In 2018-19, the share of Agriculture & Allied GVA in overall GVA at 2011-12 prices was 14.4 per cent3 and at current prices was 16.14 per cent4. 4. Indian agriculture and allied sector broadly covers four activities, viz., crop, livestock, forestry and fisheries. To stimulate the productivity of these activities, Government of India (GoI) has, from time to time, given policy thrusts which led to the various agricultural revolutions, viz., green revolution in cereal production (late 1960s-early 1980s) which was succeeded by the white revolution in milk production (starting in the 1970s), the gene revolution in cotton production, (in early 2000) and the blue revolution which focused on increasing fisheries production and productivity (1973-2002). As a result, the agriculture sector has not only become self-sufficient but has emerged as the net exporter of several agricultural commodities like rice, marine products, cotton etc. 5. Such a phenomenal achievement would not have been possible without the agricultural credit related policy interventions by GoI and RBI. Realising the importance of institutional credit in fostering the growth and development of the agriculture sector, the All India Rural Credit Survey Committee (AIRCSC, 1951-54) had laid the foundation of the institutional framework to establish a sound credit delivery system for financing agriculture and allied activities. Till the end of the 1960s cooperative structure had assumed the responsibility of providing production credit to the farmers. With the objective of imposing social control, commercial banks were nationalised in 1969 and 1980. Further, in 1976, RRBs were set up as alternative agencies to provide rural credit. These developments brought in a sea change in the flow of institutional credit to the farm sector. As a consequence, the farmers’ credit requirements were increasingly met by the formal institutional sources. Gradually the country moved towards a multi-agency approach to meet the credit needs of the farmers. 6. The National Credit Council, in its meeting held in July 1968, emphasised that commercial banks should increase their involvement in the financing of priority sectors, viz., agriculture and small-scale industries. The description of the priority sectors was later formalised in 1972 based on the report submitted by the Informal Study Group on Statistics relating to advances to the Priority Sectors constituted by the Reserve Bank in May 1971. Over the years the scope of priority sector lending has evolved to give greater focus to those segments of the population that have traditionally been neglected from accessing credit, thus making it a tool to address the problem of financial exclusion. The evolution of Priority Sector Lending Guidelines in agriculture is given in Annex 1. 7. The impact of the institutional framework put in place has largely leveraged the formal credit to the agriculture sector. From ₹37.71 billion in 19815 (approximately 16 per cent of the agricultural GDP in 1980-81), the SCBs’ outstanding advances to agriculture and allied activities have grown significantly to ₹13694.56 billion in 2017-18 which formed approximately 16 per cent of total bank credit, i.e. ₹86254.25 billion and approximately 51 per cent of Agriculture & Allied GVA at current prices. 8. Despite the impressive growth in the formal agricultural credit, there are several issues and challenges which are enumerated below: i. Credit Reach – As per the NAFIS Report 2016-17, the average loan taken by agricultural households indicated that 72 per cent of the credit requirement was met through institutional sources and 28 per cent from non-institutional sources. Further, in the absence of a proper legal framework and lack of records relating to their agricultural activity, tenant farmers/ share croppers/ oral lessees/ landless labourers face difficulty in accessing institutional credit. As per PSA Annual return (2015-16), only 41 per cent of small and marginal farmers could be covered by public and private sector banks. Besides these problems and challenges of accessibility in credit, the share of credit to allied activities i.e., livestock, forestry and fisheries was sub-optimal compared to its contribution to agricultural output. ii. Regional Disparity in Agricultural Credit – Some of the states are getting much higher share, as high as 10 per cent of total agricultural credit compared to other states getting as low as 0.5 per cent. Also, in some states, viz., Bihar, Chhattisgarh, Jharkhand, West Bengal, etc., bank credit was not proportionate to their share in agricultural output. iii. Loan Waiver - Loan waivers announced by state governments have affected the credit culture in the country with many borrowers withholding repayment, in anticipation of a loan waiver. This adversely affected the credit history of borrowers and their future prospects of availing fresh loan for agricultural purposes. This led to further deterioration of credit culture as evident from the high level of Gross NPA of 8.44 per cent as on March 31, 2019 in the agriculture sector. 9. To look into these issues, the Reserve Bank of India vide its Sixth Bi-Monthly Monetary Policy Committee (MPC) meeting held during February 05-07, 2019 announced the setting up of an ‘Internal Working Group to Review Agricultural Credit’ to understand the reasons for regional disparity and other agricultural credit related aspects and suggest workable solutions to address the constraints in accessing institutional agricultural credit. 10. In the first meeting of the Internal Working Group it was decided that the scope of the review should cover the following: i. Credit reach: institutional credit, measures and factors/drivers that influence reach ii. Cost effective and inclusive system: ease of credit and inclusiveness iii. Credit discipline: impact of loan waivers on state finances and agricultural credit 11. The report consists of five chapters: Chapter 1 discusses the reach of formal agricultural credit, Chapter 2 explains the policy measures for improving inclusiveness in the agriculture sector, Chapter 3 analyses the impact of farm loan waivers on state finances and agricultural credit, Chapter 4 provides a brief on the learnings during the interaction with four financial institutions in China and Chapter 5 summarises the recommendations of the IWG.
1 CREDIT REACH Enabling policy environment and evolution of Indian banks led to the outreach of formal agricultural credit to the last mile to a great extent. An analytical presentation of the distribution of agricultural credit across states, however, highlights regional disparity, skewedness towards crop loan and inadequate credit allocation to allied activities. 1.1 Evolution of Agricultural Finance in India and Policy Milestones The institutional framework of agricultural finance was shaped by the overarching demands of the nation. The evolution of agricultural credit policies and milestones can be broadly categorised into three distinctive phases. 1.1.1 Phase 1 (1951 – 1969) -
The Government of India initiated the first five-year plan in 1951 with the thrust on developing the primary sector. The National Credit Council in a meeting held in July 1968 emphasised that commercial banks should increase their involvement in the financing of priority sectors, viz., agriculture and small-scale industries, sectors deemed as ‘national priority’. -
In 1969, when the first phase of nationalisation of banks took place, there were 6955 public sector bank branches and the average population per branch office was 64,000. To boost rural development, the Reserve Bank of India had then prescribed 1:3 ratio for opening of branches in urban and rural/semi-urban centres. 1.1.2 Phase 2 (1970-1990) -
The channel for institutional credit to agriculture during the first two decades of independence was the cooperative sector. With the nationalisation of commercial banks in 1969, the decade of 1970s marked the entry of commercial banks into agricultural credit. This period saw the introduction of the Lead Bank Scheme and regulatory prescription of Priority Sector Lending – two landmark development policies that have not only survived till date but have also served as the fuel for channelling agricultural credit and rural development. -
The Regional Rural Bank Act, 1976 was enacted to provide sufficient banking and credit facility for agriculture and other rural sectors. -
The National Bank for Agriculture and Rural Development (NABARD) came into existence in 1982, with the enactment of NABARD Act 1981, to promote agriculture and rural development. -
NABARD, in 1992 introduced the Self-Help Group (SHG) model to further financial inclusion of the excluded segments. -
In 1989, the Reserve Bank introduced the service area approach (SAA) and Annual Credit Plan (ACP) system as tools for reaching out to the rural areas. 1.1.3 Phase 3 (1991 onwards) i. The economic reforms of the 1990s, started with the implementation of the first Narasimham Committee Report of 1991, emphasising financial soundness and operational efficiency of the financial sector – including that of rural financial institutions. The Reserve Bank of India gradually deregulated the interest rate regime to aid improvement in the operational efficiency of banks. ii. The first major nationwide farm loan waiver was announced in 1990 and the cost to the national exchequer was around ₹100 billion. iii. Pursuant to the 1995 Union Budget announcement, GoI established the Rural Infrastructure Development Fund (RIDF) with NABARD. RIDF was mainly meant for funding of rural infrastructure projects which in turn were supposed to deepen the credit absorption capacity in a state by giving loans to state governments and state-owned corporations. Scheduled commercial banks contribute to the corpus of the fund to the extent of their shortfall in achieving the priority sector lending target. iv. During 1992-93, NABARD started the pilot project on SHG-Bank Linkage programme - a partnership model involving SHGs, banks and NGOs. In the initial years, the scheme progressed slowly but picked up gradually. v. The Kisan Credit Card (KCC) was introduced as a financial product in 1998 to provide hassle free credit to farmers. vi. The Union Government introduced the Ground Level Credit (GLC) policy in year 2003-04. Under this policy, GoI announces GLC targets for agriculture and allied sector in the Union budget every year which banks are required to achieve during the financial year. These targets are set region-wise, agency-wise (SCBs, RRBs & Cooperative banks) and loan category wise (crop and term loan). vii. Another policy initiative, introduced in 2004–2005, was to double the volume of credit to agriculture over a period of three years and expand the reach of formal finance. viii. The year 2006 saw a host of developments. Pursuant to the budget announcement for 2006-07, the Union Government introduced the interest subvention scheme (ISS) for short term crop loans to enable farmers to avail farm credit at reduced interest rates. The Business Correspondents (BCs) and Business Facilitators (BFs) were rolled out for the first time by the Reserve Bank of India to further the cause of financial inclusion. NABARD introduced the Joint Liability Group (JLG) model, an extension of the earlier SHG model for reaching out to tenant farmers and share-croppers with access to credit. ix. Agricultural Debt Waiver and Debt Relief Scheme (ADWDRS), 2008 announced by the Union Government involved waiving institutional debt for small farmers and a one-time settlement opportunity with 25 per cent rebate to other farmers. This massive write-off of agricultural loans involving ₹525.166 billion was envisaged to provide relief to the persistent problem of farmers’ indebtedness and alleviate the financial pressure faced by the farmers. x. In 2009-10, the Government introduced the prompt repayment incentive (PRI) of 3 per cent under the ISS to bring down the effective rate of interest to 4 per cent to those farmers who repaid their loans on or before the due date to inculcate repayment habits. xi. In July 2012, the Priority Sector Lending (PSL) guidelines were revised by the Reserve Bank to widen the eligible activities. Again in April 20157, the guidelines were revamped based on the recommendations of the Internal Working Group (IWG). The salient features of the revamped PSL guidelines relating to agricultural sector are: -
The distinction between direct and indirect agricultural credit was dispensed with. -
A sub-target of 8 per cent of ANBC or Credit Equivalent Amount of Off-Balance Sheet Exposure, whichever is higher, was prescribed for small and marginal farmers. -
Focus shifted from ‘credit in agriculture’ to ‘credit for agriculture’. 1.2 Trend in Agricultural Credit 1.2.1 In order to understand the impact of policy milestones discussed above on agricultural credit and its performance with respect to agricultural GDP, the ratio of agricultural credit to agricultural GDP was computed taking into account the agricultural credit outstanding as well as disbursement. Accordingly, two line graphs are plotted in the following chart. 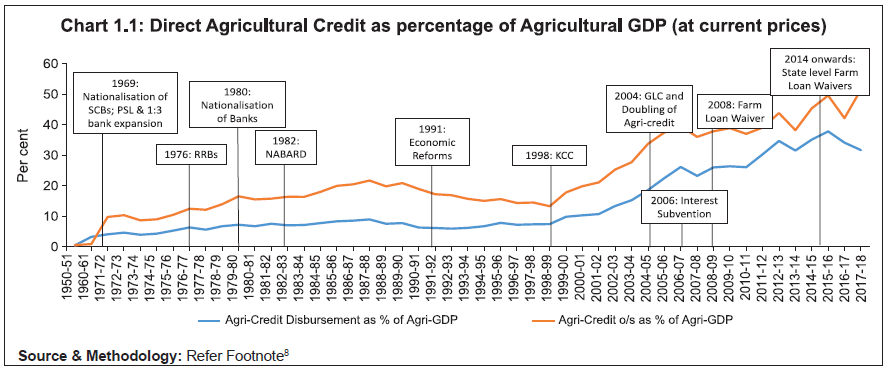 1.2.2 The ratio of Agri-Credit outstanding to Agri-GDP jumped from 0.6 per cent in 1950-51 to 9.81 per cent in 1971-72. Post 1972, the ratio shows an upward trend upto 1987- 88 increasing to 21.76 per cent. The impressive achievement of agricultural credit against agricultural GDP during 1950s-1980s is on account of nationalisation of banks and introduction of RRBs which expanded the reach of formal credit in the country. However, the reverse trend in the ratio started from 1990-91 onwards and it fell to 13.34 per cent in 1998-99. Post 1999 the ratio increased steeply and reached upto 39.55 per cent in 2006-07, which indicates that introduction of KCC was a big booster for agricultural credit and brought about a sea change in improving the reach of credit to the farming community. Many of the other policy initiatives started in 2004-05 also played an important role. In later years, despite a fluctuating trend, it rose to 49.63 per cent in 2015-16 and 51.56 per cent in 2017-18. The chart reveals that the trend of both the agri-credit outstanding as well as disbursement as percentage of agri-GDP are largely similar except in certain periods where there is divergence between the two. The reasons could be announcement of loan waivers which negatively impacted the repayment behavior of the borrowers and also made the banks averse to fresh lending. 1.2.3 Despite this spectacular achievement, the dependence of agricultural households on non-institutional sources, though reduced to certain extent, has persisted over the years. 1.3 Institutional vis-à-vis Non-Institutional Agricultural Credit 1.3.1 In the 1950s, the rural agrarian credit needs were traditionally met from the non-institutional sources largely through the local money-lenders. While the rural farmers had easy access to finance for their immediate needs, the steep interest rates, coupled with high illiteracy levels and the subsequent lack of awareness put them into a spiralling debt trap leaving them at the mercy of the money-lender. The evolution of the institutional structure through various Government policy interventions changed the scenario, whereby institutional sources, primarily through commercial banks became the major source for rural credit. The share of institutional credit vis-à-vis non-institutional credit as per AIDIS 2013 is shown in the chart below. Position for 2015 has been plotted based on NAFIS 2016-17.  1.3.2 According to AIDIS report, non-institutional sources were dominant in 1951, accounting for 90 per cent of the outstanding debt of cultivator households, but their share declined sharply to 37 per cent in 1981. After 1981, the rate of decline slowed down, and the share of non-institutional sources was 35 per cent in 1991. Thereafter a reversal of this pattern resulted in higher share of 39 per cent in 2002 which again dropped to 36 per cent in 2013. As per NAFIS Report 2016-17, the share of non-institutional credit in 2015 was 28 per cent. As against this, the share of institutional credit in agriculture increased from 10.2 per cent in 1951 to 63 per cent in 1981 and thereafter the share of institutional credit was hovering in the range of 63-65 per cent during 1981 to 2013. As per NAFIS, in 2015 the share of institutional credit was approximately 72 per cent. 1.3.3 Further, NAFIS Report 2016-17 has revealed that agricultural households avail credit from sources other than banks such as NBFC/MFI, financial companies, financial corporations, provident fund, insurance, relatives, friends, moneylenders, landlords, etc. The chart below shows the distribution of agricultural households according to type of sources of loans.9 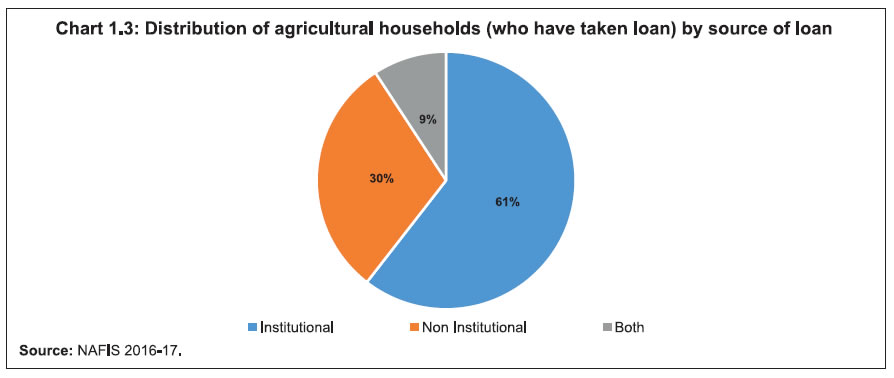 1.3.4 According to NAFIS, institutional sources were preferred by agricultural households to avail credit as approximately 61 per cent of them avail credit from them. However, a significant portion, i.e. approximately 30 per cent of agricultural households still avail credit from non-institutional sources only which is a cause of concern. There is a need to ascertain the reasons why 30 per cent are still left out from getting institutional credit. The probable reasons could be that their credit demand could be for consumption purposes or they could be tenant farmers, sharecroppers and landless labourers who are not able to offer collateral security to avail institutional credit, or they are involved in unviable subsistence agriculture or banks don’t find them credit worthy. As a result, these farmers find it convenient to borrow money from non-institutional sources due to easy accessibility. 1.4 Measures to Improve the Reach of Institutional Credit 1.4.1 In order to bring the excluded agricultural households into the fold of institutional credit in a structured and sustainable manner, there is a need to build an enabling ecosystem with respect to policy interventions, institutional innovations and digital technologies. The enabling ecosystem would include digitisation of land records, reforming of land leasing framework, creating a national level agency to build consensus among states and the Centre with regard to agriculture-related policy reforms and innovative digital solutions to bridge the information gap between the banks and farmers. i. Digitisation of Land Records a. GoI started the Computerisation of Land Records Scheme to digitise all land records in 1988-89. Thereafter, in August 2008, the Digital India Land Record Modernisation Programme (DILRMP) was launched by Government of India, with the aim to minimise scope of land or property disputes and enhance transparency in the land records. b. The status of CLR, in terms of percentage completion, across states is shown in Table 1.1: | Table 1.1: Status of CLR for states and Union Territories | | CLR more than or equal to 90% | Andaman & Nicobar, Andhra Pradesh, Chhattisgarh, Dadra & Nagar Haveli, Gujarat, Haryana, Himachal Pradesh, Jharkhand, Karnataka, Lakshadweep, Madhya Pradesh, Maharashtra, NCT of Delhi, Odisha, Puducherry, Punjab, Rajasthan, Sikkim, Tamil Nadu, Telangana, Tripura, Uttar Pradesh and West Bengal | | CLR from 50% upto 90% | Assam, Bihar, Daman & Diu, Goa, Uttarakhand | | CLR less than 50% | Arunachal Pradesh, Chandigarh, Jammu and Kashmir, Kerala, Manipur, Meghalaya, Mizoram, Nagaland | | Source: Department of Land Resources, MoRD. | c. Digitisation of land records has the potential to address various issues relating to agricultural credit, provided banks are given access to view land records online and/or they are given the facility to create charge online over land. This will help in reducing the instances of double or multiple financing on the same piece of land. ii. Land Leasing Framework a. Most states ban or restrict leasing of agricultural land leading to informal or concealed tenancy. As per T. Haque Committee (NSSO 2012-13), the tenancy in the country is around 10 per cent. As these tenant farmers lack documentary evidence as well as suffer from fear of eviction, they do not have the incentive to invest in agricultural land, leading to low productivity. Hence, there is a need to reform the land leasing framework by state governments by adopting policies like the Model Land Leasing Act proposed by NITI Aayog and Andhra Pradesh Land Licensed Cultivators Act, 2011. b. The Model Land Leasing Act recommends that all lease agreements be made formal and farmers cultivating on leased lands be given access to benefits including farm credit. The unified state of Andhra Pradesh was the pioneer to undertake reforms for tenant farmers in the form of Land Licensed Cultivators’ Act, 2011 under which Loan Eligibility Cards (LECs) are being issued to tenant farmers, making it possible for them to approach banks for credit. The Certificates of Cultivations (CoC) are issued under executive direction. iii. Federal Institution in Agriculture The Union Government in the past has suggested several reforms in the field of agriculture through the Model Agricultural Land Leasing Act, Model Agricultural Produce and Livestock Marketing Act, removing agricultural commodities from Essential Commodities Act, Digitisation of Land Records and e-NAM etc. However, the implementation of such reforms has not been very encouraging as many a times state governments might not be taken on board during the consultation or implementation process to take their concerns into consideration. In order to consult states and build consensus among them over reforms related to agriculture there is need for a federal institution, established on the principle of cooperative federalism, having representation from both Central Government as well as state governments. Such an institution exists in the form of the GST council which has been a success story. iv. Digital Innovations in Agriculture Sector The emergence of farm technologies integrated with robust ICT framework and other farm-related innovations hold tremendous potential to positively impact the growth in the agriculture sector. The technological innovations leverage tools like Internet of Things, Cloud, Big Data, etc. Some of the major developments are discussed below: a. e-NAM - a technology-driven unified national level market platform that integrates the physically dispersed markets enabling better price discovery for the farm produce b. Digital technologies such as Remote Sensing and Geo-tagging which helps in crop identification, crop production forecasting, crop acreage and yield estimation, assessment of crop progress and crop damage, soil health, soil mapping, water resource mapping and climate change monitoring c. Weather forecasting companies giving real time weather updates d. Under the Digital India Initiative the GoI provides mandi prices on real time basis through its ‘Gramseva: Kisan’ app. e. Corporates through mobile-based apps are providing farm machinery to farmers on rental basis which saves farmers from long-term investments. f. Movable warehouses and cold storages that help farmers to store their produce in a cost-effective manner g. State-of-the-art solar powered products for irrigation which will make farmers less dependent on electricity h. A few banks have launched mobile-based applications to cater to the specific needs of farmers and create an ecosystem for them through which they can purchase products, get weather updates and soil information and apply for loans. 1.4.2 Recommendation In view of the above, the IWG recommends the following: i. GoI should push state governments to complete the digitisation process and updation of land records in a time bound manner. ii. State governments should give access to banks to digitised land records in order to verify land title and create charge online. In such states banks should not insist on submission of land title documents. iii. State governments having a highly restrictive legal framework should be encouraged to reform their legal framework on the basis of Model Land Leasing Act proposed by NITI Aayog/ Land Licensed Cultivators’ Act, 2011 of the state of Andhra Pradesh so that formal lending to tenant farmers can improve. iv. GoI should set up a federal institution, on the lines of GST Council, having participation from both the Centre as well as the states to suggest and implement reforms in the field of agriculture. v. Aggressive efforts are needed to improve institutional credit delivery through technology driven solutions to reduce the extent of financial exclusion of agricultural households. Banks should explore collaborations with agri-tech companies/start-ups so as to provide access to credit in an integrated, timely and efficient manner to the farmers. vi. IBA should come out with a technology driven portal for the banks to facilitate ease of credit to the farmers for agriculture and allied activities on the lines of PSBLoansIn59 minutes to MSMEs. vii. Innovations like movable warehouses/cold storages and mobile based apps providing farm machineries on rental basis have been successfully operating but on a small scale. Hence, the GoI should identify the successful models in these areas which can be scaled up across the country. Further, banks should be encouraged to provide credit to such innovative solutions which support the agriculture sector. 1.5 Institutional Agricultural Credit - Agency-wise Share 1.5.1 In order to understand the performance of different agencies in lending to agriculture sector, a comparative analysis has been done showing their share in total agricultural and allied credit outstanding as on March 31, 2017. 1.5.2 Scheduled commercial banks contributed the major share (78 – 80 per cent) in agricultural and allied credit. Co-operative institutions also play a significant role in extending agricultural credit and the share of all co-operative banks/institutions (i.e. StCBs, DCCBs and PACS put together) constituted 15-16 per cent. The RRBs contributed the remaining 5 per cent of the agricultural credit. 1.5.3 The co-operative banking sector thrives either as three-tier or two-tier structure. The three-tier structure includes StCB, DCCB and PACS, whereas in two-tier structure only StCB and PACS are present. In the three-tier structure, the lower level tiers, i.e. DCCB and PACS extend credit to individual borrowers using their own funds/deposits and claim refinance from the upper tier, i.e. PACS from DCCB/StCB and DCCB from StCB. In the two-tier structure, PACS provide credit to individual borrowers and claim refinance from StCB. In some cases, the StCBs also extend credit to the individuals through its branches across the state. 1.5.4 The state-wise10 share of SCBs, RRBs and cooperatives in agricultural credit outstanding as on March 31, 2017 is shown in Chart 1.5: 1.5.5 The SCBs are the leading institutions in providing agricultural credit in all the states. The RRBs have significant presence in some states, viz., Bihar (35 per cent), Telangana (15 per cent), Himachal Pradesh (10 per cent) and Uttar Pradesh (10 per cent). Cooperatives have played a significant role in Odisha (46 per cent), Goa (34 per cent), Maharashtra (31 per cent), Chhattisgarh (27 per cent), Madhya Pradesh (27 per cent), Gujarat (22 per cent) and Haryana (20 per cent) in providing agricultural credit. The high share of cooperative banks and RRBs in agricultural credit in these states is on account of their significant presence as compared to commercial bank branches in rural areas. 1.5.6 One distinct development in the expansion of rural credit institutions was the advent of NBFC-MFIs (Non-Banking Finance Company - Micro Finance Institutions) and Small Finance Banks. i. Micro Finance Institutions (MFIs) a. MFIs have evolved as a significant segment for the rural credit market exhibiting a variety of business models in recent years. Post unified Andhra Pradesh crisis in 2010, the Reserve Bank of India issued guidelines for the lending operations of MFIs based on the Malegam Committee recommendations. A new category of NBFC–MFIs was introduced subject to satisfying conditions, viz., the capital to be employed, lending to members, cap on interest rate to be charged and margin to be retained, etc. As the loan extended to the MFIs by banks qualify for priority sector lending, subject to fulfillment of conditions, other MFIs also strove to follow these guidelines. The regulatory guidelines on NBFC-MFIs and inclusion of loans to MFIs by banks under priority sector lending guidelines resulted in phenomenal growth of MFIs during the period 2013 -2019. An analysis in terms of number of clients’ outreach and gross loan portfolio is shown here: 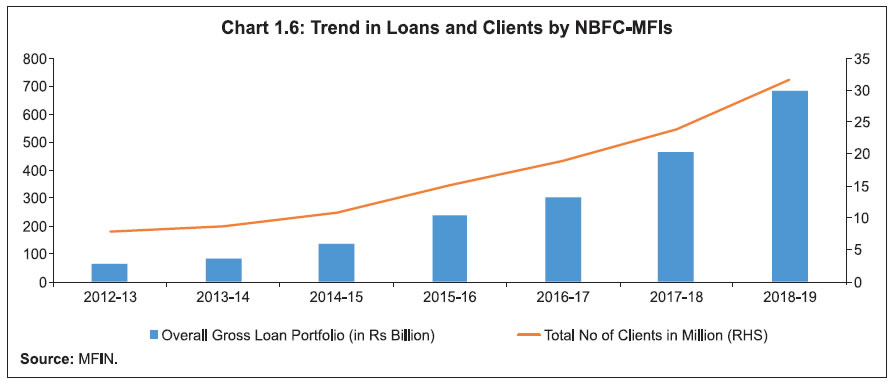 b. In 2015, the RBI regulations stipulated that a minimum of 50 per cent of the MFI loans are to be deployed for income generating activities. As per Bharat Microfinance Report (2017), agriculture, animal husbandry and trading are major sub-sectors where income generating loans are deployed. Non-income generating loans are used for consumption, housing, education, water and sanitation and health etc. The trend showing the flow of credit for agriculture and non-agriculture purposes by NBFC-MFIs is as given here: 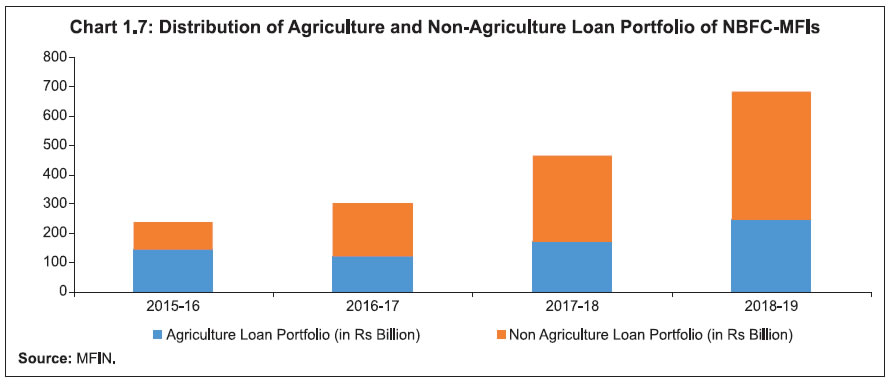 c. Keeping in view the objective of financial inclusion, PSL guidelines on bank lending to MFIs for their on-lending activities, inter alia, prescribed cap on interest rate and margin. These guidelines have been revised from time to time. The extant guidelines stipulate that interest rate on individual loans will be the average base rate of five largest commercial banks by assets, multiplied by 2.75 per annum or cost of funds plus margin cap11, whichever is less. As per information provided by MFIN, the interest rate12 charged by MFIs was in the range of 19 per cent -24 percent during 2018-19. It appears to be on the higher side as compared to interest rates being charged by banks. This may be on account of higher funding and operational cost of MFIs. Due to the limited scope of study by IWG, deeper analysis into the funding/operational cost vis-à-vis interest rate charged was not attempted. ii. Small Finance Banks In September 2015, the Reserve Bank of India granted in-principle approval for setting up small finance banks (SFBs) with the objective of deepening financial inclusion by catering to clientele such as small and marginal farmers, migrant labourers, low income households, small businesses and other unorganised entities. As on date ten SFBs are functional. SFBs have been mandated to achieve overall 75 per cent of the lending towards PSL with the sub-target lending at par with SCBs. At the end of March 2019, amount outstanding under overall PSL by SFBs was ₹327 billion indicating achievement of 82 per cent. Lending towards agriculture and allied activities and small and marginal farmers was ₹101 billion and ₹78 billion respectively, which translate into achievement of 25 per cent and 20 per cent respectively, against the target of 18 per cent and 8 per cent. 1.6 Regional Disparity in Agricultural Credit 1.6.1 The IWG opined that disparity can be better brought out by analysing states individually instead of analysing region-wise. This is because in many cases, states within the same region are not very similar in various aspects relating to agricultural credit. Moreover, IWG suggested to combine all eight states (Arunachal Pradesh, Assam, Manipur, Meghalaya, Mizoram, Nagaland, Sikkim and Tripura) under NE States as they have a miniscule share in the country’s overall output as well as loans to agricultural and allied sector. Further, as most of the UTs are predominantly urban areas and do not have significant potential for agriculture and allied activities, it was decided to exclude UTs from the analysis related to regional disparity. 1.6.2 To analyse the disparity amongst the states, the ratio of state-wise total agricultural credit outstanding in relation to its agricultural GDP have been plotted in the following chart. 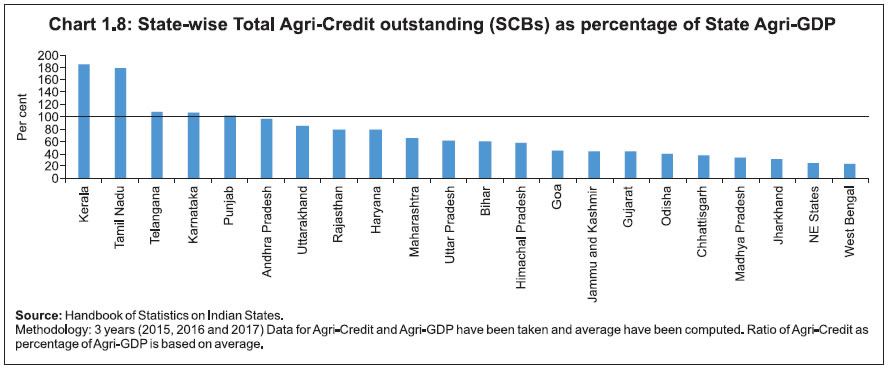 1.6.3 This chart shows that some of the states are getting agri-credit higher than their agri-GDP indicating the possibility of diversion of credit for non-agricultural purposes. It also highlights the problem of regional disparity as states falling under central, eastern and north eastern regions are getting very low agri-credit as percentage of their agri-GDP. One way to stimulate the demand for rural credit including agricultural credit is to deepen the credit absorption capacity in these states. RIDF is one such tool available which has the potential to create the necessary credit absorption capacity in the rural areas of these states. RIDF is maintained by NABARD and is mainly deployed for rural projects like irrigation, roads and social sector by way of loans to state governments and state-owned corporations. In this context the performance of RIDF is discussed in the following paragraph. 1.6.4 Commercial banks contribute to the corpus of RIDF and other funds administered by DFIs based on their respective PSL shortfall. The chart below shows that the allocation to RIDF has been declining over a period of time from 61 per cent in 2008-09 to 18 per cent in 2019-20. Considering its significance, there is a need to increase the share of RIDF allocation. 1.6.5 The region-wise analysis of RIDF shows that the combined share of central, eastern and north-eastern region was approximately 41 per cent in terms of sanction/disbursement under RIDF13. NABARD has been striving to increase the allocation to these regions and the same is reflected with 51 per cent of RIDF allocation in the ongoing tranches. Still there is scope to increase the RIDF allocation to states falling in these regions in view of their poor performance in terms of agri-credit to agri-GDP as discussed in Chart 1.8. 1.6.6 Recommendation The IWG recommends the following: i. PSL guidelines should be revisited in order to explore the feasibility of introducing suitable measures for improving the credit off-take in central, eastern and north eastern states. ii. NABARD should gradually increase the allocation of RIDF in central, eastern and north eastern states over a period of time. iii. Corpus of RIDF should be increased and state governments should be sensitised to allocate a larger portion of their borrowing from RIDF for the purpose of absorbing funds for rural infrastructure development in their state. 1.7 Deployment of Agricultural Credit – Activity-wise 1.7.1 Agricultural activities have been divided into two broad heads, viz., crop and allied. Allied activity covers livestock, forestry and fisheries. It is important to understand the flow of institutional credit under these two heads in relation to their corresponding output. Chart 1.10 shows the comparative position in terms of percentage share in credit and output for crop and allied activities from 2014-2016. The credit extended for both production and investment have been taken into account. 1.7.2 The chart above shows that the allied sector has contributed significantly to the agricultural output with a share of 38 - 42 per cent during 2014 - 2016, though has been neglected by banks with the corresponding share of 6 – 7 per cent in total agricultural and allied credit during the same period. The problem of inadequate flow of credit to the allied sector is more pronounced in the case of state-wise analysis discussed in Chart 1.14. 1.7.3 The above chart shows the skewed distribution of state-wise percentage share in overall crop loan as compared to the percentage share in overall crop output. States such as Tamil Nadu, Punjab and Kerala have a loan share much higher than their contribution to output. 1.7.4 Crop loan in relation to its value of output and input cost i. To get deeper insights into credit intensity amongst states, two ratios, viz., Crop Loan/Output and Crop Loan/Input have been derived. A state-wise comparison with regard to ratio of Crop Loan/Output is plotted in the following chart. ii. While the all-India average was 0.32, there were eleven states with higher loan/output ratio - Kerala being the highest at 0.90 and West Bengal being the lowest at 0.09. This ratio also shows that there is huge disparity amongst states though not depicting clear picture of the extent of disparity, because Rajasthan, Uttar Pradesh and Bihar are the three states with values of loan/output ratio above the all-India average but are not getting adequate credit to meet their input requirements for their crops as indicated in Chart 1.13. This may be possible on account of higher share of low value crops in their overall crop output. However, the states with higher credit intensity would have a higher risk of greater indebtedness among the borrowers. iii. The chart here shows the state-wise ratio of crop loan disbursed to their input requirements. iv. Some of the states are getting significantly high credit against their input cost requirement such as Andhra Pradesh (7.5 times), Kerala (6 times), Goa (5 times), Telangana, Tamil Nadu and Uttarakhand (4 times) and Punjab (3 times). On the other hand, Jharkhand, NE states, West Bengal, Chhattisgarh, Bihar, Odisha, Maharashtra, Uttar Pradesh and Rajasthan are not getting credit even to meet their input requirements. This highlights the skewedness in distribution towards few states and raises the question whether the credit is being used for the intended purpose. 1.7.5 Allied activities loan in relation to output i. As discussed in Para 1.7.1 above, crop loan accounts for more than 90 per cent of the total agricultural credit though its contribution to total output is approx. 60 per cent which means that the allied sector gets only 10 per cent of total credit while contributing the remaining 40 per cent of the total output. In this context it is important to understand this dynamics in the states. To analyse state-wise credit to allied activities two approaches have been adopted, one on the basis of state-wise percentage share in overall allied loan outstanding and overall allied output (Chart 1.14), and second on the basis of state-wise ratio of allied loan outstanding to allied output (Chart 1.15). 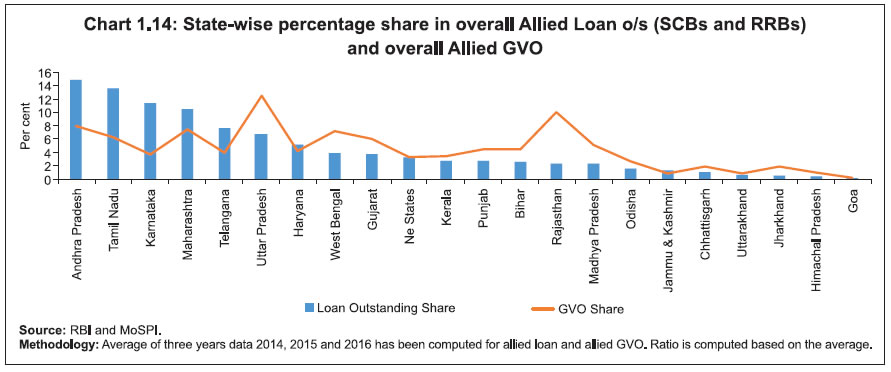 ii. The above chart shows that Andhra Pradesh, Tamil Nadu, Karnataka, Maharashtra and Telangana are getting higher share in overall allied loan outstanding compared to their contribution to overall allied output. Majority of the remaining states are not getting loan in proportion to their contribution in overall allied output. iii. The chart below shows the state-wise ratio of allied loan outstanding to allied output. iv. From the above chart, it is inferred that a majority of the states are not able to avail credit for their allied activities and this highlights the neglect of the allied activities by banks. One probable reason could be lack of a proper definition differentiating a farmer growing crops from a farmer engaged in allied activities, as the Census defines a farmer on the basis of landholding size. As a result of this banks insist on land records from a farmer seeking credit for agricultural activities. Hence, there is a need for appropriate measures to improve the credit off-take towards allied activities, especially in those states which have potential for allied activities. v. Besides, banks do not have any specific mandate to lend towards allied activities. GLC is one mechanism whereby targets are fixed activity-wise and hence, can be leveraged to push credit towards allied activities. At present annual targets are set for crop loans and term loans, which the banks have been achieving every year. 1.7.6 Recommendation The IWG recommends the following: i. GoI should set separate targets for working capital and term loan towards allied activities under GLC. ii. PSL guidelines define SMF based on land holding size. To make it easier for banks to give credit for allied activities PSL guidelines should prescribe a separate definition for SMFs seeking credit for allied activities of upto ₹0.2 million. Accordingly, banks should not insist on land records from borrowers seeking credit of upto ₹0.2 million for allied activities. 2 INCLUSIVENESS AND INNOVATION Policy interventions such as Priority Sector Lending (PSL) have resulted in improved credit flow by banks to the agriculture sector and particularly to small and marginal farmers (SMFs). The Kisan Credit Card (KCC) scheme was an innovative product designed to cater to the different credit needs of the farmers. It has boosted farm credit but needs further impetus to increase the coverage. Other credit delivery models have brought about inclusiveness to the bottom of the pyramid. 2.1 Agricultural Credit under Priority Sector Lending 2.1.1 Priority Sector Lending is a major policy intervention/initiative through which credit is directed to sectors of national priority. The objective of the PSL has been to ensure that vulnerable and weaker sections of the society get access to credit and that there is adequate flow of credit to employment intensive sectors like agriculture and MSME. 2.1.2 At present, all Scheduled Commercial Banks are required to meet a target of 40 per cent of their Adjusted Net Bank Credit (ANBC) or credit equivalent of Off Balance Sheet Exposure, whichever is higher for Priority Sector Lending. RRBs and SFBs are required to meet a target of 75 per cent towards PSL. Besides the overall PSL targets, banks are required to achieve agriculture target of 18 per cent and a sub-target of 8 per cent of ANBC for small and marginal farmers. Under the revised PSL guidelines of 2015, direct and indirect agricultural lending has been dispensed with. The eligible activities include farm credit, agri-infrastructure and ancillary activities. As per the new guidelines, the approach of agriculture under priority sector is to focus on ‘credit for agriculture’ instead of ‘credit in agriculture’ in order to give impetus to financing of supply value chain in the sector. The trend of agricultural credit, total PSL and achievement with respect to prescribed targets is shown in the following chart. 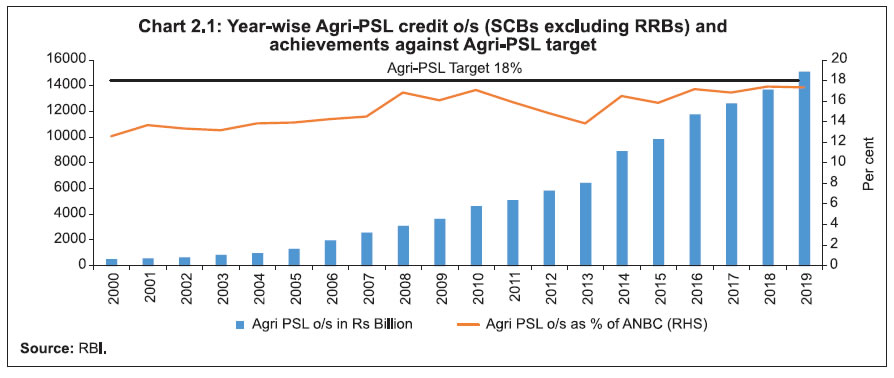 2.1.3 Though at the aggregate level banks have been able to achieve the overall PSL target of 40 per cent, so far they have failed to achieve the agriculture target of 18 per cent at system-wide level. However, public sector banks have achieved 18.12 per cent as against private sector banks’ achievement of 16.30 per cent in 2018 - 19. 2.1.4 Achievement of Small and Marginal Farmers Target under PSL i. At the aggregate level, banks have been able to achieve the sub-target of small and marginal farmers under PSL. Though this reflects a satisfactory performance in terms of achievement of target by banks, a large proportion of SMF have not been covered by SCBs. As per PSL Returns (2015-16), the number of accounts under the small and marginal category are 5,13,88,257 and the total number of small and marginal farmers in the country as per Agriculture Census, 2015-16 was 12,56,35,000. This means, despite so many initiatives aimed at financial inclusion, only 40.90 per cent of small and marginal farmers could be covered by SCBs. There is a need to increase the coverage of SMF by banks as they constituted 86.21 per cent of total operated holdings and have 47.34 per cent share in the operated area. ii. The chart below shows state-wise comparative position of percentage share in population, number of loan accounts and amount outstanding regarding small and marginal farmers. iii. The analysis shows that the presence of a large number of small and marginal farmers in a state has not translated into proportionate number of loan accounts, highlighting the extent of financial exclusion among small and marginal farmers. Also, the pattern of percentage share in the number of loan accounts in a state does not match with the percentage share in amount outstanding particularly in the states such as Bihar, Odisha and West Bengal. iv. Tamil Nadu has come out as an outlier, having only 6 per cent share in the total number of small and marginal farmers although it is the leading state in terms of share in total number of loan accounts (17 per cent) and the highest share in amount outstanding (13 per cent). Similarly, Andhra Pradesh has a higher share in the number of accounts as compared to its share in number of SMF across the country. v. Further, in states such as Bihar, Jharkhand, Odisha and West Bengal, the percentage share in loan outstanding is not proportionate to their percentage share in the number of loan accounts. This in a way may be an indication that the amount of loan per account for small and marginal farmers in these states was lower than that of other states. 2.1.5 Revisiting the Sub-target for Small and Marginal Farmers i. The above mentioned 8 per cent sub-target for small and marginal farmers was prescribed based on the recommendation made by the Internal Working Group (IWG), which submitted its report in March 2015, to revisit the Existing Priority Sector Lending Guidelines. The said working group recommended the sub-target of 8 per cent for small and marginal farmers based on their share in the operated area, landholding and their contribution to the agriculture sector. ii. Based on the historical data on operated area, we may make projections for total operated area (i.e. by all size class of farmers) as well as the operated area by small and marginal farmers for the year 2020-21. The projected percentage share of operated area held by marginal and small farmers out of total operated area held by all size class of farmers comes out to be 51.85 per cent in the year 2020-21. The detailed calculation is shown in Annex 2. iii. Assuming that agricultural credit, inter alia, depends on the operated area and due to the constraints on data availability regarding other probable credit determinants [such as district-wise input cost for a crop, type of crops being grown, crop-wise sown area, number/share of small and marginal farmers cultivating a crop and similar data for allied activities being undertaken by small and marginal farmers etc.] we reckon that credit is dependent on operated area. Further, if the overall target for agriculture remains at 18 per cent in year 2020 - 21 and based on the operated area with small and marginal farmers [as projected above] we may compute the share of agricultural credit that should be available to small and marginal farmers as 51.85 per cent of 18 per cent which is 9.33 per cent. a. The share computed above is based on the land operated by small and marginal farmers which has been taken from Agriculture Census 2015-16. The Agriculture Census does not consider landless labourers, tenant farmers, oral lessees and share-croppers etc. under the definition of small and marginal farmers. However, Master Directions on PSL include these farmers under the small and marginal farmers category for computation of achievement of sub-target of 8 per cent. It is important to mention here that the estimate regarding oral lessees, share-croppers and tenant farmers is not readily available. However, it is well known that such farmers along with landless labourers have a significant presence across states. b. The above calculated share of 9.33 per cent is still a conservative estimate for sub-target of small and marginal farmers. If landless labourers, tenant farmers, oral lessees and share-croppers etc. are to be included under SMF category then 9.33 per cent will further increase. Also, SMFs account for more than half of the total agricultural output at the national level and hold a major share in the high value crop production.14 c. The number of small and marginal holdings are on a consistent rise increasing from 49632 thousand in the year 1970 - 71 to 125635 thousand in the year 2015 - 16. This means the land is being increasingly fragmented resulting in diseconomies of scale which ultimately means the higher credit requirement per unit of land area. 2.1.6 Recommendation Based on the above discussion the IWG recommends the following: -
Revise the sub-target for small and marginal farmers from the existing 8 per cent of ANBC to 10 per cent with a roadmap of two years. -
Step up FI and FL initiatives for SMFs. 2.2 Interest Subvention Scheme for Short term Crop Loans 2.2.1 The Union Government had introduced the interest subvention scheme (ISS) for short term crop loans in 2006-07. It has been continuing since then with minor modifications. Interest on short term crop loans up to ₹0.3 million are fixed at 9 per cent per annum by banks and made available to farmers at a reduced rate of 7 per cent per annum to farmers. The 2 per cent interest subvention is reimbursed to banks (through RBI and NABARD) based on the funds released by the government against their claims. Besides 2 per cent interest subvention, 3 per cent prompt repayment incentive (PRI), introduced in 2009-10, is given reducing the cost of loan to 4 per cent. To prevent distress sale of produce, the interest subvention benefit is extended for a period of up to six months (post-harvest) to small and marginal farmers having Kisan Credit Card (KCC) on loan against negotiable warehouse receipts issued on the produce stored in warehouses accredited with Warehousing Development Regulatory Authority (WDRA). The scheme also provides for 2 per cent interest subvention to farmers for the first year on loans restructured due to natural calamities. 2.2.2 The ISS was meant for providing short term crop loans, i.e. production credit to farmers at a sub-vented rate of interest. However, it has resulted in skewed distribution of agricultural credit in favour of production credit against crop-related investment credit. As a result, the share of short term crop loan is on a consistent rise whereas the share of crop-related investment credit is on a decline. The trend analysis of the investment credit in relation to the short term crop loan availed by farmers is shown in the chart here. 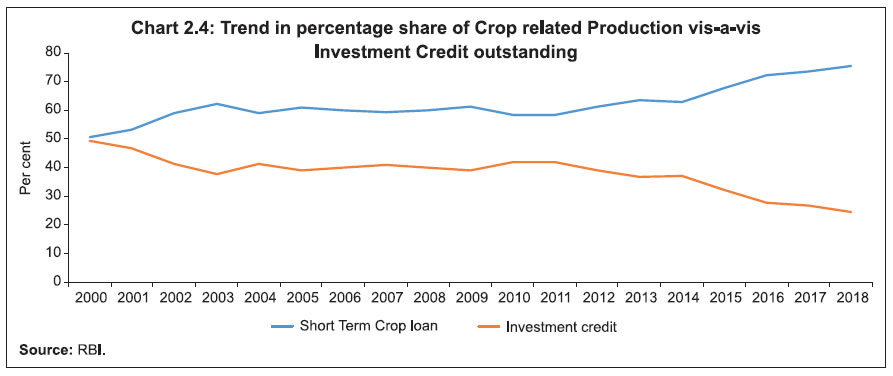 2.2.3 As can be seen in the above chart, the proportion of short term crop loans to crop-related investment credit which was 51:49 in 2000 has drastically changed to 75:25 in 2018. It is interesting to note that the impact on investment credit was more pronounced 2011 onwards, after the introduction of prompt repayment incentive in 2009-10. The declining trend of investment credit is a cause of concern as the flow of investment credit is important for the long term sustainability of the agriculture sector. Apart from the ISS, the other probable reasons for consistent increase in short term crop loans and decline in investment credit are attributable to: -
Increasing fragmentation of land making it unviable for investment credit as the average landholding size has declined from 2.28 hectare in 1970-71 to 1.08 hectare in 2015-16 (Agriculture Census 2015-16). -
Prevalence of tenancy in the agriculture sector discouraging investment credit. 2.2.4 In general the Gross Capital Formation in agriculture as a percentage of agriculture and allied GDP has been declining over the years. The chart below depicts the GCF in agriculture as a percentage of agriculture and allied GDP. 2.2.5 GCF in agriculture as percentage of agri-GDP was 9.2 per cent in 1980-81, reached its peak at 18.2 per cent in 2011-12. Thereafter, it showed a declining trend till 2015-16 and then a slight upward trend with 13.8 per cent in 2016-17. Further, the public GCF which was at 43.2 per cent during 1980 - 81 has come down significantly to 18.8 per cent during 2016-17. Hence, there is a need for the Central Government along with state governments to improve their spending towards capital expenditure which ultimately will stimulate the demand for investment credit in the agriculture sector. 2.2.6 Recommendation The IWG recommends the following: i. State governments should promote and conduct awareness drives for land consolidation so that the farmers can achieve economies of scale and have the incentive to make long term investments. ii. The interest subvention scheme should be replaced with DBT to targeted beneficiaries, i.e. small and marginal farmers, tenant farmers, sharecroppers, oral lessees and landless labourers as individual borrowers or through SHG/JLG model with an overall limit of ₹0.3 million per individual farmer. Innovations in Delivery of Agricultural Credit 2.3 Kisan Credit Card 2.3.1 The Kisan Credit Card (KCC) scheme, introduced in 1998, aimed at providing adequate and timely credit support from the banking system under a single window with flexible and simplified procedure for the farmers for their overall credit requirements such as cultivation of crops, post-harvest expenses, marketing of produce, maintenance of farm assets, activities allied to agriculture and also consumption requirements of farmer households. As per 2019 data, there were total 66.2 million operative KCC accounts, the bank category-wise share of which is shown in the following chart: 2.3.2 The performance of KCC has been analysed in the following chart. 2.3.3 As per 2019 data the number of operative KCC is approximately 66.2 million and as per Agriculture Census 2015 - 16 the number of land holdings were approximately 145 million, which implies that only 45 per cent of farmers possessed operative KCCs. However, there may be famers with multiple KCC cards and the actual coverage may be lower. As per NAFIS Survey 2016-17, 4.6 per cent of agricultural households hold more than one card. Also, the survey reports that taking all agricultural households together, only 10.5 per cent of agricultural households were found to have a valid KCC. Hence, there is a need to take measures to improve the penetration of KCC by banks across the country. 2.3.4 An analysis of the crop loans outstanding under PSL shows that only 62 per cent of them as on March 31, 2018 are through KCC mode. To identify the states where KCC is the preferred credit instrument for lending to farmers, a state-wise comparison of crop loan vis-à-vis KCC has been plotted in the following chart.  2.3.5 While KCC has emerged as a preferred credit instrument for disbursing crop loans, the incidence of crop loans outside KCC is very high. In Tamil Nadu, Andhra Pradesh, Kerala and Karnataka, 71 per cent of the crop loans are disbursed outside of KCC, the highest being in Tamil Nadu at 88 per cent. This may be because farmers are availing agricultural loans against gold as collateral. The crop loan analysis discussed in Para 1.7.4 revealed that the regional distribution of agricultural credit is distorted and disproportionate to the agricultural input requirements and output. The predominance of agricultural loan against gold as collateral is a matter of concern as the quantum of loan must have been delinked from the scale of finance15. If the crop loan is not based on the scale of finance there is high probability that the crop loan amount sanctioned may be higher than the actual credit requirement. Banks find it easier to sanction such loans as these are secured loans. This ultimately leads to diversion of funds and consequently, high incidence of indebtedness among the farmers. Further, the short term crop loans are eligible for Interest Subvention Scheme that incentivises farmers to avail such agricultural loans leading to misutilisation of government subsidy. This issue can be addressed by routing all the crop loans, eligible for interest subvention, through KCC mode only. 2.3.6 As discussed in Para 1.3.4, approximately 30 per cent of agricultural households still depend on non-institutional sources for their credit requirements. Some of these agricultural households need credit for their consumption requirements which banks are not willing to give and hence, they are compelled to go to money lenders. Though KCC limit has an inbuilt component of 10 per cent for consumption requirements of the farmers, this may not be adequate. Hence, there is a need to encourage banks to give credit to agricultural households for consumption purposes. 2.3.7 Recommendation The IWG recommends the following: i. There is a need to address the issue of sanctioning of agricultural loans against gold as collateral. Presently such loans are not separately flagged in core banking solution (CBS) platform of banks. Hence, banks should develop an MIS to flag agricultural loans sanctioned against gold as collateral in CBS in order to segregate such loans for effective monitoring of end use of funds. ii. In order to curb the mis-utilisation of interest subsidy, banks should provide crop loans, eligible for interest subvention, only through KCC mode. iii. Banks should be allowed to give consumption loans to farmers upto a sanctioned limit of ₹0.1 million under PSL provided banks are able to obtain collateral security and are satisfied with their repayment capacity based on the cash flows of the borrowers. However, such loans will not classify for PSL-Agri. iv. To improve ease of credit, the limit of ₹0.3 million for waiving collateral security by the banks in case of tie-up arrangements should be revised to ₹0.5 million under the existing KCC guidelines subject to the condition that the tie-up arrangements are between the producers and processing units without any intermediaries. 2.4 Improving KCC scheme - Scale of Finance 2.4.1 RBI guidelines on KCC scheme prescribe that the crop-wise Scale of Finance (SoF) as decided by District Level Technical Committee (DLTC) should be used to arrive at the short term limit for the crop loan. The guidelines on SoF are issued by NABARD. As per the guidelines, the district is the unit for determining the crop-wise scale of finance per unit of area because of different agro-climatic characteristics and separate SoF are to be fixed for irrigated and unirrigated areas. DCCBs are the convenors of DTLC and they play a major role in fixing the SoF. 2.4.2 A short study was conducted to understand the effectiveness of the scale of finance and to ascertain whether it is realistic keeping in view the cost of cultivation and expected price to be realised. The study was carried out in states of Punjab, Haryana, Uttar Pradesh, Madhya Pradesh, Maharashtra, Gujarat, Karnataka, Tamil Nadu, Andhra Pradesh, Telangana, Kerala, Bihar, West Bengal and Assam. In each state, five districts with the highest credit off-take were selected and rural branches with significant crop loans were visited on random sample basis. 2.4.3 The findings of the study indicated that different approaches were used to arrive at the scale of finance for sanctioning of crop loans. Complaints were received in the past from farmers regarding crop loans not being in tandem with the cost of cultivation. This may be on account of lower SoF fixed by the DLTC. Further, there are issues of huge variation in SoF for a single crop across districts within the same state. This may be on account of differences in geographies, climatic conditions, farming practices, usage of machines, irrigation facilities and labour charges etc. This leads to difficulty in implementation and monitoring by banks with regard to adherence by their branches. Hence, there is a need to have a uniformity and transparency in scale of finance. 2.4.4 DCCBs are the convenors of DTLC and they play a major role in fixing the SoF. However, they lack the resources and technical capabilities to carry out such exercises which need a more scientific approach. Moreover, as the financial health of most of the DCCBs is not sound, they fix the SoF at a lower level. The banks are required to follow the SoF fixed by DLTC, though they have the flexibility to have a higher SoF. Consequently, this leads to further variations in SoF for a crop within the same district. This issue can be addressed by assigning the responsibility of fixing the SoF for crops to SLBC at the state level which is justifiable as banks have emerged as the main purveyors of credit to the farming community. 2.4.4 The benefits of the KCC have been recently extended to working capital limits for animal husbandry farmers and fisheries. Lending for AH&F has not taken off on account of delay in fixing the district-wise SoF in states. In allied activities there would not be much variation in terms of unit cost of livestock, shed and expenditure towards feed, maintenance etc. Hence, a pan-India SoF would be feasible for allied activities and will also make it easier for banks to monitor the credit flow. 2.4.5 Recommendation The IWG recommends that for better monitoring of branches by banks and easier implementation of KCC there should be uniformity in scale of finance (SoF) for both crops and allied activities. Towards this objective state-wide SoF for crops should be prescribed separately for irrigated and unirrigated areas by the State Level Bankers’ Committee (SLBC). IBA in consultation with NABARD should fix a pan-India SoF for allied activities. 2.5 SHG-Bank Linkage Model 2.5.1 Self Help Group - Bank Linkage Programme (SHG-BLP) launched in 1992 was an innovation harnessing the synergy of flexibility of an informal system with the strength and affordability of a formal system. The SHG-BLP model has the following three main features: -
Acceptance of informal groups as clients of banks – both deposit and credit linkage -
Introduction of collateral free lending -
Permission to lend to groups without specification of purpose/activity/project 2.5.2 The policy environment supported this savings led and door step credit delivery mechanism based on social collateral. The following chart gives an account of the success of SHG model. 2.5.3 Deendayal Antyodaya Yojna - National Rural Livelihood Mission (DAY-NRLM) DAY-NRLM, a flagship poverty alleviation programme, was launched by the Ministry of Rural Development (MoRD), Government of India in June 2011 as a restructured version of Swarna Jayanti Gram Swarozgar Yojna (SGSY). NRLM has the mandate of reaching out to 100 million rural poor in 0.6 million villages across the country through self-managed Self-Help Groups (SHGs) and support them for livelihoods collectives in a period of 8-10 years. As per NABARD: Status of Microfinance in India 2017-18 Report, in all, 100 Scheduled Banks, 300 DCCBs, 27 State Rural Livelihood Missions and over 5000 NGOs are engaged in promotion of SHGs. The programme owes this level of involvement to its ability to mobilise masses of rural people, impress upon the government machinery and draw in developmental agencies of all hues. This programme is a strong intervention in economic enablement and financial inclusion for those at the bottom of the pyramid. A proven platform initially conceived for increasing the outreach of banking services among the poor has since graduated to a programme for promotion of livelihoods and poverty alleviation. 2.6 Joint Liability Groups The Joint Liability Groups (JLG) scheme was initiated by NABARD in 2006 with the expectation of enhancing credit flow to share croppers/tenant farmers who do not have land rights. The chart here shows the progress under the JLG model but this model has not been leveraged effectively as a credit delivery model by banks. 2.7 Farmer Producer Organisations (FPOs) 2.7.1 Small holders often suffer from poor access to quality inputs, institutional credit and other resources like storage, organised markets, modern farming technologies etc. making small holding-based agriculture unviable. There is an inherent weakness in a fragmented land holding model as on the one hand overheads on inputs and services purchased are very high, while on the other bargaining power in the marketplace for output remains limited by the very low levels of individual marketable surplus. This is resulting in higher production cost and lower price realisation, threatening sustainability of farming as an economic activity. Fragmented land holding also restricts mechanisation and economies of scale in farm production. 2.7.2 Collectivising farmers into Producer Organisations (POs) has the potential to overcome the challenges faced by the small and marginal farmers in terms of breaking the farmers’ dependency on intermediaries through improved bargaining power. Benefits of Farmers’ Collectives include reduction in cost of production and marketing cost, access to modern technologies, greater access to storage, efficient management of value chain, easier access to financial resources without collaterals and other support services by service providers. 2.7.3 In the last decade, efforts have been made towards creating and strengthening POs (primary producers in the rural space for both farm and non-farm activities), and their position in the mainstream value chain/s. Several measures have been initiated by the Government and NABARD to promote and strengthen FPOs. The measures taken by GoI are given in Annex 3. Further, model of a successful FPC is discussed in Annex 4. 2.7.4 The total number of FPOs promoted by different agencies is not known. However, NABARD has reported that it has cumulatively promoted/ supported over 3000 FPOs across states. The typology of the FPOs promoted by NABARD as on March 31, 2019 is shown in the following chart. 2.7.5 Recommendation The IWG recommends the following: i. NABARD should design a financing model for credit requirements of FPOs/FPCs across the entire supply and value chain. Further, NABARD should promote women-oriented FPOs by identifying successful women SHGs. ii. Bank loans to FPOs/FPCs undertaking farming with assured marketing of their produce at a pre-determined price, having at least 75 per cent SMF, should be eligible for PSL with a credit cap of ₹50 million. iii. To widen the scope and reach of the guarantee fund currently available to FPCs through SFAC, GoI should augment its corpus and extend the facility to FPOs so that banks can lend without insisting on collateral. 2.8 Priority Sector Lending Certificate 2.8.1 Priority Sector Lending Certificate (PSLC) instrument was introduced on the recommendations of the Internal Working Group (IWG) to review PSL in April 2016. The Reserve Bank provides the platform to enable trading in the certificates through its core banking solution portal (e-Kuber). All scheduled commercial banks (including RRBs), urban co-operative banks, small finance banks and local area banks are eligible to participate in trading. There are four kinds of PSLCs: Agriculture, Small and Marginal farmers (SMF), Micro Enterprises and General which can be bought and sold via the said platform. The total trading volume of PSLCs grew from ₹498 billion in 2016-17 to ₹1842 billion in 2017-18 and further to ₹3,274.3 billion in 2018-19 recording a Y-o-Y growth of 78 per cent in 2018-19 as compared to 2017-18. Among the four PSLC categories, the highest trading was recorded in the case of PSLC-General and PSLC-SMF, with the transaction volumes at ₹1,324.8 billion and ₹1,125.0 billion, respectively, in 2018-19.16 2.8.2 The basic philosophy behind the introduction of PSLC is to support the comparative advantage of different banks in their respective areas of specialisation which brings in efficiencies and results in optimal allocation of lendable resources. The banks thus have the incentive in lending to different categories of the priority sector over and above the PSL targets and sub-targets and issue PSLCs against the surplus loans, thereby enhancing lending to these sectors. For instance, a bank with expertise in lending to agriculture can increase its lending thereby creating a surplus and get benefit by selling its surplus through selling PSLCs. The premium income earned makes achieving a surplus in PSL categories a lucrative avenue for banks. 2.8.3 Recommendation The IWG recommends the following: i. The impact of PSLC-Agri and PSLC-SMF on lending to the agriculture sector at the ground level should be examined in detail. ii. As per the annual reports of RRBs, they are mainly sellers of PSLCs on account of overachievement of PSL targets. Although they have the incentive for overachievements, there is no disincentive in case of underachievement. Accordingly, RBI in consultation with NABARD, should examine whether RRBs should be made to contribute to RIDF in the event of PSL shortfall. 3 IMPACT OF FARM LOAN WAIVER Farm loan waivers, though not a recent phenomenon, have seen an unprecedented increase since 2014-15 driven by state governments. From a macro-economic perspective, the policy of farm loan waivers is grounded in the rationale of alleviating the debt overhang of beneficiaries thus enabling them to undertake productive investment and boost real economic activity. However, in reality it often undermines the credit culture and impacts the state finances adversely, which in turn harms the farmers’ interests in the medium to long term. 3.1 Genesis of Farm Loan Waivers 3.1.1 The first major program on farm loan waiver, viz., Agriculture and Rural Debt Relief Scheme, 1990 (ARDRS), was undertaken in 1990 at the nationwide level, followed by another nationwide loan waiver in 2008, viz., Agricultural Debt Waiver and Debt Relief Scheme, 2008 (ADWDRS). The ARDRS program, which came into force on May 15, 1990 covered short-term loans and overdue instalments of term loans outstanding to Public Sector Banks (PSBs) and Regional Rural Banks (RRBs) as on October 02, 1989 (cut-off date). The maximum relief amount under the program was ₹10,000 per farmer and there was no differential treatment for farmers based on the size of their landholding. The features of the 2008 ADWDRS program varied significantly from those of the 1990 ARDRS program. The ADWDRS program was broader in its coverage of institutions - it covered Scheduled Commercial Banks (SCBs), RRBs, Co-operative Credit Institutions (both urban and rural) and Local Area Banks. The program defined eligible amount of waiver as outstanding direct agriculture loans (including both short-term and investment loans) that were disbursed between March 31, 1997 and March 31, 2007, were overdue on December 31, 2007 and continued to remain unpaid as on February 29, 2008; there was no upper limit on the eligible amount for waiver. Perhaps the most significant feature in 2008 ADWDRS program was the differential treatment of farmers for waiver eligibility based on their landholding size. The program targeted higher relief for small and marginal farms (landholding upto five acres) vis-à-vis other farmers. Small and marginal farmers under the program received a full waiver on their eligible amount while other farmers received 25 per cent waiver on eligible amount conditional on payment of the remainder 75 per cent. 3.1.2 The instances and scale of farm loan waivers have seen an unprecedented increase since 2014-15. This surge in loan waivers is driven by state governments - 10 states have announced loan waivers aggregating ₹2.4 trillion (1.4 per cent of 2016-17 GDP at current prices) since 2014-15. This is significantly higher than the two-nationwide loan waiver programmes - ₹100 billion waiver programme in 1990 (₹506 billion at 2016-17 prices using the GDP deflator) and ₹525 billion programme in 2007-08 (₹812 billion at 2016-17 prices using the GDP deflator). 3.1.3 The features of loan waivers undertaken by state governments since 2014 are detailed in Table 3.1. Broadly, there is a higher focus on co-operative credit institutions in state-level debt waiver programs. Most programs cover short-term crop loans and prescribe an upper limit on the amount of relief granted. | Table 3.1: Comparison of state level loan waivers since 2014 | State
(Amount and announcement year) | Institutions covered | Types of loan covered | Farmer category covered | Cut-off date | Limit per farmer (₹) | Andhra Pradesh
(₹240 billion; 2014-15) | SCBs, RRBs, Rural Co-operative Credit Institutions (RCCI) | Short-term crop loans, including those converted in medium-term loans due to calamities | All farmers | March 31, 2014 | 1,50,000 | Telengana
(₹170 billion; 2014-15) | SCBs, RRBs, Co-operative Credit Institutions (urban and rural) | Short-term crop loans, including those converted in medium-term loans due to calamities | All farmers | March 31, 2014 | 1,00,000 | Tamil Nadu
(₹52.8 billion; 2016-17) | RCCI | All short-term, medium-term and long-term agricultural loans | Small and marginal farmers | March 31, 2016 | No limit | Maharashtra
(₹340.2 billion; 2017-18) | SCBs, RRBs, Grameen Banks and District Central Co-operative Banks (DCCBs) | Crop loans and term loans | Small and marginal farmers | June 30, 2016 | 1,50,000 | Uttar Pradesh
(₹363.6 billion; 2017-18) | SCBs, RRBs, Co-operative credit societies / banks (excluding Urban co-operative banks) | Short-term crop loans, including those converted in medium-term loans due to calamities | Small and marginal farmers | March 31, 2016 | 1,00,000 | Punjab
(₹100 billion; 2017-18) | SCBs and Co-operative Credit Institutions (urban and rural) | Crop loans | Small and marginal farmers | March 31, 2017 | 2,00,000 | Karnataka
(₹180 billion; 2017-18) | RCCI | Crop loans | All farmers | June 20, 2017 | 50,000 | Karnataka
(₹440 billion; 2018-19) | SCBs, RRBs, Co-operative credit societies / banks (excluding UCBs) | Crop loans | All farmers | For SCBs and RRBs: December 31, 2017
For co-operative institutions: July 10, 2018 | For SCBs and RRBs: 2,00,000
For co-operative institutions: 1,00,000 | Rajasthan
(₹180 billion; 2018-19) | Rural co-operative institutions and primary land development banks | Crop loans | All farmers | September 30, 2017 | For small and marginal farmers: 50,000
For other farmers: proportionate basis linked to prescribed landholding of small farmers, subject to limit of Rs. 50,000 | Madhya Pradesh
(₹365 billion; 2018-19) | SCBs, RRBs, Co-operative banks | Crop loans | All farmers | December 12, 2018 | 2,00,000 | Chhattisgarh
(₹61 billion; 2018-19) | SCBs, RRBs, Co-operative banks | Crop loans | All farmers | December 12, 2018 | 2,00,000 | | Source: Budget documents of state governments. | 3.2 Is farm loan waiver an appropriate response to farm distress? 3.2.1 The policy of loan waivers has mainly been justified on social welfare grounds with the Government citing urban-rural divide in growth, social unrest and farmers' suicides as the justifications for the national ADWDRS program (Reddy, 2019). Nature’s risk and market risk are well established causes for agrarian distress in India; state governments under various political dispensations have cited drought and/or price collapse of agriculture produce, as the reasons for undertaking loan waivers. 3.2.2 The linkage between agrarian distress and adverse rainfall in India is well established in empirical literature, as the infrastructure for irrigation is still underdeveloped (Cole et al. (2013), Burgess et al. (2011)). At the national level, rainfall performance in the years leading up to the ADWDRS program was normal, with no significant deviation from Long Period Average (LPA) between 2003-04 to 2007-08, after three successive years of drought between 2000-01 and 2002-03. The recent state-level loan waiver announcements since 2014-15 is co-incident with poor rainfall performance (Chart 3.1). 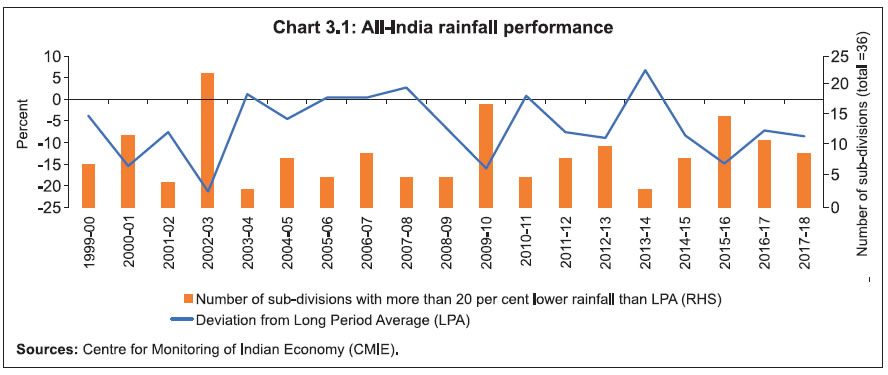 3.2.3 As regards prices, they show high inflation in the three years (2005-06 to 2007-08) that immediately preceded the ADWDRS program, though prices were depressed in five of the six years between 1999-00 to 2004-05. Another contributory factor for agrarian distress has been the higher increase in input costs vis-à-vis agriculture produce, thereby eroding agricultural margins (Ramakumar, 2018). Though margins for principal foodgrain crops (rice and wheat) rose significantly in 2007-08, the year that immediately preceded the ADWDRS program, it was low for successive years prior to that indicating build-up of agrarian distress. Agricultural prices and margins remained elevated between 2007-08 and 2013-14. However, in the recent period from 2014-15 onwards, there has been a moderation in prices and margins that could have been a motivating factor for the recent state-level farm loans waiver programs (Chart 3.2). The price movements could be a part of the business cycle, where an upswing phase of higher prices is often followed by low prices and shrinking margins.   3.2.4 Notwithstanding the evidence of deficit rainfall conditions and downswing in agriculture produce prices in announcements of loan waivers, the timing of loan waiver announcements during election cycles points to more of political expediency of such waiver programs that does not really address long term issues in agriculture. The nationwide loan waiver programs of 1990 and 2008 were announced by the Union Government in the run up to the parliamentary elections of 1991 and 2009, respectively. Similarly, eight out of ten loan waiver announcements since 2014 were made within 90 days of their respective states’ election results. 3.3 Impact of Farm Loan Waivers on Agricultural Credit 3.3.1 The economic rationale for loan waivers comes from alleviating the debt overhang of beneficiaries thus enabling them to undertake productive investment and boost real economic activity (investment, production and consumption). Loan waiver of highly indebted farming households can potentially free up lines of credit enabling them to make new investments, provided supply of bank credit to them is not affected by the changed risk-profile of the household. The economic benefit of loan waiver on households, therefore, can only be realised if credit allocation to beneficiary households is not impacted. Loan waivers, however, do impact the credit flow to agriculture due to moral hazard among both beneficiaries and non-beneficiaries of the bailout. This impact could be both in loan performance, as borrowers choose to default strategically in anticipation of future bailouts, and in credit allocation, as banks reallocate lending to lower risk borrower segments. 3.3.2 The chart below indicates a deceleration in agricultural credit outstanding and decline in agricultural credit disbursements in the years of loan waiver programmes, though the impact was transitory with growth bouncing back in the subsequent years. The immediate decline in disbursements is because beneficiary farmers are unable to avail fresh loans from banks till the time the waiver program is implemented. This phenomenon is on account of Priority Sector Lending regulations. 3.3.3 Loan performance of PSBs shows co-movement with rainfall deficiency, except in 2008-09 and 2009-10 where loan write-offs could have had an effect in moderating the Non-Performing Assets (NPA) level despite high rainfall deficiency. In the recent period in 2016-17 and 2017-18, NPA level has increased sharply, possibly indicating strategic default arising from the state-level loan waiver announcements (Chart 3. 4). 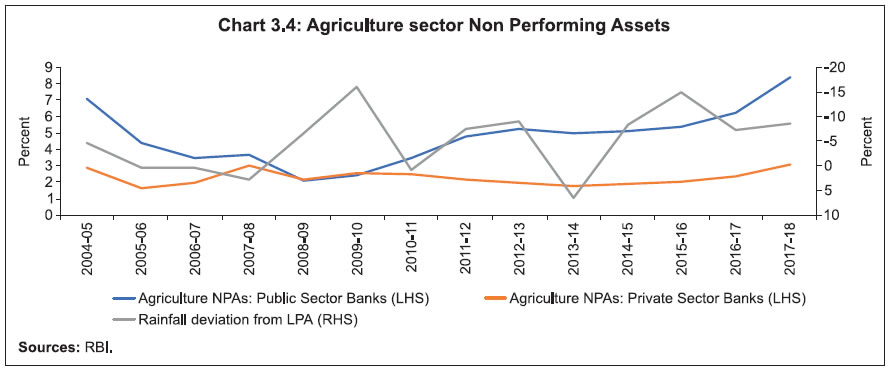 3.3.4 The chart below shows that in states of Maharashtra, Karnataka, Uttar Pradesh, Punjab and Bihar, the share of NPAs is higher than the share of outstanding in 2017-18, implying a higher incidence of NPA in these states. At the other end of the spectrum are states of Tamil Nadu, Kerala, Andhra Pradesh and Nagaland that exhibit lower NPA than the national average (Chart 3.5a). State-level changes in NPA level for 2017-18 over 2016-17 are shown in Chart 3.5b. The data shows that NPA level increased for all states that have announced farm loan waiver programme in 2017-18 and 2018-19. On the other hand, almost all other states (with the exception of Bihar, Odisha and Haryana), have shown either no material change in their NPA level or have actually registered a decline between 2016-17 and 2017-18. Taken together, this could be indicative of the presence of moral hazard, with borrowers defaulting strategically in anticipation of loan waiver. 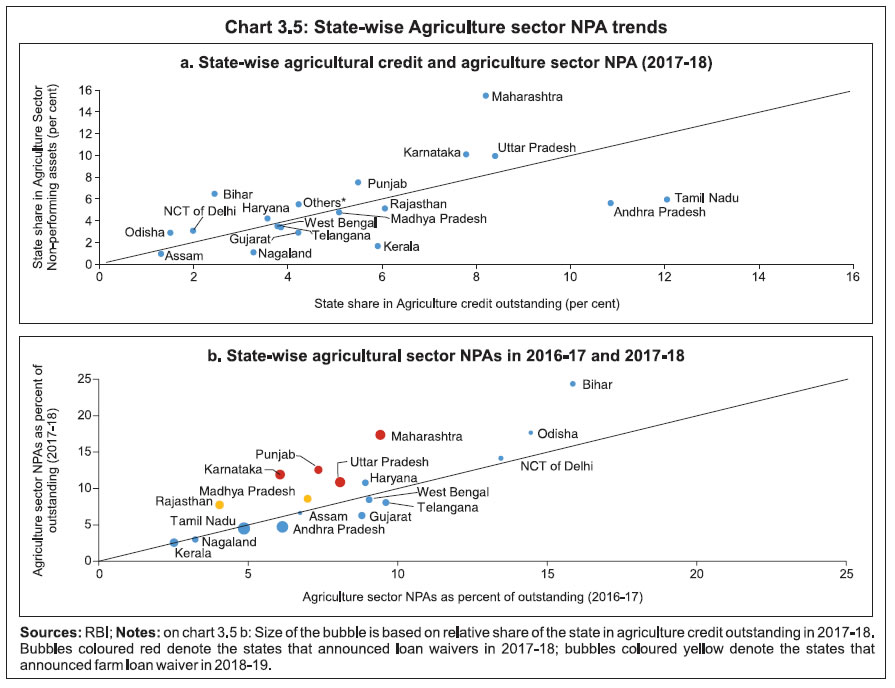 3.3.5 In empirical literature, the impact of farm loan waivers is not widely studied with the first study undertaken by Shylendra, H.S. (1995) using primary survey data to assess the impact of ARDRS, 1990. The study examines the distribution pattern of relief across beneficiary households and finds that both program relief and fresh credit post the program went primarily to large landholding farmers. Most of the subsequent studies on the subject make use of the natural experiment of the ADWDRS, 2008 program. Kanz, M. (2012) uses primary survey data of 2,897 households of Gujarat to study the impact of ADWDRS program on the level of household debt, investment, productivity and expectations of future credit access. The study finds that the waiver program had an impact in reducing household debt level but had no impact on investment. Debt relief beneficiaries believe that it will be more difficult to access credit in the future, both from formal as well as informal lenders. Kanz, M., and Giné, X. (2017) uses district-level aggregate data and exploits the difference in waiver magnitude across districts to study the impact of ADWDRS program on the Agriculture credit market (credit allocation and loan performance) and real economic activity in the agriculture sector (investment, productivity and consumption). The study finds reallocation of bank credit towards less risky customers and increase in loan defaults post debt waiver with no positive effect on agricultural productivity, rural wages, or consumption. Mukherjee, S., Subramanium, K., Tantri, P. (2017) use loan-level data of 39,000 accounts from 14 branches (3 states) of a public-sector bank to study the impact of ADWDRS program on loan performance of waiver beneficiaries simultaneously for both distressed and non-distressed agricultural borrowers. The study finds a strong linkage between agriculture distress and weather conditions (on both measures of rainfall deviation from long term average and drought incidence) in the pre-waiver period (September 2005 to February 2008). It finds that the impact of loan waiver on defaults differs for distressed borrowers (decrease in defaults) compared to non-distressed borrowers (increase in defaults). Further, it establishes the linkage between the pre-waiver condition of farmers (level of distress) and the post-waiver behaviour in loan repayment. 3.3.6 Raj, D. S., and Prabhu, E. A. (2018) study the impact of Tamil Nadu’s agriculture loan waiver scheme of 2016 on access to short term agriculture credit for beneficiary farmers. It is one of the few studies that assess the impact of a state-level loan waiver program on credit market outcomes. The study finds that beneficiary farmers have a lower probability of obtaining credit vis-à-vis non-beneficiaries in the short-term, though the differentiation comes down over time. 3.4 Impact of Farm Loan Waivers on State Finances 3.4.1 Farm loan waivers are a mechanism of settlement of private debt contract by the government and therefore have a fiscal impact, both on deficit and debt. The budget impact of loan waiver programs is typically staggered over a period of three to five years, achieved through either phase wise rollout of waiver program or by clearing the bank dues over several years. The ADWDRS program resulted in expenditure for the Union Government to the tune of ₹525 billion (lower than the amount announced which was ₹600 billion in the 2008-09 budget and subsequently raised to ₹720 billion when the scheme was enlarged to include large farmers) which was provided for in four years from 2008-09 to 2011-12 in Union budgets. Similarly, in case of loan waiver announcements by the states, the amount of waiver is staggered. Cumulatively for all states, the share of farm loan waivers in total state governments’ expenditure has seen a significant rise in 2017-18 and 2018-19 (Table 3.2). This could potentially depress the state governments’ capital expenditure in agriculture. Further, the deferment of budgetary provisions to meet the expenditure towards the announced loan waivers result in increase in NPA levels. Consequently, it comes on banks to extend fresh loans. | Table 3.2: Fiscal impact of states’ farm loan waiver programs (₹ billion) | | State | Year of announcement | Amount announced | Amount provided in the budget | | | 2014-15 | 2015-16 | 2016-17 | 2017-18 | 2018-19 RE | 2019-20 BE | | Andhra Pradesh | 2014-15 | 240 | 40 | 7.4 | 35.1 | 36 | 8.8 | 1 | | Telangana | 2014-15 | 170 | 42.5 | 42.5 | 29.6 | 29.5 | | | | Tamil Nadu | 2016-17 | 52.8 | | | 16.8 | 18.7 | 8.8 | 8.1 | | Maharashtra | 2017-18 | 340.2 | | | | 151.8 | 68 | 35 | | Uttar Pradesh | 2017-18 | 363.6 | | | | 211 | 55 | 6 | | Punjab | 2017-18 | 100 | | | | 3.7 | 42.5 | 30 | | Karnataka | 2018-19 | 440 | | | | 39.1 | 119.7 | 126.5 | | Rajasthan | 2018-19 | 180 | | | | | 30 | 32.4 | | Madhya Pradesh | 2018-19 | 365 | | | | | 50 | 80 | | Chhattisgarh | 2018-19 | 61 | | | | | 42.2 | 50 | | Total | | 2364.6 | 82.5 | 49.9 | 81.5 | 490.0 | 425.0 | 369.0 | | As per cent of state governments total expenditure | 0.4 | 0.2 | 0.3 | 1.8 | 1.2 | 1.0 | | As per cent of state governments Gross Fiscal Deficit (GFD) | 2.5 | 1.2 | 1.6 | 11.9 | 7.7 | 6.6 | | Source: Budget documents of state governments. | 3.4.2 The fiscal risks emanating from farm loan waivers has also been highlighted in the RBI report on State Finances: A Study of Budgets of 2017-18 and 2018-19 (2018). The report estimated that about a third (5 basis points) of the overall fiscal slippage of 13 basis points in revenue expenditure during 2017-18 (RE) may be attributed to loan waivers. The report also highlighted the varying fiscal impact of loan waivers across different states, ranging from 4.6 per cent of GFD in Tamil Nadu to 60.9 per cent of GFD in Uttar Pradesh. The impact on states’ exchequers varies widely across waiver implementing states, ranging between 1.0 per cent of GSDP in Chattisgarh to 0.04 per cent of GSDP in Tamil Nadu in 2018-19. RBI Mint Street Memo “Agriculture Loan Bank Accounts – A Waiver Scenario Analysis” by Rajendra Raghumanda, Ravi Shankar and Sukhbir Singh (2017) presents different scenarios on the extent of farm loan waiver based on different eligibility assumptions. The estimates range from ₹2.2 lakh crore to ₹4.2 lakh crore, depending on the extent of coverage under the waiver schemes. 3.5 Policy alternatives While the risk to farmers income, viz., nature’s risk as well as market risk, materialise from time to time causing distress to the agrarian community, loan waivers, which often happen at the time of elections, are not the panacea to address the underlying risks. In fact they destroy the credit culture which may harm the farmers’ interest in the medium to long term and also squeeze the fiscal space of governments to increase productive investment in agriculture infrastructure. Cognizant of the need to address the long-term challenges of agriculture, various policy instruments like crop insurance, income support scheme, ECA, APMC reforms and e-NAM, etc have been undertaken at various levels of the government. 3.5.1 Recommendation In this regard, the IWG recommends that GoI and state governments should undertake a holistic review of the agricultural policies and their implementation, as well as evaluate the effectiveness of current subsidy policies with regard to agri inputs and credit in a manner which will improve the overall viability of agriculture in a sustainable manner. In view of the above stated, loan waivers should be avoided. 4 INTERNATIONAL EXPERIENCE – CHINA The agriculture sector of China is characterised by smallholders’ economy where the arable land in terms of hectares per person is 0.086 as against 0.118 in India, yet the agricultural productivity in China is very high compared to India. A report on the study visit undertaken by a three-member team from the RBI and NABARD elucidates the policies and practices adopted by China. 4.1. Agricultural Policy in China 4.1.1 Structural initiatives Beginning at very low levels when it joined the WTO in 2001, China has used a mix of policies17 that were driven by three major factors, i.e. modernisation of its agriculture, addressing rural-urban income inequality and maintaining food security and self-reliance. In 2004, the Chinese government announced a national program to phase-out the agricultural tax and eliminated it nationwide in 2006. It also instituted direct payments to grain producers, first in limited areas and finally nationwide in 2007. To cover increasing input costs, the Chinese Government instituted a general-input subsidy that is increased yearly as costs for petroleum and fertilizers have increased. If these costs decline, the payment remains constant. These policies have helped provide income support to farmers. 4.1.2 Consolidation of Farm Lands China has brought about consolidation of small and fragmented farm operations into large-scale units or ‘new-style’ farms of various types such as large family farms, co-operatives, and farms run by agribusiness companies to bring about economies of scale in farming. This has been enabled by institutional reform in the 1980s to allocate land contract rights to individual family farms. A proper registration system has been set up to activate the transaction of land operational rights and consolidation of farm operations through various formats, viz., individuals, land shareholding cooperatives and farm operations, by professional service providers. The long-term stability of land contracts and operational rights has also provided incentives to commit to long-term investments in land and achieve economies of scale. Farmers get a transfer payment on per acre basis from the enterprises which lease in land. 4.1.3 Outsourcing of farming operations The consolidation of land has enabled development of specialised farm machine services in China which has contributed significantly to the rapid increase in the use of modern farm machines, even on small farms. Outsourcing major farming operations (e.g. ploughing, planting and harvesting) by small farms to farm service providers allows small farmers to benefit from economies of scale in farm operations, reduces the cost of capital inputs and allows farmers to allocate more time to off-farm activities. China has also developed a competitive storage, transport and electricity infrastructure network which is comparable with most of the OECD countries. The country has also undergone large scale urbanisation with the rural population at 42 per cent of the total population in 2017 and ICT adoption at a very high level, with local platforms using the local language, a high level of mobile penetration and payments through mobile wallets. 4.1.4 Institutional Support to Agriculture The Peoples Bank of China (PBC), the Chinese Central Bank regulates only the Monetary Policy, while the Chinese Banking and Insurance Regulatory Commission (CBIRC) regulates the banking and insurance sector. According to CBIRC and PBC, the total agriculture lending by all institutions in China was 33 trillion (RMB) till the end of 2018. 4.2 Highlights of the Study Visit to China The study group had interactions with Agricultural Development Bank of China, an agricultural policy bank; Bank of China, the fourth largest commercial bank of China as also the world; State Agricultural Credit Guarantee Alliance Co. Ltd (SACGA) and Bank of China Fullerton Community (BOCF). The major points of learning are summarised in the following paragraphs. 4.2.1 Agricultural Development Bank of China (ADBC) i. The Agricultural Development Bank of China is a state-owned agricultural policy bank established by the Chinese government under the direct authority of the State Council to support sustainable healthy development of agriculture and rural areas. It was established in 1994 during the reforms of national financial institutions of China. The mission of the development bank is to formulate and implement policies based on national priorities and strategies to serve the agricultural industry needs of China, primarily by providing loans to rural infrastructure and development projects, agriculture-related enterprises and proactive assistance to supply-side structural reform of agriculture by the Chinese government. ii. ADBC has aligned its credit priorities with the priorities elucidated in 'Vision No 1 Document' of the Government of China and mainly focusses on five key areas, viz., national food security, poverty alleviation programs, modernisation of agriculture, medium and long-term loans to promote rural revitalisation and coordinated regional development. ADBC also finances the village level community banks/micro-finance companies/rural credit co-operatives which in turn lend to the individual farmers. 4.2.2 State Agricultural Credit Guarantee Alliance Co. Ltd (SACGA) The state-backed credit guarantee fund was set up in 2016 by the Chinese government as a not-for-profit policy guarantee institution, to offset some of the risks of community/commercial/co-operative banks who lend to agriculture and small industries sector and help borrowers in rural areas to obtain bank loans by guaranteeing a part. The tasks of the company include setting national re-guarantee business standards, offering re-guarantees to all provincial-level guarantee organisations and developing tailored agricultural credit guarantee products depending upon the life cycle of agriculture. The government credit guarantee firm has a very narrow focus on five sectors, viz., household farm, cultivators/ fishers, farmer cooperative institutions, small/medium agri corporations and new farmer social entities. In China there are several provincial level guarantee firms supported by local governments who provide basic comprehensive coverage in rural areas for agriculture business and farmers. There are 33 provincial level, 521 municipal level and 1017 county level guarantee companies. Besides these government guarantee companies, there are a few private players in the business of providing guarantees. The basic objective of guarantee companies is to co-operate with rural credit co-operatives, village and town level banks by sharing the credit risk and facilitate the small agri-businesses/farmers to obtain loans from banks at lower rates of interest. 4.2.3 Bank of China Bank of China is one of the four major state-owned banks in China. It is also a global systemically important bank and has been ranked fourth on the S&P list in 2016 with a total asset size of 2.60 trillion US $. It has a diversified portfolio with commercial banking, including corporate banking, personal banking and financial markets services as its core business areas. Generally, Chinese commercial banks do not lend at the village level as they do not have the reach. They prefer to extend loans to the state-owned enterprises supported by the government. Their agricultural portfolio is negligible at 6 per cent to 8 per cent while their SME portfolio is at 15 per cent. The Chinese government has given an explicit target to state-owned commercial banks to increase their lending to SMEs (privately owned enterprises) by 30 per cent this year. In the past the Chinese government has also used alternative measures like lowering the reserve ratio requirement to incentivise the commercial banks to lend to SMEs. 4.2.4 Bank of China Fullerton Community Bank of China Fullerton (BOCF) set up in 2011, is a subsidiary of Bank of China. The bank provides SME, agricultural as well as consumer loans. It has differentiated regulations with lower capital requirements and liquidity standards as compared to its commercial banks. 4.3 Major Learnings from China visit The major learnings are as under: i. Long-term (30 years) leasing of land, large scale farm mechanisation /modernisation, use of technology, high yielding seeds and R&D has contributed to high agricultural productivity in China and also improved the income levels of small-holding farmers. ii. Agricultural credit guarantee products for facilitating agricultural credit at lower rates of interest without margin requirements to target groups iii. The Government of China has created a database of poor people in the rural areas who can be identified and extended loans at concessional rates of interest if they take up some livelihood activity under the poverty alleviation programs. iv. Direct income support to its farmers on per hectare basis v. MSP much higher than India’s MSP for staple crops, i.e. wheat and paddy 4.4 Recommendation The IWG recommends the following: i. At present there is no database of the Indian agriculture sector due to which the planning/ policy formulation lacks effectiveness and is difficult to monitor. GoI with the help of state governments should develop a centralised database capturing details related to crops cultivated, cropping pattern, output, sown/irrigated area, health of soil, natural calamity, etc. Besides, farmer-wise details like identity, land records, loan availed, subsidy given, insurance and details of crop cultivated, etc. should also be captured. ii. In India there is no guarantee scheme available to banks to cover the default risk of the borrowers. GoI in partnership with state governments should set up a credit guarantee fund for the agriculture sector on the lines of credit guarantee schemes implemented in the MSME sector. 5 SUMMARY OF RECOMMENDATIONS 5.1 Measures to Improve the Reach of Institutional Credit i. GoI should push state governments to complete the digitisation process and updation of land records in a time bound manner. ii. State governments should give access to banks to digitised land records in order to verify land title and create charge online. In such states banks should not insist on submission of land title documents. iii. State governments having a highly restrictive legal framework should be encouraged to reform their legal framework on the basis of Model Land Leasing Act proposed by NITI Aayog/ Land Licensed Cultivators’ Act, 2011 of the state of Andhra Pradesh so that formal lending to tenant farmers can improve. iv. GoI should set up a federal institution, on the lines of GST Council, having participation from both the Centre as well as the states to suggest and implement reforms in the field of agriculture. v. Aggressive efforts are needed to improve institutional credit delivery through technology driven solutions to reduce the extent of financial exclusion of agricultural households. Banks should explore collaborations with agri-tech companies/start-ups so as to provide access to credit in an integrated, timely and efficient manner to the farmers. vi. IBA should come out with a technology driven portal for the banks to facilitate ease of credit to the farmers for agriculture and allied activities on the lines of PSBLoansIn59 minutes to MSMEs. vii. Innovations like movable warehouses/cold storages and mobile based apps providing farm machineries on rental basis have been successfully operating but on a small scale. Hence, the GoI should identify the successful models in these areas which can be scaled up across the country. Further, banks should be encouraged to provide credit to such innovative solutions which support the agriculture sector. [Action: Department of Land Resources, MoRD, MoA&FW, GoI, State Governments, RBI, IBA and Banks; Para 1.4.2] 5.2 Addressing Regional Disparity i. PSL guidelines should be revisited in order to explore the feasibility of introducing suitable measures for improving the credit off-take in central, eastern and north eastern states. ii. NABARD should gradually increase the allocation of RIDF in central, eastern and north eastern states over a period of time. iii. Corpus of RIDF should be increased and state governments should be sensitised to allocate a larger portion of their borrowing from RIDF for the purpose of absorbing funds for rural infrastructure development in their state. [Action: DFS, RBI, NABARD, and State Government; Para 1.6.6] 5.3 Increasing Credit Flow to Allied Activities i. GoI should set separate targets for working capital and term loan towards allied activities under GLC. ii. PSL guidelines define SMF based on land holding size. To make it easier for banks to give credit for allied activities PSL guidelines should prescribe a separate definition for SMFs seeking credit for allied activities of upto ₹0.2 million. Accordingly, banks should not insist on land records from borrowers seeking credit of upto ₹0.2 million for allied activities. [Action: Ministry of Agriculture, RBI; Para 1.7.6] 5.4 Enhancing the sub-target of SMF under PSL i. Revise the sub-target for small and marginal farmers from the existing 8 per cent of ANBC to 10 per cent with a roadmap of two years. ii. Step up FI and FL initiatives for SMFs. [Action: RBI; Para 2.1.6] 5.5 Land Consolidation State governments should promote and conduct awareness drives for land consolidation so that the farmers can achieve economies of scale and have the incentive to make long term investments. [Action: State Government; Para 2.2.6 (i)] 5.6 Interest Subvention Scheme i. The interest subvention scheme should be replaced with DBT to targeted beneficiaries, i.e. small and marginal farmers, tenant farmers, sharecroppers, oral lessees and landless labourers as individual borrowers or through SHG/JLG model with an overall limit of ₹0.3 million per individual farmer. ii. In order to curb the mis-utilisation of interest subsidy, banks should provide crop loans, eligible for interest subvention, only through KCC mode. [Action: Ministry of Agriculture; Para 2.2.6 (ii) and 2.3.7 (ii)] 5.7 Agricultural Loans against Gold as Collateral There is a need to address the issue of sanctioning of agricultural loans against gold as collateral. Presently such loans are not separately flagged in core banking solution (CBS) platform of banks. Hence, banks should develop an MIS to flag agricultural loans sanctioned against gold as collateral in CBS in order to segregate such loans for effective monitoring of end use of funds. [Action: RBI, Banks; Para 2.3.7(i)] 5.8 Consumption Needs of Agricultural Households Banks should be allowed to give consumption loans to farmers upto a sanctioned limit of ₹0.1 million under PSL provided banks are able to obtain collateral security and are satisfied with their repayment capacity based on the cash flows of the borrowers. However, such loans will not classify for PSL-Agri. [Action: RBI; Para 2.3.7(iii)] 5.9 Improvement of KCC Scheme i. To improve ease of credit, the limit of ₹0.3 million for waiving collateral security by the banks in case of tie-up arrangements should be revised to ₹0.5 million under the existing KCC guidelines subject to the condition that the tie-up arrangements are between the producers and processing units without any intermediaries. [Action: RBI; Para 2.3.7(iv)] ii. For better monitoring of branches by banks and easier implementation of KCC there should be uniformity in scale of finance (SoF) for both crops and allied activities. Towards this objective state-wide SoF for crops should be prescribed separately for irrigated and unirrigated areas by the State Level Bankers’ Committee (SLBC). IBA in consultation with NABARD should fix a pan-India SoF for allied activities. [Action: RBI, NABARD, IBA; Para 2.4.5] 5.10 Farmer Producers’ Organisations i. NABARD should design a financing model for credit requirements of FPOs/FPCs across the entire supply and value chain. Further, NABARD should promote women-oriented FPOs by identifying successful women SHGs. ii. Bank loans to FPOs/FPCs undertaking farming with assured marketing of their produce at a pre-determined price, having at least 75 per cent SMF, should be eligible for PSL with a credit cap of ₹50 million. iii. To widen the scope and reach of the guarantee fund currently available to FPCs through SFAC, GoI should augment its corpus and extend the facility to FPOs so that banks can lend without insisting on collateral. [Action: Ministry of Agriculture, RBI, NABARD; Para 2.7.5] 5.11 Priority Sector Lending Certificates The impact of PSLC-Agri and PSLC-SMF on lending to the agriculture sector at the ground level should be examined in detail. [Action: RBI; Para 2.8.3(i)] 5.12 Regional Rural Banks As per the annual reports of RRBs, they are mainly sellers of PSLCs on account of overachievement of PSL targets. Although they have the incentive for overachievements, there is no disincentive in case of underachievement. Accordingly, RBI in consultation with NABARD, should examine whether RRBs should be made to contribute to RIDF in the event of PSL shortfall. [Action: RBI, NABARD; Para 2.8.3(ii)] 5.13 Farm Loan Waivers GoI and state governments should undertake a holistic review of the agricultural policies and their implementation, as well as evaluate the effectiveness of current subsidy policies with regard to agri inputs and credit in a manner which will improve the overall viability of agriculture in a sustainable manner. In view of the above stated, loan waivers should be avoided. [Action: GoI and State Governments; Para 3.5.1] 5.14 Database for Indian Agriculture sector At present there is no database of the Indian agriculture sector due to which the planning/ policy formulation lacks effectiveness and is difficult to monitor. GoI with the help of state governments should develop a centralised database capturing details related to crops cultivated, cropping pattern, output, sown/irrigated area, health of soil, natural calamity, etc. Besides, farmer-wise details like identity, land records, loan availed, subsidy given, insurance and details of crop cultivated, etc. should also be captured. [Action: Ministry of Agriculture and State Governments; Para 4.4 (i)] 5.15 Credit Guarantee Scheme for Agriculture sector In India there is no guarantee scheme available to banks to cover the default risk of the borrowers. GoI in partnership with state governments should set up a credit guarantee fund for the agriculture sector on the lines of credit guarantee schemes implemented in the MSME sector. [Action: Ministry of Agriculture and State Governments; Para 4.4 (ii)]
Annex 1 Evolution of Priority Sector Lending Guidelines in Agriculture 1. Introduction of Priority Sector Lending 1.1 The National Credit Council in its meeting held on July 24, 1968 emphasized the urgency for commercial banks to increase their involvement in financing the priority sector comprising agriculture and Small-Scale Industry (SSI). Further emphasis on the same was reflected in the Reserve Bank of India’s credit policy for the year 1967-68. 1.2. The description of the priority sectors was formalised in 1972 based on the report submitted by the Informal Study Group on Statistics relating to Advances to the Priority Sectors constituted by the Reserve Bank in 1971. Although initially there was no specific target fixed in respect of priority sector lending, in November 1974 the banks were advised to raise the share of these sectors in their aggregate advances to the level of 33.33% by March 1979. 1.3. In November 1978, two objectives, focused towards rural credit were given to the commercial banks in the private sector: -
to deploy a minimum of 33.33% of their total advances towards priority sectors by March 31, 1980 and draw a time-bound programme for achieving the target. -
to achieve a credit deposit ratio of at least 60% through their rural and semi-urban branches separately within a time-bound programme. 1.4. The Reserve Bank of India in 1980 implemented the recommendations of the ‘Report of the Working Group on the Modalities of Implementation of the Priority Sector Lending and the 20-point Economic Programme by Banks’ for achieving the target of priority sector lending at 40% of aggregate bank advances by 1985 and for ensuring that a substantial portion of the enhanced flow of resources is directed to the weaker sections amongst them. i. Overall target for priority sectors: While it was not considered appropriate to fix any annual target within the overall target of 40% to be achieved by 1985, banks were advised to ensure that a minimum of 40% of additional credit every year flows to the priority sectors. ii. Minimum target for lending to the agricultural sector: In view of the prominent position that agriculture occupied in the national economy, banks were advised to ensure that at least 40% of the advances to the priority sector should be extended to agriculture and allied activities, i.e., advances to the agricultural sector should be at least 16% of the total advances by 1985. iii. Sub-target for ‘Weaker Sections’ in agriculture and small-scale industry: In order to ensure that the underprivileged sections in the priority sectors are given proper attention by banks in credit allocation, the concept of ‘weaker sections’ comprising of agriculture and small-scale industries was introduced. The ‘weaker sections’ in agriculture and allied sector comprised of: -
Small and marginal farmers with land holdings of 5 acres and less and landless labourers; -
Persons engaged in allied activities whose borrowal limits for such activities not exceeding ₹10,000/- 1.5. Subsequent policies recognized the increasing need for financing agricultural operations for increasing food grains productions, and therefore, banks were directed to extend direct finance to agriculture (including allied activities) to at least 15% of the total credit by March 1985, 16% by March 1987 and 17% by March 1989. 2. Categorization of Agriculture as Direct and Indirect Finance In 1983, agricultural credit was categorized under two broad heads, viz., Direct and Indirect. The list of items under direct and indirect finance in agriculture were prescribed as under: 2.1 Direct finance to farmers for agricultural purposes i. Short-term loans for raising crops and advances upto ₹5,000/- to farmers against pledge/hypothecation of agricultural produce not exceeding 3 months; ii. Medium and long-term loans provided directly to farmers for financing production and development needs such as: a. Purchase of agricultural implements and machinery - farm machinery like tractors, drillers, power tillers etc., transport equipment like trucks, bullock cart etc. and purchase of plough animals. b. Development of irrigation potential through – -
construction of shallow and deep tube wells, tanks etc. and purchase of drilling units. -
construction of deepening, clearing of surface wells, boring of wells, electrification of wells, purchase of oil engines and installation of electric motor and pumps. -
purchase and installation of turbine pumps, construction of field channels (open as well as underground) etc. -
construction of lift irrigation project. -
installation of sprinkler irrigation system. c. Reclamation and Land Development Schemes – Bunding of farmlands, levelling of land terracing, conversion of dry paddy lands into wet irrigable paddy lands, development of farm drainage, reclamation of soil lands and prevention of salinization, reclamation of ravine lands, purchase of bulldozers etc. d. Construction of farm buildings and structures such as bullock sheds, implement sheds, tractor and tractor sheds, farm stores, etc. e. Construction and running of storage facilities such as warehouses, godowns, silos and cold storages. f. Production and processing of hybrid seeds of crops. g. Payment of irrigation charges for hired water of wells and tube wells, canal water charges, maintenance and upkeep of oil engines and electric motors, payment of labour charges, electricity charges, marketing charges, service charges to Custom Service Units, payment of development cess, etc. h. Other types of direct finance to farmers: • Short-term loans (a) to non-traditional plantation and horticulture, (b) for allied activities such as dairying, fishery, piggery, poultry, bee-keeping etc. • Medium and long-term loans (a) development loans to all plantations, horticulture, forestry etc. (b) development loans for allied activities, viz., -
Development of dairying and animal husbandry in all aspects; -
Development for fisheries in all its aspects: from fish catching to stage of export, financing of equipment necessary for deep sea fishing, rehabilitation of tanks (fresh water fishing), fish breeding, etc.; -
Development of poultry, piggery, etc. in all its aspects including erection of poultry houses, pig houses, bee-keeping etc.; -
Development and maintenance of stud farms, sericulture, etc. However, breeding of race horses cannot be classified here. 2.2 Indirect Finance to Agriculture i. Credit for financing the distribution of fertilisers, pesticides, seeds etc. ii. Loans to Electricity Boards for reimbursing the expenditure already incurred by them for providing low tension connections from step-down point to individual farmer, for energising their wells. iii. Loans to farmers through PACS, FSS and LAMPS. iv. Other types of indirect finance such as: -
Finance for hire-purchase schemes for distribution of agricultural machinery and implements. -
Loans for constructions and running of storage facilities-warehouse, godown, silos and cold storages in the producing areas. Loans to cold storages covered by the guarantee of the Deposit Insurance and Credit Guarantee Corporation (DICGC) will be classified under SSI advances. -
Advances to Custom Service Units managed by individuals, institutions or organizations who maintain a fleet of tractors, bulldozers, well-boring equipment, threshers, combines, etc. and undertake work from farmers on contract basis. -
Loans to individuals, institutions or organizations who undertake spraying operations. -
Loans to co-operative marketing societies, co-operative banks for relending to co-operative marketing societies (provided a certificate from the State Co-operative Bank in favour of such loans is produced). -
Loans to co-operative banks of producers (e.g. Aarey Milk Colony Co-operative Bank consisting of licenced cattle owners). -
Financing the farmers indirectly through the co-operative system (otherwise than by subscription to bonds and debentures issues) provided a certificate from the State Co-operative Bank in favour of such loans is produced. -
Loans to Agro-Industries Corporations. -
Advances to the Agricultural Finance Corporation. -
Advances to state-sponsored corporations for onward lending to weaker sections. 3. PSL Agriculture: Review of Eligible Categories over the years In the subsequent years, while the target of 18% of NBC to agriculture sector remained unchanged, several items got added/modified on the list of direct and indirect finance under agriculture as follows: 2001 A. Direct finance i) Revision: The advances against pledge/hypothecation of agricultural produce revised upwards upto ₹1 lakh and period extended upto 6 months ii) Additions: a) Transport of agricultural inputs and farm products; b) Purchase of generator sets for energization of pump sets used for agricultural purposes; c) Loans granted to farmer for establishing cold storages used for storing own produce; d) Development loans to wasteland; e) Bio-gas plants B. Indirect finance i) Revision: Loans upto ₹15 lakhs granted for financing distribution of inputs for the allied activities such as cattle feed, poultry feed etc. ii) Additions: a) Loans to SEBs for Systems Improvement Scheme under Special Project Agriculture (SI-SPA). b) Deposits held by banks in Rural Infrastructure Development Fund (RIDF) maintained with NABARD. c) Deposits held by private sector banks with NABARD in fulfilment of shortfall in attaining priority sector target in March 1996. d) Fifty percent of refinance granted by the sponsor banks to RRBs. e) Subscription to bonds issued by Rural Electrification Corporation (REC) exclusively for financing pump set energization programme in rural and semi-urban areas and for financing System Improvement Programme (SI-SPA). f) Subscriptions to bonds issued by NABARD with the objective of financing exclusively agriculture/allied activities. g) Finance for hire-purchase schemes for distribution of agricultural machinery and implements. h) Loans to individuals, institutions or organizations who undertake spraying operations. i) Finance extended to dealers in drip irrigation/sprinkler irrigation system/agricultural machinery, subject to the following conditions: - The dealer should be in the rural/semi-urban areas. - He should be dealing exclusively in such items or if dealing in other products, should be maintaining separate and distinct records in respect of such items. - A ceiling of upto ₹10 lakhs per dealer should be observed. j) Loans to National Co-operative Development Council (NCDC) for on-lending to the Co-operative sector for purposes coming under the priority sector. k) Loans to farmers for purchase of shares in Co-operative Sugar Mills and Sugar Mills set up as Joint Stock Companies and other agro-based processing units. l) Loans to Arthias (commission agents in rural/semi-urban areas functioning in markets/mandies) for meeting their working capital requirements on account of credit extended to farmers for supply of inputs. m) Lending to Non-Banking Finance Companies (NBFCs) for on-lending to agriculture | 2002 A. Direct finance i) Revision: Advances against pledge/hypothecation of agricultural produce under short term loans was revised upwards to ₹5 lakhs for a period not exceeding 12 months ii) Additions: a) Financing of small and marginal farmers for purchase of land for agricultural purposes, and b) Financing setting up Agriclinics and Agribusiness Centres by agriculture graduates were included. B. Indirect finance i) Revision: a) loans granted for financing distribution of inputs for the allied activities was raised from ₹15 lakh to ₹25 lakh. b) The ceiling for finance extended to dealers in drip irrigation/sprinkler irrigation system/agricultural machinery was increased from ₹10 lakh to ₹20 lakh per borrower. ii) Removed items: a) Deposits held by private sector banks with NABARD in fulfilment of shortfall in attaining priority sector target in March 1996 b) 50% of refinance granted by the sponsor banks to RRBs c) Subscription of bonds issued by Rural Electrification Corporation (REC) exclusively for financing pump set energisation programme in rural and semi-urban areas and for financing System Improvement Programme (SI-SPA) | 2004 A. Direct finance: i) Addition: Investment by banks in securitised assets which represent direct advances to agriculture. B. Indirect finance i) Modifications: a) Loans for constructions and running of storage facilities irrespective of their location. b) Under finance extended to dealers in drip irrigation/sprinkler irrigation system, the dealer should be dealing exclusively in such items or if dealing with other products, should be maintaining separate and distinct records in respect of such items. ii) Additions – Investment by banks in securitised assets, which represent indirect advances to agriculture. | 2005 A. Direct finance i) Revision – Limit of advances against pledge/hypothecation of agricultural produce under short-term loan raised from ₹5 lakh to ₹10 lakh B. Indirect finance i) Revision – a) Loans for financing distribution of inputs for the allied activities such as cattle feed, poultry feed etc. revised upwards from ₹25 lakh to ₹40 lakh. b) The ceiling on finance extended to dealers in drip irrigation/sprinkler irrigation system/agricultural machinery was revised upwards to ₹ 30 lakh from ₹ 20 lakh ii) Additions/Modifications - a) The investments made by banks on or after April 1, 2005 in the bonds issued by REC shall not be eligible for classification under priority sector lending and such investments which have already been made by banks up to March 31, 2005 would cease to be eligible for classification under PSL with effect from April 1, 2006. b) Subscriptions to bonds issued by NABARD with the objective of financing exclusively agriculture/allied activities. However, the investments made by banks in such bonds issued by NABARD shall not be eligible for classification under PSL with effect from April 1, 2007. | 2006 A. Direct finance i) Additions/modifications – The investment by banks in securitised assets which represent direct advances to agriculture, provided the securitised assets are originated by banks and financial institutions. B. Indirect finance Additions - a) Loans to State Electricity Boards for reimbursing the expenditure already incurred by them for providing low tension connection from step-down point to individual farmers for energising their wells. b) Loans to power distribution corporations/companies, emerging out of bifurcation/restructuring o SEBs, for reimbursing the expenditure already incurred by them for providing low tension connection from step-down point to individual farmers for energising their wells. c) Investment by banks in securitised assets, which represent indirect advances to agriculture, provided the securitised assets are originated by banks and financial institutions. d) 50% of the credit outstanding under loans for general purposes under General Credit cards (GCC) | 2007 - The guidelines on priority sector were revised based on the recommendations made by the Internal Working Group headed by C.S. Murthy. Accordingly, it was decided to include only those sectors as a part of the priority sector, which impact large sections of the population, the weaker sectors which are employment-intensive such as agriculture, and tiny and small enterprises. A. Direct finance i) Loans to Self Help Groups (SHGs) and Joint Liability Groups (JLGs); ii) Loans to distressed farmers indebted to non-institutional lenders, against appropriate collateral or group security; iii) Finance to corporates, partnerships firms and institutions for agriculture and allied activities upto ₹1 crore. B. Indirect finance i) The finance for setting up of Agriclinics and Agribusiness Centres was classified under indirect finance. ii) Two-third of loans to entities in excess of ₹1 crore in aggregate per borrower for agriculture and allied activities; iii) Loans to food and agro-based processing units with investments in plant and machinery upto ₹10 crore; iv) Existing investments as on March 31, 2007, made by banks in special bonds issued by NABARD with the objective of financing exclusively agriculture/allied activities may be classified as indirect finance to agriculture till the date of maturity of such bonds or March 31, 2010, whichever is earlier. Fresh investments in such special bonds made after March 2007 will, however, not be eligible for such classification. v) SHGs/JLGs included loans to Arthias. vi) Deposits placed in RIDF with NABARD, loans already disbursed and outstanding as on the date of this circular of State Electricity Boards, loans to National Co-operative Development Corporation (NCDC) for on lending to the co-operative sector for purposes coming under the priority sector will be treated as indirect finance to agriculture till March 31, 2010. vii) Loans granted to NGOs/MFIs for on-lending to individual farmers or their SHGs/JLGs. | 2010 - Two items were added under indirect finance: i) Loans granted to RRBs for on-lending to agriculture and allied activities sector; ii) Overdrafts, upto ₹25,000/- (per account), granted against ‘no frills’ accounts in rural and semi-urban areas. | 2011 - Certain loans were listed as not eligible for classification as direct/indirect finance to agriculture: i) Loans sanctioned w.e.f. April 1, 2011 to NBFCs for on-lending. The bank loans extended prior to April 1, 2011 to NBFCs and classified under Priority Sector will continue to be reckoned under Priority Sector till maturity of such loans. ii) Loans sanctioned to NBFCs for on-lending to individuals or other entities against gold jewellery, investments made by banks in securitised assets originated by NBFCs, where the underlying assets are loans against gold jewellery, and purchase/assignment of gold loan portfolio from NBFCs. iii) Loans sanctioned to central/State Co-operative Marketing Federations and State Civil Supplies Corporations. iv) Loans sanctioned to corporate/private companies/sugar companies for financing of receivables of farmers/vendors/traders against their supplies of agricultural produce to such corporate/private companies/sugar companies. | 2012 - Two items were added under direct finance: i) Loans to farmers under Kisan Credit Card Scheme ii) Export credit to farmers for exporting their own farm produce. | 2013 - Limits were enhanced in respect of: i) Loans to farmers against pledge/hypothecation of agricultural produce enhanced from ₹25 lakh to ₹50 lakh under both direct and indirect finance; ii) Loan to dealers/sellers of fertilizers, pesticides, seeds, cattle feed, poultry feed, agricultural implements and other inputs were enhanced to ₹5 crore from ₹1 crore | 4. PSL Agriculture: Existing Dispensation 4.1. During a comprehensive review of priority sector lending by an Internal Working Group set up by RBI in 2014, the focus was changed to ‘credit for agriculture’ instead of earlier approach of ‘credit in agriculture’. Accordingly, during the revision of PSL guidelines in 2015, the distinction between direct and indirect agriculture were dispensed with. Instead, the lending to agriculture sector has been re-defined to include (i) Farm Credit (ii) Agriculture Infrastructure and (iii) Ancillary activities. 4.2. While the categories under direct agriculture got subsumed under farm credit, the categories earlier under indirect agriculture got subsumed under agriculture infrastructure and ancillary activities. Several additional categories were introduced as under: -
Loans to farmer producer organizations were included under farm credit. -
Loans for soil conservation and watershed development. -
Loans for plant tissue culture and agri-biotechnology, seed production, production of bio-pesticides, bio-fertilizer, and vermi composting. -
Loans for Food and Agro-processing up to an aggregate sanctioned limit of ₹100 crore per borrower from the banking system. 4.3. Further, within agriculture, a sub-target of 8% of ANBC or Credit Equivalent Amount of Off-Balance Sheet Exposure, was prescribed for Small and Marginal farmers to be achieved in a phased manner by 2017. While initially the sub-target was prescribed only to domestic scheduled commercial banks, it was made applicable to foreign banks with 20 branches and above from 2018-19 onwards. For the sub-target, small and marginal farmers were defined as under: -
Farmers with landholding of up to 1 hectare are considered as Marginal Farmers. Farmers with a landholding of more than 1 hectare and up to 2 hectares are considered as Small Farmers. -
Landless agricultural labourers, tenant farmers, oral lessees and share-croppers. -
Loans to Self Help Groups (SHGs) or Joint Liability Groups (JLGs), i.e. groups of individual Small and Marginal farmers directly engaged in Agriculture and Allied Activities, provided banks maintain disaggregated data of such loans. -
Loans to Farmers’ Producer Companies of individual farmers, and co-operatives of farmers directly engaged in agriculture and allied activities, where the membership of Small and Marginal Farmers is not less than 75 percent by number and whose land-holding share is also not less than 75 percent of the total land-holding. 5. Priority Sector Lending Certificates (PSLCs) Reserve Bank of India introduced Priority Sector Lending Certificates (PSLC) in April 2016 as a market mechanism to incentivize the banks towards lending to priority sector. The banks with comparative advantage in terms of their expertise in lending to a particular sector could generate surplus through over-achievements of PSL targets and issue PSLCs against the surplus. The PSLCs are of four types i.e., PSLC General, PSLC-Agriculture, PSLC-Micro and PSLC-SF/MF which can be traded through RBI’s e-Kuber platform.
Annex 2 Projected Operated Area 1. Operated Area18 i. The table below shows the operated area (in 000 Ha) for all size groups including small and marginal farmers | Table 1 | | Size Group | 1970-71 | 1976-77 | 1980-81 | 1985-86 | 1990-91 | 1995-96 | 2000-01 | 2005-06 | 2010-11 | 2015-16 | | Marginal | 14599 | 17509 | 19735 | 22042 | 24894 | 28121 | 29814 | 32026 | 35908 | 37960 | | Small | 19282 | 20905 | 23169 | 25708 | 28827 | 30722 | 32139 | 33101 | 35244 | 36435 | | Semi-Medium | 29999 | 32428 | 34645 | 36666 | 38375 | 38953 | 38193 | 37898 | 37705 | 37168 | | Medium | 48234 | 49628 | 48543 | 47144 | 44752 | 41398 | 38217 | 36583 | 33828 | 31367 | | Large | 50064 | 42873 | 37705 | 33002 | 28659 | 24160 | 21072 | 18715 | 16907 | 14212 | | Total | 162178 | 163343 | 163797 | 164562 | 165507 | 163354 | 159435 | 158323 | 159592 | 157142 | ii. The operated area for small and marginal farmers together is shown in the table below: | Table 2 | | Size Group | 1970-71 | 1976-77 | 1980-81 | 1985-86 | 1990-91 | 1995-96 | 2000-01 | 2005-06 | 2010-11 | 2015-16 | | Marginal | 14599 | 17509 | 19735 | 22042 | 24894 | 28121 | 29814 | 32026 | 35908 | 37960 | | Small | 19282 | 20905 | 23169 | 25708 | 28827 | 30722 | 32139 | 33101 | 35244 | 36435 | | Total | 33881 | 38414 | 42904 | 47750 | 53721 | 58843 | 61953 | 65127 | 71152 | 74395 | iii. Based on the above, the operated area for small and marginal farmers in terms of % share is shown in the table below: | Table 3 | | Size Group | 1970-71 | 1976-77 | 1980-81 | 1985-86 | 1990-91 | 1995-96 | 2000-01 | 2005-06 | 2010-11 | 2015-16 | | Marginal | 9.00% | 10.72% | 12.05% | 13.39% | 15.04% | 17.21% | 18.70% | 20.23% | 22.50% | 24.16% | | Small | 11.89% | 12.80% | 14.14% | 15.62% | 17.42% | 18.81% | 20.16% | 20.91% | 22.08% | 23.19% | | Total | 20.89% | 23.52% | 26.19% | 29.02% | 32.46% | 36.02% | 38.86% | 41.14% | 44.58% | 47.34% | 2. Projected Operated Area i. From table 1, we may calculate the CAGR (Compounded Annual Growth Rate) for Total Operated Area based on data for period from 1970-71 to 2015-16. Assuming CAGR be x, we can write the following equation: Assuming that this historical CAGR holds true for the coming years, we can calculate the projected total operated area by 2020-21 using the following equation: ii. Similarly, we may calculate the CAGR for operated area by Small and Marginal Farmers based on data for period from 1970-71 to 2015-16. Assuming CAGR be y, we can write the following equation Assuming that this historical CAGR holds true for the coming years, we can calculate the projected operated area for small and marginal farmers by year 2020-21 using the following equation: Based on the projected values of Total Operated Area and Operated Area by Small and Marginal Farmers we can compute the projected % share of operated area with small and marginal farmers i.e. = 81189/156592 = 51.85%.
Annex 3 Measures taken by GoI to strengthen FPOs To promote FPOs an enabling environment, the Department of Agriculture and Co-operation, Govt of India had brought out a national policy and process guidelines for farmer producer organizations together with the role of Central and State Govt institutions in supporting FPOs in 2013. i. Two initiatives were also announced in the Union Budget 2013-14 to support Farmer Producer Companies (FPCs), viz., support to equity base of FPCs by providing matching equity grants and Credit Guarantee support for facilitating collateral free lending to FPCs. These two schemes have been implemented by Small Farmers Agri-business Consortium (SFAC), a Society promoted by the Department of Agriculture, Cooperation & Farmers Welfare, MoA&FW, Govt. of India. a. The Equity Grant Fund Scheme (EGFS) extends support in the form of matching equity upto ₹1.5 million to eligible FPCs having minimum shareholder membership of 50 farmers to enhance the viability, sustainability and credit worthiness of the FPCs b. The Credit Guarantee Fund Scheme (CGFS) provides a credit guarantee cover to Eligible Lending Institutions (ELI) in respect of loans not exceeding ₹10 million to FPCs defined in Section IXA of the Indian Companies Act, 1956 and having minimum 500 individual shareholders. The objective is to enable these FPCs avail collateral free credit and minimize their lending risk. ii. Further initiatives were announced in the Union Budget 2018-19 to promote FPOs, viz., a. Launching of “Operation Greens” for onions, potato and tomato crops on the lines of “Operation Flood” with an allocation of ₹5 billion to address price fluctuation in vegetables. This is envisaged to promote FPOs, agri-logistics and processing facilities. b. To facilitate an enabling environment for aggregation of farmers into FPOs and take advantage of economies of scale, 100 percent tax exemption for FPOs with annual turnover of upto ₹1 billion for 5 years. iii. The Producers’ Organization Development and Upliftment Corpus (PRODUCE) fund has been set up by the Govt. in NABARD during 2014-15 to promote and nurture FPOs in the initial stage with grant assistance upto ₹40,000/- towards registration and other administration overheads.
Annex 4 FPC under Jeevika in Bihar 1. In Bihar, the average operational landholding size is about 0.39 hectare. Such small farm size limits the investment capacity of the farmer, restricting access to quality inputs, technology and credit needed to operate on a desired level of profitability. More so, they are forced to sell their produce to Intermediaries in the absence of viable consumer market access. 2. The approach of collectivizing farmers into Producer Groups was first initiated as part of Bihar Rural Livelihood Promotion (BRLP) in 2014. The objective was to develop business centric institutions that will continue to have organic links with the community institution architecture of SHGs and federations but will focus more on creating value chains for small farmers and producers by enabling direct market linkage. At the village level, Producer Groups are formed by mobilising 20–100 small farmers depending upon the commodity in focus. Farmer Producer Companies are larger, registered business entities comprising shareholder members ranging from a few hundred to many thousands. These FPCs undertake the responsibility of large-scale aggregation under standard procurement procedures and fair business practices including fair weighing, quality-based pricing and on-time cashless payments. Many of these FPCs are undertaking short-term storage of produce in accredited warehouses to gain lean season price advantage and are using technological solutions including trading on online commodity platforms like National Commodity Exchange (NCDEX) to reach out to multiple markets simultaneously. 3. Model of a successful FPC i.e Aranyak Agri Producer Company Ltd., (AAPCL), Purnea as discussed below serves as a guiding principle for replication. i. Operating in Purnea and Katihar districts, a region known for winter season maize in India, the company has established a farmer centric maize aggregation and marketing model delivering constantly higher price realization for member farmers while turning in higher profits with every passing year. ii. AAPCL disrupted the traditional system of maize marketing with village level PGs acting as aggregation and quality control hubs for harvested maize. Apart from providing 15–20% higher prices to farmers, the PC has made profits to the tune of INR 6.3 million in its first 2 years of active operation. The intervention clearly indicates that provided the right technical assistance and handholding support, rural communities, especially small farmer’s organizations, can emerge as credible market players for specific commodities and value chains. 4. Lessons learnt and issues for wider replicability -
Initial handholding support in form of high-quality technical assistance and on-ground extension is important for developing successful FPOs. -
Pre-existing social capital strengthens the overall ecosystem for FPOs. In Bihar, the presence of SHGs and higher federations ensured that there was already a cohesive social base available. -
It is important to use simple and innovative technological solutions to tackle issues of traditional market systems. Solutions like daily pricing information to members via mobile phones and utilization of online trading platforms to reach out to new market can bring significant results
Annex 5 List of Charts 1.1 Direct Agricultural Credit as percentage of Agricultural GDP (at Current Prices) 1.2 Percentage share of outstanding debt of cultivator household 1.3 Distribution of Agricultural Households (who have taken loan) by source of loan 1.4 Agency-wise share in total agricultural credit outstanding as on March 31, 2017 1.5 State-wise percentage share of banks in Total Agricultural Credit outstanding as on March 31, 2017 1.6 Trend in Loans and Clients by NBFC-MFIs 1.7 Distribution of Agriculture and Non-Agriculture Loan Portfolio of NBFC-MFIs 1.8 State-wise Total Agri-Credit outstanding (SCBs) as percentage of State Agri-GDP 1.9 Allocation of Priority Sector Shortfall to various funds (percentage share) 1.10 Crop & Allied percentage share in total agri-credit o/s (SCBs and RRBs) and GVO 1.11 State-wise percentage share in overall crop loan o/s (SCBs and RRBs) and crop GVO 1.12 State-wise ratio of crop loan outstanding (SCBs and RRBs) to crop GVO 1.13 State-wise ratio of crop loan disbursed (SCBs) to Input requirements 1.14 State-wise percentage share in overall Allied Loan outstanding (SCBs and RRBs) and overall Allied GVO 1.15 State-wise ratio of allied loan o/s (SCBs and RRBs) to allied GVO 2.1 Year-wise Agri-PSL credit o/s (SCBs excluding RRBs) and achievements against Agri-PSL target 2.2 Year-wise SMF credit o/s (SCBs excluding RRBs) and achievement against PSL sub-target for SMF 2.3 State-wise percentage share of population of SMF, number of loan accounts and loan outstanding 2.4 Trend in percentage share of Crop related Production vis-a-vis Investment Credit outstanding 2.5 Year-wise trend in Capital Formation in Agriculture & Allied Sector 2.6 Bank category-wise share in operative KCC and Amount outstanding as on March 31, 2019 2.7 Year-wise performance of KCC in terms of operative cards, amount outstanding and its growth 2.8 KCC vis-a-vis PSL Crop Loan (for PSBs and Pvt.SBs) 2.9 SHGs financed and amount disbursed during the year 2.10 Number of JLGs and Loan disbursed during the year 2.11 Typology of FPOs promoted by NABARD 3.1 All-India rainfall performance 3.2 Agriculture produce price and margin (All-India) 3.3 Y-o-Y growth in Direct Institutional Credit for Agriculture and Allied Activities 3.4 Agriculture Sector Non Performing Assets 3.5 State-wise Agriculture Sector NPA trends List of Tables 1.1 Status of CLR for states and Union Territories 3.1 Comparison of state level loan waivers since 2014 3.2 Fiscal impact of states’ farm loan waiver programs
Annex 6 Meetings 1. The IWG held two meetings; the first meeting was held on January 30, 2019 and second meeting was held on March 06, 2019. Besides these meetings, some members of the IWG and Secretariat held several rounds of consultations and meetings with Dr. Ashok Gulati and Ms. Ritika Juneja. The IWG Secretariat had held discussions with NABARD officials and bankers. 2. A three member team of IWG undertook a short visit to China and had meetings with officials from several institutions in China. 3. Few members of IWG and Secretariat held meetings with selected regional offices through video conference in which Lead District Managers and District Development Managers participated. Presentations 1. Shri Jatin Singh, MD and Shri Sudhakar Manda, Head of Remote Sensing from Skymet Weather Services gave presentation on ‘Rural Lending Solutions’ which includes digital diaries capturing identity and land ownership details of farmers, crops grown etc. The banks can make use of the digital diaries to process the loan application faster and bring efficiency in credit delivery. 2. Dr. Purvi Mehta, Deputy Director, Head of Asia for Agriculture, Bill & Melinda Gates Foundation gave a presentation on ‘Inclusivity in Agricultural Credit’ and discussed about the multiple credit needs of the farmer and highlighted the role of FPOs in supporting the farmers. 3. Presentations by Arya Collateral Limited on Movable Warehouses and Cold Storages and CropIn Ltd on Agri-Tech Solutions were also made.
Annex 7 REFERENCES 1. Shylendra, H., S. 1995. Farm Loan Waivers: A Distributional and Impact Analysis of the Agricultural and Rural Debt Relief Scheme, 1990 2. Kanz, M. 2012. What Does Debt Relief Do for Development? Evidence from India's Bailout Program for Highly-Indebted Rural Households 3. Kanz, M., and Giné, X. 2017. The economic effects of a borrower bailout: Evidence from an emerging market 4. Mukherjee, S., Subramanium, K., and Tantri, P. 2017. Borrower Distress and Debt Relief: Evidence from a Natural Experiment 5. Raj, D., S., and Prabhu, E., A. 2018. Agricultural Loan Waiver: A Case Study of Tamil Nadu’s Scheme 6. Raghumanda, R., Shankar, R., and Singh, S. 2017. RBI Mint Street Memo: Agriculture Loan Bank Accounts – A Waiver Scenario Analysis 7. State Finances: A Study of Budgets of 2017-18 and 2018-19 8. Ramakumar,R. 2017. Lessons from Agricultural Debt Waiver and Debt Relief Scheme of 2008
ABBREVIATIONS | ACP | Annual Credit Plan | | ADBC | Agricultural Development Bank of China | | ADWDRS | Agricultural Debt Waiver and Debt Relief Scheme | | AH&F | Animal Husbandry & Fisheries | | AIDIS | All India Debt and Investment Survey | | AIRCSC | All India Rural Credit Survey Committee | | ANBC | Adjusted Net Bank Credit | | APMC | Agricultural Produce Market Committee | | ARDRS | Agricultural and Rural Debt Relief Scheme | | BCs | Business Correspondents | | BFs | Business Facilitators | | BOCF | Bank of China Fullerton | | BRLP | Bihar Rural Livelihoods Promotion | | CAGR | Compounded Annual Growth Rate | | CBIRC | Chinese Banking and Insurance Regulatory Commission | | CBS | Core Banking Solutions | | CGFS | Credit Guarantee Fund Scheme | | CMIE | Centre for Monitoring of Indian Economy | | DAY-NRLM | Deen Dayal Antyodaya Yojana–National Rural Livelihood Mission | | DBT | Direct Benefit Transfer | | DCCBs | District Central Cooperative Banks | | DFS | Department of Financial Services | | DICGC | Deposit Insurance and Credit Guarantee Corporation | | DILRMP | Digital India Land Records Modernization Programme | | DLTC | District Level Technical Committee | | ECA | Essential Commodities Act | | EGFS | Equity Grant Fund Scheme | | ELI | Eligible Lending Institutions | | FI | Financial Inclusion | | FL | Financial Literacy | | FPCs | Farmers' Producer Companies | | FPOs | Farmers' Producer Organizations | | FSS | Farmers’ Service Societies | | GCC | General Credit card | | GCF | Gross Capital Formation | | GDP | Gross Domestic Product | | GFD | Gross Fiscal Deficit | | GLC | Ground Level Credit | | GoI | Government of India | | GSDP | Gross State Domestic Product | | GST | Goods and Services Tax | | GVA | Gross Value Added | | GVO | Gross Value Output | | IBA | Indian Banks Association | | ICRIER | Indian Council for Research on International Economic Relations | | ICT | Information and Communications Technology | | ILO | International Labour Organization | | ISS | Interest Subvention Scheme | | IWG | Internal Working Group | | JLG | Joint Liability Group | | KCC | Kisan Credit Card | | LAMPS | Large-sized Adivasi Multipurpose Societies | | MFIs | Micro Finance Institutions | | MFIN | Micro Finance Institutions Network | | MIS | Management Information System | | MoA&FW | Ministry of Agriculture, Cooperation and Farmers Welfare | | MoRD | Ministry of Rural Development | | MOSPI | Ministry of Statistics and Programme Implementation | | MPC | Monetary Policy Committee | | MSME | Micro, Small and Medium Enterprises | | MSP | Minimum Support Price | | NABARD | National Bank for Agriculture and Rural Development | | NAFIS | NABARD All India Rural Financial Inclusion Survey | | NAM | National Agriculture Market | | NBFC | Non-Banking Financial Company | | NBFC–MFIs | Non-Banking Financial Company-Micro Finance Institutions | | NCDC | National Co-operative Development Council | | NCDEX | National Commodity & Derivatives Exchange | | NGOs | Non-Governmental Organizations | | NITI | National Institution for Transforming India | | NPA | Non-Performing Asset | | NSSO | National Sample Survey Office | | OECD | Organization for Economic Co-operation and Development | | PACS | Primary Agricultural Credit Society | | PBC | People's Bank of China | | PC | Producer Company | | POs | Producer Organizations | | PRI | Prompt Repayment Incentive | | PRODUCE | Producers’ Organization Development and Upliftment Corpus | | PSL | Priority Sector Lending | | PSLC | Priority Sector Lending Certificates | | RCCI | Rural Cooperative Credit Institution | | REC | Rural Electrification Corporation | | RIDF | Rural Infrastructure Development Fund | | RMB | Renminbi | | RRBs | Regional Rural Banks | | SAA | Service Area Approach | | SACGA | State Agricultural Credit Guarantee Alliance | | SCBs | Scheduled Commercial Banks | | SEBs | State Electricity Boards | | SFAC | Small Farmers Agri-business Consortium | | SFBs | Small Finance Banks | | SGSY | Swarnajayanti Gram Swarozgar Yojana | | SHG | Self-Help Group | | SHG-BLP | Self Help Group - Bank Linkage Programme | | SI-SPA | Systems Improvement Scheme under Special Project Agriculture | | SLTC | State Level Technical Committee | | SME | Small and Medium Enterprises | | SMF | Small and Marginal Farmers | | SoF | Scale of Finance | | SSI | Small Scale Industries | | StCBs | State Cooperative Banks | | UCB | Urban Cooperative Bank | | WDRA | Warehousing Development and Regulatory Authority | | WTO | World Trade Organization |
|