7.1 Access to safe, easy and affordable credit and other financial services by the poor and vulnerable groups, disadvantaged areas and lagging sectors is recognised as a pre-condition for accelerating growth and reducing income disparities and poverty. Access to a well-functioning financial system, by creating equal opportunities, enables economically and socially excluded people to integrate better into the economy and actively contribute to development and protect themselves against economic shocks. Despite the broad international consensus regarding the importance of access to finance as a crucial poverty alleviation tool1 , it is estimated that globally over two billion people are currently excluded from access to financial services (United Nations, 2006a). In most developing countries, a large segment of society, particularly low-income people, has very little access to financial services, both formal and semi-formal. As a consequence, many of them have to necessarily depend either on their own or informal sources of finance and generally at an unreasonably high cost. The situation is worse in most least developed countries (LDCs), where more than 90 per cent of the population is excluded from access to the formal financial system (United Nations, 2006a).
7.2 Theories of development advocate that financial development creates enabling conditions for growth through either a ‘supply-leading’ (financial development spurs growth) or a ‘demand-following’ (growth generates demand for financial products) channel. Earlier theories of development hypothesised that a rise in inequality was inevitable in the early stages of development. The early literature on the subject focussed on the need to develop an extensive financial system that could tap savings and then channel the funds so generated to a wide spectrum of activities. The modern development theory perceives the lack of access to finance as a critical factor responsible for persistent income inequality as well as slower growth. A large body of empirical literature suggests that developing the financial sector and improving access to finance may accelerate economic growth along with a reduction in income inequality and poverty. Without an inclusive financial system, poor individuals and small enterprises have to rely on their own limited savings and earnings to invest in their education and entrepreneurship to take advantage of growth opportunities (World Bank, 2008).
7.3 In an underdeveloped financial system, certain segments of the population experience difficulties in obtaining appropriate access to financial services. As a result, they have to resort to high cost informal sources such as moneylenders. This is particularly true for the sporadic financing requirements of low income households for non-productive consumption pur poses and other emergency requirements such as medical expenditure. Benefits of growth, therefore, tend to concentrate in the hands of those already served by the formal financial system. In mature financial systems on the other hand, financial institutions develop appraisal techniques and information gathering and sharing mechanisms, which then enable them to finance even those activities or firms or individuals that are at the margin, thereby promoting their growth-inducing productive activities. However, developed financial systems also encounter difficulties in serving low income groups for financing their consumption and other needs. The availability of external finance to potential entrepreneurs and small firms enables new entrants leading to increased competition to incumbents. This, in turn, encourages entrepreneurship and productivity.
7.4 Inclusive finance, including safe savings, appropriately designed loans for poor and low-income households and for micro, small and medium-sized enterprises, and appropriate insurance and payments services can help people to enhance incomes, acquire capital, manage risk, and come out of poverty (United Nations, 2006b). It has been well recognised that access to financial services facilitates making and receiving financial payments and reduces transaction costs. Furthermore, access to financial services contributes to higher production and social protection, as the financial sector – through stored savings, credit and insurance – serves as a measure of crisis mitigation. Broader access to financial services has, however, attracted less attention despite the emphasis it has received in the theory.
7.5 In India, growth with equity has been the central objective right from the inception of the planning process. Accordingly, over the years, initiatives have been taken continuously by the Government and the Reserve Bank to address the issue of inclusive growth. Notwithstanding the rapid increase in overall GDP and per capita income in recent years, a significant proportion of the population in both rural and urban areas still experiences difficulties in accessing the formal financial system. Recent concerns have arisen from an inadequate reduction in poverty levels, sectoral divergences in growth and employment opportunities and tardy improvement in other social indicators, despite higher economic growth. The Eleventh Five Year Plan, therefore, re-emphasised the need for a more inclusive growth in order to ensure that the per capita income growth is more broad-based. The farming, micro, small and medium enterprises have immense potential to play a critical role in achieving the objective of faster and more inclusive growth as these sectors contribute to output and employment generation in a significant way with capacity to expand regionally diversified production and generating widely dispersed off-farm employment.
7.6 Bringing the larger population within the structured and organised financial system has explicitly been on the agenda of the Reserve Bank since 2005 (Mohan, 2006). While several central banks focus solely on inflation, many in developed and emerging economies alike, including India, also focus on growth. There is currently a perception that there are a large number of people, potential entrepreneurs, small enterprises and others, who may not have adequate access to the financial sector, which could lead to their marginalisation and denial of opportunity to grow and prosper. The Reserve Bank has, therefore, introduced various new measures to encourage the expansion of financial coverage in the country. Financial inclusion is considered essential for fostering economic growth in a more inclusive fashion.
7.7 In a fast growing economy, an important issue is how to sustain and diversify growth so that the risk to growth process is diversified across sectors. It is in this context that the search for potential sources of incremental growth, i.e., sectors that have difficulty in accessing financial services, assumes importance. Therefore, including such segments or sectors would, on the one hand, unleash their productive capacities, and on the other, would augment domestic demand on a sustainable basis driven by income and consumption growth from such sectors. This would also have strong inter-sectoral linkages.
7.8 Against the above backdrop, this chapter, drawing upon the theoretical developments, country experiences and empirical findings, seeks to examine key issues in financial inclusion/exclusion in India. Section II discusses the conceptual framework and measurement related issues. The nature, causes and consequences of financial exclusion are discussed in Section III. Section IV details the policy initiatives undertaken for promoting financial inclusion in India. Section V analyses the nature and extent of financial inclusion/exclusion in India. Operating cost of financial inclusion and the role of technology in financial inclusion are discussed in Section VI. Drawing from country experiences and empirical analysis in the Indian context, Section VII, as a way forward, makes some suggestions to promote financial inclusion in India. Section VIII concludes the chapter.
II. ACCESS TO FINANCE: CONCEPTUAL
FRAMEWORK
Concept and Definition
7.9 Defining financial inclusion is considered crucial from the viewpoint of developing a conceptual framework and identifying the underlying factors that lead to low level of access to the financial system. A review of literature suggests that there is no universally accepted definition of financial inclusion. As measuring inclusion is perceived to be difficult, financial inclusion is generally defined in terms of exclusion from the financial system. Early discussion on financial exclusion was preceded by social exclusion and focussed predominantly on the issue of geographical access to financial services, in particular banking outlets (Leyshon and Thrift, 1993). However, financial exclusion is not just about physical access caused by the changing topography of financial services. Therefore, the debate has now broadened to include all types of people who make little or no use of financial services and the processes of financial exclusion (Ford and Rowlingson, 1996; Kempson and Whyley, 1998).
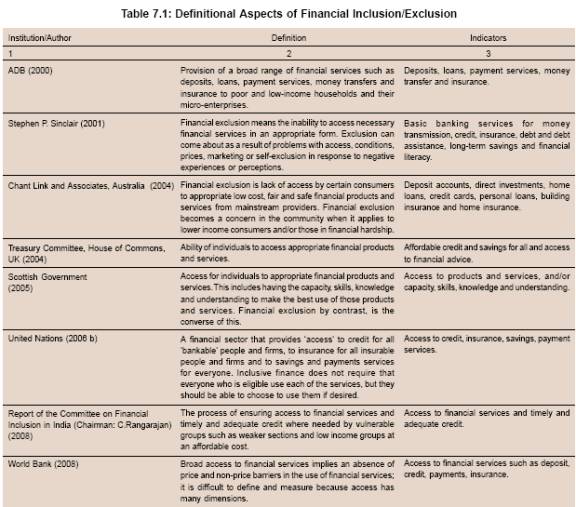
7.10 The definitional emphasis of financial inclusion varies across countries and geographies,depending on the level of social, economic and financial development; the structure of stake holding in the financial sector; socio-economic characteristics of the financially excluded segments; and also the extent of the recognition of the problem by authorities or governments. Broadly, financial exclusion is construed as the inability to access necessary financial services in an appropriate form due to problems associated with access, conditions, prices, marketing or self-exclusion in response to discouraging experiences or perceptions of individuals/entities.
7.11 Definitions of financial exclusion in the literature vary depending on the dimensions such as ‘breadth’, ‘focus’ and ‘degree’ of exclusion. The ‘breadth’ dimension is the broadest of all definitions linking financial exclusion to social exclusion which defines financial exclusion as the processes that prevent poor and disadvantaged social groups from gaining access to the financial system (Leyshon and Thrift, 1995). The ‘focus’ dimension is in the middle of the spectrum that links financial exclusion to other dimensions of exclusion. It defines financial exclusion as the potential difficulties faced by some segments of population in accessing mainstream financial services such as bank accounts/home insurance (Meadows et al., 2004). The definitions laying emphasis on the ‘focus’ also vary significantly to include various segments of population such as individuals, households, communities, and businesses. The ‘degree’ dimension, which is the narrowest of all definitions of financial exclusion, defines financial exclusion as exclusion from particular sources of credit and other financial services including insurance, bill-payment services and accessible and appropriate deposit accounts (Rogaly, 1999). Finally, definitions of financial exclusion vary considerably according to the dimensions such as the concept of relativity, i.e., financial exclusion defined relative to some standard (i.e., inclusion). This line of thinking defines the problem of financial exclusion as that emanating from increased inclusion, leaving a minority of individuals and households behind (Kempson et al., 2000). Thus, there exists duality of hyper inclusion with some having access to a range of financial products and at the same time a minority lacking even the basic banking services. This phenomenon is observed mostly in developed countries with high degree of financial development.
7.12 Over the years, several definitions of financial inclusion/exclusion have evolved (Table 7.1). The working or operational definitions of financial exclusion generally focus on ownership or access to particular financial products and services. The focus narrows down mainly to the products and services provided by the mainstream financial service providers (Meadows et al., 2004). Such financial products may include money transmission, home insurance, short and long-term credit and savings (Bridgeman, 1999). Furthermore, the operational definitions have also evolved from the underlying public policy concerns that many people, particularly those living on low income, cannot access mainstream financial products such as bank accounts and low cost loans, which, in turn, imposes real costs on them -often the most vulnerable people (H.M. Treasury, 2004).
7.13 The review of literature suggests that the most operational definitions are context-specific, originating from country-specific problems of financial exclusion and socio-economic conditions. Thus, the context-specific dimensions of financial exclusion assume importance from the public policy perspective. Furthermore, the definitions have witnessed a shift in emphasis from the earlier ones, which defined financial inclusion and exclusion largely in terms of physical access, to a wider definition covering access to and use and understanding of products and services.
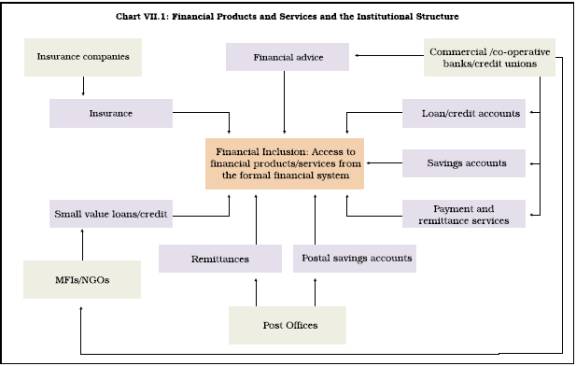
7.14 The operational definition of financial inclusion, based on the access to financial products or services, also underscores the role of financial institutions or service providers involved in the process. The anatomy of various financial products or services and the institutional structure is schematically presented in Chart VII.1.
Measurement of Financial Inclusion/Exclusion
7.15 While the importance of financial inclusion has been widely accepted, much less is known about how inclusive the financial systems are and who has access to which financial services. The literature on financial inclusion lacks a comprehensive measure that can be used to indicate the extent of financial inclusion across countries. Though indicators of the depth of banking system, capital markets, and insurance sector are widely available, there is less information available about the degree of financial inclusiveness. Lack of information is more conspicuous in developing countries where there is little systematic information on who is served by the formal financial sector, which financial institutions or services are the most effective at supporting access by poor households and small enterprises, or what practical and policy barriers may be hindering the accessibility. Individual indicators, viz., number of bank accounts and number of bank branches that are generally used as measures of financial inclusion, can provide only partial information on the level of financial inclusion in an economy. Financial services or products rendered by banks, postal savings banks, credit unions, finance companies, micro-finance institutions (MFIs), and other formal and quasi-formal non-bank institutions generally form the basis for measuring the financial inclusion.
7.16 It is often observed that people may have access to financial services, but may not wish to use them. Such voluntarily excluded persons, it is argued, should be included in measures of access even if they do not use financial services. However, even among the ‘voluntarily excluded’, this may in reality be because such services are unaffordable, unsuited to their needs, or because the potential users fear that they will be declined upon request. Among the ‘involuntarily excluded’ from services such as credit, some represent high credit risk that lenders are discouraged to prudently serve them.
7.17 There are various measures of access to finance. For instance, access to finance can be measured in terms of access to certain institutions (such as banks, insurance companies, and MFIs or in terms of access to the functions that such institutions perform, or the services that they provide (such as payments services, savings or loans and credits). Yet another approach is to look at details on the uses of specific financial products such as debit cards, credit cards, life insurance and home mortgages, among others. However, these are highly country-specific. The core access indicators often used are generally based on institutional distinctions concerning specifically the degree of formality of the financial institutions (World Bank, 2008).
7.18 Access covers a range of institutions from the more formal to less formal. At the one end of the spectrum are banks or near banks which are often defined as formal financial institutions which can provide multiple financial services to their clients, including deposits, payments and credit services. The attributes of banks and near banks are broadly comparable across countries. Other formal financial service providers are all other legal entities licensed to provide financial services. They are registered and subject to some reporting requirements. Thus, in the case of credit, this may include consumer finance companies, credit card companies or credit unions. Informal providers of financial services are other organised providers of financial services that are not registered as financial intermediaries and not subject to any oversight. Moneylenders and cheque cashing outlets, which are not regulated financial institutions, belong to this categor y. Based on the above characteristics of the financial service providers, the following measures/indicators can be summarised as the basic indicators used to measure the extent/ magnitude of financial exclusion in a country.
7.19 Core and headline indicators place a given population along a continuum of access, depending on its usage of formal, semi-formal, and informal financial services, and those excluded from the use of financial services. The access to finance could be divided into four segments (i) the proportion of the population that uses a bank or bank like institution; (ii) the population which uses service from non-bank ‘other formal’ financial institutions, but does not use bank services; (iii) the population which only uses services from informal financial service providers; (iv) percentage of population transacting regularly through formal financial instruments; and (v) the population which uses no financial services.
7.20 The second group of core indicators looks in greater detail at the kinds of financial services offered. This functional perspective enables a focus on specific service needs and their gradation in order of priority from less to more developed financial environment. These additional core indicators provide augmented understanding of the nature and depth of financial services. The financial service functions identified to be used as the basis for indicators are: (i) transactions or payment services; (ii) savings (deposit) and investment services; and (iii) loan or credit services. Risk transformation services such as insurance could arguably be added. However, it is conceptually similar to a sophisticated savings and credit product.
7.21 To sum up, no universally accepted definition of financial inclusion is available. Since measuring inclusion is perceived to be difficult, financial inclusion has generally been defined in terms of exclusion from the financial system. The working or operational definitions of financial exclusion generally focus on ownership or access to particular financial products and services.
7.22 There is no single comprehensive measure that can be used to indicate the extent of financial inclusion across economies. Specific indicators such as number of bank accounts, number of bank branches, that are generally used as measures of financial inclusion, can provide only partial information on the level of financial inclusion in an economy. Another approach is to look at details on the uses of specific financial products such as debit cards, credit cards, life insurance, and home mortgages, but these are highly country specific.
III. NATURE, CAUSES AND CONSEQUENCES OF FINANCIAL EXCLUSION
Nature and Causes
7.23 The nature and forms of exclusion and the factors responsible for it are varied and, thus, no single factor could explain the phenomenon. The principal barriers in the expansion of financial services are often identified as physical access, high charges and penalties, conditions attached to products which make them inappropriate or complicated and perceptions of financial service institutions which are thought to be unwelcoming to low income people (Sinclair, 2001). These barriers to inclusion have not been constructed deliberately; they are a result of the structural operation of the financial services industry. Kempson et al. (2000) analyse a range of physical and geographical barriers to financial inclusion and a broad range of other factors that can contribute to financial exclusion for different products and individuals under certain circumstances. A number of ‘dimensions’ or ‘forms’ of financial exclusion have been identified. The critical dimensions of financial exclusion include: (i) access exclusion- restriction of access through the process of risk management (by financial services providers); (ii) condition exclusion - conditions attached to financial products which make them inappropriate for the needs of some segments of population; (iii) price exclusion- some people can only gain access to financial products at prices they cannot afford; (iv) marketing exclusion - some people are effectively excluded by targeted marketing and sales; and (v) self-exclusion - people decide not to opt for a financial product because of the fear of refusal to access by the service providers (Kempson and Whyley, 1999; Kempson et al., 2000; Connolly and Hajaj, 2001).
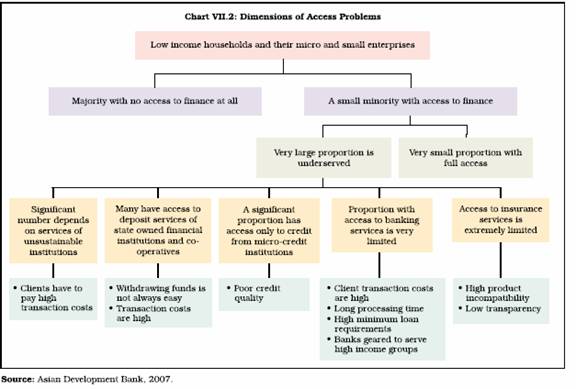
7.24 Measuring an individual’s or household’s usage of a particular financial service at a given time may not reveal whether exclusion is short-term or the result of a long-term process, nor whether access is diminishing or improving (Chant Link and Associates, 2004). Thus, financial exclusion is perceived as an ongoing process in terms of vulnerability to exclusion, rather than simply having access to certain financial services or not. In particular, financial exclusion may be a long-term phenomenon for many consumers or even a life-long process (Connolly and Hajaj, 2001). For families with particular constellations of socioeconomic characteristics, it may extend beyond the lifetime of an individual family member and become inter-generational. It has generally been recognised that it is the poorer sections of the population that do not have access to financial services - formal or informal. However, in many countries, many non-poor individuals, micro, small and medium entrepreneurs also have difficulty in accessing financial services. The most conspicuous dimension is that many of the low-income segments of the population do not have access to even the very basic financial services. Even amongst those who have access to finance, most are underserved in terms of quality and quantity of products and services and significant proportion of low-income households is dependent on unsustainable, subsidy-dependent and poorly performing institutions (Chart VII.2).
7.25 Exclusion may also have resulted from a variety of structural factors such as unavailability of products suiting their requirements, stringent documentation and collateral requirements and increased competition in financial services. There has also been particular emphasis on socio-cultural factors that matter for an individual to access financial services (United Nations, 2006b). Substantial
proportion of households, especially those with low income and those living in rural and remote areas, is at present outside the ambit of the formal financial system in many countries. Literature on financial inclusion/exclusion has identified a number of factors that affect efforts to expand access to financial services (Box VII.1).
7.26 Apart from the supply side factors, demand side factors also have a significant bearing on the extent of financial inclusion. A higher share of population below the poverty line results in lower demand for financial services as the poor may not have savings to place as deposit in savings banks. Thus, low income leads to low demand for financial services, particularly savings products. Likewise, at low levels of development, investment activity may be low and hence, may lead to low demand for credit from banks and other formal financial institutions. However, as poverty levels decline and households move into higher income brackets, their propensity to save increases, which, in turn, leads to higher demand for financial services both for saving and investment purposes.
7.27 Financial inclusion is also influenced by specific credit needs of various segments of the society. The demand for credit by the people arises for a number of activities such as housing, microenterprises, agricultural operations and consumption needs. Owing to difficulties in accessing formal sources of credit, the poor individuals and small and microenterprises usually rely on their personal savings or internal resources to invest in housing, health and education, and entrepreneurial activities to make use of growth opportunities (World Bank, 2008).
7.28 In India, the financially excluded sections comprise largely marginal farmers, landless labourers, oral lessees, self-employed and unorganised sector enterprises, urban slum dwellers, migrants, ethnic minorities and socially excluded groups, senior citizens and women. Some of the important causes of relatively low extension of institutional credit in the rural areas are risk perception, cost of its assessment and management, lack of rural infrastructure, and vast geographical spread of the rural areas with more than half a million villages, some sparsely populated (Mohan, 2006).
Box VII.1 Factors Affecting Access to Financial Services
A number of factors affecting access to financial services have been identified in many countries. These are:
• Gender issues: Access to credit is often limited for women who do not have, or cannot hold title to assets such as land and property or must seek male guarantees to borrow.
• Age factor: Financial service providers usually target the middle of the economically active population, often overlooking the design of appropriate products for older or younger potential customers.
• Legal identity: Lack of legal identities like identity cards, birth certificates or written records often exclude women, ethnic minorities, economic and political refugees and migrant workers from accessing financial services.
• Limited literacy: Limited literacy, particularly financial literacy, i.e., basic mathematics, business finance skills as well as lack of understanding often constrain demand for financial services.
• Place of living: Although effective distance is as much about transportation infrastructure as physical distance, factors like density of population, rural and remote areas, mobility of the population (i.e., highly mobile people with no fixed or formal address), insurgency in a location, etc., also affect access to financial services.
• Psychological and cultural barriers: The feeling that banks are not interested to look into their cause has led to self-exclusion for many of the low income groups. However, cultural and religious barriers to banking have also been observed in some of the countries.
• Social security payments: In those countries where the social security payment system is not linked to the banking system, banking exclusion has been higher.
• Bank charges: In most of the countries, transaction is free as long as the account has sufficient funds to cover the cost of transactions made. However, there are a range of other charges that have a disproportionate effect on people with low income.
• Terms and conditions: Terms and conditions attached to products such as minimum balance requirements and conditions relating to the use of accounts often dissuade people from using such products/services.
• Level of income: Financial status of people is always important in gaining access to financial services. Extremely poor people find it difficult to access financial services even when the services are tailored for them. Perception barriers and income discrimination among potential members in group-lending programmes may exclude the poorer members of the community.
• Type of occupation: Many banks have not developed the capacity to evaluate loan applications of small borrowers and unorganised enterprises and hence tend to deny such loan requests.
• Attractiveness of the product: Both the financial services/products (savings accounts, credit products, payment services and insurance) and how their availability is marketed are crucial in financial inclusion.
References:World Bank, 2008; Asian Development Bank, 2007; and Kempson et al., 2004.
Costs and Consequences of Financial Exclusion
7.29 Broadly, the issue of cost of financial exclusion may be conceived from two angles, which are intertwined. First, the exclusion may have cost for individuals/entities in terms of loss of opportunities to grow in the absence of access to finance or credit. Second, from the societal or the national perspective, exclusion may lead to aggregate loss of output or welfare and the country may not realise its growth potential. The more tangible outcomes of financial exclusion include cost and security issues in managing cash flow and payments, compromised standard of living resulting from lack of access to short-term credit, higher costs associated with using informal credit, increased exposure to unethical, predatory and unregulated providers, vulnerability to uninsured risks, and long-term or extended dependence on welfare as opposed to savings (Chant Link and Associates, 2004).
7.30 Access to a bank account, credit and insurance are now widely regarded as essential supports for personal financial management and for undertaking transactions in modern societies (Speak and Graham, 1999). According to the Treasury Committee, UK (2006), financial exclusion can impose significant costs on individuals, families and society as a whole. These include (i) barriers to employment as employers may require wages to be paid into a bank account; (ii) opportunities to save and borrow can be difficult to access; (iii) owning or obtaining assets can be difficult; (iv) difficulty in smoothening income to cope with shocks; and (v) exclusion from mainstream society.
7.31 In terms of cost to the individuals, financial exclusion leads to higher charges for basic financial transactions like money transfer and expensive credit, besides all round impediments in basic/ minimum transactions involved in earning livelihood and day to day living. It could also lead to denial of access to better products or services that may require a bank account. It exposes the individual to the inherent risk in holding and storing money – operating solely on a cash basis increases vulnerability to loss or theft. Individuals/families could get sucked into a cycle of poverty and exclusion and turn to high cost credit from moneylenders, resulting in greater financial strain and unmanageable debt. At the wider level of the society and the nation, financial exclusion leads to social exclusion, poverty as well as all the other associated economic and social problems. Thus, financial exclusion is often a symptom as well as a cause of poverty. Financial exclusion is not evenly distributed throughout society; it is concentrated among the most disadvantaged groups and communities and, as a result, contributes to a much wider problem of social exclusion.
7.32 A significant portion of demand for credit by rural households arises in order to ease the financial burden of crop failures, illness or death, and health care. In the case of microenterprises, credit may be needed to achieve a reasonable and viable scale of activities. The rising entrepreneurship spanning rural, semi-urban and urban areas, particularly in the unorganised and informal sectors may give rise to large potential demand for credit. The evidence on the demand for credit in India suggests that medical and financial emergencies are the major reasons for household borrowings. Medical emergencies were particularly high for the lowest income quartile (IIMS, 2007)2 . Thus, the difficulty in obtaining finance from formal sources has major social implications.
7.33 Another cost of financial exclusion is the loss of business opportunity for banks, particularly in the medium-term. Banks often avoid extending their services to lower income groups because of initial cost of expanding the coverage which may sometimes exceed the revenue generated from such operations. These business related concerns of banks were, however, meaningful when technology development was at a nascent stage and expanding the coverage of financial services required substantial initial investment. The strides in technology have now reduced the required initial investment in a significant manner. What is required is to explore the appropriate technology which is suitable to socio-economic conditions of the region under consideration. Moreover, availability and usage of financial services by the otherwise excluded population groups would lead to increase in their income levels and savings. This, in turn, would have the potential to increase savings deposits as well as credit demand, implying profitable business for banks in the medium-term.
7.34 Two other factors have often been cited as the consequences of financial exclusion. First, it complicates day-to-day cash flow management -being financially excluded means households, and micro and small enterprises deal entirely in cash and are susceptible to irregular cash flows. Second, lack of financial planning and security in the absence of access to bank accounts and other saving opportunities for people in the unorganised sector limits their options to make provisions for their old age. From the macroeconomic standpoint, being without formal savings can be problematic in two respects. First, people who save by informal means rarely benefit from the interest rate and tax advantages that people using formal methods of savings enjoy. Second, informal saving channels are much less secure than formal saving facilities. Those who can afford it least, suffer the highest risk. The resultant lack of savings and saving avenues means recourse to non-formal lenders such as moneylenders. This, in turn, could lead to two adverse consequences – (a) exposure to higher interest rates charged by informal lenders; and (b) the inability of customers to service the loans or to repay them. As loans from non-formal lenders are often secured against the borrower’s property, this raises the problem of inter-linkage between two apparently separate markets. Judged in this specific context, financial exclusion is a serious concern among low-income households, mainly located in rural areas (Mohan, 2006).
7.35 To sum up, the nature and forms of exclusion and the factors responsible for it are varied and, thus, no single factor could explain the phenomenon. The principal barriers in the expansion of financial services are often identified as physical access, high charges and penalties, conditions attached to products which make them inappropriate or complicated and perceptions of financial service institutions which are thought to be unwelcoming to low income people. There has also been particular emphasis on socio-cultural factors that matter for an individual to access financial service. The most conspicuous dimension of exclusion is that a majority of the low-income population do not have access to the very basic financial services. Even amongst those who have access to finance, most of them are underserved in terms of quality and quantity of products and services. The critical dimensions of financial exclusion include access exclusion, condition exclusion (conditions attached to financial products), price exclusion, and self exclusion because of the fear of refusal to access by the service providers. The financial exclusion process becomes self-reinforcing and can often be an important factor in social exclusion, especially for communities with limited access to financial products, particularly in rural areas. Apart from the above mentioned supply side factors, demand side factors may also significantly affect the extent of financial inclusion. For instance, low level of income and hence low savings would result in lower deposits. Similarly, at low level of income, the ability to borrow is affected because of low repayment capacity and inability to provide collateral. In the Indian context, both demand and supply side factors have an important bearing on the usage of financial/banking services.
7.36 The issue of cost has been conceived from two angles, which are inter-twined. First, the exclusion may have cost on the individuals/entities in terms of loss of opportunities to grow in the absence of access to finance or credit. Second, from the societal or the national perspective, exclusion may lead to aggregate loss of output or welfare and the country may not realise its growth potential. Recognising the implicit and explicit cost of financial exclusion across the globe, many countries have initiated measures to deal with the same.
IV. INITIATIVES FOR FINANCIAL INCLUSION IN INDIA
7.37 As discussed in Chapter III, India has a long history of banking development. After Independence, the major focus of the Government and the Reserve Bank was to develop a sound banking system which could support planned economic development through mobilisation of resources/deposits and channel them into productive sectors. Accordingly, the Government’s desire to use the banking system as an important agent of change was at the core of most policies that were formulated after Independence. The planning strategy recognised the critical role of the availability of credit and financial services to the public at large in the holistic development of the country with the benefits of economic growth being distributed in a democratic manner. In recognition of this role, the authorities modified the policy framework from time to time to ensure that the financial services needs of various segments of the society were met satisfactorily.
7.38 In order to expand the credit and financial services to the wider sections of the population, a wide network of financial institutions has been established over the years. The organised financial system comprising commercial banks, regional rural banks (RRBs), urban co-operative banks (UCBs), primary agricultural credit societies (PACS) and post offices caters to the needs of financial services of the people. Besides, MFIs, self-help groups (SHGs) also meet the financial service requirements of the poorer segments. Furthermore, development of the institutional framework in recent years has focussed on new models of expanding financial services involving credit dispensation using multiple channels such as civil society organisations (CSOs), non-government organisations (NGOs), post offices, farmers’ clubs, and panchayats as business facilitators/correspondents. Specific financial instruments/products were also developed in order to promote financial inclusion.
Overall Approach
7.39 Financial inclusion in the Indian context implies the provision of affordable financial services, viz., access to payments and remittance facilities, savings, loans and insurance services by the formal financial system to those who tend to be excluded. Besides access, emphasis is also placed on affordability (low cost) of financial services such as savings, loan, and remittance to the underprivileged segments of the population. Although the term ‘financial inclusion’ was not in vogue in India then, since the late 1960s both the Government and the Reserve Bank have been concerned about the non-availability of banking facilities to the under-privileged and weaker sections of the society. Accordingly, several initiatives have been taken over time such as nationalisation of banks, prescription of priority sector targets, lending to weaker sections at concessional rates, and initiation of the lead bank scheme. These initiatives were undertaken at different points in time to expand the outreach of banking facilities and increase the flow of credit to the rural areas. However, the broad approach towards financial inclusion followed in India in the 1970s and the 1980s was more oriented towards credit requirements of specific sectors/segments and there was relatively low emphasis on individual/household level inclusion. The Indian financial system essentially catered to the needs of planned development in a mixed-economy framework, where the Government sector had a predominant role in economic activity. The focus of banking policy during the 1990s and up to the early 2000s was more on creating a strong and efficient banking system. However, once the financial health of the banking system was restored, focussed attention was again paid towards promotion of financial inclusion.
7.40 The recent approach focuses on financial inclusion on the individual and household level (Box VII.2). The important difference in the recent focus on financial inclusion is the adoption of market oriented approach that recognises the importance of business consideration of banks and other financial institutions for the long-term sustainability of the process. The Annual Policy Statement for the Year 2005-06 of the Reserve Bank observed that although there had been expansion, greater competition and diversification of ownership of banks leading to both enhanced efficiency and systemic resilience, there were legitimate concerns with regard to the banking practices that tended to exclude vast sections of population, in particular pensioners, self-employed and those employed in the unorganised sector. The Statement further observed that while commercial considerations were important, the banks had been bestowed with several privileges, especially of seeking public deposits on a highly leveraged basis, and therefore, should be obliged to provide banking services to all segments of the population on an equitable basis.
7.41 The broad strategy for financial inclusion in India in recent years comprises the following elements: (i) encouraging penetration into unbanked and backward areas and encouraging agents and intermediaries such as NGOs, MFIs, CSOs and business correspondents (BCs); (ii) focussing on a decentralised strategy by using existing arrangements such as State Level Bankers’ Committee (SLBC) and district consultative committee (DCC) and strengthening local institutions such as co-operatives and RRBs; (iii) using technology for furthering financial inclusion; (iv) advising banks to open a basic banking ‘no frills’ account; (vi) emphasis on financial literacy and credit counselling; and (vii) creating synergies between the formal and informal segments (Thorat, 2008).
7.42 Various initiatives undertaken could broadly be categorised into three phases. In the first phase starting in the late 1960s through the 1980s, the focus was on channelling of credit to the neglected sectors of the economy. Special emphasis was also laid on weaker sections of the society. In the second phase spanning the early 1990s through March 2005, the focus was mainly on strengthening the financial institutions as part of financial sector reforms. Financial inclusion in this phase was encouraged mainly by the introduction of SHG-bank linkage programme in the early 1990s and Kisan Credit Cards (KCCs) for providing credit to farmers. In the third phase, beginning in April 2005, ‘financial inclusion’ was explicitly made as a major policy objective and thrust was on providing safe facility of savings deposits through ‘no frills’ accounts.
Progress till 1990
7.43 Before 1990, several initiatives were undertaken for enhancing the use of the banking system for sustainable and equitable growth. These included nationalisation of private sector banks, introduction of priority sector lending norms, the Lead Bank Scheme, branch licensing norms with focus on rural/semi-urban branches, interest rate ceilings for credit to the weaker sections and creation of specialised financial institutions to cater to the requirement of the agriculture and the rural sectors having bulk of the poor population. The announcement of the policy of social control over banks was made in December 1967 with a view to securing a better alignment of the banking system with the needs of economic policy. The National Credit Council was set up in February 1968 mainly to assess periodically the demand for bank credit from various sectors of the economy and to determine the priorities for grant of loans and advances. Social control of banking policy was soon followed by the nationalisation of major Indian banks in 1969. The immediate tasks set for the nationalised banks were mobilisation of deposits on a massive scale and lending of funds for all productive activities. A special emphasis was laid on providing credit facilities to the weaker sections of the economy.
Box VII.2 Financial Inclusion in India – Key Elements
(i) Financial inclusion is delivery of banking services at an affordable cost to the vast sections of disadvantaged and low income groups. Unrestrained access to public goods and services is the sine qua non of an open and efficient society. As banking services are in the nature of public good, it is essential that availability of banking and payment ser vices to the entire population without discrimination is the prime objective of the public policy (Leeladhar, 2006).
(ii) Financial exclusion signifies lack of access by certain segments of the society to appropriate, low-cost, fair and safe financial products and services from mainstream providers. Financial exclusion is thus a key policy concern, because the options for operating a household budget, or a micro/small enterprise, without mainstream financial services can often be expensive. This process becomes self- reinforcing and can often be an important factor in social exclusion, especially for communities with limited access to financial products, particularly in rural areas (Mohan, 2006).
(iii) Financial inclusion means the provision of affordable financial services, viz., access to payments and remittance facilities, savings, loans and insurance services by the formal financial system to those who tend to be excluded (Thorat, 2006).
(iv) The process of financial inclusion consists of seeking each household and offering their inclusion in the banking system (Reddy, 2007).
(v) The process of ensuring access to financial services and timely and adequate credit where needed by vulnerable groups such as weaker sections and low income groups at an affordable cost (The Committee on Financial Inclusion, Chairman: Dr. C. Rangarajan, 2008).
7.44 The administrative framework for rural lending in India was provided by the Lead Bank Scheme introduced in 1969, which was an important step towards implementation of the two-fold objectives of deposit mobilisation on an extensive scale and stepping up of lending to weaker sections of the economy. Realising that the flow of credit to employment oriented sectors was inadequate, the priority sector guidelines were issued to the banks by the Reserve Bank in the late 1960s to step up the flow of bank credit to agriculture, small-scale industry, self-employed, small business and the weaker sections within these sectors. The target for priority sector lending was gradually increased to 40 per cent of advances in the case of domestic banks (32 per cent, inclusive of export credit, in the case of foreign banks) for specified priority sectors. Sub-targets under the priority sector, along with other guidelines including those relating to Government sponsored programmes, were used to encourage the flow of credit to the identified vulnerable sections of the population such as scheduled castes, religious minorities and scheduled tribes. The Differential Rate of Interest (DRI) Scheme was instituted in 1972 to provide credit at concessional rate to low income groups in the country (see Chapter III for details).
7.45 Since the 1970s, the promotional aspects of banking policy have come into greater prominence. The major emphasis of the branch licensing policy during the 1970s and the 1980s was on expansion of commercial bank branches in rural areas, resulting in a significant expansion of bank branches and decline in population per branch. The branch expansion policy was designed, inter alia, as a tool for reducing inter-regional disparities in banking development, deployment of credit and urban-rural pattern of credit distribution. In order to encourage commercial banks and other institutions to grant loans to various categories of small borrowers, the Reserve Bank promoted the establishment of the Credit Guarantee Corporation of India in 1971 for providing guarantees against the risk of default in repayment. The scheme, however, was subsequently discontinued.
7.46 The National Bank for Agriculture and Rural Development (NABARD) was set up in 1982 mainly to provide refinance to the banks extending credit to agriculture. RRBs, which were set up in 1975 to cater, inter alia, to the credit requirements of the rural poor, have recently been restructured.
Recent Initiatives
7.47 With the onset of economic reforms in the beginning of the 1990s, a strong and resilient financial sector was considered necessary for accelerating the growth momentum in the country and also for expanding the coverage of financial services in a sustainable manner. Accordingly, the financial sector refor m process placed more emphasis on creating a strong, vibrant and competitive banking system. An important step to bring financially excluded people within the fold of formal financial sector was the promotion of micro-finance in India. The SHG-bank linkage programme was launched by NABARD in 1992, with policy support from the Reserve Bank, to facilitate collective decision making by the poor and provide ‘door step’ banking. Banks, as wholesalers of credit, were to provide the resources, while the NGOs were to act as agencies to organise the poor, build their capacities and facilitate the process of empowering them (Box VII.3).
7.48 To further promote the SHG-bank linkage programme in the country, banks were advised in 1998 that SHGs that were engaged in promoting the saving habits among their members would be eligible to open savings bank accounts and that such SHGs need not necessarily have availed of credit facilities from banks before opening savings bank accounts. Subsequent to the Monetary and Credit Policy announcement for the year 1999-2000, banks were
Box VII.3 Self-Help Group – Bank Linkage Programme
An SHG is a group of about 15 to 20 people from a homogenous class who join together to address common issues. They involve voluntary thrift activities on a regular basis, and use of the pooled resource to make interest-bearing loans to the members of the group. In the course of this process, they imbibe the essentials of financial intermediation and also the basics of account keeping. The members also learn to handle resources of size, much beyond their individual capacities. They begin to appreciate the fact that the resources are limited and have a cost. Once the group is stabilised, and shows mature financial behaviour, which generally takes up to six months, it is considered for linking to banks. Banks are encouraged to provide loans to SHGs in cer tain multiples of the accumulated savings of the SHGs. Loans are given without any collateral and at interest rates as decided by banks. Banks find it comfortable to lend money to the groups as the members have already achieved some financial discipline through their thrift and internal lending activities. The groups decide the terms and conditions of loan to their own members. The peer pressure in the group ensures timely repayment and becomes social collateral for the bank loans.
Generally, the SHGs need self-help promoting institutions (SHPIs) to promote and nurture them. These SHPIs include various NGOs, banks, farmers’ clubs, government agencies, self-employed individuals and federations of SHGs. However, some SHGs have also been formed without any assistance from such SHPIs.
There are three different models that have emerged under the linkage programme:
• Model I: This involves lending by banks directly to SHGs without intervention/facilitation by any NGO.
• Model II: This envisages lending by banks directly to SHGs with facilitation by NGOs and other agencies.
• Model III: This involves lending, with an NGO acting as a facilitator and financing agency.
Model II accounted for around 74 per cent of the total linkage at end-March 2007, while Models I and III accounted for around 20 per cent and 6 per cent, respectively.
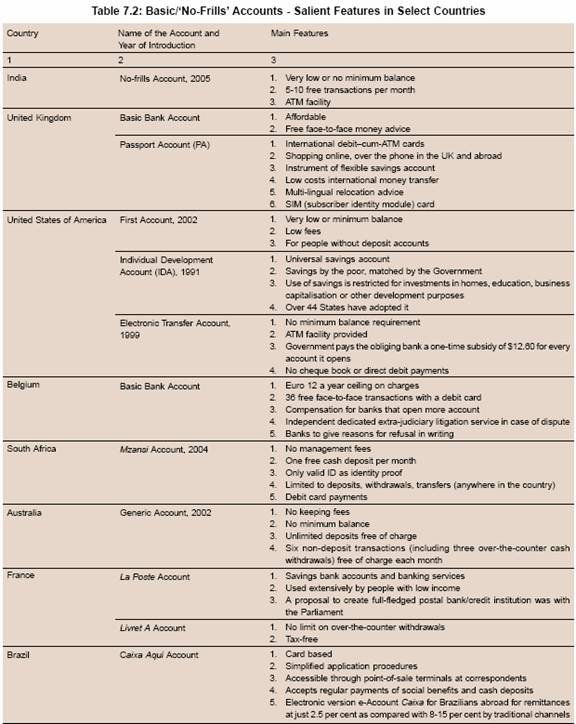
7.50 The process of financial inclusion received further impetus in November 2005, when banks were advised to make available a basic banking ‘no-frills’ account with low or nil minimum balances as well as charges to expand the outreach of such accounts to vast sections of the population. The low cost or free of cost account is internationally considered to be helpful in expanding the access of banking services, particularly to the low income groups. Similar types of accounts, though with different names, have also been extended by banks in various other countries with a view to making financial services accessible to the common man either at the behest of banks themselves or the respective Governments (Table 7.2).
7.51 In order to ensure that persons belonging to low income groups, both in urban and rural areas do not encounter difficulties in opening bank accounts, the know your customer (KYC) procedure for opening accounts was simplified for those accounts with balances not exceeding Rs.50,000 and credit limits not exceeding Rs.100,000 in a year. The simplified procedure allowed introduction by a customer on whom the full KYC drill had already been done.
7.52 Besides the KCCs, which were introduced in 1998, banks were advised in 2005 to consider introduction of a General Credit Card (GCC) facilityup to Rs.25,000 at their rural and semi-urban branches. Under GCC, based on the assessment of household cash flows, the limits are sanctioned without insistence on security or purpose. The credit facility is in the nature of revolving credit entitling the holder to withdraw up to the limit sanctioned. Based on assessment of household cash flows, the limits are sanctioned. Interest rate on the facility is completely deregulated. Fifty per cent of GCC loans are treated as priority sector lending.
7.53 The SLBC identifies one or more districts for 100 per cent financial inclusion.3 The responsibility is given to the banks in the area for ensuring that all those who want to have a bank account are provided with one by allocating the villages to the different banks. In April 2008, SLBCs reported achieving 100 per cent financial inclusion in 134 districts in 18 States and 6 Union Territories (UTs) of the country. The Reserve Bank is undertaking an evaluation of the progress made in these districts by independent external agencies to draw lessons for further action in this regard.
7.54 In Januar y 2006, the Reser ve Bank, permitted banks to utilise the services of NGOs/ SHGs, MFIs (other than NBFCs) and other civil society organisations as inter mediaries for providing financial and banking services through the use of business facilitator (BF) and business correspondent (BC) models. In April 2008, banks were permitted to engage retired bank employees, ex-servicemen and government employees as BCs, subject to appropriate due diligence. The BC model allows banks to do ‘cash in - cash out’ transactions at a location much closer to the rural population, thus, addressing the last mile problem. Banks are also entering into agreements with Indian Postal authorities for using the enormous network of post offices as BCs, thereby increasing their outreach. In order to provide social security to vulnerable groups, in some cases banks have provided, in association with insurance companies, innovative insurance products at affordable cost, covering life disability and health cover. SHGs and MFIs are also being used extensively for financial inclusion on the credit side.
7.55 The list of eligible sectors for treatment as ‘priority sector’ was expanded in the post-reform period to include investments in specified bonds and also activities such as venture capital. As a result, there was a growing perception of inadequate flow of credit to the traditionally preferred sub-sectors of the priority sector such as agriculture and small industries. In order to address these concerns, revised guidelines on the priority sector were issued in April 2007. Consequently, the priority sector is now restricted to advances to highly employment intensive sectors such as agriculture, small enterprises, retail trade, educational loans, micro-finance and low cost housing.
7.56 Given the low credit-deposit ratios in some States, it became necessary to identify unique problems in such lagging States for expanding banking facilities and formulating area-specific action plans for accelerated financial deepening. Such plans were drawn up with full participation of the State Governments, banks and other local developmental agencies in States such as Uttarakhand, Himachal Pradesh, Jharkhand, Bihar, Andaman & Nicobar Islands and the North-Eastern States.
7.57 A growing component of inclusive banking is the lending by MFIs that are societies, trusts, cooperatives or ‘not for profit’ companies or non-banking financial companies registered with the Reserve Bank. The MFIs currently cover 8.3 million borrowers. The NBFC segment within this sector accounts for 42.8 per cent of the borrowers and is the fastest growing segment. Interest rates on lending to MFIs/NBFCs have been completely deregulated. Bank lending to such entities for micro-finance is treated as priority sector lending. Private sector and foreign banks are observed to be actively supporting this sector, which is also attracting private equity funding and philanthropy funding from outside the country (Thorat, 2008).
7.58 In India, there have been several innovative experiments with various variants of micro-finance taking into account the highly localised needs. An interesting example in this regard has been the efforts by Aryavart Gramin Bank which embarked upon a novel idea of financial inclusion in remote villages and hamlets of Uttar Pradesh (Box VII.4).
Box VII.4 Financial Inclusion: Novel Method of Financing
The Aryavart Gramin Bank embarked on a novel idea of financial inclusion in remote villages and hamlets of Uttar Pradesh where electricity supply was not available or if available was erratic. The villagers were dependent only on kerosene lamps for their lighting needs and often kerosene had to be bought from black markets, which was affecting their incomes. The bank embarked upon the novel idea of providing solar energy lights to the villages and identified a solar company in India, Tata BP Solar, for providing ‘Solar Home Lighting System’ for the village homes. The company and the dealer were ready to sacrifice their margins as the bank was agreeing to finance the system on a large scale. The system cost Rs.13,000 and consisted of a ready-to-use kit containing a 35 watt solar panel, low maintenance battery, MCR charge controller and two luminaries. The system could light two CFLs of 14 watt for more than 7 hours and could also support one mobile charger, one table fan and a television. The bank extended finance of around Rs.10,000 with Rs.3,000 as margin money to be contributed by the beneficiary. The amount together with interest was to be repaid in 60 equated monthly instalments of approximately Rs.222 per month. This was much less than the amount that the villagers had to spend for their kerosene requirements per month.
The bank had identified literate village youths as business facilitators who were trained by the company for maintenance of the systems. The bank is paying an honorarium of Rs.10,000 per annum to the business facilitators for maintaining 100 such systems. More than 1,300 households in Unnao District and about 500 houses in Barabanki District, were provided with Solar Home Lighting Systems by the bank as at end-December 2007. The bank aims to cover 25,000 households by October 2008.
Source: Website of Aryavart Grameen Bank; http://aryavart-rrb.com.
7.59 Another innovative micro-finance experiment was undertaken by the Mann Deshi Mahila Bank in the Satara District of Maharashtra which works towards the holistic development of women entrepreneurs into women business owners and bank customers (Box VII.5).
Box VII.5 Financial Inclusion: Women Empowerment
The Mann Deshi Mahila Bank, based in Mhaswad, in Satara District, Maharashtra, is an organisation that works towards the holistic development of women entrepreneurs into women business owners’ and bank customers. Founded in 1997, by Chetna Vijay Sinha, the Mann Deshi Mahila Bank has created 17,000 women entrepreneurs. The regulated co-operative that received an “A” grade from District Cooperative Department in 2000, equips its clients with liquid assets which help financial empowerment that, in turn, enables women to become entrepreneurs and plan a stable future for their families. Services which the bank offers include savings, loans, insurance and pensions. A partnership with UTI Mutual Fund had enabled the bank to be the first to offer pension schemes to its clients in Maharashtra.
The bank’s success led to the creation of several sub-organisations, one of which is the Mann Deshi Business School for Rural Women. Set up in partnership with HSBC Bank, the school primarily aims at making its range of courses accessible to women who, due to financial and cultural constraints, would be unable to access such training in neighbouring urban hubs. Unlike traditional business schools that delve into the theor y of microeconomics, accounting, organisational behaviour and so on, this business school focusses on imparting simple business skills. The school’s courses can be categorised into basic business-oriented courses, such as financial literacy, marketing and product development and entrepreneurial or skill-based courses. The business school in Vaduj, Mhaswad attracts women from the surrounding villages as well as larger towns. As most of the women who attend the school are part of larger joint families, the school’s courses are designed so as to enable them to attend the school after completing their household chores and supplement their household income with their earnings.
In 2007, in partnership with the Deshpande Foundation, which supports innovation and entrepreneurship in India, Mann Deshi and Mann Vikas (the NGO wings of the bank) established the Business School on Wheels for Rural Women. This currently operates in the Hubli-Dharwad district in the neighbouring State of Karnataka. A specially designed bus travels the district and offers courses similar to those of the business school. What is striking about the Mann Deshi Business School and the Business School on Wheels is that all their courses are designed not just to teach skills, but also at a larger level, to cater to the needs of the society. By enforcing a strict no educational qualification, no age bar policy, and with fees ranging from Rs.180 to Rs.1,800, the school has been able to attract, during the last year, 650 women from all social backgrounds and capacities, and provide them with skills they otherwise would never have been able to acquire.
Reference:
Creado, J. and R. Koshi. 2008. Creating Leaders at the Bottom of Pyramid, Microfinance Insight, March.
7.60 Micro-finance has emerged as a major mode of expanding outreach of the formal financial sector in a number of countries. The experiences of these countries provide useful inputs regarding the methodology and model of finance to be emulated in other counties (Box VII.6).
7.61 The Grameen system has been widely replicated by micro-finance organisations in several other countries, including some institutions in India. For instance, Activists for Social Alternatives(ASA), Tiruchirapalli (Tamil Nadu) provides a range of integrated financial andnon-financial services through its Gram Vidiyal (GV) programme. The GV consists of a federated structure built upon Grameen style small groups throughwhich financial and non-financial services are provided by ASA, a NGO/MFI (Tankha, 2002).
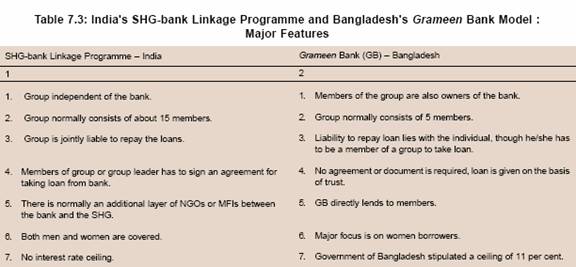
7.62 Though a variety of micro-finance models are followed in India, SHG-bank linkage programme is the predominant one. The model has broad similarities with the Grameen Bank model such as formation of groups, extending credit to poor people, and focus on capacity building. There are, however, certain differences in the methodology followed by SHG-bank linkages programme in India and that by Grameen Bank in Bangladesh (Table 7.3).
7.63 The Reserve Bank has been encouraging the use of IT solutions by banks for enhancing their outreach with the help of their BCs or otherwise. Certain banks have adopted technological solution (Box VII.7). Pilot studies have also been carried out in a few States. One of the technological solutions used is hand-held devices, which are essentially smart card readers. These devices are used for making payments to rural customers and receiving cash from them at their doorsteps. Mobile phones have also been developed to serve as card readers. Account holders are issued smart cards, which have their photographs and finger impressions.
Box VII.6 Grameen Bank in Bangladesh
The Grameen Bank (GB) was launched as a project in a village of Bangladesh in 1976 to assist the poor families by providing credit to help them overcome poverty. In 1983, it was transformed into a formal bank under a special law passed for its creation. It is owned by the poor borrowers of the bank who are mostly women. GB has reversed conventional banking practice by obviating the need for collateral. It has created a banking system based on mutual trust, accountability, participation and creativity. GB provides credit to the poorest of the poor in rural Bangladesh, without any collateral.
As GB was initiated as a challenge to the conventional banking, it rejected the basic methodology of the conventional banking and created its own methodology. The most distinctive feature of Grameen credit is that it is not based on any collateral, or legally enforceable contracts. It is based on ‘trust’ and not on legal procedures and system. It offers credit for creating self-employment, income-generating activities and housing for the poor, as opposed to consumption. It provides service at the doorstep of the poor based on the principle that the people should not go to the bank, bank should go to the people. In order to obtain loans, a borrower must join a group of borrowers. Although each borrower must belong to a five-member group, the group is not required to give any guarantee for a loan to its member. The repayment responsibility solely rests on the individual borrower, while the group and the centre/branch oversee that everyone behaves in a responsible way and none gets into repayment problem. There is no form of joint liability, i.e., group members are not responsible to pay on behalf of a defaulting member. Loans can be received in a continuous sequence. New loan becomes available to a borrower if her previous loan is repaid. All loans are to be paid back in instalments (weekly or bi-weekly).
The GB initially focussed on providing credit facilities and paid little attention to voluntary deposit mobilisation. This policy was changed in 2000, with increased emphasis on deposit mobilisation. GB currently offers four kinds of savings, namely personal savings account, special savings account, Grameen Pension Savings and credit-life insurance savings fund. After operating group lending for 25 years, the GB switched to individual lending recognising that with repeated loan cycles and greater credit exposure, homogeneity of the group would weaken as loan requirements vary with variation in the levels of upliftment attained. Thus, the more flexible Grameen II is more appropriate for reaching the poor because its products can be conveniently used for everyday money management as well as for microenterprises. GB II dispensed with the general loans, seasonal loans, family loans, and more than a dozen other types of loans. It also gave up the group fund; the branch-wise and zone-wise loan ceiling; fixed size weekly instalment; the rule to borrow for one whole year, even when the borrower needed the loan only for three months.
The Government of Bangladesh has fixed interest rate for government-run microcredit programmes at 11 per cent at flat rate, which amounts to about 22 per cent on a declining basis. The interest rate charged by the Grameen Bank is lower than that fixed by the Government of Bangladesh. There are four interest rates for loans from Grameen Bank: 20 per cent (declining basis) for income generating loans, 8 per cent for housing loans, 5 per cent for student loans, and 0 per cent (interest-free) loans for struggling members (beggars). All interests are simple interest, calculated on declining balance method. This implies an annual interest rate of 10 per cent for income-generating loan which is less than that (11 per cent) fixed by the Government of Bangladesh. GB offers attractive rates for deposits ranging from 8.5 per cent to 12 per cent.
As of March, 2008, it had 7.46 million borrowers, 97 per cent of whom were women. With 2,504 branches, GB provides services in 81,574 villages, covering more than 97 per cent of the total villages in Bangladesh.
Source: Website of Grameen Bank; www.grameen-info.org.
7.64 Recognising the potential of emerging business opportunities, some banks have also adopted innovative methods and appropriate technology to provide banking services to financially excluded people by enabling them to overcome obstacles such as procedural problems and difficulties in physical access. For instance, Corporation Bank has implemented the branchless banking model in the States of Goa, Karnataka, Tamil Nadu and Andhra Pradesh (Box VII.8).
7.65 To overcome financial exclusion which is widespread in urban areas, Indian Bank successfully experimented with an innovative model of providing access to slum dwellers in Mumbai (Box VII.9).
7.66 Housing to people with moderate income levels is internationally considered to promote financial inclusion (Box VII.10). In India, housing for the poor is one of the six elements of Bharat Nirman programme (announced in the Union Budget 2005-06) and is implemented through the Indira Awas Yojana (IAY). Against a target of 6.0 million houses, 4.11 million houses were constructed up to December 2007 and the cumulative number was expected to go up to 5.18 million houses by end-March 2008.4 Recognising the high cost of construction, the Union Budget 2008-09 proposed to enhance the subsidy per unit in respect of new houses sanctioned after April 1, 2008 from Rs.25,000 to Rs.35,000 in plain areas and from Rs.27,500 to Rs.38,500 in hill/difficult areas. The subsidy for upgradation of houses would be increased from Rs.12,500 per unit to Rs.15,000. In the Union Budget 2008-09, it was also indicated that financial inclusion can be taken forward by expanding the reach, inter alia, of the National Housing Bank (NHB). In order to increase the resource base of NHB, it was proposed to tap the resources of scheduled commercial banks (SCBs) to the extent that they fall short of their obligation to lend to the priority sector. It was also proposed to create a fund of Rs.1,200 crore with NHB to enhance its refinance operations in the rural housing sector. The fund would be governed by the general guidelines that are now applicable to the Rural Infrastructure Development Fund (RIDF) with some modifications. The Reserve Bank, in February 2008, advised banks that the members of SC/STs satisfying the income criteria of the DRI scheme for weaker sections of the community can also avail of housing loan up to Rs.20,000 per beneficiary at a concessional interest rate of 4 per cent.5 Following the announcement made in the Union Budget 2008-09, the Reserve Bank in July 2008, advised public sector banks (PSBs) that the Government would provide interest subvention of 2 per cent to PSBs in respect of short-term production credit up to Rs.3 lakh extended to farmers at 7 per cent per annum.
Box VII.7 Successful Model for Financial Inclusion: A Case Study of Andhra Pradesh
The Rural Development Department of Government of Andhra Pradesh launched a pilot project in six Mandals of Warangal District for payment of Social Security Pensions (SSP) and National Rural Employment Guarantee Scheme (NREGS) benefits to the beneficiaries. The pilot programme involved six banks viz., State Bank of India, Union Bank of India, State Bank of Hyderabad, Andhra Bank, A.P.Grameena Vikas Bank and Axis Bank. The benefits are paid to the villagers by the business correspondents of banks at the habitation level in the villages. The Rural Development Department, Government of Andhra Pradesh, played a very active role in the project and has financed a major portion of the cost of the cards and the devices. The project was coordinated by the Reserve Bank with the Regional Director, Hyderabad being the Convenor of the Steering Group for the project. The Institute for Development and Research in Banking Technology (IDRBT) was given the role of providing the management information systems (MIS) to the Government in the required format. In the second phase, the project will be scaled up to 50,000 villagers. The State proposes to scale up the efforts to the entire State in due course. The Andhra Pradesh Government also proposes to issue smart cards to all the SHG members in the State.
The project involves payment of SSP and NREGS benefits through BCs with the use of smart card and mobile technology. The BC uses a fingerprint scanner cum identifier, a mobile and a printer to process the payments. The beneficiaries hold smart cards with their photographs and images of their fingerprints pre-loaded at the time of their enrolment. The photograph and fingerprint are used for identification and authentication of the beneficiary. Once authenticated, the radio frequency identification device (RFID) chip embedded in the card gets charged. When the card with charged chip is brought close to the mobile phone, message templates for deposit, withdrawal and balance enquiry are generated in the mobile. The BC needs to select the relevant option and feed the amount of transaction through the mobile keypads and send the message to the back-end server. The server authenticates the message, processes the transaction and sends an update back to the mobile, which, in turn, writes back to the card. When the card is brought close to the printer, transaction report is printed in triplicate. The BC carries cash physically for making payments to the beneficiary. Thus, in effect, each BC carries a pocket ATM to the village in which it operates. The technology holds potential for whole range of activities that banks can conduct through BCs and this includes other products like fixed deposits, various loans, insurance, among others. The mobiles connect to a central data base server of the banks. The application has an off-line model also, which enables its operation in remote areas where there is no connectivity. Presently, the SSP and NREGS benefits are being paid through post offices which are given a commission of 2 per cent.
The State Government, for the initial pilot covering six mandals, agreed to pay Rs.90 per smart card, Rs.10,000 per hand held device and 2 per cent commission on transactions. The Government agreed to meet a part of the infrastructure costs to kick start the project. For the scaled up project, it is expected that the 2 per cent commission on turnover will be maintained and banks will fund the infrastructure. However, the model may have to be different in States with lesser turnover, as fixed cost per village is almost the same. The banks pay Rs.1,000 to the village organisation member in the village who is the representative of the BC of the bank. The cost of cards is a one-time exercise and enrolment of beneficiaries also involves an expense of Rs.50 per person in addition to the card cost.
The advantages to the bank are that the cost of transactions is reduced and there is scope for other services like crop loans, access to cheap savings in villages and micro-insurance, among others. The State Government can make all its payments through this mechanism. This would include salaries, pensions and contractor payments. The model ensures cost savings in the payment delivery mechanism and payments can be made centrally from the district or the State headquarters. An added benefit is that several bogus beneficiaries have been weeded out because of bio-metric identification and the State Government is expecting to save substantial amount on that account.
The model adopted for the project involves selection of technology and technology vendor by the bank; appointment of a BC; finalising the operating procedures with respect to transactions entered between bank and BCs such as movement of cash, crediting beneficiary accounts, payment of fee/commission and control mechanism. Other aspects of the model are enrolment and collection of critical data about the beneficiaries and issue of cards to them, training and sensitising the beneficiaries and meeting operational needs through ongoing support in servicing of instruments, constant monitoring and periodic evaluation of the project for improvement.
Box VII.8 Branchless Banking through Business Correspondents
Corporation Bank has taken up an outreach programme through the use of technology in order to provide very simple and basic financial services to the poor and the disadvantaged in the rural areas. To accomplish the task, the bank conducted a survey in the identified villages to gather information regarding the structure and size of village, family/household details such as occupation, asset ownership and the use of financial services. The automation of the survey facilitated generation of Corp Pragathi Savings Bank (CPSB) Account opening forms along with the photograph of the user at the site for the family members who expressed their desire to open an account with the bank.
The survey, inter alia, indicated that the villagers were generally reluctant to approach the bank as the branches were far off from their residence or workplace and hence they needed to spend money on commuting and time to carry out normal banking activities. Further, being semi-literate or illiterate, they found the procedures difficult to comprehend and follow. They were also not sure of the treatment that would be meted out to them when they approached the bank for remitting or withdrawing small sums of money. To mitigate these hardships faced by the villagers, the Corporation Bank adopted a branchless banking model in August 2007. After evaluation of different technologies ranging from palm-tops, simputers, hand held storage devices and diverse communication channels, the bank opted for a branchless banking model based on business correspondents (BCs) and use of a small hand held device. This model is more or less similar to that followed in pilot project in Andhra Pradesh (see Box VII.7). The branchless banking model has enabled the bank to reach out to the villagers by offering them savings and loan products at their doorsteps. The information collected through survey has enabled to meet the KYC requirements also.
The benefits of the model to the customers include saving of their time and cost of travel to the branch, comfort in dealing with BC as he is a familiar face, and convenience of transacting business practically at any time of the day. The advantage for the BC is that it is an alternative source of income. The benefits for the bank are that they are able to reach out to the hitherto unreached segments and mop up rural savings at lower transaction costs.
Reference:
Kamath, Raghav. 2007. Branchless Banking: Corp Bank’s Answer for Financial Inclusion; CAB Calling July-September; Vol. 31, No. 3.
7.67 To strengthen the rural credit delivery system, a revival package for the short-term rural co-operative credit structure was announced recently. Based on the recommendations of the Task Force on Revival of Rural Co-operative Credit Institutions (Chairman: A. Vaidyanathan) and in consultation with State Governments, the Government of India approved a package for revival of the short-term rural co-operative credit structure. So far, 20 States have executed Memoranda of Understanding (MoUs) with the Government of India and the NABARD, as envisaged under the package. Seven States have made necessary amendments in their Co-operative Societies Acts. The revival package for long-term rural co-operative credit structure is also being worked out. The Union Budget 2008-09 announced that the Central Government and the State Governments have reached an agreement on the content of the package for revival of the long-term co-operative credit structure. As recommended by the Committee on Financial Inclusion in its interim Report, the Government had announced in the Union Budget 2007-08 the creation of two funds - Financial Inclusion Fund and Financial Inclusion Technology Fund with an overall corpus of Rs.500 crore each with NABARD - for meeting the costs of development, as also promotional and technology interventions as recommended. The Government indicated that for 2007-08, the initial contribution would be Rs.25 crore each in the two funds by the Central Government, Reserve Bank and NABARD in the ratio 40:40:20. The Reserve Bank’s initial contribution to the funds would come to Rs.10 crore each. The Committee submitted its final report in January 2008 (Box VII.11). The Committee on Financial Inclusion had also recommended that the State Governments should make payments under National Rural Employment Guarantee Scheme and Social Security Payments through such technology based solutions. The Reserve Bank has already requested State Governments to explore the possibility of routing Government payments through banks with the help of information and communication technology (ICT) (Government of India, 2008a and 2008b).
Box VII.9 Urban Financial Inclusion – Dharavi (Mumbai) Model
There is generally a feeling that financial exclusion is a problem only in rural areas. However, in reality, a large number of people in urban centres also do not have easy access to banking facilities and financial exclusion is very common even in urban areas, particularly in the case of informal sector workers who do not have regular jobs. Moreover, many migrants who do not have bank accounts and knowledge of banking facilities send money to their family members through informal sources such as friends, relatives or carry cash whenever they visit their native place.
The situation is not too different in Dharavi, Asia’s largest slum, in the country’s commercial capital, Mumbai. Dharavi is inhabited by about 300,000 to 350,000 workers many of whom do not have bank accounts. After the KYC norms were rationalised to enable opening of ‘no frills’ accounts, Indian Bank opened a core banking branch and ATM facility in Dharavi in February 2007. The bank introduced smart card based banking which has enabled doorstep banking transactions for the slum dwellers. The facility has enabled the workers to save and migrants are able to utilise the services of easy and reliable remittance of money to their family members at their places of origin. Life and health insurance products are also offered to the residents.
Thus, some financially excluded people in urban areas have been provided banking access. Indian Bank has now also extended the Dharavi model to Guntur town of Andhra Pradesh and Tharamani, Chennai where the urban poor did not have bank accounts.
References:
1. Rajan, M.S.S. 2007. Replication of Financial Inclusion: Oppor tunities and Challenges – Indian Bank Experience; CAB Calling July-September, Vol.31, No.3.
2. Indian Bank Website, www.indianbank.in
Box VII.10 Housing and Financial Inclusion
In developed countries, mortgage lending to people living in deprived parts of the country has been recognised as a key instrument of financial inclusion and is considered to act as a catalyst for economic and social development. Expansion of mortgage finance to low income groups by mortgage companies, non-bank finance companies and banks seems to have helped in bringing a large part of the financially excluded population under the fold of the formal financial system in the developed countries. Housing associations in developed countries have taken a lead in combating financial exclusion amongst their tenants and residents and also supporting community financial institutions such as credit institutions through partnership and investment. Housing finance is generally availed to invest in new houses or home improvements. There is also great diversity in the sources of mortgage funding, including retail deposits, mortgage backed securities and covered bonds. In some countries such as the UK, alongside the competitive mainstream mortgage lending, there is access to mortgage credit for buyers with low housing equity, or uncertain incomes (HM Treasury, 2007). First time housing buyers in particular, face difficulties in getting housing finance. In order to provide affordable housing in the UK and Scotland, mortgage lenders are working on the Government’s Open Market Home Buy Scheme, a shared equity scheme designed to finance first time buyers, workers and social tenants. Furthermore, customers who are shared owners also get access to the other financial products and services offered by the financial entity. Under this scheme both the Government and the lenders take responsibility for sharing equity in properties to allow people to enter the housing market. There have also been innovations in the methods of delivery and outreach work employed, for example, by entering into partnerships with local housing associations. In the UK, the Government target is to deliver more than 70,000 new affordable homes a year by 2010-11. In order to provide credit facility to tenants who otherwise cannot obtain loans from the main financial institutions, the Royal Bank of Scotland has reached an agreement with the Grampian Housing Association to devise a new savings and loans scheme.
In the United States, the federal government introduced the Community Reinvestment Act in 1997, under which federal bank regulatory agencies rate banks on their efforts and effectiveness at serving low-income communities. The main criterion is mortgage loans but regulators also consider the extent to which banks make retail banking services available to low and moderate income communities. The sub-prime mortgage or refinance loans are also recognised to have led to spread of credit among the Black and Hispanic communities, who generally lack easy access to credit. The Low-Income Housing Tax Credit (LIHTC) programme has also helped finance developments with units set aside for low or moderate income households. The intent of the programme was to provide enough incentives to ensure an adequate supply of low-income housing by granting tax credits to the owners of selected rental housing developed for occupancy by low or moderate income households. Although the subsidy is provided entirely through the federal tax code, it is administered through state government agencies, generally the state housing finance agency. The LIHTC programme has emerged as a primary mechanism for encouraging the production of housing to be occupied by low or moderate income households (Wallace 1995).
In the context of developed countries, it is argued that access to mortgage finance could be enhanced if lenders restructured and optimised the structure and processes associated with the existing mortgage products to align more closely with the needs and characteristics of the target market. Measures such as improved loan servicing processes, redefined borrower, property or area criteria, loan level product features such as insurance or collateral requirements, as well as portfolio interventions such as guarantees are all mechanisms that could be considered. However, it is also contended that there is a limit to the extent that mortgage products can facilitate access to housing finance across the target market. The nature of the housing needs and the financial and risk profile of households in the target market underlines the need for diversified housing finance products.
References:
1. Bank of Scotland. 2007. Delivering our Financial Inclusion Agenda in Scotland, March.
2. H.M. Treasury. 2007. Financial Inclusion: the Way Forward, HM Treasury, UK, March.
3. Kempson, E. 2006. Policy Level Response to Financial Exclusion in Developed Economies: Lessons for Developing Countries, Paper for Access to Finance: Building Inclusive Financial Systems, World Bank, Washington, May.
4. Wallace, James E. 1995. Financing Affordable Housing in the United States, Housing Policy Debate 6(4).
7.68 The Union Budget 2008-09 announced that banks would be encouraged to embrace the concept of total financial inclusion. Subsequently, the Reserve Bank in April 2008 advised all SCBs to meet the entire credit requirements of SHG members, viz., (a) income generation activities; (b) social needs like housing, education, marriage; and (c) debt swapping. The Government introduced a new Self-Employment Scheme for rehabilitation of all the remaining scavengers and their dependents by March 2009. Scavengers and their dependents, irrespective of their income, who are yet to be provided assistance for rehabilitation, under any scheme of the Government of India/State Governments, are eligible for assistance. The identified scavengers would be provided training, loan and subsidy. Accordingly, the Reserve Bank, in April 2008, issued broad guidelines to be followed by the banks in implementing the Scheme. Banks would provide loans to candidates sponsored only by State Channelising Agencies of National Safai Karmacharis Finance and Development Corporation (NSKFDC) and claim the admissible capital subsidy from them for disbursement to the beneficiary. After disbursement of loan to the beneficiaries, the concerned branch of the bank claims interest subsidy from the State Channelising Agency on a quarterly basis.
Box VII.11 Report of the Committee on Financial Inclusion
The Committee on Financial Inclusion was constituted by the Government of India (Chairman Dr. C. Rangarajan) on June 26, 2006 to prepare a strategy of financial inclusion. The Committee submitted its final Report on January 4, 2008. The Report viewed financial inclusion as a comprehensive and holistic process of ensuring access to financial services and timely and adequate credit, particularly by vulnerable groups such as weaker sections and low income groups at an affordable cost. Financial inclusion, therefore, according to the Committee, should include access to mainstream financial products such as bank accounts, credit, remittances and payment services, financial advisory services and insurance facilities.
The Report observed that in India 51.4 per cent of farmer households are financially excluded from both formal/informal sources and 73 per cent of farmer households do not access formal sources of credit. Exclusion is most acute in Central, Eastern and North-Eastern regions with 64 per cent of all financially excluded farmer households. According to the Report, the overall strategy for building an inclusive financial sector should be based on (i) effecting improvements within the existing formal credit delivery mechanism; (ii) suggesting measures for improving credit absorption capacity especially amongst marginal and sub-marginal farmers and poor non-cultivator households; (iii) evolving new models for effective outreach; and (iv) leveraging on technology based solutions.
Keeping in view the enormity of the task involved, the Committee recommended the setting up of a mission mode National Rural Financial Inclusion Plan (NRFIP) with a target of providing access to comprehensive financial services to at least 50 per cent (55.77 million) of the excluded rural households by 2012 and the remaining by 2015. This would require semi-urban and rural branches of commercial banks and RRBs to cover a minimum of 250 new cultivator and non-cultivator households per branch per annum. The Committee has also recommended that the Government should constitute a National Mission on Financial Inclusion (NaMFI) comprising representatives of all stakeholders for suggesting the overall policy changes required, and supporting stakeholders in the domain of public, private and NGO sectors in undertaking promotional initiatives.
The major recommendations relating to commercial banks included target for providing access to credit to at least 250 excluded rural households per annum in each rural/semi-urban branches; targeted branch expansion in identified districts in the next three years; provision of customised savings, credit and insurance products; incentivising human resources for providing inclusive financial services and simplification of procedures for agricultural loans.
The major recommendations relating to RRBs are extending their services to unbanked areas and increasing their credit-deposit ratios; no further merger of RRBs; widening of network and expanding coverage in a time bound manner; separate credit plans for excluded regions to be drawn up by RRBs and strengthening of their boards.
In the case of co-operative banks, the major recommendations were early implementation of Vaidyanathan Committee Revival Package; use of PACS and other primary co-operatives as BCs and co-operatives to adopt group approach for financing excluded groups.
Other important recommendations of the Committee are encouraging SHGs in excluded regions; legal status for SHGs; measures for urban micro-finance and separate category of MFIs.
Reference:
Government of India. 2008. Report of the Committee on Financial Inclusion in India (Chairman Dr. C. Rangarajan).
January.
7.69 Recognising that lack of awareness is a major factor for financial exclusion, the Reserve Bank is taking a number of measures towards financial literacy and credit counselling. The Reserve Bank has undertaken a project titled “Project Financial Literacy”. The objective of the project is to disseminate information regarding the central bank and general banking concepts to various target groups, including, school and college going children, women, rural and urban poor, defence personnel and senior citizens. It would be disseminated to the target audience with the help, among others, of banks, local government machinery, schools and colleges through presentations, pamphlets, brochures, films, as also through the Reserve Bank’s website.
7.70 Furthermore, to promote financial literacy, a multilingual website in 13 Indian languages on all matters concerning banking and the common person was launched by the Reserve Bank on June 18, 2007. Comic type books introducing banking to school children were also put on the Reserve Bank’s website on November 14, 2007. Similar books would be prepared for different target groups such as rural households, urban poor, defence personnel, women and small entrepreneurs. Financial literacy programmes are being launched in each State with the active involvement of the State Governments and the SLBC. The Reserve Bank has also been initiating measures for providing credit counselling. Each SLBC convenor has been asked to set up a credit-counselling centre in one district as a pilot and extend it to all other districts in due course. A concept paper on financial literacy and credit counselling has been prepared and placed on the Reserve Bank’s website for public comments and the responses are being examined.
7.71 India has followed a multi-pronged strategy to promote financial inclusion. The global experience also suggests that countries that allow diversity in approaches are more likely to achieve better results. Diversity in approaches not only serves better the diverse demand for financial services, but also reduces systemic risks, increases competition, and improves efficiency. Many other countries also followed more or less a similar approach (Box VII.12).
7.72 The problem of financial exclusion is found even in several advanced countries. These countries have also initiated specific measures to bring financially excluded people within the fold of the banking system. The measures initiated, among others, include voluntary code of practices, legislation-backed norms, basic bank accounts and subsidised accounts (Box VII.13).
Box VII.12 Financial Inclusion Strategy in Select Countries
Historically, Governments in many countries intervened on the supply side to address access to financial services in various ways. Religious and other civil society organisations have also sought to broaden access to formal financial services for the poor and low-income people. These measures include (i) nationalising private banks;(ii)branch regulations; (iii) promoting specialised banks including national savings banks; (iv)directives on portfolio composition; (v) interest rate ceilings on credit to low-income households, and provision of credit at subsidised rates to priority sectors; (vi) voluntary charter or codes developed by banks themselves; (vii) enactment of legislations defining the right of access to formal banking services; (viii) setting up of empowered and dedicated agencies by Governments; (ix) running specialised and sponsored schemes including those sponsored by Governments and banks themselves using a blend of innovations, reforms in the existing structures of credit delivery and the existing infrastructure like post offices and passport accounts; (x) countering the operations of moneylenders, and (xi) community-based savings and credit societies and mutual savings banks, which in a way can be seen as precursors of the modern micro-finance movement.
For instance, in Bangladesh, the Government while providing necessary space for NGOs to play the lead role in pushing the frontier of finance for the poor and by facilitating the establishment of the Grameen Bank, continued using the state-owned Krishi Bank (agriculture bank) and Building Resources Across Community (BRAC) extensively to provide access to credit and deposit services for low-income households. Most Asian countries, including Sri Lanka and Pakistan also resorted to nationalisation of private banks to expand banking services to the excluded and established new state-owned banks to serve low-income segments. The strategy, inter alia, includes micro-finance development plans, expansion of branch networks, promotion of Islamic banking, and promotion of application of new information and communication technology to reach rural people.
References:
1. Kempson E, A. Atkinson and O. Pilley. 2004. “Policy Level Response to Financial Exclusion in Developed Economies: Lessons for Developing Countries.” University of Bristol.
2. World Bank. 2008. Finance for All – Policy and Pitfalls in Expanding Access. The World Bank, Washington, D.C.
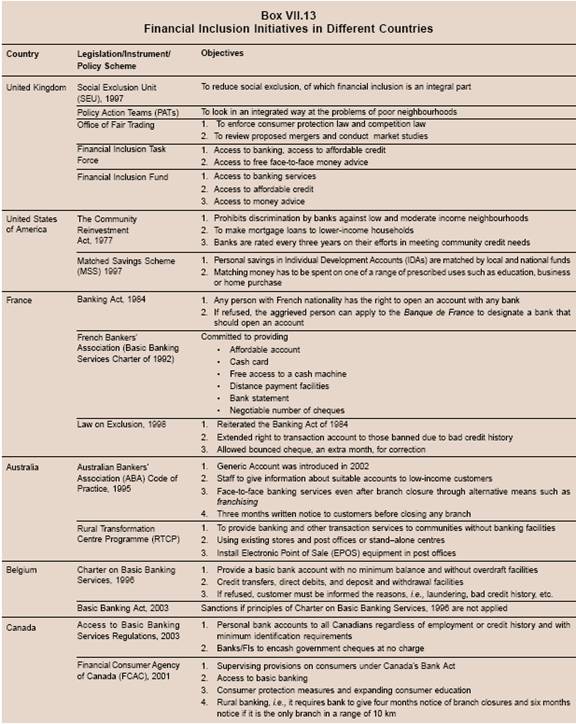
7.73 To sum up, a wide paraphernalia of institutional framework has been established by the Reserve Bank and the Government to ensure better banking penetration and outreach so that the credit needs of agriculture and small enterprises are met while allowing sufficient flexibility to banks to evolve their own policies and strategies for the purpose. While the policy initiatives towards financial inclusion in India started in the late 1960s, the focus through the 1970s and the 1980s was on channelling credit to ensure equitable growth. In the 1990s and the 2000s, micro-credit emerged as the main instrument for financial inclusion.
V. AN ASSESSMENT OF FINANCIAL INCLUSION/ EXCLUSION IN INDIA
7.74 As discussed in the previous section, widening of access to financial services has been one of the prime objectives of financial sector policies in general and banking sector policies in particular. The initiatives towards broadening the access of the banking sector in India began in the late 1960s. As detailed in Chapter III, banking sector policies were shaped by the continuous concern regarding a large segment of population left out of the fold of the formal financial system, especially in rural areas. The initiatives taken by the Reserve Bank and the Government of India towards promoting financial inclusion since the late 1960s have considerably improved the access to the formal financial institutions. Apart from SCBs, RRBs, co-operative banks and societies, post offices and insurance companies have played an important role in meeting the financial needs of people. However, comprehensive data on the progress of various aspects of financial inclusion are not available readily. The analysis in this section, therefore, is based on pieces of partial information from various sources such as All India Debt and Investment Survey (AIDIS) released once in a decade by the National Sample Survey Organisation (NSSO)6 and various banking data brought out by the Reserve Bank from time to time. The analysis is also supplemented by the data based on the surveys conducted by NCAER-Max New York Life and India Invest Market Solutions (IIMS). The latest survey released by the NSSO related to the reference year 2002, with a sample size of 143,285 households (91,192 in the rural sector and 52,093 in the urban sector), which constituted 0.07 per cent of the total number of households (203.4 million) in the country. The NCAER-Max New York Life survey was conducted for the year 2004-05 with a sample size of 63,016 households, which were used to project estimates for 205.9 million households. The IIMS survey was carried out for the year 2006-07, providing estimates for 321 million earners in the country based on a sample of 100,000 respondents. An earner was defined as a person who was in the age of 18-59 years and getting some cash income.
7.75 Apart from survey data conducted by the NSSO and other agencies, and the banking data obtained through Basic Statistical Returns (BSR) of SCBs, data relating to PACS, UCBs, post offices, insurance companies and SHGs/MFIs are also analysed. Since different data sets are based on different methodologies and definitions, one needs to exercise caution while interpreting different data sets and comparing them. The latest NSSO data relate to the decade ended 2002. In recent years, several initiatives have been taken to increase the flow of credit to the agricultural sector and provide access to banking services, especially to the lower income segments. There is, therefore, also a need to take into account the data beyond 2002 for assessing the current status of financial inclusion. For this purpose, BSR data have been used. The AIDIS survey of NSSO provides information only on household indebtedness; it does not provide information on savings deposits. The major limitation of BSR data, on the other hand, is the multiple accounts held by a single person which makes it difficult to draw firm conclusions about the extent of financial inclusion/exclusion. An assessment of the progress of financial inclusion in India attempted in this section is, thus, subject to certain limitations and non-availability of relevant data.
Financial Inclusion: Credit side (Analysis Based on Surveys)
7.76 The AIDIS of NSSO, which was first instituted by the Reserve Bank in 1951 as All India Rural Credit Survey, provides information on the pattern of households’ indebtedness. The survey is conducted on a decadal basis. The first three surveys, however, collected information in respect of rural households only. Beginning from the fourth survey in 1981, information on indebtedness of urban households has also been provided.
7.77 The number of indebted households, in absolute terms as also as percentage of total households, declined sharply during the period between 1961 and 1981. Thereafter, however, household indebtedness, both in terms of number of indebted households and households with debt as percentage of total households, increased significantly both in rural and urban areas, barring marginal decline in number of indebted households in relation to total households in urban areas. Overall, nearly 24 per cent of the total households in India were indebted in 2002 as compared with around 22 per cent in 1991. The share of rural indebted households in the total indebted households increased from around 77 per cent in 1991 to around 80 per cent in 2002. Indebtedness (households with debt as percentage of total households) was larger in rural areas than that in urban areas. Furthermore, the gap between rural/urban indebtedness widened in 2002 as compared with 1991 (Table 7.4). According to another survey released by the NCAER in 2008, at end-June 2005, 23.9 per cent (49.2 million) of all Indian households had loans outstanding with the ratio being 20.9 per cent (12.8 million) in urban and 25.2 per cent (36.4 million) in rural areas (NCAER, 2008).
7.78 According to the various rounds of surveys, the aggregate amount of outstanding debt of rural households, in nominal terms, increased significantly during all the previous four decades (1960s, 1970s, 1980s and 1990s). The outstanding debt of urban households also increased in the 1980s and the 1990s. The increase in debt of rural households, both in nominal and real terms, in the 1990s was the largest in any decade. The outstanding debt, in nominal terms, in rural areas during 1991-2002 grew at an annual compound rate of 15.8 per cent, while in real terms it grew by 8.5 per cent (4.3 per cent in the 1980s). In urban areas, the outstanding debt, both in nominal and real terms, between 1991 and 2002 grew at a somewhat lower rate than in rural areas (Table 7.5).
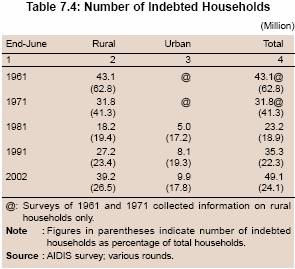
7.79 Outstanding debt per indebted household in real terms both in rural and urban areas increased sharply between 1991 and 2002 (Table 7.6).
7.80 Both in rural and urban areas, the indebtedness generally increased with the increase in income levels [represented by asset holding classes (AHCs)]. The pattern of indebtedness across different AHCs in rural and urban households remained broadly unchanged between 1991 and 2002 (Table 7.7). The increase in indebtedness in higher AHCs was, inter alia, on account of their enhanced capacity to borrow by providing collateral, increased level of confidence of lenders, higher financing requirements of such households and their awareness about availability of different sources of finance.
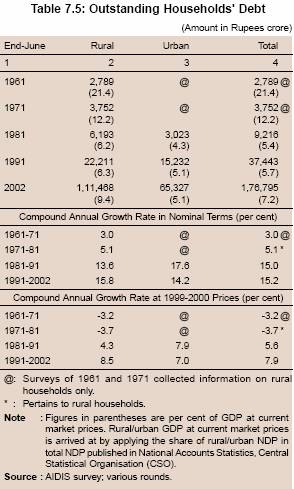

7.81 Institutional (Government, co-operative societies and banks) and non-institutional (landlords and moneylenders) sources are broadly the two main sources from which households borrow. Between 1981 and 1991, the share of number of households indebted to institutional sources increased sharply, while that of indebted to non-institutional sources declined correspondingly. Between 1991 and 2002, the number of households indebted to institutional sources in absolute terms, both in rural and urban areas, continued to increase. However, reversing the trend of previous three decades, the share of households indebted to institutional sources in the total indebted households declined, while that of households indebted to non-institutional sources increased. The decline was relatively more pronounced among rural households and was due to decline in recourse to all the three major institutional agencies, viz., Government depar tments, cooperative societies and commercial banks (Table 7.8). According to the Report of the Committee on Financial Inclusion (Government of India, 2008), as per NSSO data, 45.9 million farmer households in the country out of a total of 89.3 million households do not access credit, either from institutional or non-institutional sources. A more or less similar trend was observed in the pattern of outstanding household debt. The share of institutional sources, which had increased sharply between 1981 and 1991, declined between 1991 and 2002 (Table 7.9).
7.82 The pattern of indebtedness of the households across different AHCs, representing the income levels, shows that the recourse to non-institutional sources is relatively high, both in rural and urban areas, by lower income groups. In other words, as the income levels go up, the proportion of people borrowing from non-institutional sources tends to decrease (Table 7.10).
7.83 This is corroborated by Invest India Incomes and Savings Survey (2007)7 conducted by IIMS which also suggests that the earners at higher income level borrow more from institutional sources than non-institutional sources. The survey found that 70 per cent earners in the annual income bracket of more than Rs.400,000 borrowed from institutional sources as compared with only 27.5 per cent in the case of earners in the income bracket of less than Rs.50,000 (Table 7.11).
7.84 The relatively increased reliance of households with low income on non-institutional sources could be due to several factors. At low income levels, requirements generally include borrowings for purposes for which loans are not readily available from institutional sources. The inability to provide collateral to take recourse to the formal financial system could be another significant factor. On the other hand, the greater indebtedness of the higher AHCs to institutional sources, amongst both the rural and urban households, could be on account of their enhanced capacity to borrow, increased level of confidence of lenders in them, higher financing requirements of such households and their greater awareness about availability of different sources of finance.
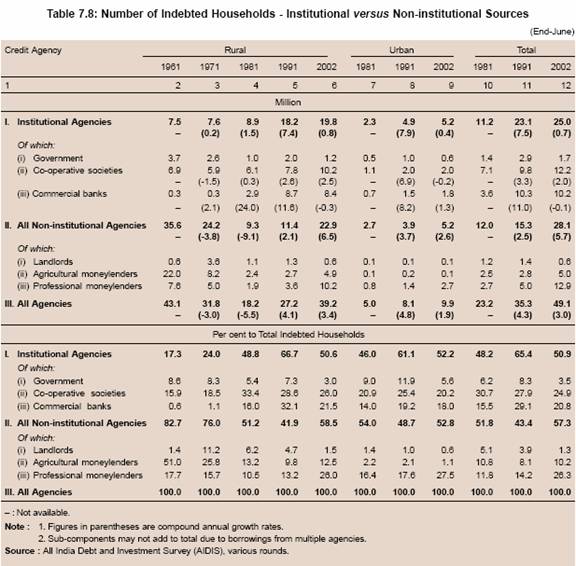
7.85 According to the NSSO’s 59th round survey, the share of non-institutional sources in the outstanding household debt increased sharply in 2002 as compared with 1991. A major reason for increase in the overall household debt and the increase in the share of households indebted to non-institutional sources between 1991 and 2002 was a significant increase in current farm expenditure and household expenditure, especially in rural areas (Table 7.12). The ‘household expenditure’ includes expenditure incurred on purchase of residential plot; purchase, construction, addition/alteration of building for residential purposes; purchase of durable household assets, clothes, among others and expenditure on medical treatment, education, marriages, and ceremonies (Annex VII.1). Thus, the ‘household expenditure’ includes many items for which households may find it difficult to obtain loans from institutional sources.
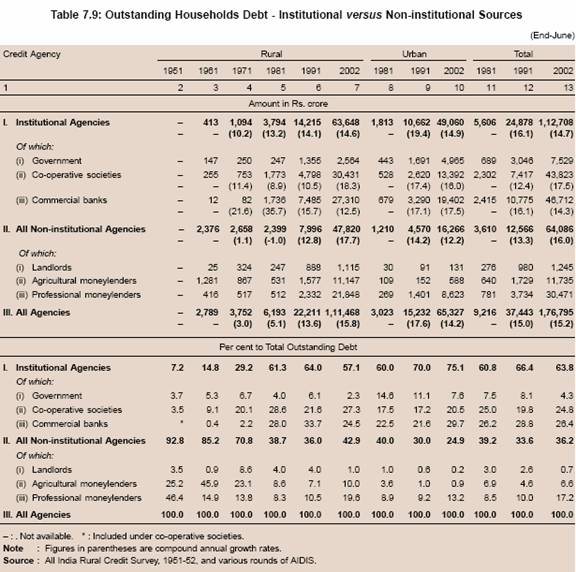
7.86 The Invest India Incomes and Savings Survey for the recent period (IIMS, 2007) also suggests that a large portion of loan is taken by the households for meeting financial emergency, medical emergency and social obligations. These three purposes accounted for about 53 per cent of the loans availed of by indebted earners. Furthermore, more than 60 per cent earners, indebted to non-institutional sources, took loans for the aforesaid three purposes (Table 7.13). In the case of emergencies, people may find it convenient to approach non-institutional sources for their credit needs. Financial emergencies, for instance, include unplanned expenditure on business, consumption and marriage, among others, which may not be financed by banks and other institutional agencies.
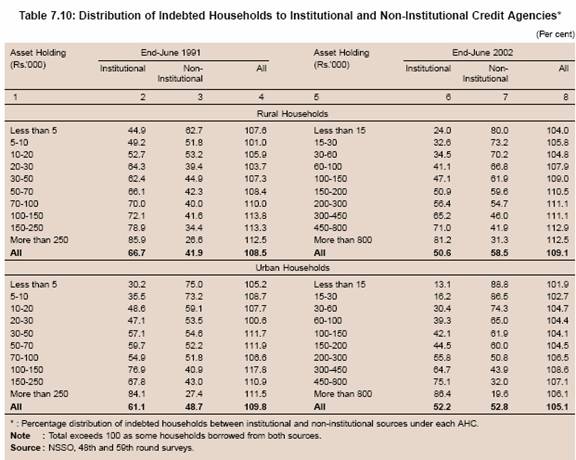
7.87 The AIDIS is the single most important source of data for assessing financial inclusion, at least for assessing the availability of credit. According to this data source, as alluded to earlier, the share of institutional sources in household debt declined between 1991 and 2002, while that of non-institutional sources increased. However, a detailed analysis suggests that institutional sources continued to provide credit in the 1990s broadly at the same pace as in the 1980s as is borne out by the following points. First, the total number of indebted households and the number of indebted households as percentage of total households in rural areas, which had declined significantly between 1961 and 1981, increased sharply between 1981 and 1991 and between 1991 and 2002. Outstanding debt of rural households, which had declined in relation to GDP between 1961 and 1981, increased marginally between 1981 and 1991, but significantly between 1991 and 2002. As a result, the debt to asset ratio in rural areas increased significantly from 19.9 per cent in 1981 to 23.4 per cent in 1991 and further to 26.5 per cent in 2002. However, a major reason for increased indebtedness between 1991 and 2002 was the sharp increase in number of indebted rural households, who borrowed for current farm expenditure, productivity of which, inter alia, depends on monsoon and other factors, and for household expenditure. As a result, in relative terms, the share of institutional sources declined significantly between 1991 and 2002. In absolute terms, the number of households indebted to banks remained more or less at the same level between 1991 and 2002, while those indebted to co-operative societies increased (refer Table 7.8). Outstanding household debt from institutional agencies grew at a compound annual rate of 14.7 per cent between 1991 and 2002, more or less comparable to the growth rate of 16.1 per cent between 1981 and 1991. Outstanding households’ debt from banks grew at a compound rate of 14.3 per cent between 1991 and 2002, which was moderately lower than the annual compound growth rate of 16.1 per cent between 1981 and 1991. Outstanding debt from co-operative societies, however, grew at a higher annual compound rate of 17.5 per cent between 1991 and 2002 than 12.4 per cent between 1981 and 1991 (refer Table 7.9). It is also significant to note that these growth rates were achieved on a large base as the growth rate between 1981 and 1991 was significantly high.
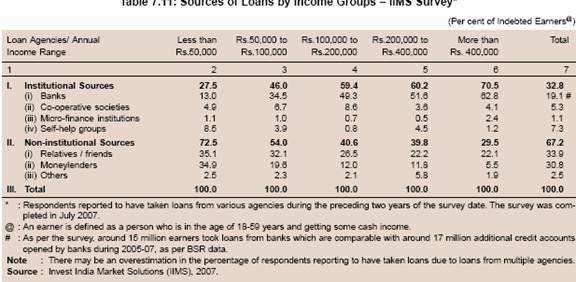
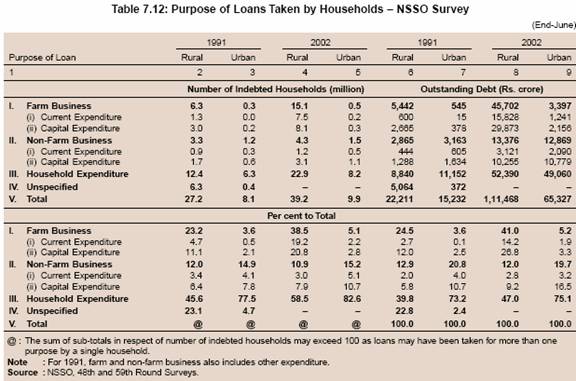
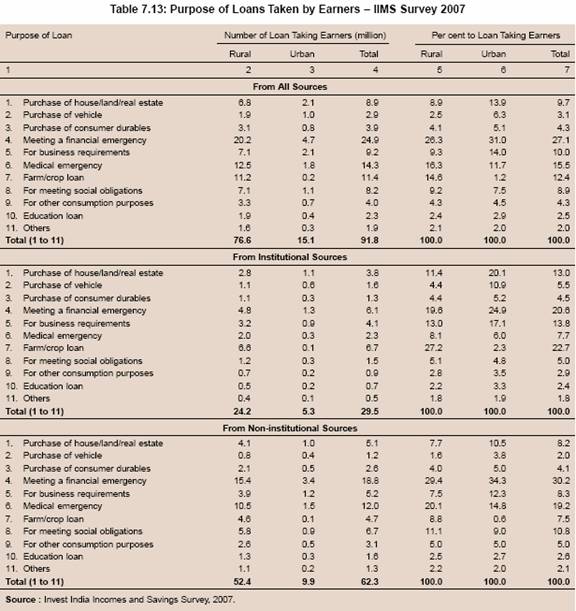
7.88 Second, some deceleration in bank credit to households needs to be seen in the context of change in banks’ behaviour in the 1990s due to their impaired balance sheets. During the 1990s, banks’ health became a major concern, as a result of which their focus shifted from expanding credit portfolio to strengthening balance sheets by investing in government securities in which the risk-adjusted returns were perceived to be higher. Banks also became somewhat risk averse after prudential norms were tightened during the early 1990s. As a result, overall credit growth by the banking sector to all the sectors, including agriculture, slowed down significantly in the 1990s in comparison with the 1980s as detailed in Chapter VI. The slowdown in credit to households was, thus, in line with the overall slowdown in bank credit.
7.89 Third, the slowdown in credit to households also needs to be seen in the context of the slowdown in agriculture and allied activities. The index of agricultural production showed a low annual growth of 0.6 per cent during the NSSO survey period (between the 48th and 59th round) as compared with 3.5 per cent during the 1980s (Table 7.14). This may have led to reduced credit demand for agricultural investment purposes from the banking system. As lower income households generally take higher recourse to non-institutional sources to meet their household consumption requirements, slower growth in the rural incomes may have induced such households to approach non-institutional sources to meet their credit requirements. As alluded to earlier, according to the NSSO data, between 1991 and 2002, the increase in the indebtedness to the non-institutional sources was more pronounced in the case of lower AHCs. Fourth, the loan waiver of the 1990s could also have affected the overall credit culture and the attitude of banks to agricultural loans.
7.90 Fifth, the last round of NSSO survey related to the year 2002. Subsequently, several policy initiatives have been taken by the Government/ Reserve Bank to improve the credit flow to the needy sectors. These measures had a significant positive impact on financial inclusion as revealed by the analysis in the following section based on the BSR and other sources of data.
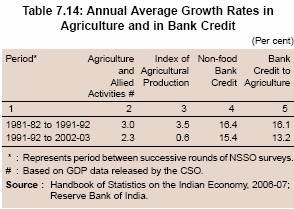
Analysis Based on Banks/Other Institutions Data
7.91 While the existing surveys such as NSSO, IIMS and NCAER/Max New York Life provide information from the household side, BSR and other institutional sources provide data from institutions’ side not only on credit but also on deposit growth. In view of various limitations of surveys, and also to have an updated picture of financial inclusion, it is useful to examine the data available from other institutional sources such as commercial banks, RRBs, UCBs, PACS, and post offices. Thus, the analysis in the following section makes an assessment of financial inclusion from various perspectives, including availability of institutional network, instruments and infrastructure for financial services. As detailed in the previous section, several initiatives were taken in recent years to promote financial inclusion. In June 2004, the Central Government had announced the ‘farm credit package’ which, among others, stipulated doubling the flow of institutional credit to agriculture in the ensuing three years. The flow of credit to the farm sector, in fact, doubled after two years, ahead of the stipulated time period. The Union Budget 2008-09 has set a target of Rs.280,000 crore for agricultural credit during 2008-09. The RRBs, which were set up to pay focussed attention to the rural sector, suffered from poor health. However, the recent restructuring has had a positive impact as a result of which there is an evidence of increased credit flow to agriculture/rural sector by RRBs (refer Table 7.24). The share of RRBs in total institutional credit flows to agriculture improved in recent years. There have also been several innovative micro-finance based experiments catering to highly localised needs. Incentives have been provided for penetration of banking into unbanked areas and encouraging intermediaries such as NGOs, MFIs and CSOs. The definition of the priority sector has been modified to encourage the flow of credit to employment intensive sectors. Another major initiative relates to ‘no frills’ accounts, which have made significant progress in a short period.
Population per Branch
7.92 One of the indicators for measuring banking access is the population per branch. Following the nationalisation of banks in 1969, branch network of SCBs expanded rapidly. As a result, the population per branch declined significantly between 1969 and 1991. The population per branch in the rural segment increased after 1991. The population per branch, however, continued to decline in the urban areas (Table 7.15)8. One of factors responsible for increase in population per branch in rural areas between 1991 and 2007 was the reclassification of 953 rural centres, classified as rural as per 1991 census, which moved to higher population centres on account of increase in population. Besides reclassification, there were also instances where certain centres, which were earlier classified as rural, were brought into the jurisdiction of the adjoining municipality/municipal corporations and, thus, classified as urban/metropolitan depending on the population of municipality/municipal corporation.
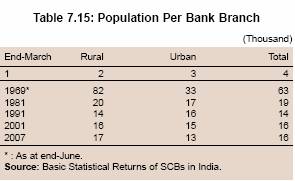
Credit Accounts
7.93 The number of total credit accounts per 100 persons/adults, which is one of the indicators of the expansion of credit delivery services, after declining between 1991 and 2001, increased significantly thereafter. At the disaggregated level also, credit accounts per 100 persons/adults in both the rural and urban areas improved between 2001 and 2007 (Table 7.16). The significant increase in credit accounts, particularly in the urban areas, in recent years was on account of robust growth in retail, housing and consumer finance. This was mainly due to rise in the purchasing power, changing consumer demographics and high potential for growth in consumption, technological innovations in delivery of financial services/products, and recognition of retail business by the financial entities as an important part of their business activities. At present, the retail banking sector is characterised by three basic elements: multiple products (deposits, credit cards, insurance, investments and securities); multiple channels of distribution (call centre, branch, internet and kiosk); and multiple customer groups (consumers, small businesses, and corporates). The typical products offered in the Indian retail banking segment are housing loans, consumption loans for purchase of durables, auto loans, credit cards and educational loans. Within the retail segment, housing credit increased significantly over the last few years (refer Chapter VI for details).
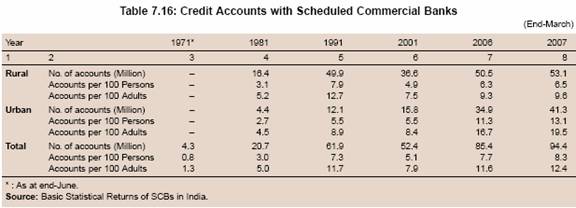
7.94 Credit account penetration (credit accounts per 100 persons) declined both in the rural and urban areas in all the regions between 1991 and 2001, barring the urban areas in the Northern and Eastern Regions where they increased moderately and the Western Region where they remained unchanged. Credit accounts penetration, however, increased significantly in both the rural and urban areas in all the regions between 2001 and 2007 (Table 7.17).
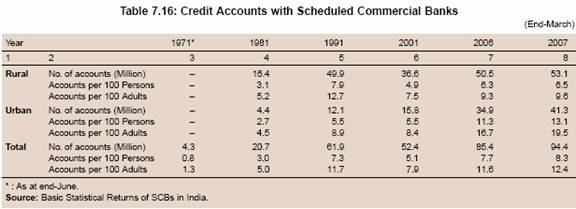

7.95 For the purpose of financial inclusion, progress in the small accounts is particularly relevant. The breakup of credit accounts suggests that the share of number of credit accounts with credit limit up to Rs.25,000 in total credit accounts and the amount outstanding in such accounts in total credit outstanding declined between 1991 and 2002 and further by 2007. The credit accounts with credit limit of Rs.25,000-Rs.2,00,000 and the amount outstanding in these accounts showed a consistent increase during 1991-2007 (Table 7.18). However, this pattern to a large extent, might have been on account of migration of some loans (which are in nominal terms) with credit limit up to Rs.25,000 to the higher categories due to the impact of inflation.
7.96 Adjusted for inflation, the share of loans with less than Rs.25,000 credit limit continued to decline between 2001 and 2006. However, the decline was much smaller in the case of credit limit adjusted for inflation than unadjusted (Table 7.19). The share of number of accounts in credit limit of Rs.25,000-Rs.200,000, increased between 1991 and 2000 as also thereafter through 2006. However, the increase was relatively lower in the case of credit limit adjusted for inflation than unadjusted. This pattern, inter alia, reflected the impact of improvement in real income, resulting in higher amount of credit demand and high growth in retail credit.
7.97 The number of credit accounts with the RRBs also declined somewhat in the late 1990s, but increased sharply during the current decade (Table 7.20).
Co-operative Credit
7.98 Rural credit co-operatives in India were envisaged as a mechanism for pooling the resources of people with small means and providing them with access to different financial services. The short-term rural co-operative credit structure (STCCS) provides mainly short-term credit and other financial services, which are of particular relevance from the point of view of financial inclusion. At end-March 2006, the three-tier STCCS consisted of nearly 106,400 PACS at the village level, 370 district central co-operative banks (DCCBs) at the district level with 12,991 branches and 30 state co-operative banks at the State level with 962 branches. One PACS on an average, serves 6 villages. With a total membership of more than 125 million rural people, PACS is possibly one of the largest rural financial systems in the world. The number of borrowing members increased significantly between 1994 and 2003, before declining thereafter (Table 7.21).
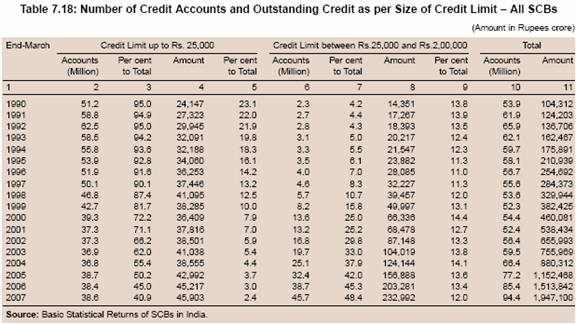
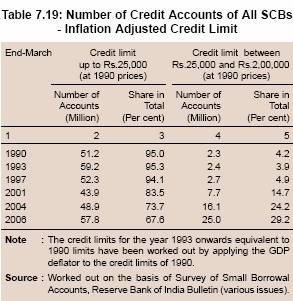
7.99 UCBs play an important role in meeting the growing credit needs of urban and semi-urban areas of the country. They mobilise savings from the middle and lower income groups and purvey credit to small borrowers, including weaker sections of the society. These banks in India are financial co-operatives akin to credit unions found abroad, except that they can also accept deposits from non-members. UCBs also form a part of the payment system.
7.100 In view of the special thrust on financial inclusion in recent years, co-operative banking has acquired renewed significance in the Indian financial system. Being member-driven institutions working on a collective principle, they facilitate the pooling of resources for the purpose of lending to their members who are also the banks’ shareholders and, therefore, have a crucial stake in the affairs of the bank. In some parts of the country such as Maharashtra, Gujarat and Karnataka, UCBs play a significant role in extending banking services in the urban areas. As at end-March 2007, there were 7,670 branches (including extension counters) of 1,813 UCBs in India. Provisional estimates indicate that at end-March 2007, UCBs provided credit to around 7 million borrowers aggregating Rs.78,660 crore.
Micro-finance
7.101 In the recent period, micro-finance has emerged as an important semi-formal mode of credit delivery to the people, particularly to those who are excluded from the formal financial system. There are two broad models of micro-finance in India, viz., SHG-bank linkage model and MFI model. Of these two models, the SHG-bank linkage has made rapid strides since its inception in the early 1990s. Commercial banks, co-operative banks and RRBs are actively engaged in the programme. As on March 31, 2007, 50 commercial banks, 96 RRBs and 352 cooperative banks were participating in the programme. The number of bank branches lending to SHGs was 35,294 at end-March 2006 and the number of participating NGOs and other agencies was 3,024. The programme is being implemented in 31 States/ UTs and 587 districts.
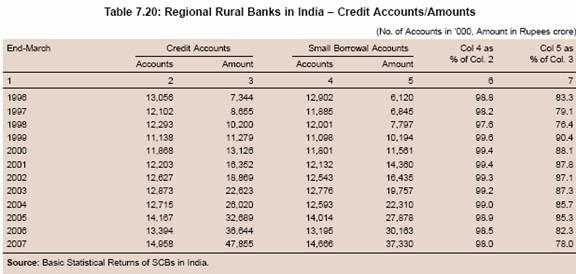
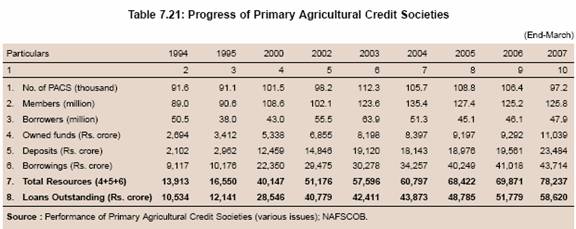
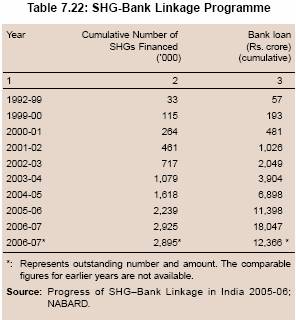
7.102 The number of bank linked SHGs increased sharply, especially from 1999-2000. By 2006-07, about three million SHGs were bank-linked (Table 7.22). Assuming that, on an average, each SHG finances 14 members, the cumulative number of households served by SHGs-bank linkage programme would amount to about 41 million at end-March 2007. The estimated number of poor people assisted would, thus, be about 205 million, assuming average household size of 5 persons.
7.103 The region-wise pattern of SHGs linked to banks showed a greater concentration in the Southern region, although the spatial disparity declined over the years with the significant increase in the share of other regions, particularly the Eastern region (Table 7.23).
7.104 The average loan amount per SHG was Rs.61,648. A significant feature of the programme was the active participation of women (90 per cent) and timely loan repayment (over 90 per cent). The high repayment rates of the SHGs provided comfort to the banks for lending to the SHGs (Box VII.14).
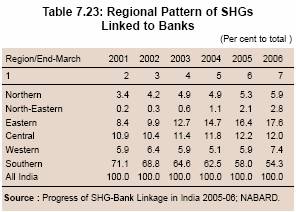
Box VII.14 SHG-Bank Linkage Programme : An Assessment
A few assessment studies have been carried out on the impact of the SHG-bank linkage programme in India at the grass root level. Puhazhendi and Satyasai (2000) observed that there was a shift in the income slabs of households towards higher income slabs between pre and post-SHG situation. About 74 per cent of the sample households were below an annual income level of Rs.22,500 during pre-SHG situation. The proportion declined to 57 per cent in the post–SHG situation due to increased income levels. Further, involvement in the group significantly contributed to improving the self-confidence of the members. The feeling of self-worth and communication with other group members improved after association with the SHGs. The members were relatively more assertive in confronting with social evils and problematic situations.
In another assessment, Puhazhendi and Badatya (2002) found that availing loans from moneylenders and other informal sources with higher interest rates was significantly reduced due to SHG intervention. It was also observed that consumption oriented loans were replaced by production oriented loans during post-SHG situation.
Another study (APMAS and EDA Rural Systems, 2006) observed that 30 per cent of SHGs in the sample were involved in community actions. These involved improving community services (43 per cent of the total actions, including water supply, education, health care, veterinary care, village road),trying to stop alcohol sale and consumption (31 per cent), contributing finance and labour to new infrastructure (12 per cent), protecting natural resources and acts of charity (to non-members). The most common single type of action taken up by SHGs was the attempt to close down local liquor outlets.
The study also pointed out that such community actions involved a new boldness and confidence for women, often involving putting pressure on the authorities (panchayat, district officers and police) to do their jobs, whether through petitions or by staging rallies and blockades; and varying degrees of skill in negotiation with SHG leaders.
Some of the States like Andhra Pradesh are trying to implement various developmental and poverty alleviation schemes through SHGs.
References:
1. Puhazhendi, V. and Satyasai, K.J.S. 2000. Micro-finance for Rural People: An Impact Evaluation; NABARD.
2. Puhazhendi, V. and Badatya, K.C. 2002. SHG-bank Linkage Programme for Rural Poor - an Impact Assessment; www.microfinancegateway.org
3. APMAS and EDA Rural Systems. 2006. Self-Help Groups in India: A Study of the Lights and Shades; Study by Andhra Pradesh Mahila Abhivruddhi Society (APMAS) and EDA Rural Systems Private Ltd; www.apmas.org
7.105 From the above analysis, it is evident that credit delivery from formal financial institutions to the relatively excluded segments has improved significantly in recent years due to various initiatives by the Reserve Bank and the Government. As a result, overall credit to agriculture by all credit institutions grew at an annual compound rate of 26.5 per cent between 2002-03 and 2007-08 as compared with 16.8 per cent between 1991-92 and 2001-02 (Table 7.24).
7.106 To sum up, there has been a distinct improvement in credit penetration (credit accounts per 100 persons) and credit flow to the rural sector in general and to agriculture since the early 2000s, that is, during the period subsequent to the reference year of AIDIS by the NSSO. Taking together all sources of formal credit, the number of credit accounts per 100 adults, which had declined from 20 in 1993 to 18 in 2002, improved to 25 in 2007 (Table 7.25).
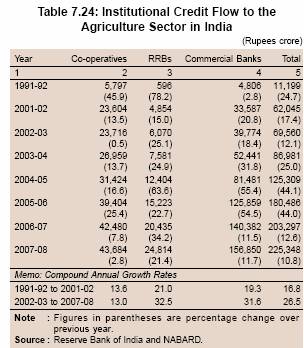
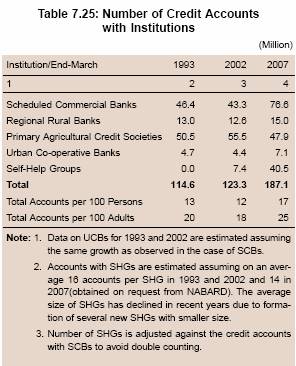
Financial Inclusion: Deposit Side
7.107 Apart from the availability of credit, the facility of deposits is another key element of financial inclusion. This is particularly important for the people with low and irregular income. Access to facility of safe deposits enables such people to plan their expenditure with convenience. This also promotes thrift and develops the culture of saving. In the absence of such facility, people may keep their savings in various informal forms such as cash at home or deposit with relatives/moneylenders. The possibility of losing money in such cases is very high which inflicts hardships to people and also discourage them to save more. A key to safe deposits is the ability to withdraw money from accounts as and when required. Thus, the nature of products available in this regard could play an important role in promoting financial inclusion.
7.108 In the Indian context, savings deposit accounts are provided by banks and post offices. Accordingly, this section examines the progress made by the banking system and post offices in terms of providing savings accounts based on the BSR data for banks and the data obtained from the Postal Department. A limitation of this analysis is the multiple accounts held by one individual and the dormant accounts that may not have been operated for a long time. Nevertheless, per capita deposit accounts can provide some impor tant insights into the progress made in promoting financial inclusion.
Savings Bank Accounts
7.109 The number of savings accounts opened by SCBs expanded significantly over the years, especially between the early 1970s and the early 1990s. The expansion in savings accounts was much faster than the population growth, resulting in a substantial improvement in savings account penetration (savings accounts per 100 persons) (Table 7.26). The improvement was observed both in the urban and rural areas. The number of savings accounts per 100 persons/adults, which declined between 1991 and 2002, increased sharply thereafter. As a result, the number of savings accounts per 100 persons/adults at end-March 2007 was larger than that at end-March 1991. This reflects rise in the income levels and the various initiatives taken by the Reserve Bank such as urging banks to open ‘no frills’ accounts with ‘nil’ or low minimum balances.
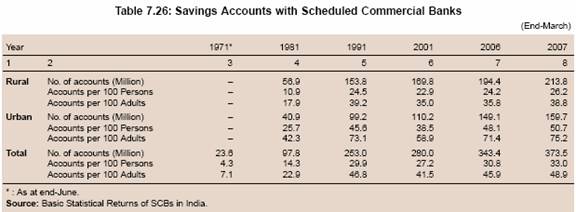
7.110 The region-wise pattern indicates that savings accounts per 100 persons declined between 1991 and 2001 in all the regions, barring North-Eastern and Central regions in which the number of savings accounts per 100 persons increased. This pattern was observed broadly in both the rural and urban areas. However, savings account penetration increased sharply between 2001 and 2007 in both the rural and urban areas in all the regions (Table 7.27). The access to savings accounts was more evenly spread in comparison with credit accounts. Credit accounts showed a greater concentration in the Southern region, while savings accounts were more or less evenly spread in the Northern, Southern and Western regions. However, penetration of both savings accounts and credit accounts was low in the NorthEastern, Eastern and Central regions.
7.111 The number of savings accounts with RRBs, which are included in scheduled commercial banks data in Table 7.27, increased significantly between 1991 and 2006. In tandem with the growth in the number of accounts, the deposits with RRBs also increased (Table 7.28).
7.112 With a view to providing financial inclusion, the Reserve Bank had advised all banks to make available a basic banking ‘no-frills’ account either with ‘nil’ or low minimum balances as well as charges, as alluded to earlier. There has been a significant progress in the number of ‘no frills’ accounts opened by banks in India (Table 7.29).
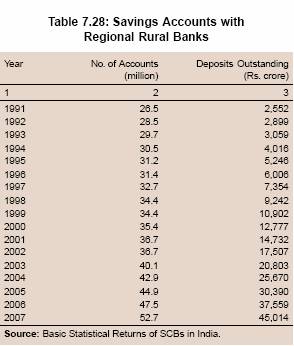
7.113 According to the Invest India Incomes and Savings Survey 2007, the proportion of respondents having savings accounts was significantly lower in the low income groups, than in the higher income groups. The proportion of population having a bankaccount increased with the increase in the level of income. The survey also indicated that around 45 per cent of respondents had a savings account with a bank. Furthermore, the number of savings accounts held in urban areas was higher than that in rural areas (Table 7.30).
7.114 Another survey, conducted by Max New York Life and NCAER, found that at the all-India level, 66 per cent of households own accounts in a financial institution (commercial bank, post office, regional rural banks and registered societies). This percentage was lower in rural areas at 59 per cent as compared with 82 per cent in the urban areas (NCAER, 2008). The survey also indicated that 36 per cent of total households in India preferred to keep savings at home, while more than half of the Indian households preferred to keep their savings in bank deposits. In rural areas, the preference for keeping savings at home (41.7 per cent) was significantly higher than that in urban areas (23.4 per cent). On the other hand, significantly higher number of households (62.6 per cent) in urban areas preferred to keep savings in bank deposits as compared with those in rural areas (45.3 per cent).
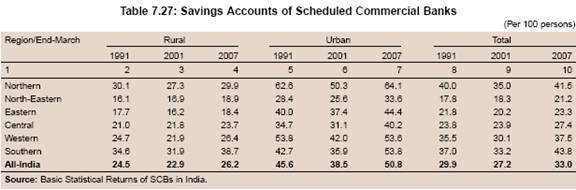
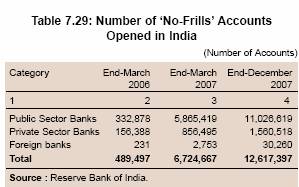
Postal Savings and Remittance
7.115 Apart from the banking system, the post offices in India also provide the services of maintaining deposits and remittances. The Indian Postal Service with 155,516 post offices at end-March 2005 is the most widely spread post office system in the world. The numbers of post offices were more than twice the number of bank branches in the country with a large presence in remote areas. A post office in India, on an average, served 7,046 persons at end-March 2005. Indian post offices offer various types of small savings schemes and also provide other banking and financial services. Small savings schemes include deposits of various maturities and public provident funds. Other financial services include money order, international remittance, mutual fund and postal life insurance.
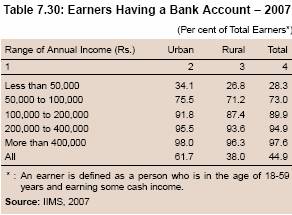

7.116 The number of savings bank accounts with the post offices, which provide cheque facility, was 60.3 million, i.e., about 19 per cent of the savings accounts with banks (about 320 million). The amount of savings deposits per account in post offices was around Rs.2,500 at end-March 2005 as compared with around Rs.15,000 with banks. This was because post offices largely cater to the banking needs of the low income groups. Apart from the savings bank accounts, post offices also offer several other products (Chart VII.3).
7.117 The aggregate picture of savings accounts with different institutions (SCBs, RRBs, UCBs, PACS and post offices) showed a steady improvement in absolute terms from 1993 to 2002 and further in 2007. However, savings accounts per 100 persons/adults declined in 2002 as compared with 1993. The position improved significantly thereafter. As a result, savings accounts per 100 persons/adults in 2007 were more than those in 1993 (Table 7.31).
Insurance Services
7.118 In most countries, a large segment of the population does not have access to formal insurance services. Micro-insurance services in a number of countries have begun to expand only in recent years. The Insurance Regulatory and Development Authority (IRDA) has been actively encouraging insurance services for low-income households. In 2002, the IRDA established rural and social sector targets for insurance companies. All insurers entering the business after the start of the IRDA Act, 1999 are required to comply with the obligations towards the rural and social sectors in a phased manner. In India, the total number of life insurance policies (individual single premium) was about 3.41 million in November 2007 (IRDA, 2008). This implies that there are only around 3.1 policies per thousand persons. The insurance penetration (insurance premium as percentage of GDP) in India was relatively higher as compared with several emerging market economies, but significantly lower than that in advanced economies (Table 7.32).
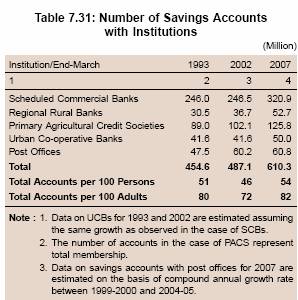
An Assessment of Financial Inclusion by Various Agencies: A Comparison
7.119 A comparison of the NSSO’s All-India Debt and Investment Survey and the BSR data brought out by the Reserve Bank9 suggests that there are significant differences in the credit to households extended by banks (Table 7.33). The extent of household indebtedness to the banking system appears to be grossly underestimated by the NSSO data, both in terms of households/accounts and credit outstanding. Furthermore, number of credit accounts and amount outstanding in such accounts, as revealed by the BSR data, increased sharply between 2002 and 2007.
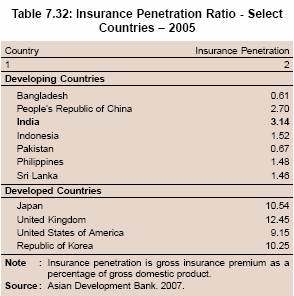
7.120 A comparison of the consolidated BSR data on savings accounts and other institutions (accounts with UCBs, post offices and PACS) with NCAER/Max New York Life survey also indicates significant differences in the extent of financial inclusion. According to data from banks and various other financial institutions, 54 persons out of 100 held a savings account with one or the other formal financial institution in 2007 as compared with 50 accounts per 100 persons in 2005. Assuming 5 persons as the average size of households, this works out to about 250 accounts per 100 households (2.5 accounts per household). NCAER/Max New York Life survey, on the other hand, found that 66 per cent households held account with a financial institution, which worked out to 13 accounts per 100 persons10 (Chart VII.4). The differences in the magnitude of financial inclusion/ exclusion of the various studies may, inter alia, be on account of data problems and differences in the methodologies, definitions and other factors discussed above. There is, therefore, a need to interpret the results based on the data from various sources carefully.
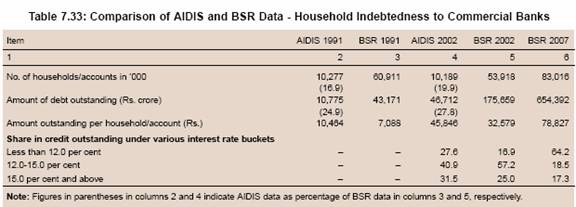
7.121 While assessing savings accounts penetration, it is pertinent to exclude people who have very little or no capacity to save. About 22 per cent people below the poverty line would not have savings to put in bank deposits or other alternative avenues. This is also corroborated by the Max New York Life-NCAER Study (2008) which found that about 20 per cent of the total households did not have savings. Thus, a section of the households would be constrained to access the banking services due to lack of savings rather than the lack of banking services available to them. After excluding the people below poverty line, it is estimated that in India there are 105 accounts per 100 adults11.
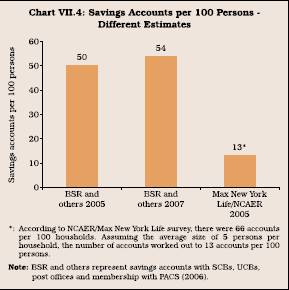
7.122 An empirical analysis suggests that economic development and infrastructure (demand side factors), and branch network (supply side factor) were the main determinants of financial inclusion. Simultaneously, financial inclusion, among others, also affects economic development (Box VII.15).
7.123 To sum up, according to the All India Debt and Investment Survey of the NSSO, the household indebtedness increased sharply between 1991 and 2002. This was mainly on account of sharp increase in consumption and other expenditure, which could not be easily financed from institutional sources. Data also suggest that in absolute terms, the number of households indebted to institutional sources, both in rural and urban areas, increased between 1991 and 2002. However, the proportion of households indebted to institutional sources and the share of institutional sources in households’ outstanding debt declined sharply between 1991 and 2002. A detailed analysis suggests that institutional agencies continued to increase credit to households between 1991 and 2002 more or less at the same rate as between 1981 and 1991. However, sharp increase in credit for consumption and other unproductive purposes from non-institutional sources resulted in a significant decline in the share of institutional sources in total number of indebted households and their outstanding debt.
Box VII.15 Relationship Between Financial Inclusion and Development Indicators
Both the demand and supply side factors have an important bearing on the use of banking services. The supply side factors, inter alia, include distance from branch, branch timings, cumbersome documentation and procedures and suitability of products. On the demand side, the main factors affecting the demand for financial services are income level, infrastructure development and financial literacy. In fact, it is argued in the literature that there is a two-way relationship between financial inclusion and economic development, i.e., greater financial inclusion leads to higher level of income which, in turn, leads to higher financial inclusion.
The literature on finance and growth suggests that financial inclusion is one of major determinants of economic growth. Higher economic growth and infrastructure, in turn, play a crucial role in promoting financial inclusion. It is, thus, argued that in order to achieve the objective of growth with equity, it is imperative that infrastructure is developed in tandem with financial inclusion as this would facilitate and enhance credit absorptive capacity. An exercise was undertaken to empirically examine the inter-relationship between financial inclusion and economic development in general and infrastructure development in particular based on State-wise panel data for 2001 and 2006. Savings and credit accounts per 100 persons were taken as proxy indicators of financial inclusion. Per capita income was used as an indicator of economic development and electricity consumption and road length were taken as indicators of infrastructure development.
The following findings emerge from the analysis. First, apart from per capita income and branch network, electricity consumption is a significant factor in determining expansion of savings accounts. Second, electricity consumption also influences credit account penetration in a significant manner. Third, apart from credit accounts per 100 persons, infrastructure development also significantly affects per capita income level (Table 1). Thus, economic development and infrastructure appear to play a crucial role in financial inclusion by creating conducive conditions for expansion of savings and credit activities. Financial inclusion also has a positive impact on economic growth.

7.124 Bank credit to households grew at a slightly lower rate between 1991 and 2002 as compared with that between 1981 and 1991. However, this needs to be viewed in the context of banks’ increased focus on strengthening of their balance sheets and some degree of risk aversion in the wake of introduction/ tightening of prudential norms. During the period, banks’ overall credit also slowed down. The marginal slowdown in banks’ credit to households was, thus, in line with the overall slowdown in credit. The demand for credit in the rural sector was also affected by slowdown in agriculture growth during the period. The last AIDIS survey was conducted for the year 2002. Subsequently, however, several initiatives were undertaken by the Reserve Bank and the Government to increase the credit flow to needy sectors and bring more people within the banking fold. There has been a distinct improvement in credit penetration (credit accounts per 100 persons) and credit flow to the rural sector in general and to agriculture, in particular, since the early 2000s. Taking together all the formal sources of credit, the number of credit accounts per 100 adults improved significantly from 18 in 2002 to 25 in 2007. A comparison of NSSO and BSR data suggests that the extent of household indebtedness to the banking system is grossly underestimated by the NSSO data both in terms of households/accounts and credit outstanding, which could be on account of differences in methodology, among others.
7.125 On the deposit side, savings accounts per 100 persons/adults declined marginally in 2002 as compared with 1993 for the reasons as indicated above. The position, however, improved significantly thereafter and savings accounts per 100 persons/ adults in 2007 were more than those in 1993. According to the consolidated data on savings accounts with banks and other institutions (UCBs, post offices and PACS), 54 persons out of 100 held savings accounts in 2007. Assuming five persons as the average size of households, about 250 accounts were held per 100 households or 2.5 accounts per households. The NCAER/Max New York Life survey on households conducted in 2005 suggests that 66 per cent of households held accounts with financial institutions, which work out to 13 accounts per 100 persons. This suggests that there are significant differences in the various data sets/sources and that there is need for an extreme caution while drawing any conclusions about the extent of financial inclusion/exclusion.
7.126 Much more detailed work needs to be done to assess the progress of financial inclusion in the country and to then devise further strategies for promoting it. Reliance on a single source of data can lead to erroneous conclusions and incomplete assessment of the real situation. Significant progress has been made in various directions in the current decade after public sector banks were strengthened financially over the 1990s. Finally, the data suggest a very significant strengthening of the micro-finance movement. Its spread in regions other than the South now needs to be pursued vigorously. The empirical evidence in the Indian context suggests that economic development and infrastructure (demand side factors), and branch network (supply side factor) were the main factors affecting financial inclusion. Financial inclusion, among others, also affects economic development.
VI. OPERATING COST AND LEVERAGING OF TECHNOLOGY FOR FINANCIAL INCLUSION
7.127 Operating cost of providing financial services and the charges levied on the users are important dimensions of the process of financial inclusion. It is argued that the operating cost of small accounts or low value transactions often exceeds the revenue from such operations. As a result, banks either become cautious in providing such services or charge higher levies from the users of such services. In both the cases, the operating cost is considered as one of the major obstacles in promoting financial inclusion. This section, therefore, focusses on the operating cost of financial inclusion and examines as to how it could be minimised.
Lender’s Perspective
7.128 Banks often tend to adopt a cautious approach while extending services to lower income groups due to fear of loan losses or inability to recover the loans, especially when the poor have hardly any asset to pledge as ‘collateral’. In the case of deposit facility, the operating cost of maintaining an account, particularly when the average deposit in the account is low, may make it an economically unviable proposition for banks to extend banking services to low income groups.
7.129 In general, there are three kinds of costs incurred by the formal financial sector while extending credit, viz., (a) cost of funds, (b) operating cost, and (c) cost of loan losses. One would expect the cost of raising funds to be same for all kinds of credit. The operating cost and cost of loan losses may, however, differ across different segments of borrowers. The operating cost of extending small loans is generally perceived to be higher. According to the Planning Commission (2007), the operating cost of servicing micro-credit is significantly higher than the normal finance. Salaries to staff, travelling expenses, commissions not classified under financial costs, expenses on promotion of groups, staff welfare expenses, amortisation and depreciation, rent on hired buildings and other overheads - all constitute the operating cost. These costs are critical to the operations of the formal banking sector. The differential cost of extending small loans to low income groups, particularly in the unbanked areas, is reflected in high rates of interest charged by co-operative credit institutions and MFIs. As these institutions often have less than sufficient deposits, they depend on refinance facilities from other agencies such as NABARD, SIDBI and commercial banks. The Planning Commission observed that the average cost of refinance varies from 8 to 14 per cent. The operationally reasonable interest rate that an efficient MFI should charge from borrowers, however, works out to 22-26 per cent. This difference is largely due to operating cost which is around 10-14 per cent for MFIs as compared with 3-4 per cent incurred by the banks servicing their average borrowers (Planning Commission, 2007).
7.130 Higher perceived operating costs may deter banks from extending even simple banking services such as savings account to low income groups. Some estimates indicate that even the ‘no-frills’ accounts require, on an average, a balance of around Rs.2,000 to be an economically viable activity (Rao, 2007). For instance, in the case of Canara Bank the cost of opening a new (no-frills) account was Rs.48 and cost of each transaction (deposit/remittance) was Rs.1012 . To reach break even, the average amount of deposit required depends on the number of transactions. The break even average deposit level required was Rs.1,911 (for 12 transactions a year) and Rs.11,465 (for 72 transactions a year). The average balance for the Canara Bank was estimated at Rs.528, which was less than half the break even level for 12 transactions in a year (Rao, 2007). A survey of two other banks revealed that the cost structure of operating ‘no-frills’ account was more or less similar to that of Canara Bank. Given that the fixed costs often constitute a large part of operating cost of bank branches and that the number of personnel is generally fixed, calculation of the marginal cost of opening small accounts needs to be examined more carefully and the use of technology to reduce costs in opening and maintaining such accounts needs to be explored further.
7.131 While operating costs of ‘no-frills’ accounts could appear to be high, an analysis of operations in totality for some banks suggests that they can open a large number of ‘no frills’ accounts and still maintain their performance level. For instance, Syndicate Bank opened the largest number of ‘no frills’ accounts (1.25 million) in 2006-07 - the largest by any single bank in a single year. As a result, Syndicate Bank constituted the largest share in ‘no frills’ accounts by the banking industry at end-March 2007. The opening of a large number of ‘no-frills’ accounts in a single year, however, did not appear to have affected the financials of the Syndicate Bank as it was able to maintain its return on assets (RoA) (Table 7.34). It is true that RoA is influenced by several factors, nevertheless, the Syndicate Bank case suggests that the opening of ‘no-frills’ accounts may not be a loss-making proposition. In this context, it may also be noted that the average deposit size in the ‘no frills’ accounts increased in recent years. This trend of increase in average deposit size is expected to gain further momentum in view of high economic growth. Furthermore, extending banking services to lower income groups would trigger a virtuous cycle whereby access to banking services would enable more equitable distribution of the benefits of high economic growth, resulting in improvement in the level of income of the lower income groups. This will lead to increase in average deposit size in the accounts opened by the lower income groups, thereby making financial inclusion an operationally profitable and sustainable business proposition for banks. Moreover, as the economy grows and income growth takes place, today’s ‘no frills’ accounts can be expected to assume the normal account status over the years.
Borrower’s Perspective
7.132 People in India avail credit from a number of agencies such as banks, MFIs and private moneylenders. The cost of borrowing from informal/semi-formal sources is significantly higher than the borrowings from banks (Table 7.35). The high cost of borrowings may be attributed to two factors, viz., operating cost and risk perception. The operating cost of extending credit through MFIs and SHGs models increases because these models involve an additional layer of intermediation between lenders and ultimate borrowers. As regards risk perception, the higher recovery rate in the case of SHGs, however, indicates that the risk perception about small borrowers should be low. Hence, the high rate charged by MFIs or informal agencies is either due to high operating cost or due to high interest margins charged. As is evident from the experience of several pilot projects in India as well as other countries, the operating cost of providing credit to small borrowers could be reduced significantly, implying that there is a large scope for reducing interest rates on small loans.
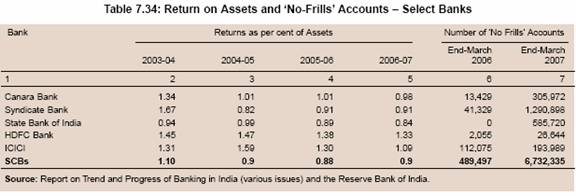
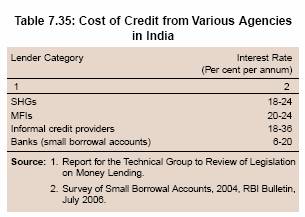
7.133 According to the Report on Costs and Margin of MFIs in India (CAB, 2007), the cost to the borrower of an MFI generally comprises interest rate and other charges such as processing/ administrative charges and upfront levies. The study shows that the all-in-cost to a borrower of an MFI varies widely across States with a median value of about 24 per cent (Table 7.36).
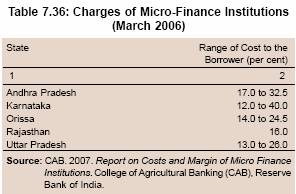
Role of Technology
7.134 Technology can play an important role in reducing operating cost of providing banking services, particularly in the rural and low income groups segments. The technology, if blended appropriately with the right business model and policy, holds the key to extending affordable, viable and sustainable access to finance for the population at large. There are three broad types of technologies that have been identified to drive the growth of financial services. These are (i) pro-poor new information and communication technology, primarily low-cost cell phones; (ii) ATMs and other point of sales devices; and (iii) smart plastic card.
7.135 The centralised data processing system and the non-conventional methods based on computer systems, which do not require uninterrupted electric supply and radio frequency network, can significantly reduce the cost of extending financial services. There are a number of cases where banks have expanded the coverage of banking services to remote and un-banked areas with affordable infrastructure, while keeping operating costs low with the use of appropriate technology. Technology has the potential to lead to new delivery mechanisms and business models. For instance, technology will allow branchless banking and establishment of new partnerships between financial service providers and a range of other service providers that was not feasible before to provide services to clients in remote areas and low-population density areas.
7.136 Mobile phone-based services are revolutionising micro-finance services in a number of countries (Asian Development Bank, 2007). Mobile banking (or mobile payment) is a term used for performing balance checks, account transactions, payments, etc. via a mobile device such as a mobile phone, PDA or other such device. Most of the mobile payment platforms fall into four categories: (i) mobile banking enabling users to perform banking transactions using mobile phone like, balance checks, fund transfers, bill payments;(ii) remote purchase; (iii) person to person transfers; and (iv) point of sale, i.e., using phones to pay for goods at merchant location. These services can be provided using various available connectivity technologies, each one of which has its own pros and cons (Table 7.37). However, the extent to which technology will be integrated into the financial service industry at the low end will depend on supportive government policies and the quality of the infrastructure, particularly in rural areas.
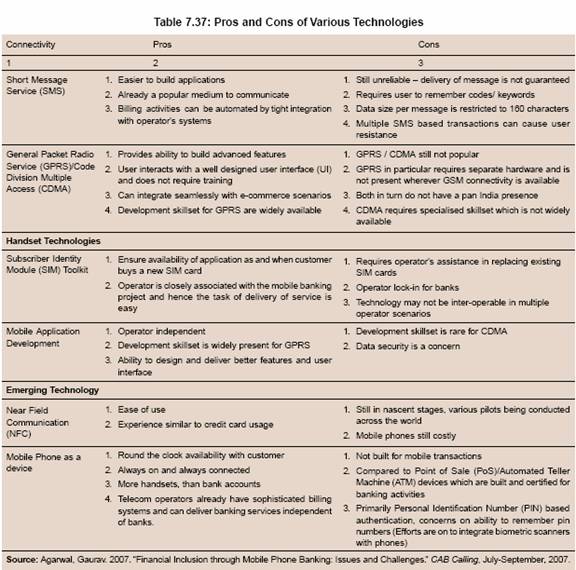
7.137 Different technologies have been successfully adopted in many countries to promote financial inclusion (Box VII.16).
7.138 Banks in India have initiated pilot projects utilising smart cards/mobile technology to increase their outreach. Biometric methods for uniquely identifying customers are also being increasingly adopted. Banks are also increasingly adopting technological solutions for delivery of credit at affordable price and to a wider section of the population. State Bank of India (SBI) initiated a project called the SBI Tiny Card Accounts (SBITCAs) recently in Aizwal. The project is a combination of ‘no-frills’ account and BCs/BFs model. The SBITCAs are operated through new generation mobile phones based on near-field communication (NFC) technology, enhanced with fingerprint recognition software and attached to receipt printer. The card allows activation of transaction of funds for the purpose of micro-savings (SBI-tiny no-frills pre-paid account), cash deposits and withdrawal, micro-credit (including KCCs, GCCs), money transfer (account-to-account within the system), micro-insurance, cashless payments to merchants, SHG savings-cum-credit accounts and attendance systems, disbursements of Government benefits like the national rural employment guarantee scheme, for equated monthly instalments (EMIs), utility payments, coupons, vouchers and tickets, loyalty points, automatic fare collection systems, portable and fixed positions for front-end devices (fully inter-operable).
Box VII.16 Technology and Financial Inclusion
In the Philippines, two cell phone companies – Smart and Globe Telecoms – offer innovative cell phone based facilities, also called electronic wallet, to transfer money, pay bills, and make payments for purchases from stores, among other things, called Smart Money and G-Cash, respectively. In February 2005, the Rural Bankers Association of the Philippines Microenterprise Access to Banking Services (RBAP-MABS) launched a project called Text-A-Payment (TAP). TAP is an innovative mobile technology product that uses the SMS technology of Globe Telecom (powered by G-Cash) to pay for micro finance loan payments of borrowers. TAP seeks to bring in new and low cost technology tools to improve efficiency and outreach. Small borrowers can utilise the service for payments of their micro-finance loans. The other applications of TAP are remote deposit taking, cash withdrawal, international and domestic remittances, purchases and bills payment.
In South Africa, banking institutions, together with mobile phone companies, have begun to expand access to financial services targeting low-income customers with an interest-bearing bank account accessible through mobile phones, and debit card with which they can make purchases at retail outlets and deposit or withdraw money at ATMs. Customers can use their mobile phones to make person-to-person payments and transfer money.
Prodem, the first micro-finance organisation to create a chartered bank, BancoSol, in Bolivia started Prodem Smart ATM, a smart card cum ATM recently. The smart card stores customer’s account balance every time the transaction is made using the card. This enables Prodem Smart ATM to operate even in the absence of internet connectivity, thereby, making it an ideal instrument to extend financial services in many rural parts of Bolivia that lack the technological infrastructure for a wide-reaching, online network.
Reference:
Asian Development Bank. 2007. “Low Income Households’ Access to Financial Services – International Experience, Measures for Improvement, and the Future.” EARD Special Studies, October.
VII. THE WAY FORWARD
7.139 The Government and the Reserve Bank have taken several initiatives to bring the underprivileged and weaker sections of the society within the banking fold, which have had a favourable impact. However, the magnitude of the problem is enormous and still a sizeable portion of the rural and urban low income population (mainly the immigrant labour) has very little access to financial services. These groups pay a high premium for accessing credit from moneylenders and other informal sources. There is, thus, a need to expand the outreach of the formal financial system to include rural and urban poor.
Measurement of Financial Exclusion
7.140 The most crucial issue in the context of financial inclusion is to know the extent to which low income households are excluded from the formal financial system. Most of the headline indicators such as bank branch density or bank accounts are only proxies for financial inclusion/exclusion. For a more accurate assessment of financial inclusion/exclusion, there is a need to have census data on the number and characteristics of households that have a bank account or an account with an institution like bank. Even in the case of census data on the usage of banking services, there is a need to distinguish between individuals who have voluntarily chosen not to make use of financial services, because of low or no money income, or low money savings, and those who need banking services but have been excluded from financial services due to several barriers such as lack of access to financial services, low level of literacy, high prices of financial services and complex procedure of documentation, among others. Such an exercise would involve undertaking specialised and detailed household surveys. In India, at present, the NSSO conducts several surveys, including urban/rural indebtedness. It is, therefore, felt that either separate surveys relating to financial inclusion/exclusion may be conducted or the scope of the indebtedness survey by the NSSO could be expanded to include various aspects of financial inclusion/exclusion. Besides the periodic surveys, the decadal census may also cover information relevant to financial inclusion/exclusion. Such specialised surveys would enable appreciation of the extent of the problem and would help design appropriate policies to close the gap.
7.141 NABARD presently collects data relating to SHG-bank linkage programme. Such data are also widely disseminated. At present, there are also a large number of MFIs/NGOs operating in the country. However, there is no comprehensive system for collecting data/information on various aspects of these institutions, which hampers appropriate policy formulation. It is, therefore, felt that a comprehensive system of data collection on MFIs/NGOs be put in place. Besides, there is also a need to have information on the number of households being financed by MFIs/NGOs. This work could be undertaken by NABARD.
Operating Cost of Financial Inclusion
7.142 One of the most challenging issues in the case of financial inclusion is the operational viability and sustainability of the process of providing financial services. Several countries have attempted to expand financial services coverage through control over financial institutions and by providing subsidies. This has, however, resulted in mounting fiscal costs making it fiscally unsustainable (World Bank, 2008). Another approach is to assign the responsibility of financial inclusion to financial institutions. Though financial inclusion provides an oppor tunity to financial institutions to expand their business by enlarging their customer base, the operating cost of expanding the coverage of financial services could be a major factor inhibiting banks and other financial institutions from extending various services to the public at large, particularly to low income groups living in rural and remote areas. Credit delivery in rural areas is often believed to be expensive for banks on account of a large number of small loan accounts to be serviced.
7.143 The experience of many banks in India as well as in other countries, however, suggests that the appropriate use of information technology can help in reducing the cost of providing financial services and make it operationally viable to expand the coverage of financial services. The appropriate technology combined with an effective use of banking correspondents has the potential of creating a banking outpost/ATM in every village, as has been observed in the case of Andhra Pradesh, which has successfully implemented mobile phone technology for providing banking services in remote areas in coordination with the Reserve Bank and IDRBT. There are several other instances, both within and outside the country, where it has been observed that technology has the potential to overcome the problem of high operating cost. The need, therefore, is to increase the use of technology to expand the outreach in the hitherto untapped areas. A wide range of technologies is available. However, while selecting a technology, banks need to ensure that the solutions are highly secure, amenable to audit, and follow widely accepted open standards to ensure eventual inter-operability among the different systems as was highlighted in the Reserve Bank’s Annual Policy Statement for the year 2007-08.
Financial Inclusion as an Opportunity
7.144 The operating cost of financial inclusion is perceived to be high as compared with returns from the services extended to low income groups. Banks, therefore, are generally averse to voluntarily extending financial services to such segments. Several pilot projects and experience of SHGs have, however, proved that such a perception is unfounded. There is a need is to perceive financial inclusion as an opportunity for expanding business in the medium-term, notwithstanding some initial costs. There is also a need to recognise the vast potential for investment in agriculture and allied activities and the entire supply chain. Given the market imperfections in various aspects of the rural economy, the return on investments could be significant. Large local industrial corporates are already engaging in contract farming and direct marketing of rural products. Moreover, services and manufacturing activities have also been growing faster in rural areas. There is also growth in newer activities such as horticulture, floriculture, organic farming, genetic engineering, besides a range of supply chain activities like sorting, grading, storage, transportation, processing, and packaging. All these emerging activities are credit intensive and have enormous financing potential (Mohan, 2006). Besides, the potential of the rural markets of items for mass consumption is immense as population is moving laterally in the higher income brackets. In view of the evidence of a pick-up in consumer financing in rural areas, there is also a need to streamline the supply chain to deliver credit at the lowest cost to the ultimate user in the rural areas, to the benefit of both the bank and the borrower. Furthermore, there are huge opportunities in the area of farmer’s insurance as farmers adopt new and untried technology and increase input intensities, they face larger risks. All these point to the vast scope for enhancing business opportunities for banks and financial institutions in the rural areas. Banks also need to explore and exploit the avenues in the urban areas.
Multiple-lending by Banks
7.145 As a result of accelerated growth of the MFIs sector in the last few years, a few issues have cropped up. A joint fact-finding study by the Reserve Bank with a few major banks revealed several cases of multiple lending, and that MFIs were not engaging in capacity building to the desired extent. In order to avoid cases of multiple financing, there is a need to put in place a system of credit registries (through which lenders share information about their clients’ repayment records) through credit information bureaus similar to that for the large corporates. Credit registries can increase access by establishing credit record of borrowers. This could, to start with, be done by one of the credit rating agencies for MFIs such as CRISIL, M-CRIL, ICRA or CARE which have been allowed to be used by banks for rating MFIs. In this context, the Credit Information Companies Act has been notified and soon new credit information companies will be authorised to commence business.
Availability of Suitable Financial Products
7.146 Lack of suitable services/products leaves the rural poor with little option than to transact with the informal sector which accepts small amounts, provide doorstep service, make available funds for all purposes (productive and non-productive such as consumption needs, festivals, marriages, medical and emergencies) and ensure ease of operations. Banks and other financial institutions, therefore, also need to design tailor-made thrift, credit, insurance and remittance products for the poor and weaker sections taking into consideration their requirements and repayment capacity. Apart from savings and loan products, poor people also need insurance products. Health related expenditure at times far exceeds the income levels of many households, which leads them to a situation of debt trap. The insurance companies, therefore, also need to design low cost health insurance products for the rural poor. The need is also felt for weather insurance products to provide relief to farmers in cases of losses due to excess/ deficient rainfall.
Financial Literacy and Technology
7.147 Lack of literacy in general and financial literacy in particular, are considered as the main hurdles in expanding the coverage of financial services to the poorer segments of society. Notwithstanding the initiatives taken so far, given the large magnitude of the problem, concerted efforts need to be made in this direction. It is, therefore, felt that banks should come forward to set up counselling centres and guide their clients about the features, benefits and risk of various financial products. Financial literacy and awareness about financial products in rural areas also need to be taken up in a big way. It can be effectively promoted by utilising the services of postmen and school teachers. The relevant information in the form of brochures/pamphlets could also be disseminated to people in the rural areas in an organised manner. There is also a need to widely disseminate the information relating to various customer protection mechanisms, which have been put in place.
7.148 In some parts of the country, the use of rural information e-kiosks and mobile vans has shown immense potential in providing information on various products and services in rural areas. The need is to increase the use of information kiosks to disseminate information not only about banking products, but also about input/output prices, insurance products and health services. Banks should come forward to set up such kiosks jointly and share the running costs amongst them. It may be mentioned that similar model (e-choupal) has already been implemented by the private sector for providing ready information in local language on weather, market prices, scientific farm practices and risk management. This model presently covers more than 31,000 villages and could be utilised for promoting financial literacy in association with private agencies.
Legislation for Moneylenders
7.149 At present, moneylenders are covered under State-specific legislations which have become outdated in many of the States. The model legislation suggested by the Technical Group to Review Legislation on Money Lending (2007) needs to be examined further and consideration be given to its possible implementation with the objective of mainstreaming the activity of money lending as also for strengthening the synergies between the formal and the informal segments, while eliminating its negative characteristics and usurious interest rates.
Strengthening the Institutional Structure
7.150 In order to build inclusive financial systems, globally, the focus is not only on specialised micro-credit institutions, but on an array of other financial institutions such as postal savings banks, consumer credit institutions, and, most importantly, the banking system. This broader approach is expected to expand the outreach of the financial services industry.
7.151 India also has a well-diversified structure of financial institutions such as commercial banks,
co-operative banks at different levels, primary agricultural credit societies, insurance companies and post-offices. The need is to involve not only commercial banks but also other financial intermediaries such as insurance companies and post-offices for promoting the cause of financial inclusion. The RRBs and co-operative banks, in particular, can play an important role. However, because of their fragile financial health, they have lagged behind in furthering the cause of financial inclusion. As alluded to earlier, the number of credit accounts held by RRBs in relation to those held by SCBs declined significantly between 2001 and 2007. The Government has already restructured RRBs and approved revival package of short-term rural cooperative credit structure. The revival package of long-term rural co-operative credit structure is also being worked out. It is expected that in future these institutions would play a far greater role in promoting financial inclusion. Apart from RRBs and other co-operative institutions, joint liability groups and SHGs model could also be used to extend credit to small and marginal farmers, oral lessees and sharecroppers.
Role of the Government
7.152 Credit alone may not help in improving the income and productive capacities of the rural poor as the credit absorptive capacity would depend upon various other factors such as appropriate policy environment, coupled with infrastructure and supply chain facility. The Government has an important role in building adequate infrastructure such as roads, electricity, public transport and marketing facilities which would facilitate production and distribution of output by the people residing in rural and remote areas. Government expenditure on social services such as health, education, water and sanitation would also enhance credit absorptive capacity of the borrowers. Furthermore, a large propor tion of borrowings by low income households takes place for medical and other emergencies. Thus, borrowings from non-institutional sources to a significant extent could be reduced if health care, education and other services are provided to rural households at reasonable cost, including appropriate medical insurance at a reasonable premium. The results of empirical exercise discussed earlier in this chapter confirmed that infrastructure plays a significant role in promoting financial inclusion as well as economic growth. The Government, therefore, has a crucial role in facilitating financial inclusion by strengthening the rural infrastructure and providing enabling conditions as alluded to in Chapter VI also.
Evaluation of Banks’ Performance for Promoting Financial Inclusion
7.153 In order to promote financial inclusion, it is necessary to monitor the performance of banks. In some countries such as US, there is a system of evaluation of banks’ performance. A system of evaluation of banks’ performance in India may, therefore, also be put in place. Under this system, Indian banks may be rated, say every two to three years, on their performance relating to financial inclusion and such assessment could also be put in the public domain. Such a system, through peer pressure, would help encourage financial inclusion efforts of banks.
VIII. SUMMING UP
7.154 Notwithstanding the widely recognised importance of financial inclusion, it has no universally accepted definition. The working or operational definitions of financial inclusion generally focus on ownership or access to particular financial products and services such as deposits, credit, long-term savings, money transfer and insurance provided by the mainstream financial service providers. Based on this definition, financial inclusion is often measured in terms of indicators such as number of bank accounts. There is, however, broad agreement that the financial exclusion cannot be measured by a single indicator. Therefore, multiple indicators have been used which include proportion of population with a bank account, population which uses the services of any formal financial institution, people receiving money regularly through formal financial instruments, people keeping money in formal financial institutions, and persons who have obtained or have loan or credit facility outstanding from a formal financial institution.
7.155 In the Indian context, financial inclusion has been described as the provision of affordable financial services, viz., access to payments and remittance facilities, savings, loans and insurance services by the formal financial system to those who are excluded. Deepening the financial system and widening its reach is crucial for both accelerating growth and for equitable distribution. The major causes of financial exclusion often cited include relatively low extension of institutional credit in rural areas due to perception of high risk, high operating costs, lack of rural infrastructure, and vast geographical spread of the country with more than half a million villages, some sparsely populated. The micro factors, which are perceived to inhibit credit flow to disadvantaged groups, mainly include factors such as lack of awareness of financial products and services, the procedures for obtaining agricultural non-farm loans, staffing and human resources, and lack of effective legislation for regulating money lending. From the demand perspective, low income and savings level could lead to lower demand for financial services, particularly the deposit facilities.
7.156 India has adopted a multi-pronged approach towards financial inclusion as has been the case in several other countries. Though the term financial inclusion is of recent origin, the efforts to bring the poorer and weaker segments of the society within the fold of the formal banking system were initiated both by the Reserve Bank and the Government beginning as back as the late 1960s. The specific policy initiatives towards financial inclusion in India broadly fall under three phases with the first one starting in the late 1960s through the 1980s with the focus on credit channelling to ensure equitable growth. The nationalisation of banks, directed lending to priority sectors, suitable changes in the branch licensing policy, introduction of specific schemes, establishment of specialised institutions and interest rate regulation were some of the major policy initiatives undertaken by the Government and the Reserve Bank to bring the weaker sections within the fold of the banking system. The second phase of financial inclusion spanning the early 1990s to early 2005 focussed on strengthening the financial institutions. The major financial inclusion initiatives taken in this phase were introduction of SHG-bank linkage programme in the early 1990s and introduction of KCCs. Efforts to bring financially excluded people within the banking fold received a major boost in April 2005, when financial inclusion was explicitly made a major policy objective. Introduction of ‘no-frills’ accounts in November 2005 was another major step for providing safe savings deposit facility to the rural and urban poor. Thus, a wide network of institutions has been established in order to expand the outreach of financial services to people.
7.157 Formal financial services have expanded rapidly in recent years. The question, therefore, arises as to what has been the impact of various measures on financial inclusion. Arriving at firm conclusions on the extent of financial inclusion or its obverse, i.e., exclusion, is not easy from the existing data sources. There are differences in the data available from various sources and much more work needs to be done to reconcile these data. Nevertheless, the available information suggests that beginning from the late 1960s, significant progress has been made to bring more and more people within the fold of formal financial institutions. This trend continued even in the 1990s. Data on the household surveys by the NSSO suggest that the share of number of households accessing credit from non-institutional sources declined significantly from the late 1960s through 1980s. The share, however, increased in the 1990s. A detailed analysis of various aspects, however, suggests that number of indebted households and their outstanding debt increased sharply between 1991 and 2002. The increased debt was mainly for consumption and similar other purposes for which the finance could not be easily availed of from formal sources. As a result, the share of household indebtedness to non-institutional sources increased between 1991 and 2002 even as credit to households by various institutional sources grew broadly at the same rate between 1991 and 2002 as between 1981 and 1991. Within institutional sources, credit by banks grew at a marginally lower rate between 1991 and 2002 compared with that between 1981 and 1991. However, it needs to be viewed in the context of banks’ increased focus in the 1990s on strengthening of their balance sheets and some risk aversion developed by banks on account of application/tightening of prudential norms, as a result of which banks’ overall credit portfolio also slowed down.
7.158 The reference year for the latest NSSO data was 2002. An analysis of more recent BSR data reveals that there has been a distinct improvement in credit penetration (credit accounts per 100 persons) and credit flow to the rural sector in general and to agriculture, in particular, since the early 2000s, that is, after the release of the NSSO data. Responding to the initiatives taken in recent years, the number of credit accounts with all organised financial institutions (commercial banks, RRBs, UCBs, PACS, MFIs and SHGs) per 100 adults improved from 18 in 2002 to 25 in 2007.
7.159 On the deposit side also, the outreach of organised financial institutions expanded over the years. The number of savings accounts with all formal institutions increased to 54 per 100 persons (82 per 100 adults) in 2007 from 51 in 1993. However, after factoring in people below poverty line, who have little or no capacity to save, there are a little more than 100 savings accounts per 100 adults above poverty line. With faster growth in income, people may move into higher income brackets. As poverty levels decline and households income levels rise, their propensity to save would also go up. Such people would need easy access to the formal financial system to develop the banking habits. Banks, therefore, would need to innovate and devise newer methods of bringing such customers into their fold.
7.160 Through housing and retail credit, banks have been able to bring an increasing number of households into the fold of formal credit. However, most of the expansion has taken place in cities and large towns. There is an enormous potential for expanding financial services in semi-urban and rural areas. With increasing urbanisation on the one hand, and spread of non-farm based activities in rural areas on the other, credit demand is expected to increase. Agricultural activity is also getting increasingly commercialised which would generate new business opportunities for banks. Banks, therefore, would also need to carefully examine the benefits of increasing penetration in rural areas. These developments suggest that the demand for financial services, both for savings and production purposes, would be greater than that has been in the past. To meet the growing credit demand, banks would need to mobilise resources on a larger scale than hitherto. This would promote financial inclusion and strengthen financial deepening. Along with extending credit to a variety of enterprises in both organised and unorganised sectors, the financial system would have to simultaneously enhance the risk assessment and risk management capacities in order to maintain credit quality and sustain the credit growth.
7.161 The key to enhanced financial inclusion is reduction in transaction costs. The operating cost of providing small accounts at times is a hindrance to the expansion of banking services to low income groups. The experience of some institutions in the country as well as in other countries, however, suggests that an appropriate use of technology could significantly reduce the operating cost of financial inclusion and make it a viable and sustainable activity. The availability of new information technology, expansion of credit information services, innovations in micro-finance and the non-conventional modes of delivery of financial products offer further opportunities for reducing transaction costs in dealing with small savers and borrowers. The challenge, thus, is to increase the scope and coverage of financial inclusion by addressing deficiencies such as lack of adequate infrastructure, higher transaction costs and low volumes of transactions.
7.162 From the perspective of institutional development, the role of RRBs and co-operative banks, which were established to expand the delivery of financial services in the unbanked sectors/ segments, suffered a setback due to their poor financial health. With the recent initiatives to strengthen them, it is expected that they would play a greater role in promoting financial inclusion. Considering the significance of moneylenders, especially in the rural credit delivery system, there is also a need for expeditious implementation of the model money lending legislation by the State Governments.
7.163 Sustainable financial inclusion process depends on several factors. Credit counselling can play a crucial role in improving the prospects of repayment of loans. Though a beginning has been made in India to provide credit counselling, there is a need to step up effor ts in this direction. The Government can help in improving the absorptive capacity of financial services by creating an enabling environment by strengthening the basic infrastructure. Investment in human development such as health, water and sanitation, and education would also improve the credit absorptive capacity of borrowers. Apart from this, efforts to promote financial literacy can go a long way in improving the use of various financial services, particularly by the weaker and poorer sections of the society.
Annex VII.1: Definitions of Various Types of Expenditure Used in the NSSO Survey
(i) Farm business:Farm business comprised household economic activities like cultivation, including cultivation of plantation and orchard crops, and processing of produce on the farm, e.g., paddy hulling and gur making. Although gur making is a manufacturing activity, this was covered under farm business only when such activity was carried out in the farm by indigenous method.
(ii) Non-farm business: Non-farm business was defined as all household economic activities other than those covered in the farm business.
This cover manufacturing, mining and quarrying, trade, hotel and restaurant, transpor t, construction, repairing and other services. For the purpose of this survey, non-farm business shall exclude such activities when they are carried out in non-household enterprises. Non-farm business enter prises, which were registered under section 2m(i) or 2m(ii) and section 85 of Factories Act, 1948 and Bidi and cigar manufacturing establishments registered under Bidi and Cigar Workers (condition of employment) Act, 1966 were kept outside the coverage of the survey.
(iii) Capital expenditure in farm business: The expenditure incurred in farm business on account of purchase, own construction, major repairs, bunding and other land improvement including reclamation of land, alterations and improvement of buildings and other constructions constituted the capital expenditure in farm business.
(iv) Current expenditure in farm business: This comprised the current expenditure in the farm business for purchases of seeds, manure, fodder, payment of wages, rent, land revenue etc. and that for normal repairs and maintenance of buildings, constructions, machinery and equipment including transport equipment, furniture & fixtures and household durables meant for the farm business.
(v) Capital expenditure in non-farm business: It consisted of the expenditure in non-farm business incurred on account of purchase, own construction, additions, alternations, major repairs and improvements of buildings, other constructions and machinery and equipment including transport equipment, furniture and fixture. It also included bunding and other land improvement, including reclamation of land, pertaining to non-farm business.
(vi) Current expenditure in non-farm business: This was made up of the current expenditure in non-farm business for raw materials, fuel and lubricants, payment of rent, salaries and wages, hire charge of machinery and equipment etc. and normal repairs and maintenance of buildings, construction, machinery and equipment including transport equipment, furniture and fixtures and household durables meant for the non-farm business.
(vii) Household expenditure:The expenditure incurred on account of purchase of residential plot, purchase, construction, addition/ alteration of building for residential purposes, purchase of durable household assets, cloths etc. and expenditure for medical treatment, education, marriages, ceremonies etc. constituted the household expenditure.
|