This thematic Chapter provides an analysis of the expenditure of State governments covering the
period 1980-81 to 2009-10. It also attempts to examine whether major categories of expenditure have
shown any convergence in per capita terms across the States. The composition of aggregate expenditure
shows that revenue expenditure increased steadily during the 1980s and 1990s. However, there has
been a modest decline in its share since the beginning of the 2000s mainly on account of a decline in
development revenue expenditure. The ever increasing trend in the committed expenditure-GDP
ratio declined during 2005-10 mostly owing to a decline in the interest payment-GDP ratio. Reflecting
the emphasis of States on quality of expenditure, the capital outlay-GDP ratio has been rising since
2000-01. Deviating from the declining trend till 2004-05, the average share of development
expenditure in aggregate expenditure has risen significantly during 2005-10. A State-wise analysis
shows that the trend in major categories of expenditure varies across States. An analysis further shows
that in per capita terms, the levels of capital outlay, development expenditure and social sector
expenditure have shown some convergence across the States.
1. Introduction
6.1 Under the federal system in India, the State
governments have a major responsibility with
regard to the provision of economic and social
infrastructure12. The State governments accounts
for around 60 per cent of the combined expenditure
of the Centre and States reflecting the vital role
that the States play in the growth and development
of the economy. In the following discussion, an
attempt is made to examine trends in various
categories of expenditure by State governments.
An inter-temporal analysis of the expenditure
pattern of the States not only signifies the changing
policy emphasis of State governments but also
helps to assess whether any convergence is taking
place across the States in terms of allocation of
expenditure. As a special theme for the present
study, an analysis of the trend and pattern of States’
expenditure is presented in this Chapter. The theme
is aimed at a focused analysis of the expenditure
of State governments covering the period 1980-81 to 2009-10. The analysis is structured into the
following sections. Section I deals with the overall
trend in aggregate expenditure of State
governments followed by Section II and Section III
discussing the trend and composition of revenue
expenditure and capital expenditure, respectively.
Expenditure pattern in terms of development and
non-development expenditure of State
governments is discussed in Section IV. Section V
brings out trend in major categories of social sector
spending of the State governments. State-wise
trend in major categories of expenditure is
discussed in Section VI. In Section VII, an attempt
is made to examine whether major categories of
expenditure have shown any convergence in per
capita terms across States.
6.2 Public expenditure plays an important role
in achieving goals of growth, development, equity
and stability. In the context of developing
economies like India, public expenditure assumes
importance in order to ensure an equitable distribution of resources. The redistributive powers
of the State emanate from the normative arguments
in favor of greater equality to be achieved through
public expenditure. The level and composition of
public expenditure can have macroeconomic as well
social implications. Policy makers and some
researchers have argued that expenditure on growthenhancing
functions could enhance future revenue
and justify the provision of ‘fiscal space’ in the Budget.
However, there are no simple ways to identify the
growth-maximising composition of public expenditure
(Semmler et al, 2007)13. Given the empirical evidence
that a link between public expenditure and growth is
contingent upon the nature of expenditure, an
assessment of the trends and composition of public
expenditure assumes importance.
2. Overall Trend
6.3 Trend analysis shows that the aggregate
expenditure of State governments as percentage
of GDP accelerated during the 1980s and
decelerated during the 1990s. Aggregate
expenditure as percentage of GDP moved upward
during 2000-05. However, compression in the
consolidated expenditure of State governments can
be observed during 2005-10 mainly on account of
some rationalisation of revenue expenditure during
the fiscal responsibility legislation (FRL) period.
This is evident from a decline in the RE-GDP ratio
from 13.3 per cent in 2000-05 to 12.4 per cent
during 2005-10 (Table VI.1 and Chart VI.1).
6.4 In terms of the expenditure policy, not only
the level of expenditure, but the structure also
matters. The former reflects the amount of
distortions, while the latter has important
consequences for the effectiveness of the
expenditure policy (Kastele, 2005). Broadly, all
expenditure of the government, which does not
result in the creation of physical or financial assets,
is treated as revenue expenditure. As far as a broad
composition of the total expenditure of State
governments is concerned, revenue spending
showed a steady increase during the 1980s and 1990s. Since the beginning of the 2000s, there has
been a modest decline in the share of revenue
expenditure to total expenditure. With the
concomitant rise in the share of capital
expenditure to total expenditure from 16.8 per cent
during 1995-00 to 21.2 per cent during 2000-05,
there was an increase in the capital outlay by 0.2
percentage points during the same period (Table VI.2
and Chart VI.2). However, the share of capital
outlay in aggregate expenditure rose sharply from 9.6 per cent during 2000-05 to 15.4 per cent during
2005-10. Nevertheless, the spending patterns of
State governments show the persisting domination
of revenue expenditure with marginal significance for their long term growth potential as they are
generally considered to be consumption spending
of the State governments unlike capital
expenditure. Moreover, the rising share of revenue
expenditure reflects structural rigidities in
expenditure patterns making expenditure
management of State governments difficult.
Furthermore, the compound annual rate of growth
(CARG) in revenue expenditure during 1980-81 to
2009-10 is found to be higher than capital expenditure.
Table VI.1: Trend in Expenditure of the State Governments |
(Per cent of GDP) |
Period |
Revenue
Expenditure |
Capital
Expenditure |
of which:
Capital
Outlay |
Total
Expenditure |
1 |
2 |
3 |
4 |
5 |
1980-85 |
10.6 |
4.5 |
2.0 |
15.1 |
1985-90 |
12.2 |
3.9 |
1.8 |
16.1 |
1990-95 |
12.7 |
3.2 |
1.5 |
15.9 |
1995-2000 |
12.4 |
2.5 |
1.4 |
14.9 |
2000-05 |
13.3 |
3.6 |
1.6 |
17.0 |
2005-10 |
12.4 |
3.5 |
2.4 |
15.9 |
CARG |
14.9 |
12.4 |
14.4 |
14.2 |
CARG: Compound Annual Rate of Growth.
Source: Budget Documents of the State Governments. |
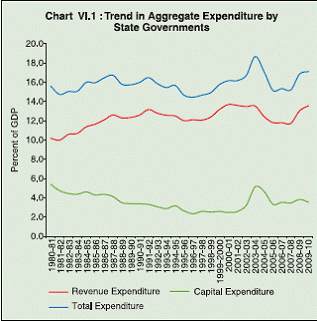 |
Table VI.2: Composition of Aggregate
Expenditure of the State Governments |
(Rs. Crore) |
Period |
Revenue
Expenditure |
Capital
Expenditure |
of which: Capital Outlay |
Total
Expenditure |
1 |
2 |
3 |
4 |
5 |
1980-85 |
20,855 |
9,140 |
3,943 |
29,994 |
|
(69.5) |
(30.5) |
(13.1) |
(100.0) |
1985-90 |
45,672 |
14,405 |
6,694 |
60,077 |
|
(76.0) |
(24.0) |
(11.1) |
(100.0) |
1985-90 |
98,009 |
24,261 |
11,907 |
1,22,270 |
|
(80.2) |
(19.8) |
(9.7) |
(100.0) |
1995-2000 |
1,93,812 |
39,625 |
21,064 |
2,33,441 |
|
(83.0) |
(17.0) |
(9.0) |
(100.0) |
2000-05 |
3,40,752 |
96,545 |
41,880 |
4,37,297 |
|
(77.9) |
(22.1) |
(9.6) |
(100.0) |
2005-10 |
6,17,788 |
1,75,709 |
1,22,397 |
7,93,498 |
|
(77.9) |
(22.1) |
(15.4) |
(100.0) |
Note : 1. Expenditure in absolute terms represents averages of respective sub-periods.
2. Figure in brackets is percentage share of revenue
expenditure, capital expenditure and capital outlay in total
expenditure of the State Governments.
Source : Budget Documents of the State Governments. |
3. Revenue Expenditure
6.5 The composition of aggregate expenditure by
State governments in terms of revenue and capital
expenditure is reflective of the quality of expenditure
incurred. The hypothesis that improvements in the
composition of public expenditure have positive
repercussions for growth is widely supported in
literature. It is generally found that fiscal consolidation
achieved through compressing selected revenue
expenditures tend to trigger higher growth rates than
adjustments based on revenue increases and cuts in
more productive spending (Pang et al., 2007)14. Thus,
it is important to examine whether the trend and
composition of revenue expenditure has undergone
any change over the period. As far as the composition
of revenue expenditure is concerned, it continues to
be dominated by development expenditure which
mainly comprises spending by States on social and
economic services. Development expenditure
accounted for 71 per cent of the total revenue
expenditure of the States during 1980-85. However,
its share in total revenue expenditure steadily declined
till 2000-05 (54.7 per cent) before rising marginally in
subsequent years (58.0 per cent during 2005-10).
The share of non-development revenue expenditure
in total revenue expenditure witnessed a
concomitant increase till 2004-05 and a moderate
decline thereafter (Chart VI.3). Development
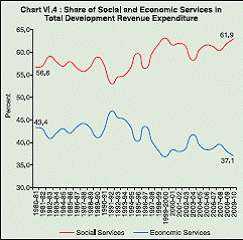
revenue expenditure continues to be dominated by
social services. Social services—accounting for 57.5
per cent of the total development revenue expenditure
during 1980-85—have witnessed a marginal increase
in their share since 1995-2000. In contrast, the average share of economic services recorded a
marginal increase during 1985-90 and 1990-95 but
declined in subsequent sub-periods (Chart VI.4).
 |
6.6 Development revenue expenditure as
percentage to GDP (DRE-GDP) which stood at 7.5
per cent during 1980-85, rose to 8.5 per cent during
1985-90 due to a rise in revenue spending on social
as well as economic services. However, the DREGDP
ratio has witnessed a secular decline since 1990-
95 mainly due to declining revenue expenditure on economic services as percentage to GDP. Revenue
expenditure on social services as percentage to GDP
has also declined since 1985-90 albeit at a slower
pace compared to economic services. The major
categories of revenue expenditure on social services,
viz., education, sports, art and culture; medical and
public health; and water supply and sanitation
witnessed a decline in terms of GDP. Among the
economic services, agriculture and allied activities
accounted for a major decline in the DRE-GDP ratio
over the years. However, the States have gradually
increased their revenue spending on the energy sector
from 0.1 per cent in 1980-85 to 0.7 per cent of GDP
during 2000-05 (Table VI.3). Non-development
revenue expenditure as percentage to GDP (NDREGDP)
has shown an upward trend over the period of
analysis. The NDRE-GDP ratio doubled from 2.9 per
cent during 1980-85 to 5.8 per cent during 2000-05
before declining marginally to 4.9 per cent during
2005-10. Revenue expenditure in the form of grantsin-
aid and contributions as compensation and
assignments to local bodies and Panchayati Raj
Institutions (PRIs) witnessed an increase from 0.1 per
cent of GDP during 1980-95 to 0.2 per cent during
1995-2005 and further to 0.3 per cent during 2005-10.
Since the total own revenue of the local bodies, which
were assigned wide expenditure obligations after the
73rd and 74th Constitutional amendments, did not
show any perceptible improvement, State governments
have been increasingly financing local bodies.
 |
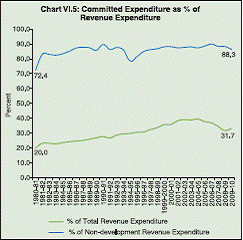
6.7 Interest payments, administrative services
and pensions account for a dominant portion of the
non-development revenue expenditure. Such
expenditure is of a committed nature and has a first
charge on the government’s resources. Thus, such
expenditure renders the expenditure management
process less flexible for the State governments.
Committed expenditure as percentage to GDP rose
substantially from 2.3 per cent during 1980-85 to
5.0 per cent during 2000-05. This was mainly on
account of a sharp increase in interest payments
by State governments to service their outstanding
debts comprising mainly of loans from the Centre,
internal debt, small savings and provident funds.
Between 1980-85 and 2000-05, around 66 per cent
of the total increase in committed expenditure could
be attributed to a rise in interest payments. The debt servicing burden soared with high cost
borrowings financing current expenditure amidst
growing fiscal imbalances, particularly during 1986-
87 to 1997-98. In fact, the burgeoning fiscal gap
fed on itself as the ratio of interest payments to
revenue receipts of the States also deteriorated
sharply during the 1990s. While expenditure on
administrative services as percentage of GDP
remained broadly stable during the period of
analysis, expenditure on pensions by State
governments as percentage of GDP increased
significantly (Table VI.4 and Charts VI.5 and VI.6).
During 2005-10, committed expenditure moderated
owing to a decline in the interest payment-GDP ratio enabling a reduction in the non-development
component of revenue expenditure as well as the
total revenue expenditure-GDP ratio.
Table VI.3: Composition of Revenue Expenditure |
(Per cent to GDP) |
Items |
1980-85 |
1985-90 |
1990-95 |
1995-2000 |
2000-05 |
2005-10 |
1 |
2 |
3 |
4 |
5 |
6 |
7 |
I. Development Expenditure |
7.5 |
8.5 |
8.3 |
7.5 |
7.3 |
7.2 |
A. Social Services |
4.3 |
4.9 |
4.6 |
4.5 |
4.4 |
4.4 |
of which: |
|
|
|
|
|
|
1. Education, Sports, Art and Culture |
2.2 |
2.6 |
2.6 |
2.5 |
2.5 |
2.2 |
2. Medical and Public Health |
1.0 |
0.8 |
0.8 |
0.6 |
0.5 |
0.5 |
3. Family Welfare |
– |
– |
– |
0.1 |
0.1 |
0.1 |
4. Water Supply and Sanitation |
– |
0.3 |
0.3 |
0.3 |
0.2 |
0.2 |
5. Housing |
0.1 |
0.1 |
0.1 |
0.1 |
0.1 |
0.1 |
6. Urban Development |
– |
0.1 |
0.1 |
0.1 |
0.1 |
0.3 |
7. Welfare of SCs, STs and Other Backward Classes |
– |
0.3 |
0.3 |
0.3 |
0.3 |
0.3 |
8. Social Security and Welfare |
0.6 |
0.2 |
0.2 |
0.2 |
0.2 |
0.4 |
B. Economic Services (1 to 9) |
3.2 |
3.6 |
3.7 |
3.0 |
2.9 |
2.8 |
1. Agriculture and Allied Activities |
1.9 |
1.0 |
1.0 |
0.8 |
0.7 |
0.6 |
2. Rural Development |
– |
0.8 |
0.8 |
0.6 |
0.5 |
0.5 |
3. Special Area Programmes |
– |
0.1 |
0.1 |
0.1 |
– |
– |
4. Irrigation and Flood Control |
0.6 |
0.7 |
0.6 |
0.6 |
0.4 |
0.3 |
5. Energy |
0.1 |
0.2 |
0.4 |
0.4 |
0.7 |
0.6 |
6. Industry and Minerals |
0.2 |
0.2 |
0.2 |
0.1 |
0.1 |
0.1 |
7. Transport and Communications |
0.4 |
0.4 |
0.4 |
0.3 |
0.3 |
0.3 |
8. Science, Technology and Environment |
– |
– |
– |
– |
– |
– |
9. General Economic Services |
– |
0.2 |
0.2 |
0.1 |
0.2 |
0.2 |
II. Non-development Expenditure General services (1 to 6) |
2.9 |
3.6 |
4.2 |
4.7 |
5.8 |
4.9 |
1. Organs of State |
0.1 |
0.1 |
0.1 |
0.1 |
0.1 |
0.1 |
2. Fiscal Services |
0.4 |
0.3 |
0.3 |
0.3 |
0.4 |
0.2 |
3. Interest Payments and Servicing of Debt |
1.0 |
1.4 |
1.8 |
2.1 |
2.8 |
2.2 |
4. Administrative Services |
1.1 |
1.2 |
1.2 |
1.1 |
1.1 |
1.0 |
5. Pensions |
0.3 |
0.5 |
0.6 |
0.8 |
1.2 |
1.2 |
6. Miscellaneous General Services |
0.1 |
– |
0.2 |
0.2 |
0.2 |
0.2 |
III. Grants-in-Aid and Contributions |
0.1 |
0.1 |
0.1 |
0.2 |
0.2 |
0.3 |
of which: |
|
|
|
|
|
|
Compensation and Assignments to LBs and PRIs |
0.1 |
0.1 |
0.1 |
0.2 |
0.2 |
0.3 |
Total Revenue Expenditure (I+II+III) |
10.6 |
12.2 |
12.7 |
12.4 |
13.3 |
12.4 |
Source: Budget Documents of the State Governments. |
Table VI.4: Committed Expenditure and its Composition (Per cent of GDP) |
Period |
Interest Payments |
Administra-tive Services |
Pensions |
Committed Expenditure |
1 |
2 |
3 |
4 |
5 |
1980-85 |
0.9 |
1.1 |
0.3 |
2.3 |
1985-90 |
1.3 |
1.2 |
0.5 |
3.0 |
1990-95 |
1.7 |
1.2 |
0.6 |
3.5 |
1995-2000 |
2.0 |
1.1 |
0.8 |
3.9 |
2000-05 |
2.7 |
1.1 |
1.2 |
5.0 |
2005-10 |
2.1 |
1.0 |
1.2 |
4.3 |
Source : Budget Documents of the State Governments. |
 |
6.8 Before the initiation of the National Small
Saving Fund, loans from the Centre were a major
source of financing of fiscal deficits of the States till
1998-99. Thus, interest payment on these loans
remained a major component in the total interest
payments of the States till 2003-04. Thereafter, there
has been a significant decline in interest payment
on loans from the Centre partly due to the Debt Swap
Scheme (DSS) operated during 2002-05 and the
Debt Consolidation and Relief Facility (DCRF) recommended by the TwFC (Table VI.5). A similar
trend has been observed in interest payment as
percentage to revenue receipts (IP-RR). The IP-RR
ratio moved progressively from 7.5 per cent during
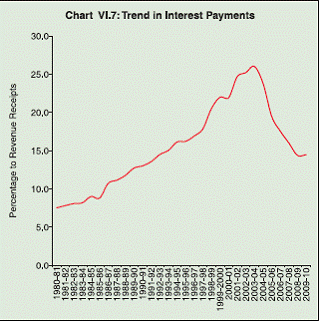
1980-81 to 26.0 per cent during 2003-04.
Subsequently, there has been a considerable decline
in the IP-RR ratio to 15.1 per cent during 2008-09
(Chart VI.7). This broadly complies with the
sustainability level of below 15.0 per cent prescribed
with respect to the IP-RR ratio of the States by the
TwFC. Interest payments as percentage of GDP also
showed a secular increasing trend till 2003-04 and
a declining trend thereafter (Chart VI.8).
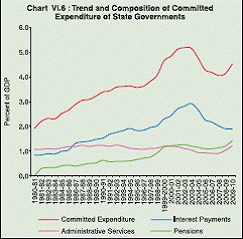 |
Table VI.5: Trend in Interest Payments of State Governments |
(Per cent of GDP) |
Item |
1980-85 |
1985-90 |
1990-95 |
1995-2000 |
2000-05 |
2005-10 |
1 |
2 |
3 |
4 |
5 |
6 |
7 |
Interest Payments (i to iv)* |
0.9 |
1.3 |
1.7 |
2.0 |
2.7 |
2.1 |
i) |
Interest on Loans from the Centre |
0.6 |
0.8 |
1.0 |
1.1 |
1.1 |
0.3 |
ii) |
Interest on Internal Debt |
0.2 |
0.2 |
0.3 |
0.4 |
1.2 |
1.4 |
|
of which: |
|
|
|
|
|
|
|
Interest on Market Loans |
0.1 |
0.2 |
0.3 |
0.4 |
0.5 |
0.5 |
|
Interest on NSSF |
|
|
|
|
0.1 |
0.8 |
iii) |
Interest on Small Savings, Provident Funds, etc. |
0.1 |
0.2 |
0.3 |
0.3 |
0.4 |
0.3 |
iv) |
Others |
- |
- |
- |
0.1 |
0.1 |
0.1 |
– : Nil / Negligible / Not Applicable. * : Due to rounding of figures may differ as given in other Tables.
Source: Budget Documents of the State Governments. |
 |
6.9 In the light of the Centre’s decision to
discontinue Plan loans to the States with effect from
April 2005 as recommended by the TwFC, the
States had to mobilise resources for funding their
GFD mainly through market borrowings and special
securities issued to NSSF. Consequently, interest
payments on market loans and NSSF loans have gradually risen in the recent period. Since the
interest rate for NSSF loans is the highest of all
the borrowings of the States, it puts enormous strain
on interest payments. However, interest payment
on small savings and provident funds as
percentage to GDP has remained almost stable in
recent years.
4. Capital Expenditure
6.10 Capital expenditure assumes importance as
it has a lasting impact on growth than revenue
expenditure. If spent efficiently, it also ensures a
more productive economy and enhances the
government’s net worth arising from augmented
revenues due to higher expected GDP in the future.
Likewise, an efficient allocation of the government’s
capital expenditure can impact private investment
provided it does not raise cost of borrowings for
private investors. Thus, capital outlay for
infrastructure is expected to enhance productivity
levels of private investment leading to crowding in
of private investment.
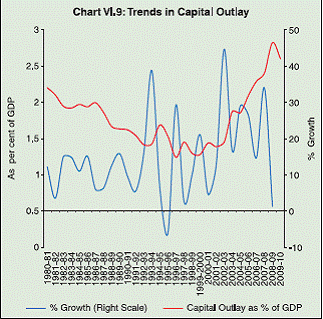
6.11 During 1980-2010, the share of capital
expenditure in total expenditure of States exhibited
a marginal increase and that too mainly in recent
years. Capital outlay15 as a percentage to GDP
(CO-GDP), an indicator of investment activities of
State governments, began to show a declining trend
in the early 1980s which has become pronounced
particularly since 1987-88. During this period, the
States slashed their investment activities faced with
revenue deficit from 1987-88 onwards. There was
a slowing down of investments by State
governments reflecting a further shifting of State
expenditure towards revenue expenditure largely
due to continued growth in non-Plan expenditure
on account of interest payments, pensions and
administrative services. However, this trend has
reversed in recent years and the evolving pattern
of expenditure, particularly during the post-2002-03
period, indicates a sharp increase in capital-outlay
as percentage to GDP. An inter-temporal
comparison shows that the CO-GDP ratio declined from 2.0 per cent during 1980-85 to 1.8 per cent
during 1985-90. The decline became more
entrenched during the 1990s with the deteriorating
fiscal situation of the States. However, with the
overall improvement in State finances, the States
have been able to scale up capital outlay as
reflected in the CO-GDP ratio of 2.4 per cent during
2005-10 (Chart VI.9).
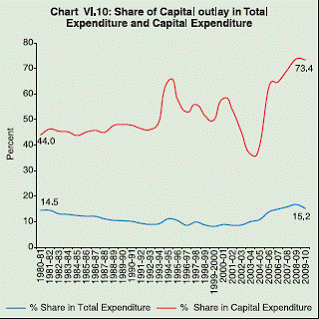
6.12 Another encouraging trend that has
emerged in recent years is the rising share of capital
outlay in total capital expenditure of State
governments. The share of capital outlay in total
capital expenditure increased from 44.4 per cent
in 1980-81 to 68.6 per cent during 2009-10. This
reflects an increasing role of State governments in
generating productive capacity and enhancing their
growth potential. Although growth in capital outlay
has shown fluctuating trends over the years, CARG
during 1980-81 to 2009-10 was found to be higher
than that of capital expenditure of State
governments (Chart VI.10).
6.13 Capital outlay mainly comprises spending
on developmental activities pertaining to social and
economic services. Developmental capital outlay
as percentage to GDP (DCO-GDP) persistently
declined from 2.0 per cent during 1980-85 to 1.3
per cent during 1995-2000. However, with
increasing focus of State governments on economic services pertaining to rural development, irrigation
activities, energy and transport in subsequent
years, the DCO-GDP ratio rose to 1.6 per cent
during 2000-05 and 2.4 per cent during 2005-10.
Developmental capital outlay on economic services
as percentage to GDP rose from 1.1 per cent during
1995-2000 to 1.9 per cent during 2005-10. The
development capital outlay of State governments
on the transport sector as percentage to GDP has
witnessed a considerable increase, particularly
since the beginning of the 2000s. Similarly, an
increase in development capital outlay on the
energy sector as percentage to GDP from 0.15 per
cent to 0.30 per cent during 2009-10 reflects the
State governments’ focus on meeting their energy
requirements. Furthermore, developmental capital
outlay on social services as percentage to GDP
also increased from 0.3 per cent to 0.5 per cent
during 1995-2000 and 2005-10. Within the social
services, capital outlay was mainly allocated in the
sectors, viz., water supply and sanitation followed
by education, sports, art and culture and medical
and public health (Appendix Table 22).
 |
 |
6.14 Capital expenditure towards repayment of
loans to the Centre has surged, particularly since
2002-03. Under the Debt Swap Scheme (2002-03 to
2004-05), the States had to pre-pay their high-cost
debt to the Centre through additional market borrowings and proceeds from small savings. In
contrast, the capital expenditure of State governments
through loans and advances for development and
non-development purposes has shown a persistent
downtrend during the period of analysis. In particular,
loans and advances for developmental purposes
dwindled from 1.39 per cent of GDP during 1980-85
to 0.34 per cent during 2005-10.
Development and Non-development Expenditure16
6.15 Another way to analyse the State
governments’ expenditures is to classify them
under: ‘development’ and ‘non-development’
expenditures. Development expenditure has a
beneficial impact and leads to economic and social
development. Non-development expenditure, on
the other hand, captures administrative expenditure
and interest expenditure. Thus, such a classification
of expenditure is important to capture the qualitative
changes taking places in the expenditure patterns
of State governments. Since development
expenditure relates to both economic and social
services, its trends broadly capture the evolving role
of State governments in the economic and social
development of the economy.
6.16 A composition of aggregate expenditure by
State governments shows that it has been largely spent for developmental purposes (Chart VI.11).
Development expenditure as percentage of GDP (DEGDP),
in general, showed a declining trend during
1987-88 and 2004-05. However, the DE-GDP ratio
rose thereafter. While development capital outlay as
a percentage of GDP has shown a significant rise
during 2000-05 and 2005-10, development revenue
expenditure as percentage of GDP continued to show
a declining trend (Table VI.6 and Chart VI.12).
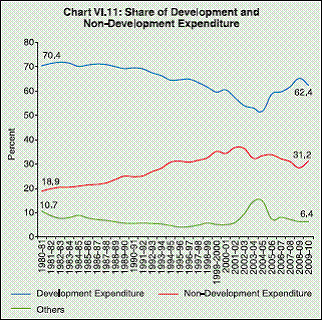 |
Table VI.6: Composition of Development Expenditure |
(Per cent of GDP) |
Item |
1980-85 |
1985-90 |
1990-95 |
1995-2000 |
2000-05 |
2005-10 |
CARG |
1 |
2 |
3 |
4 |
5 |
6 |
7 |
8 |
Development Expenditure (i+ii) |
10.9 |
11.4 |
10.7 |
9.4 |
9.4 |
9.8 |
13.7 |
Of which: |
|
|
|
|
|
|
|
(i) Revenue |
7.5 |
8.5 |
8.3 |
7.5 |
7.3 |
7.2 |
14.2 |
(ii) Capital |
3.4 |
2.9 |
2.4 |
1.9 |
2.1 |
2.6 |
12.5 |
Non-Development Expenditure |
3.1 |
3.7 |
4.3 |
4.8 |
5.9 |
5.0 |
16.1 |
Others |
1.3 |
1.1 |
0.9 |
0.7 |
1.7 |
1.1 |
12.2 |
Total |
15.3 |
16.1 |
15.9 |
14.9 |
17.0 |
15.9 |
14.2 |
Source: Budget Documents of the State Governments |
6.17 As can be seen from Chart VI.13, the share
of economic services in aggregate development
expenditure of the States was higher than that of
social services during the 1980s and 1990s. During
the subsequent period, however, the average share
of economic services in the aggregate development
expenditure of the States was lower than that of
social services.
Social Sector Expenditure
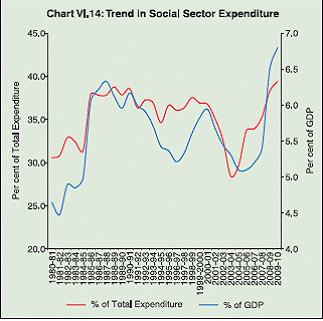
6.18 Social sector expenditure is called for as most
of the sectors falling under this have large externalities
or spillover benefits in areas such as education, public
healthcare and water and sanitation. In the Indian
context, the State governments are entrusted with
higher responsibilities by the Constitution (Seventh
Schedule, Article 246) with respect to social spending
such as on health, education and family welfare. As
far as allocation to social sector expenditure by State
governments as percentage to GDP (SSE-GDP) is
concerned, it shot up sharply during the second half
of the 1980s and showed some moderation during
the 1990s. It has often been pointed out that social
sector expenditure was the most vulnerable to
reduction in the total budget even before India’s
reforms began (Tsujita, 2005)17. A number of studies
found that social sector expenditure declined under
pressure to reduce fiscal deficits following economic
reforms during the 1990s. Although, there was some
pick up in the SSE-GDP ratio during the terminal years
of the 1990s, on an average basis, it remained at 5.5
per cent which was lower than that in 1990-95. During
the first half of the 2000s, the SSE-GDP ratio was
broadly stable at 5.5 per cent. However, social sector
expenditure as percentage to GDP accelerated during
2005-10 (Chart VI.14).
 |
6.19 A major chunk of the social sector
expenditure has been in the form of revenue
expenditure rather than capital outlay.
Nevertheless, the share of capital outlay in total
social sector expenditure showed some
improvement during 2000-05 and 2005-10. At
present, capital outlay forms approximately 10 per
cent of the total social sector expenditure. This
indicates that only 10 per cent of the total social
sector expenditure (i.e., capital expenditure
comprising of capital outlay and loans and
advances) is allocated towards investment in social
infrastructure. The fiscal priority given to the social
sector (i.e., SSE to total expenditure ratio) which
averaged at around 31.6 per cent during 1980-85
increased to 38.0 per cent during 1985-90.
However, it moderated somewhat during the 1990s
and declined significantly during the first half of the
2000s albeit with an upward trend since 2005-06.
6.20 During the 1980s, key social sectors like
rural development, education, sports, art and
culture, water supply and sanitation and welfare
of Scheduled Castes, Scheduled Tribes and
Backward Classes seemed to have received
particular attention. Although there was some
moderation in the SSE-GDP ratio during the
1990s as the deteriorating fiscal position of the
States led to resource gaps during and spending
on some social sectors were adversely affected.
Despite this, key social sectors, viz., education,
sports, art and culture, medical and public health
and rural development continued to receive a
relatively greater allocation of expenditure
(Appendix Table 23).
5. State-wise Analysis of Expenditure
6.21 State government expenditure as
percentage to GSDP (SGE-GSDP ratio) is found
to be significantly higher in the special category
States, viz., Sikkim, Arunachal Pradesh, Mizoram,
Manipur and Jammu and Kashmir. The role of State
government expenditure in the economic activities of these States appears to be significant. One of
the reasons for the higher SGE-GSDP ratio in
special category States could be higher resource
transfers by the Central Government as compared
with other States. However, the SGE-GSDP ratio
is found to be lower than 20 per cent in States like
Maharashtra, Gujarat, Haryana, Kerala, Tamil Nadu
and West Bengal (Statement 49).
6.22 In case of States with per capita income
below the average, viz., (Sikkim, Jammu and
Kashmir and Bihar), the SGE-GSDP ratio rose
sharply during 1980-85 and 2005-10. In contrast,
during the same period, the SGE-GSDP ratio
showed a decline in States, viz., Tamil Nadu,
Meghalaya, Gujarat, Maharashtra, Kerala, Manipur,
Haryana and Nagaland (Chart VI.15). This indicates
that the size of the economy of these States (i.e.,
GSDP) grew faster than the size of spending by
the respective State governments. However, an
analysis shows that the average change in the
SGE-GSDP ratio during 2005-10 over 1985-90 was
not statistically significant at 5 per cent18. Thus, in
general, the size of State governments has not
changed significantly over the period of analysis.
 |
6.23 Most of the special category States spent
more in the form of per capita expenditure than the
national average during 2005-10. In contrast, the
high per capita income States, viz., Punjab,
Haryana, Gujarat, Kerala and Tamil Nadu spent
less than the national average during the same
period. The rank correlation between the State-wise
SGE-GSDP ratio and per capita aggregate
expenditure for 2005-10 turns out to be 0.49 which
is statistically significant at 1 per cent. This shows
that, in general, the States with high a SGE-GSDP
ratio also lead in terms of per capita aggregate
spending.
Revenue Expenditure
6.24 State-wise analysis shows that revenue
expenditure as a percentage of GSDP was
generally higher in special category States than that
in non-special category States. For instance, the
RE-GSDP ratio was the highest in Sikkim at 92.8
per cent during 2005-10, followed by Arunachal
Pradesh (64.5 per cent) and Mizoram (58.0 per
cent). In contrast, the Revenue Expenditure-GSDP
ratio was lower than 20 per cent in all the nonspecial
category States (except Bihar) during the
same period. Among the non-special category
States, Gujarat, Maharashtra and Haryana had the
lowest RE-GSDP ratio during 2005-10. An intertemporal
comparison shows that the two States,
viz., Maharashtra and Nagaland witnessed a
decline in the RE-GSDP ratio during 2005-10 as
compared with that in 1980-85. However, 15 out of
the 28 States recorded a decline in the RE-GSDP
ratio during 2005-10 over 2000-05. This shows that
there has been some rationalisation in revenue
expenditure across States during the FRL period
(Statement 50). In the case of non-special category
States, the RE-GSDP ratio, albeit lower during
2005-10 than that in 2000-05, was still statistically
significantly higher than that in 1980-85.
6.25 Within revenue expenditure, interest
payment for servicing of outstanding debt is one of
the major committed expenditures of State
governments. Interest payment as percentage to
GSDP declined during 2005-10 over 2001-05 in all
the States, except Madhya Pradesh, Himachal Pradesh Mizoram and Uttarakhand. The decline
during 2005-10 over 2001-05 was statistically
significant at 1 per cent level of significance. This
could be attributed to the Debt Swap Scheme (DSS)
operated during 2002-05 and the Debt
Consolidation and Relief Facility (DCRF)
recommended by the TwFC which facilitated the
States in reducing expenditure on interest
payments.
Capital Outlay
6.26 Most of the State governments seem to
have realised the need to contain unproductive
expenditures and reorient spending towards
developmental purposes. Capital outlay as a
percentage of GSDP (CO-GSDP) recorded an
increase across all the States during 2005-10 over
2000-05. Among the non-special category States,
Bihar and Uttar Pradesh recorded a significant rise
in CO-GSDP ratio while among the special category
States, the rise was sharpest in Arunachal Pradesh,
Manipur, Mizoram and Uttarakhand. The overall
rise in CO-GSDP ratio across States during 2005-
10 over 2000-05 was statistically significant at 1
per cent (Statement 51). One interesting fact that
emerges from this analysis is that among the nonspecial
category States, the CO-GSDP ratio was
considerably higher in Orissa and in some of the
underdeveloped States, viz., Bihar, Rajasthan,
Madhya Pradesh and Uttar Pradesh during the
1980s. Furthermore, these States witnessed a
significant increase in the CO-GSDP ratio during
the 1990s moving in tandem with most of the other
States. Even during 2005-10, Bihar, Madhya
Pradesh, Jharkhand, Rajasthan and Uttar Pradesh
had the highest CO-GSDP ratio among the nonspecial
category States. However, these States
have lower per capita capital outlay as compared
with other States. This may have implications for
their level of per capita income as well.
6.27 As far as the trend in per capita capital
outlay across States is concerned, a few States
seemed to have lagged behind others in terms of
growth. During 1980-2010, the compound annual
growth rate in per capita capital outlay was below
10 per cent in Kerala, Madhya Pradesh, Orissa, Arunachal Pradesh and Mizoram. In contrast the
States, viz., Tamil Nadu, Maharashtra, Andhra
Pradesh, Karnataka and Assam recorded the
highest CARG during the same period reflecting
their increasing focus on building infrastructure for
boosting growth and development. Per capita
capital outlay is generally higher in special category
States than in the non-special category States
(Statement 52). The rank correlation at 0.71
between the CO-GSDP ratio and per capita capital
outlay is statistically significant at 1 per cent. Thus,
it can be inferred that in general States having a
higher CO-GSDP ratio also spent higher amount
in terms of per capita during 2005-10.
Development Expenditure
6.28 During 2005-10, development expenditure
as a percentage to GSDP (DE-GSDP) has shown
a significant increase over 2000-05 across a
majority of the States. In a few States, however,
the DE-GSDP ratio was still lower than that during
1980-85 (Statement 53). The DE-GSDP ratio is
found to be higher among the special category
States as compared with non-special category
States. Among the non-special category States
Bihar, Madhya Pradesh, Uttar Pradesh and Orissa
—all with per capita income below the national
average—seemed to have focused more on
development spending as their respective DEGSDP
ratios rose during 2005-10 over 2000-05. In
contrast, some rich States like Punjab, Haryana,
Gujarat, Goa, Maharashtra and Tamil Nadu
witnessed a decline in the DE-GSDP ratios during
2005-10 over that during the 1980s and 1990s. With
regard to the share of development expenditure in
the total expenditure of States during 2005-10,
there was a statistically significant decrease as
compared with 1980-85. However, the share of
development expenditure in total expenditure by
State governments turned out to be significantly
higher than that in 2000-05 (Statement 54).
6.29 Per capita development expenditure shows
a distinct trend between special and non-special
category States. Special category States tend to
spend more on development expenditure per capita. No distinct trend, however, is discernible in
terms of CARG in per capita development spending
across special and non-special category States.
During the period of analysis, CARG in per capita
development spending by the State governments
was found to be higher than 10 per cent in all the
States, except Madhya Pradesh, Mizoram and
Nagaland (Statement 55). The statistically
significant rank correlation of 0.50 between the DEGSDP
ratio and per capita development
expenditure across States shows that, in general,
States with a high DE-GSDP ratio also allocate
more in terms of per capita development
expenditure.
Social Sector Expenditure
6.30 Social sector expenditure as percentage to
GSDP was found to be generally higher in special
category States as compared with non-special
category States. A State-wise trend in social
sector expenditure as percentage to GSDP shows
that all State governments increased their
spending on social sector development during the
second half of the 1980s. However, there was a
decline in the SSE-GSDP ratio across a majority
of the States during 1990-2005 (Statement 56).
In recent years, there seems to be more emphasis
on social sector spending by the State
governments as an average rise in the SSE-GSDP
ratio across the States was statistically higher than
that during 2000-05. In most of the States, the per
capita social sector spending of State
governments recorded a CARG of above 10 per
cent (Statement 57). As in case of development
expenditure, rank correlation between SSE-GSDP
ratio and per capita social sector spending is also
found to be statistically significant.
6.31 Once the trend in the share of public
expenditures is explored, it is of great interest to
examine whether the States have harmonised the
functional distribution of their public expenditures.
An exercise on the composition of expenditure
indicates convergence with respect to major
development expenditures across the States
(Box VI.19 and Chart A to F).
Box VI.1 : Convergence in the Composition of Major Categories of Expenditure across States
There are many definitions of convergence in literature; there
are two convergence indicators that have been widely used: β-
convergence and α convergence (Barro and Sala-i-Martin, 1992).
The former takes place if it is found that when a group of crosssections
(States in this case), starting out the sample period with
below-average (variable) tend to grow faster than other groups
of cross-sections that start with above-average levels, whereas
the latter is found when there is a decline in the dispersion of
levels over a period of time.
In order to examine convergence of major categories of
expenditure, an exercise covering the period 1980-81 to 2008-09
(RE), is attempted to estimate β convergence by estimating the
following equation:
E represents the level of per capita expenditure of a State where
0 and T represent the initial and final years respectively, and uit
is an error term.
The above equation is estimated for major categories of
expenditure, viz ., revenue expenditure, capital outlay,
development expenditure and social sector expenditure.
Table 1 : Beta Convergence Regressions for Per Capita Expenditure Levels across States |
|
CO |
DE |
SSE |
ED |
HE |
RD |
α |
4.6 |
7.1 |
7.3 |
6.2 |
4.3 |
3.3 |
Ln Ei0 |
-0.35** |
-0.70* |
-0.78* |
-0.74* |
-0.56* |
-0.30 |
Adj. R2 |
0.16 |
0.47 |
0.51 |
0.31 |
0.33 |
0.08 |
β |
-0.010 |
-0.018 |
-0.020 |
-0.019 |
-0.015 |
-0.009 |
(* ) and ( **) denote Significance at 1 % and 5% respectively.
CO: Capital Outlay. DE: Development Expenditure.
SSE: Social Sector Expenditure. ED: Education Expenditure.
HE: Housing Expenditure.
RD: Rural Development Expenditure. |
It can be observed from Table 1 that the coefficient of ä is
negative across all the equations tested for beta convergence. It
can be inferred that the levels of per capita capital outlay,
development expenditure and social sector expenditure have
shown some convergence across States as their respective
coefficients of ä are negative as well as statistically significant.
However, within social sector expenditure, the coefficient of ä in
equations tested for per capita expenditure on rural development
is negative but not statistically significant indicating convergence
not supported by statistical confidence. Per capita spending by
States on other categories of social sector expenditure, viz., (i) health; and (ii) education, sport, art and culture have shown
significant convergence across States. Among the broad
expenditure categories, the rate of convergence as denoted by
beta shows that per capita social sector expenditure had the
highest rate of convergence across States during 1980-81 and
2008-09 followed by per capita development expenditure. These
empirical findings support the trend shown by weighted coefficient
of variation (WCV), weighted by the population share of each
State, which reflects a changing degree of dispersion in per capita
expenditure of select categories. The weighted coefficient of
variation is calculated as:
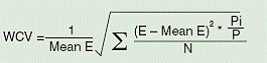 |
Where E is the relevant expenditure category in per capita terms,
Pi/P is share of the State in total population and N is the number
of States.
A panel of charts shows that a declining trend is discernible in
WCV of broad categories of expenditure (in per capita terms),
viz., capital outlay, development expenditure and social sector
expenditure across 22 States during 1980-2009. Within social
sector expenditure, a declining trend in WCV was observed in
per capita health expenditure. However, per capita rural
development expenditure across States has shown no
convergence during 1980-2009 as was also seen in the beta
convergence analysis. While the beta convergence analysis
supported increasing convergence in per capita education
expenditure across States, the trend in WCV does not seem to
support this finding (Charts A to F).
As far the impact of major categories of expenditure on GSDP
growth is concerned, a short exercise based on pooled least
square method shows that one percentage increase in the capital
outlay-GSDP ratio impacts GSDP growth by 0.2 percentage
points in the succeeding year. However, the impact of
development expenditure and social sector expenditure with one
year lag on GSDP growth appears to be lower than that of capital
outlay perhaps due to the fact these are dominated by the
revenue expenditure component (Table 2). It is found that the
impact of capital outlay and development expenditure on GSDP
growth of States is statistically significant.
Table 2 : Impact on GSDP Growth : Pooled Least Square |
Expenditure Category |
C |
Coefficient |
T-Statistic |
CO-GSDP (-1) |
9.4 |
0.2 |
3.4 |
DE-GSDP (-1) |
8.4 |
0.1 |
4.5 |
SSE-GSDP (-1) |
9.6 |
0.1 |
1.3 |
Contd... |
6. Conclusion
6.32 Trend analysis shows that aggregate
expenditure of the State governments as a share of
GDP increased during the 1980s but fell during the
1990s. Aggregate expenditure as percentage of
GDP moved upward during 2000-05. However,
compression in consolidated expenditure of State governments can be observed during 2005-10
mainly on account of some rationalisation of revenue
expenditure during the fiscal responsibility legislation
(FRL) period. This is evident from a decline in the
RE-GDP ratio from 13.3 per cent in 2000-05 to 12.4
per cent during 2005-10. The analysis indicated a
convergence of the major components of the
development expenditure across the States.
12 The Union List consists of 97 subjects (e.g., defence, atomic energy, railway and telecommunication and insurance). The State List
consists of 66 subjects (e.g., police, local government, public health and taxes on agricultural income). There are 47 subjects in the
Common or Concurrent List (e.g., education, forests, vital statistics including registration of births and deaths and economic and social
planning). The unspecified or residuary powers rest with the Central Government. Any change in these lists can be made only by an
amendment to the Constitution.
13 Semmler, Willi, et al. (2007), ‘Fiscal Policy, Public Expenditure Composition, and Growth Theory and Empirics’, World Bank Policy
Research Working Paper 4405.
14 Pang Gaobo, Pinto Brian and Wes Maria (2007): ‘India Rising - Faster Growth, Lower Indebtedness’, Policy Research Working Paper
Series 4241, The World Bank, Washington.
15 Capital outlay includes capital expenditure on social and economic services.
16 Development expenditure comprises expenditure on social services (e.g. education, sports, art and culture, medical and public health,
family welfare, water supply and sanitation, housing, urban development, welfare of Scheduled Castes, Scheduled Tribes and other
Backward Classes, social security and welfare) and economic services (e.g, agriculture and allied activities, rural development, special
area programmes, major and medium irrigation and flood control, energy, industry and minerals, transport, communications, science,
technology and environment and general economic services. Non-development expenditure includes expenditure on general services
including organs of the State, fiscal services, interest payments and servicing of debt, administrative services, pensions and miscellaneous
general services.
17 Tsujita, Yuko (2005), “Economic Reform and Social Secot Expenditures: A Study of Fifteen Indian States 1980/81-1999/2000”, Discussion
Paper No. 31, Institute of Developing Economies - Japan External Trade Organisation, Japan.
18 Based on Difference of Means Test, i.e., T= (Mt-Mt-1)/S.E. Where Mt and Mt-1 imply the average SGE-GSDP ratio across States during
2005-10 and 1980-85 respectively. S.E. is standard error. |