The Consumer Confidence Survey provides an assessment of the perception of respondents spread across six metropolitan cities viz., Bengaluru, Chennai, Hyderabad, Kolkata, Mumbai and New Delhi. The survey captures qualitative information from respondents on their perceptions on general economic conditions and own financial situation on a 3-point scale viz. improve, remain same or worsen. The assessments are analysed in two parts, viz., current situation as compared with a year ago and expectations for a year ahead. The survey questionnaire was rationalised in this round. With the exclusion of questions on household circumstances from this round, Current Situation Index (CSI) and Future Expectations Index (FEI) for previous rounds have been recalculated and comparable data has been presented. The salient findings of the survey, conducted during the last week of February 2015 and first week of March 2015 based on the response of around 5,400 respondents are presented below.
Highlights:
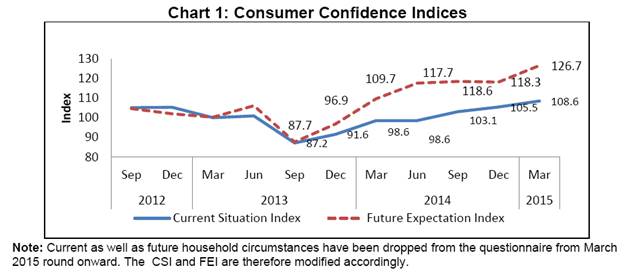
- The current round of the Consumer Confidence Survey reflects improvement in terms of Current Situation Index (CSI) and Future Expectations Index (FEI). The CSI has gradually improved over the last four quarters from 98.6 to 108.6. The FEI after remaining at around 118 during the last three rounds of survey, increased to about 127 due to improvement in positive perceptions on future economic conditions and future spending (Chart 1).
-
Net response of current economic conditions as compared to one year ago has shown improvement in the last four rounds of the survey. Also, positive perceptions on future economic conditions which were declining in the last three rounds, has shown a turnaround in this quarter (Table 1).
-
The positive perceptions regarding income appear to be declining from September 2014 onwards. The net response on income in the current period as well as that 1-year ahead have recorded fall in March 2015 (Table 2).
-
The net response on current spending continued to remain at above 70 per cent. As regards future spending, nearly 78 per cent respondents expect an increase in 1-year ahead period (Table 3).
-
This is the first time that the views of the respondents on essential and non-essential spending of their household have been ascertained. More than 80 per cent of the respondents reported increase in the current as well as future spending perceptions on essential items. However, the proportion of respondents who reported increase in current and future perceptions on non-essential spending is much lower at around 40 per cent.
-
Employment outlook worsened in this round as compared to previous round of survey but still more than 50 per cent of respondents expect improvement in employment situation 1-year ahead (Table 4).
-
As regards price levels and inflation, current sentiments show improvement in this round of survey. However, perceptions on future price levels as well as inflation reflect deterioration in positive sentiments. (Tables 5 and 6).
| Table 1: Perceptions on Economic Conditions |
| (Percentage responses) |
| |
Compared with 1-year ago |
1-year ahead |
| Jun-14 |
Sep-14 |
Dec-14 |
Mar-15 |
Jun-14 |
Sep-14 |
Dec-14 |
Mar-15 |
| Improve |
25.5 |
29.3 |
30.2 |
41.7 |
56.7 |
54.8 |
50.9 |
56.8 |
| Remain same |
34.6 |
32.1 |
41.2 |
32.4 |
25.6 |
28.1 |
32.3 |
26.8 |
| Worsen |
39.9 |
38.7 |
28.6 |
25.9 |
17.6 |
17.1 |
16.8 |
16.4 |
| Net Response |
-14.4 |
-9.4 |
1.6 |
15.8 |
39.1 |
37.7 |
34.1 |
40.4 |
| Table 2: Perceptions on Income |
| (Percentage responses) |
| |
Compared with 1-year ago |
1-year ahead |
| Jun-14 |
Sep-14 |
Dec-14 |
Mar-15 |
Jun-14 |
Sep-14 |
Dec-14 |
Mar-15 |
| Increase |
39.1 |
47.2 |
38.7 |
35.4 |
63.9 |
67.0 |
59.8 |
55.4 |
| Remain same |
46.7 |
38.4 |
48.0 |
46.1 |
30.8 |
27.8 |
35.1 |
35.5 |
| Decrease |
14.3 |
14.4 |
13.2 |
18.5 |
5.2 |
5.1 |
5.1 |
9.1 |
| Net Response |
24.8 |
32.7 |
25.5 |
16.9 |
58.7 |
61.9 |
54.7 |
46.3 |
| Table 3: Perceptions on Spending |
| (Percentage responses) |
| |
Compared with 1-year ago |
1-year ahead |
| Jun-14 |
Sep-14 |
Dec-14 |
Mar-15 |
Jun-14 |
Sep-14 |
Dec-14 |
Mar-15 |
| Increase |
77.1 |
78.1 |
75.7 |
80.0 |
36.3 |
41.9 |
35.6 |
78.3 |
| Remain same |
16.0 |
18.2 |
20.0 |
13.7 |
32.6 |
28.6 |
35.3 |
15.8 |
| Decrease |
6.8 |
3.8 |
4.3 |
6.3 |
31.2 |
29.5 |
29.2 |
6.0 |
| Net Response |
70.3 |
74.3 |
71.4 |
73.7 |
5.1 |
12.4 |
6.4 |
72.3 |
| Table 4: Perceptions on Employment |
| (Percentage responses) |
| |
Compared with 1-year ago |
1-year ahead |
| Jun-14 |
Sep-14 |
Dec-14 |
Mar-15 |
Jun-14 |
Sep-14 |
Dec-14 |
Mar-15 |
| Improve |
30.8 |
36.0 |
36.1 |
37.6 |
65.1 |
61.4 |
61.1 |
55.8 |
| Remain Same |
39.0 |
35.3 |
39.7 |
35.3 |
24.8 |
29.0 |
29.7 |
28.7 |
| Worsen |
30.2 |
28.7 |
24.1 |
27.2 |
10.1 |
9.5 |
9.3 |
15.5 |
| Net Response |
0.6 |
7.3 |
12.0 |
10.4 |
54.9 |
51.9 |
51.8 |
40.3 |
| Table 5: Perceptions on Price Level |
| (Percentage responses) |
| |
Compared with 1-year ago |
1-year ahead |
| Jun-14 |
Sep-14 |
Dec-14 |
Mar-15 |
Jun-14 |
Sep-14 |
Dec-14 |
Mar-15 |
| Increase |
89.7 |
92.1 |
85.1 |
78.8 |
76.7 |
77.6 |
66.7 |
73.9 |
| Remain same |
8.8 |
5.1 |
12.6 |
16.0 |
16.1 |
15.8 |
22.2 |
17.7 |
| Decrease |
1.5 |
2.8 |
2.3 |
5.2 |
7.2 |
6.6 |
11.1 |
8.4 |
| Net Response |
-88.2 |
-89.2 |
-82.8 |
-73.6 |
-69.5 |
-71.0 |
-55.6 |
-65.5 |
| Note: Perceptions of increase in prices is considered to be negative sentiments and decrease in prices is considered to be positive sentiments. The net responses are therefore, negative. |
| Table 6: Perceptions on rate of change in Price Levels (Inflation) |
| (Percentage responses) |
|
Compared with 1-year ago |
1-year ahead |
| Jun-14 |
Sep-14 |
Dec-14 |
Mar-15 |
Jun-14 |
Sep-14 |
Dec-14 |
Mar-15 |
| Increase |
87.1 |
88.2 |
81.9 |
82.5 |
84.0 |
85.9 |
81.0 |
83.5 |
| Remain Same |
11.1 |
10.2 |
15.9 |
13.7 |
14.5 |
13.1 |
16.9 |
12.7 |
| Decrease |
1.8 |
1.6 |
2.2 |
3.8 |
1.5 |
1.1 |
2.1 |
3.7 |
| Net Response |
-85.4 |
-86.6 |
-79.8 |
-78.7 |
-82.4 |
-84.8 |
-78.8 |
-79.8 |
|