Press Release RBI Working Paper Series No. 09
Bank Lending and Loan Quality: The Case of India
@Pallavi Chavan and Leonardo Gambacorta Abstract *This paper analyses how non-performing loans (NPLs) of Indian banks behave through the cycle. We find that a one-percentage point increase in loan growth is associated with an increase in NPLs over total advances (NPL ratio) of 4.3 per cent in the long run with the response being higher during expansionary phases. Furthermore, NPL ratios of banks are found to be sensitive to the interest rate environment and the overall growth of the economy. Notwithstanding differences in management and governance structures, there is a procyclical risk-taking response to credit growth in the case of both public and private banks with private banks being more reactive to changes in interest rate and business cycle conditions. JEL Classification: E320; G210; G010. Keywords: Procylicality, Loan Quality, Bank Lending, Bank Ownership, Moral Hazard. Introduction Procyclicality in the lending behaviour of financial institutions is an area of longstanding interest in economic research and is at the heart of the design and operation of macro-prudential policy. Financial institutions tend to overstretch their lending in periods of economic upturns and restrain it during downturns. Not only the amount but also the quality of lending tends to show a cyclical response. The global financial crisis of 2008, once again and perhaps more emphatically than before, brought to the fore the procyclical nature of lending and the tendency of financial institutions to take on risky assets during credit upturns in many advanced economies. Although procyclicality in the lending and risk-taking behaviour of banks has been well-established theoretically for a long time, the empirical literature on this issue is of relatively recent vintage.1 This paper is a contribution towards understanding the procyclicality in non-performing loans of banks in India. As the Indian financial system is bank-centric in nature, with banks accounting for the largest share of total financial assets and being closely inter-linked with other constituents of the financial system, the analysis in this paper provides broad reflections about the stability of the Indian financial system as a whole.2 India offers an interesting case study of loan quality for reasons that have both immediate and general relevance. At the present juncture, the Indian banking sector is beleaguered by increasing bad loans, with gross NPLs accounting for 7.5 per cent of banks’ total outstanding loan portfolio in the financial year ending March 2016. When the restructured loans are added, the total stressed loans work out to 10.8 per cent of the total loan portfolio.3 This increase in stress in banks’ loan books has followed the outbreak of the global financial crisis and a period of remarkably high credit growth in the mid-2000s (RBI, 2010). The stress in loan books has become particularly striking after 2011. In light of these recent trends in NPLs, it may be pertinent to understand whether and how far the bank credit dynamic affects loan quality of Indian banks. It may also be worthwhile to examine various macroeconomic and bank-specific determinants of NPLs. Furthermore, typical of the emerging world, India has a fairly large public banking sector. Public banks account for about 73 per cent of the total assets of the banking system (and about 47 per cent of the total assets of the financial system). Hence, it is also interesting to analyse the procyclicality of NPLs while controlling for the ownership of banks, as has been done in this paper. The paper is divided into six sections. Section 2 contains a review of the theoretical and empirical literature on procyclicality of loan quality of banks. Section 3 provides a discussion of the econometric strategy used in the paper. Section 4 analyses certain stylised facts about the loan quality of Indian banks. Section 5 presents findings from the empirical analysis, and Section 6 concludes. 2. Literature Review on Procyclicality of Non-performing Loans The term procyclicality has been widely used in policy discussions (FSF, 2009). In our study, following the economic literature, we define non-performing loans as procyclical when they are positively correlated with credit growth. This means that, other things being equal, the NPL ratio tends to increase when the lending in the economy is growing. Theoretical literature. A procyclical lending and risk-taking response by banks has been explained on various theoretical grounds:4 First, such responses can be on account of ‘herd behaviour’ by banks. Rajan (1994) argues that banks are rational agents but are driven by two short-term concerns: earnings and reputation. Hence, they tend to herd their peers in terms of lending with the comfort that they would not severely under-perform even if the credit cycle busts. In the process, however, they tend to follow a more liberal credit policy by extending the terms of loans and weakening credit covenants, thus explaining the procyclicality in risk-taking. Secondly, the literature also discusses various cognitive biases afflicting banks. First, ‘disaster myopia’ or short-sightedness in underestimating the likelihood of high-loss low-probability events is one such bias (Guttentag and Herring, 1986). Although banks can mitigate this risk by investing adequately in information about market conditions and borrowers, their myopia often inhibits them from making such an investment. The second cognitive bias relates to ‘cognitive dissonance’, wherein banks do have the necessary information at their disposal but tend to interpret it in a biased way, reinforcing their existing beliefs about market conditions. Borio et al. (2001) argue that such biases give rise to misperceptions about prevailing risks leading to a more procyclical risk-taking response by banks. Thirdly, the literature discusses the ‘institutional memory hypothesis’ with banks having fading memories of previous credit busts aggravating procyclicality in loan growth and risk-taking (Berger and Udell, 2003). Fourthly, there is a ‘principal-agent problem’ between shareholders and managers, with the latter more interested in short-term gains resulting in a more procyclical risk-taking response by banks during credit upturns (Williamson, 1963; Saunders et al., 1990). The literature also emphasises the role of collateral as an explanation for the procyclical nature of credit and risk-taking by banks (Kiyotaki and Moore, 1997; Adrian and Shin, 2010; Jimenez and Saurina, 2006; and Borio et al., 2001). As credit growth picks up, banks tend to expand their credit limits because the valuation of underlying collateral goes up during an upturn in the asset price cycle, and more often than not, an asset price cycle tends to accompany a credit cycle. As more credit is extended, it sets a feedback mechanism further increasing the collateral valuation and amplifying the asset price cycle (Kiytotaki and Moore, 1997). As a result, banks end up financing borrowers that they may not have otherwise financed, but the increase in collateral valuation enables them to do so. However, whenever there is a downturn in asset prices, banks find themselves saddled with bad loans. Adrian and Shin (2010) argue that whenever there is an upturn in the credit cycle, banks tend to look for newer borrowers as all the existing ‘good’ borrowers already possess a mortgage. In the process, banks may finance sub-prime borrowers who were not deemed credit-worthy and hence did not have an access to the credit market earlier. This explains why NPLs may show a procyclical response to bank credit. Empirical literature. Empirical tests on this subject started to develop in the late nineties. One of the first comprehensive studies in this regard, at least to our knowledge, was done by Keeton (1999), who used data on US banks from 1982 to 1996 and found a positive impact of credit growth on loan delinquencies using VAR methodology.5 Other important contributions are those of Salas and Saurina (2002) and Jimenez and Saurina (2006) on the Spanish banking sector. Using a dynamic panel framework, these papers found a lagged positive relation between credit growth and growth in loan losses for Spanish banks. Banks’ loan losses tended to rise with higher loan growth, but loans extended during periods of booms were riskier than those extended in the periods of busts. Following these studies, several attempts were made over the 2000s to model the impact of credit growth or its variants on NPLs of banks. A look at the chronology of these studies clearly suggests increased interest in the subject after the global financial crisis. Most of these studies used a set of countries sampled on the basis of a regional or functional classification: Skarica (2013) studied emerging economies from Europe; Festic et al. (2011) analysed five countries from the European Union (EU); De Bock and Demyanets (2012) covered a sample of emerging economies; and Messai and Jouini (2013) studied three crisis-ridden European economies of Greece, Italy and Spain. Khemraj and Pasha’s (2009) study focused individually on the Guyanese banking sector. Caporale et al. (2013), studying the Italian banking sector, modelled the Granger causality between total loans and bad loans of banks. The vast majority of these studies found a positive impact of bank credit on bad loans. Besides the relation between credit growth and NPLs, the literature is also replete with discussions on various macro-economic and bank-specific determinants of NPLs. The macro-economic determinants covered in the literature can be divided into four major categories: (a) economic activity (GDP growth, gross capital formation, exports, unemployment rate); (b) cost of credit (real lending rate or policy rate); (c) collateral (stock or housing prices); (d) vulnerability to external sector shocks (exchange rate, foreign currency borrowings). Studies found an unequivocal improvement in loan quality with an upturn in economic activity.6 The increase in real interest rates, reflecting financing costs and ability to service debt for borrowers, showed a positive relation with NPLs according to most studies.7 Given that an increase in the value of underlying collateral increased the ability of economic agents not only to borrow but also to weather any adverse economic shocks, studies found a negative impact of collateral valuation on NPLs.8 However, as observed in Beck et al. (2013), the impact varied depending on the size of the capital market in an economy. An external sector shock, emanating from a depreciation of the exchange rate, increased the debt servicing burden for borrowers having unhedged foreign exposures and hence, it led to an increase in NPLs. However, here again, the impact depended on the degree of external openness of the economy under study.9 NPLs’ dynamic can be also influenced by some bank-specific characteristics. These can be divided into four broad categories: (a) Efficiency-related determinants that follow the ‘bad management’ hypothesis by Berger and DeYoung (1997): banks that are efficiently managed have better loan quality.10 (b) Leverage and capital-related determinants that analyse the ‘moral hazard’ hypothesis: low-capitalised banks may tend to take on more risks and have higher NPLs. (c) Diversification-related determinants, suggesting that banks with a more diversified range of activities tend to have better loan quality as described in the ‘diversification’ hypothesis (Louzis et al., 2011).11 (d) Determinants related to the nature of exposures, including the sectoral/ geographical distribution of loans and the collateralised nature of loans: the concentration of loans in a particular sector/geographical region could tend to increase NPLs, while collateral backing to loans could weaken banks’ credit standards, leading to higher NPLs during a credit upturn.12(e) Profitability-related determinants test if more profitable banks have a greater tendency to take on risks, and hence, show higher NPLs.13 Empirical literature on India. Given that the concern relating to NPLs of Indian banks came to the fore after the crisis (and intensified after 2011), studies on India can be grouped into two broad categories: studies covering the period till 2009 and after 2009. Studies in the first category worked out various indicators of operational efficiency and analysed their association with NPLs of banks. Illustratively, Rajaraman and Vasishtha (2001) used profits as a percentage of working funds, while Das and Ghosh (2007) worked out the technical efficiency scores based on data envelopment techniques for their analysis. Swamy (2012), taking data up to 2009, considered the ratio of operating expenses and return on assets as measures of efficiency and profitability, and assessed their impact on NPLs of banks. The major conclusion of these studies was that the more efficiently managed a bank was, the better was its loan quality. Given the fact that India embarked on the policy of financial liberalisation after 1991 with the explicit objective of improving financial soundness and operational efficiency of banks in general, and public banks in particular, there was an evident interest of the studies during this phase in analysing the NPLs of public banks. Other studies analysed the effect of the repayment ability of borrowers on the loan quality of banks with a special focus on public banks (Ranjan and Dhal, 2003, and Misra and Dhal, 2010). These studies observed a favourable impact of lower cost of credit, extended maturity and improved credit culture on NPLs of banks. Studies that analyse NPL behaviour after 2009 focus on the macroeconomic explanation for loan quality deterioration. Using OLS regressions on aggregate data for the period 2001-2012, Lokare (2014) finds statistical evidence for a positive response of NPLs to the credit to GDP ratio lagged up to one year. Samantaraya (2016), however, does not find such evidence with respect to net NPLs, taking credit growth lagged up to six years using bank-level data on 50 banks between 2004 and 2014 by means of a static panel model.14 Novelties of our paper and policy questions. Our paper tries to fill some gaps in the existing literature. First, we analyse how non-performing loans of Indian banks behave through the cycle using a detailed set of macro-economic and bank-specific variables. Second, we use a dynamic panel framework that is a more appropriate empirical methodology to address the endogeneity between credit quality and credit cycles. Third, we test for the presence of a structural break coinciding with the global financial crisis, and fourthly, we focus on the issue of bank ownership, which has received less attention in the literature. In particular, our analysis tries to shed light on some interrelated questions: -
Are NPLs of Indian banks procyclical with respect to credit? In other words, we would like to test if NPLs increase during an upturn of a credit cycle and tend to decrease during a downturn. Is the response of NPLs to credit asymmetric in nature? -
Is the behaviour analysed in (a) different depending on bank ownership? Is risk-taking by public banks more or less procyclical than that of their private counterparts? -
What is the relationship between bank capitalisation and credit risk? Are low-capitalised banks more or less risk-averse? -
What is the impact of bank recapitalisation on NPLs? For example, budgetary support in the form of recapitalisation could reduce risk-taking tendencies among public banks given that (a) it preserves or increases the governmental stake in these banks and (b) it builds a stronger capital base, which may improve the prudence in risk-taking as a natural corollary of the ‘moral hazard’ hypothesis. -
Are well-managed and more profitable banks more prudent in their lending decisions? -
Do banks with more diversified activities exhibit better loan quality? -
Has the global financial crisis marked a structural shift in the NPL behaviour of Indian banks? 3. The Econometric Strategy The empirical specification is designed to test how non-performing loans behave through the cycle. In particular, we estimate the following dynamic panel regression: The NPL ratio is transformed into a logit function ln(NPL/1-NPL). Given the persistence of NPLs, we use a dynamic specification that includes one lagged value of the NPL ratio as an explanatory variable. We use data on gross NPLs (including provisions) as the dependent variable, since this definition captures the overall quality of the loan portfolio (net NPLs reflect the realisation of loan defaults).15 The credit growth variable is lagged up to three years in order to capture the NPL dynamics comprehensively. Contemporaneous credit growth is not factored into the model because there will, of course, be an immediate, but possibly spurious, impact of credit growth on NPLs since credit also figures as the denominator in the NPL ratio in our model. The lags of up to three years have been selected by means of the Akaike criterion.16 Apart from credit growth, the baseline model uses real GDP, the real rate of interest and the share of foreign banks to capture the evolving banking structure in India.17 The definition of the complete set of variables used in the econometric analysis, including their sources, is reported in Table 1. We also carry out a number of robustness checks on the baseline model. First, we test for the asymmetric impact of loan growth on the NPL ratio to see if the impact is higher during expansionary phases than otherwise. To do this, we use the following model where we consider interactions with a boom dummy. 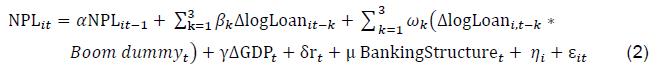 The boom dummy takes the value of 1 if the credit-to-GDP gap is greater than 3 percentage points and 0 otherwise. The use of the gap in the credit-to-GDP ratio (defined as deviations from the stochastic trend in the ratio) and the 3 percentage point threshold deserves some further explanation. The gap has been suggested as a guide by the Basel Committee on Banking Supervision (BCBS) to calculate counter-cyclical capital buffers (CCBs) as part of its Basel III capital framework (BIS, 2010). This guide is recommended as a simple indicator of financial cycles and has been proved to be effective not just in advanced but also emerging economies to capture the build-up of financial vulnerabilities (Drehmann and Tsatsaronis, 2014). While adopting CCBs in the Indian context, the RBI has set the gap at 3 percentage points as the threshold for activation of the buffer by banks. Hence, we define a boom period if the credit-to-GDP gap is of 3 percentage points or more. Secondly, we control for asset concentration in the banking sector. The measure of asset concentration (using the Herfindahl Index) reflects the degree of consolidation, and could affect the prudence shown by banks in taking loan decisions (RBI, 2013a). In particular we use the following specification: Thirdly, we also control for the impact of collateral valuation on NPLs of banks, as shown in equation (4). We take the industrial stock index as a proxy for asset prices of the non-banking sector to control for the same.18 We test for the possible presence of structural breaks in the baseline model on account of the global financial crisis. We define a dummy Crisis that takes the value of 1 for the period 2009 to 2014 and zero otherwise and interact it with all the variables in our model. We have:  Even though the beginning of the global financial crisis is associated with the collapse of Lehman Brothers in September 2008, as our data are for the financial year (April-March), the starting point for the crisis is taken to be 2009. Eichengreen and Gupta (2013) have defined the period of the global financial crisis to be 2008-2010, as they argue that the impact of the crisis had dissipated from 2011 onwards. However, as shown in Section 4, the health of the Indian banking sector, captured through NPLs, was on a slow downtrend since 2009, and has declined very rapidly since 2011. Hence, limiting the period of the crisis only to 2011 will not fully capture the ensuing impact of the crisis on India’s banking sector. Therefore, we define the period of the crisis to be 2009-14. Using the Chow test, we then test for the presence of a structural break in the baseline model. The null hypothesis for the test is as summarised in equations (6). In order to test as well as quantify the extent of procyclicality in NPLs with respect to credit by ownership of banks, we divide our sample of banks into two groups: public and private banks, and test the baseline model (1) on these two bank groups. It is worth mentioning that in the literature on India, it is a common practice to divide the banking sector into three categories – public, domestic private and foreign banks.19 This practice can be attributed partly to the nature of operations of foreign banks in India. Illustratively, all foreign banks in India till now have operated only in branch mode and many among these have a smaller presence in retail banking although in terms of prudential regulatory and bank licensing norms, there is no difference in the treatment given to these banks.20 In our study, however, we group domestic and foreign private banks into one category as (a) the key concern in this paper is to understand the role of public versus private ownership on the loan quality behaviour of banks irrespective of whether a private bank is held domestically or by a foreign entity; (b) we select only those foreign banks which have a greater involvement in retail banking such that they can be considered alongside their domestic counterparts; this point is illustrated later in this section when we discuss the criteria applied for choosing the sample of banks for our analysis. After analysing procyclicality by ownership of banks, we augment the baseline model using various bank-specific controls to test the other hypotheses. We draw on the existing literature in determining the micro-foundations of these controls. We control for (a) bank capitalisation through the leverage ratio (ratio of capital plus reserves to total assets); (b) operational efficiency through operating costs to total income ratio and past profitability through lagged values of net interest margin (NIM); (c) diversification of a bank, captured through the ratio of non-interest income to total assets and its market share; (d) funding structure of a bank, particularly with regard to its reliance on non-core liabilities, captured through the ratio of inter-bank borrowing (excluding borrowings from the RBI) to total assets;21 (e) intermediation mismatch, captured through credit to deposit ratio of a bank; (f) geographical expansion in the business of a bank, controlled via the growth in its branches;22 (g) nature of loan exposures, captured through the ratio of secured loans to total loans and of ‘priority’ sector loans to total loans. Priority sectors are sectors of national (socio-economic) priority that require credit. Both public and private (domestic private and foreign) banks are directed to give a certain percentage of their credit to these sectors.23 The augmented model is given by the following equation using controls for capitalisation, efficiency, size and diversification: We further augment the model given in (7) using other bank-specific controls relating to geographical and sectoral exposures as follows: As final robustness checks on the augmented model in (8), we also control for the recapitalisation of public banks by inserting a dummy variable that takes the value of 1 on the year of announcement of the recapitalisation support to a given bank, and 0 otherwise. Last, we control for the key change in the definition of NPLs again through a step dummy for the year 2004, when the period for classification of a loan asset as an NPL was reduced from 180 days to 90 days.24 3.1 Empirical methodology Regressions have been carried out using a Dynamic Panel Data (DPD) model based on Generalised Method of Moments (GMM).25 This model is suitable for the analysis in this paper given: (i) the short but wide panel (involving a large cross-section and a relatively short time dimension); (ii) the inclusion of the lagged dependent variable; (iii) the presence of endogenous regressors that may be correlated with the past/current realisations of the error term, (iv) fixed individual effects, and (v) the presence of heteroskedasticity and autocorrelation within but not across cross sections.26 The dynamic panel model is applied in its two-step variant. While the two-step estimators are asymptotically more efficient than one-step estimators, they may give a downward bias to the coefficient standard errors (Arellano and Bond, 1991).27 Hence, the standard errors of coefficients reported in the paper are finite-sample corrected standard errors following Windmeijer (2005). All the variables are tested for stationarity using the panel unit root tests.28 Furthermore, bank-specific variables are winsorised up to 1 per cent on both ends to take care of outliers. The correlation for each pair of variables is worked out to minimise the possibility of multi-collinearity in our model.29 The paper uses dynamic panel specification tests, namely, Sargan and serial auto-correlation tests to test for the robustness of the models. 3.2 Data sources We use data drawn from the annual accounts of (scheduled) commercial banks in India published by the RBI in Statistical Tables Relating to Banks in India along with other official sources of data of the RBI and Government of India.30 The panel includes both public (28) and private banks (44, including 14 foreign banks operating in India on the lines discussed earlier in this section). The period of analysis is from 2000 to 2014. We included banks with at least five consecutive years of operation during the period of analysis, thus rendering the panel unbalanced. For foreign banks, an additional criterion of branch presence was applied, thus ensuring the inclusion of the most important players from the foreign banking sector.31 The descriptive statistics for all variables are summarised in Table 2. 4. Some Stylised Facts on Loan Quality of Indian Banks The period of the Great Moderation, particularly the 2000s, witnessed a declining proportion of bad assets on the balance sheets of banks across most economies (see Annex A). The global financial crisis, however, provided a setback to this trend. The NPL ratio showed a significant increase across a majority of the advanced and some emerging economies following the crisis. India too witnessed an increase in its NPL ratio during this period, contrasting sharply with a remarkably consistent trend of improvement in loan quality in the earlier period (see left panel of Chart 1). There was little direct exposure of Indian banks to crisis-ridden institutions or assets. However, the impact of the global financial crisis on the Indian economy came through the real (primarily trade), financial (with pressures in the money and equity markets) and ‘confidence’ channels, and thereby had an indirect impact on the Indian banking sector (Subbarao, 2009). More importantly, unlike most advanced and emerging economies, which have managed to bring the problem of NPLs under control over time, this problem has continued to plague the Indian banking sector in recent years.32  Loan quality and credit growth. When the NPL ratio of Indian banks is juxtaposed with bank credit growth graphically, a lagged positive association is broadly discernible. The period till September 2008, which witnessed a decline in the NPL ratio, was a period when bank credit growth had remained at elevated levels in the range of over 20 per cent per annum (see right panel of Chart 1). After September 2008, the NPL ratio posted an – at first a marginal and then a striking – increase. During this phase, credit growth showed a by and large secular decline reaching a single-digit figure by September 2015. Loan quality by ownership categories. Given that public banks account for the largest share in total bank credit in India (73 per cent in 2015), their influence on the aggregate trends in NPLs cannot be missed. Public banks were the major drivers of the increase in the system-wide NPL ratio after September 2008. However, that is not to say that the loan quality of private banks has been consistently better. Private banks (comprising domestic private banks accounting for a share of about 20 per cent in total bank credit and foreign banks accounting for about 7 per cent in 2015) witnessed a distinct spurt in their NPL ratio immediately following the crisis (see left-hand panel in Chart 2). This spurt was largely on account of foreign banks owing to their specific direct exposures, although the loan quality of some of the domestic private banks too came under pressure during this period (see middle panel in Chart 2). The spurt in the NPL ratio of private banks ebbed somewhat after December 2009. After March 2011, however, it posted a slow but definite increase. This increase again was on account of both domestic private and foreign banks. Loan quality by sectors. Another stylised fact about the NPL dynamics after 2008 was a more rapid deterioration in the loan quality in sectors other than the ‘priority’ sectors. It is often argued in the literature that directed credit is a source of stress for the banking sector and hence, priority sectors are responsible for the creation of NPLs for banks in India (Swamy, 2012). While it is true that priority sectors have generally had a higher NPL ratio than other sectors, the increase in the NPL ratio after 2008 was on account of both priority and other sectors, with the latter evidently rising faster than the former. This could be gauged from the narrowing gap between the NPL ratio of priority and other sectors during this period such that by September 2015, the NPL ratio in other sectors was very close to that in priority sectors (see right-hand panel in Chart 2). Moreover, in recent years, there has been a perceptible increase in the share of other sectors in total NPLs. Within other sectors, the main drivers of NPLs were infrastructure and core industries (including mainly iron and steel, mining and quarrying, and textiles). These two industry categories accounted for about one-fourth of the total NPLs of Indian banks in March 2015. To sum up the stylised facts about NPLs discussed in this section: (a) loan quality emerged as a concern for the Indian banking sector following the global financial crisis and became particularly severe after 2011; (b) among other factors, this decline needed to be seen against the backdrop of a high loan growth before the crisis; (c) the decline in loan quality was mainly on account of public banks, but private banks, more so foreign banks, also contributed to it; (d) the decline in loan quality could be seen across both priority and other sectors but it was sharper in the case of other sectors (particularly infrastructure and core industries). 5. Results Results for the baseline model (1) are reported in Table 3. The S-GMM estimator ensures consistent parameter estimates provided that the differenced error term is not subject to serial correlation of order two (AR(2) test) and that the instruments used are valid (Sargan test). Neither test (as reported at the bottom of each table) should reject the null hypotheses (p-values should be above 0.10).33 The positive and significant coefficient on the lagged dependent variable suggests a persistence in the NPL ratio. This is expected since a loan that once gets written as an NPL in the books of banks may not be generally recovered or written off within a year’s time. Bank credit growth, the key variable of interest from the point of view of the subject of this paper, had a lagged positive impact on NPLs of banks. We present in the paper the sum of the three lags of credit growth and associated standard error. The long-run effect of NPLs with respect to combined credit growth is 0.043=0.028/(1-0.365) implying that on average a one-percentage point growth in credit in the preceding three years led to an increase in NPL ratio by 4.3 per cent.34 The results in Table 3 also show, ceteris paribus, a significant impact of the real interest rate and of changes in economic activity on NPL ratios: The short-term impact of the real rate of interest on the NPL ratio is 0.246, while the long-run effect is 0.39=0.246/(1-0.365). This implies that an increase in the real rate of interest by 100 basis points leads to an increase in the NPL ratio by about 39 per cent. The long-run effect of GDP growth on NPL is -0.13=-0.081/(1-0.365); indicating that a one-percentage point increase in GDP brings about a decline in the NPL ratio by about 13 per cent.35 A ballpark comparison of our results with those of Jimenez and Saurina (2006), who followed a similar methodology for the Spanish banking system in 1995-2002, is reported in Table 5. For the sake of comparison, here we have computed the direct elasticities (instead of the long-run effects) of NPLs with respect to the variables of interest. These elasticities are obtained from the coefficients reported in Table 3, but the impact is calculated considering the average levels of the corresponding variables. It is interesting to note that the elasticity of the NPL ratio with respect to credit growth and the real rate of interest is much higher for Indian banks as compared to Spanish banks. Column (II) of Table 3 checks the robustness of the results for a different definition of credit growth: the difference between bank-specific credit growth and average growth for all Indian banks taken together in a given year. Results remain very similar. Structural breaks. We tested for the possible presence of structural breaks using equation (5). The results for the Chow test (see equation (6)) are reported at the bottom of Table 3. Despite the fact that there was a significant rise in the NPL ratio following the crisis, we do not find the presence of a structural break in the coefficients of the model. It is worth noting that we used a crisis dummy that takes the value of 1 in the period 2009 to 2014. However, even when the crisis period was taken to be from 2009 to 2011, broadly following the definition of Eichengreen and Gupta (2013), we still did not find evidence of a structural break in our model. Asymmetric response, banking concentration and collateral. Table 4 examines how NPLs react to a deviation of credit to its stochastic trend and whether the response differs during expansionary phases, and also controls for banking sector concentration and collateral. In the first column of the table, we test for the asymmetric impact of loan growth on the NPL ratio of banks following the specification in equation (2). We observe that the impact of credit growth on the NPL ratio is indeed asymmetric; it is higher during expansionary phases than otherwise. The long-run effect of credit growth on the NPL ratio during an expansionary phase is 0.066=(0.022+0.019)/(1-0.378). This implies that an increase in credit growth of one-percentage point leads to an increase in the NPL ratio by about 6.6 per cent during such phases. In comparison, the long-run effect during normal times is 0.035=0.022/(1-0.378), suggesting an increase in the NPL ratio by about 3.5 per cent only. Accordingly, this implies a differential elasticity between the asymmetric and symmetric models; while the elasticity under the symmetric model in Table 5 is 0.26, it becomes 0.40 in expansionary phases and 0.21 otherwise, under the asymmetric model. In the second column of Table 4, we observe that banking sector concentration has a positive impact on the NPL ratio, indicating that competitive pressures possibly lead to a more careful selection and monitoring of borrowers by banks. The impact, however, is not statistically significant. The third column of Table 4 reports the results for equation (4). An increase in collateral value has a negative impact on the NPL ratio, in line with the idea that a higher valuation of underlying collateral improves the ability of borrowers to service loans. However, collateral valuation did not show a significant impact on the NPL ratio given the fact that, as discussed in Section 2, the Indian financial system is still bank-dominated and not market-dominated as in many advanced economies. Public vs private banks. Table 6 reports the results obtained dividing the sample between public and private banks. First, we found that the NPL ratios of both public and private banks show a lagged procyclical response to credit growth. However, the reaction of the NPL ratio with respect to credit growth is stronger in the case of private banks: For example, a one-percentage point rise in credit growth determines a long-run increase of the NPL ratio of 0.8 per cent for public banks and of 4.5 per cent for private banks. Secondly, the impact of GDP growth on the NPL ratio is slightly greater for private banks than public banks. Third, the NPL ratio of private banks is significantly more responsive to changes in interest rates than those of public banks. Such different risk-taking behaviour could reflect, at least in part, the different nature of credit portfolios of the two bank groups: private banks have a larger proportion of retail loans (housing, consumer durables and credit card receivables), which are more interest rate-sensitive.36 Bank-specific characteristics. Table 7 shows the results obtained by augmenting the model with additional bank-specific characteristics. The first column reports the results for model (7) and provides useful insights on the hypothesis discussed in the literature review in Section 2. Bank capitalisation (leverage) impacts negatively on NPL ratios supporting the ‘moral hazard’ hypothesis: The more capitalised a bank, the more prudent it is in terms of taking credit risks (this is in line with the results in Samantaraya, 2016). We also find evidence for the ‘bad management’ hypothesis as there is a positive correlation between the cost-to-income ratio and the NPL ratio. In other words, banks that were managed more efficiently tend to have better loan quality. The negative impact of lagged values of net interest margin on the NPL ratio too underline the fact that profitable banks (possibly better managed) tend to have better loan quality. We do not find evidence, however, for the ‘diversification’ hypothesis discussed in the literature. A higher market share in the banking system and a higher portion of non-interest income in total income of a bank have both a positive impact on its NPL ratio. In other words, as a bank expands its asset size and also diversifies into non-traditional intermediation activities (read fee-based off-balance sheet activities), it tends to take on more credit risks. Generally, the literature argues that banks enjoying a larger market share tend to adopt better risk-management practices and hence end up taking fewer risks (Jimenez and Saurina, 2006). However, in the Indian context, this may not be the case because banks that are large in size are primarily from the public sector. Again owing to sovereign support, these banks may end up extending risky loans, and hence, the positive correlation of market share with the NPL ratio in the Indian context. In line with Misra and Dhal (2010), an increase in the credit to deposit ratio (a measure often used as a proxy for demand pressures) leads to a higher NPL ratio. Also, a higher level of market borrowing (less stable than deposit funding) is positively associated with a deterioration of credit quality, but the effect is statistically not significant.37 Recapitalisations and change in NPL definition. The result in column II of Table 7 indicates that public recapitalisation is associated with a deterioration of loan quality. This suggests a possible tendency of banks to unearth NPLs following recapitalisation, again underlining a moral hazard on the part of banks. This observation is in line with the literature on recapitalisation and rescue packages for banks, which suggests that banks tend to use additional capital generally to clean up their positions and as a result, there is a tendency for NPLs to rise following recapitalisation.38 In the last column of Table 7, the introduction of a further control for the change in the NPL definition in 2004 yielded a negligible and not significant impact on the NPL ratios of banks. 6. Conclusions This paper analyses how non-performing loans of Indian banks behave through the cycle. The main conclusions are the following. First, banks tend to take on more risks during an upturn in credit growth and be more cautious whenever there is a downturn. We find that a one-percentage point increase (decrease) in loan growth is associated with an increase (decrease) of NPLs over total advances (NPL ratio) by 4.3 per cent in the long run. We also find that the response of NPLs to credit growth is asymmetric but we do not find any evidence of a structural break in the model following the global financial crisis. Secondly, well-capitalised banks tend to take on less credit risk. This result is in line with the ‘moral hazard’ hypothesis and with the portfolio approach (Flannery, 1989; Gennotte and Pyle, 1991) where well-capitalised banks are more risk-averse due to the relation between deposit insurance schemes and the risk-taking attitude of banks. The results that well-capitalised banks are more risk-averse can also be supported by interpreting capital as a cushion against contingencies (Dewatripont and Tirole, 1994; Repullo, 2004). Thirdly, notwithstanding the differences in management and governance structures, both public and private banks show a significant procyclical risk-taking response to credit growth. This finding, contrary to the general perception that loans supplied by public banks are scarcely reactive to the cycle, could be due to the fact that during credit upturns Indian public banks have funded some credit-constrained sectors, such as infrastructure, that are not entirely risk-free (Chandrasekhar, 2013; Ghosh, 2014). However, the degree of procyclicality in NPLs is larger for private banks than for public banks (4.5 per cent and 0.8 per cent, respectively). Fourthly, NPL ratios are sensitive to the interest rate environment and the overall growth of the economy. NPLs of private banks are more reactive than NPLs of public banks to changes in interest rates, because of the greater credit exposure to retail loans (housing, consumer durables and credit card receivables) that are more reactive to monetary policy changes. | Table 1: Description and Data Sources for Variables Used in the Analysis | | Nomenclature used in the empirical exercise | Description of variable | Data source | | ln(NPL/1-NPL) | Gross NPL ratio | Based on data taken from Statistical Tables relating to Banks in India | | ΔGDPt | Rate of growth in real Gross Domestic Product at market prices | Handbook of Statistics on Indian Economy | | rt | Mid-point average of the lending rate range of top five banks adjusted for Wholesale Price Index inflation | Based on data taken from Handbook of Statistics on Indian Economy | | Δlogloanit | Log(creditgrowthit) –
Log(creditgrowthit-1) | Based on data taken from Statistical Tables relating to Banks in India | | BankingStructuret | Log(Share of foreign banks in total assets of the banking sector) | Based on data taken from Statistical Tables relating to Banks in India | | ShareinAssetsit | Assetsit/total assets of the banking sector | ----“----- | | Leverageit | Capital (plus reserves)it /balance sheet assetsit | ----“----- | | BorrowingtoAssetsRatioit | Borrowings by banks from sources other than RBIit /balance sheet assetsit | ----“----- | | CreditDepositRatioit | Creditit/Depositsit | ----“----- | | BranchGrowthit | Log(number of branchesit) – Log (number of branchesit-1) | ----“----- | | CosttoIncomeRatioit | Operating expensesit/total incomeit | ----“----- | | NonInterestIncomeRatioit | Non interest incomeit/balance sheet assetsit | | | NIMit | Net interest incomeit/average total assetsit | ----“----- | | SecuredLoansShareit | Loans secured by tangible assetsit /total loan portfolioit | | | PriorityLoansShareit | Loans given to priority sectorsit/total loan portfolioit | ----“----- | | Concentration indext | Normalised Herfindahl index based on banking sector assets = (H – 1/N))/(1-1/N), where N = total number of banks; H = usual Herfindahl Index | ----“----- | | CreditGrowthi*BoomDummyt | Individual bank credit growth interacted with dummy based on deviations from systemic credit to GDP ratio | ----“----- | | Stock price indext | Log(BSE Industrial index) | Database of Securities and Exchange Board of India |
| Table 2: Descriptive Statistics of Variables | | Variable | Mean | Std. Deviation | Min | Max | | NPLit | 0.061 | 0.064 | 0.00001 | 0.640 | | ΔGDPt | 0.069 | 0.023 | 0.038 | 0.102 | | rt | 0.010 | 0.006 | -0.0007 | 0.019 | | ΔlogLoanit | 0.195 | 0.339 | -4.511 | 4.394 | | BankingStructuret | 0.072 | 0.005 | 0.065 | 0.084 | | ShareinAssetsit | 0.015 | 0.026 | 0.00005 | 0.243 | | Leverageit | 0.098 | 0.225 | 0.0009 | 6.569 | | CreditDepositRatioit | 0.697 | 0.393 | 0 | 5.323 | | CosttoIncomeRatioit | 0.229 | 0.080 | 0.086 | 0.545 | | NonInterestIncomeRatioit | 0.017 | 0.014 | 0.003 | 0.108 | | BorrowingtoAssetsRatioit | 0.074 | 0.105 | 0 | 0.483 | | NIMit | 0.028 | 0.008 | 0.008 | 0.052 | | BranchGrowthit | 0.075 | 0.194 | -2.294 | 2.382 | | SecuredLoansShareit | 0.815 | 0.158 | 0.0238 | 1.000 | | PriorityLoansShareit | 0.316 | 0.097 | 0.026 | 0.625 | | Concentration indext | 0.051 | 0.010 | 0.039 | 0.071 | | StockPriceIndext | 7.260 | 0.520 | 6.489 | 8.127 | | PublicBankNPLit | 0.057 | 0.051 | 0.006 | 0.328 | | PublicBankCreditGrowthit | 0.194 | 0.120 | -0.188 | 1.720 | | PrivateBankNPLit | 0.062 | 0.059 | 0.00001 | 0.327 | | PrivateBankCreditGrowthit | 0.199 | 0.213 | -1.100 | 1.829 | CreditGrowthi*
BoomDummyt | 0.048 | 0.197 | -1.100 | 3.791 |
References Adrian, T. and H. S. Shin (2010), “The Changing Nature of Financial Intermediation and the Financial Crisis of 2007-09”, Staff Report No. 439, March. Arellano, M., and S. Bond (1991), “Some Tests of Specification for Panel Data: Monte Carlo Evidence and An Application to Employment Equations”, Review of Economic Studies 58, pp. 277-97. Bank for International Settlements (2010), “Countercyclical Capital Buffer Proposal – Consultative Document”, July. Beck, R., P. Jakubik and A. Piloiu (2013), “Non-Performing Loans: What Matters in addition to the Economic Cycle”, ECB Working Paper Series, No. 1515. Berger, A. and G. F. Udell (2003), “The Institutional Memory Hypothesis and the Procyclicality of Bank Lending Behaviour”, BIS Working Paper, 125. Berger, A.N., R. DeYoung (1997), “Problem Loans and Cost Efficiency in Commercial Banks”, FEDS Working Paper, www.federalreserve.gov. Berge, T.O., K. G. Boye (2007), An Analysis of Bank’s Problem Loans, Norges Bank Economic Bulletin, 78. Borio, C., C. Furfine, and P. Lowe (2001), “Procyclicality of the Financial System and Financial Stability: Issues and Policy Options”, BIS Paper No. 1, March. Brei, M. and L. Gambacorta (2012), “Rescue Packages and Bank Lending”, Journal of Banking and Finance, 37(2), pp.490-505. Caporale, G., S. D. Colli and J. S. Lopez (2013), “Bank Lending Procyclicality and Credit Quality during Financial Crisis”, Economics and Finance Working Paper Series, No. 13-18, June. Chandrasekhar, C. P. (2013), “Development Finance in India”, Report at <www.in.boell.org>. Das, A., and S. Ghosh (2007), “Determinants of Credit Risk in Indian State-owned Banks: An Empirical Investigation”, MPRA Paper No. 17301. De Bock, R., and A. Demyanets (2012), “Bank Asset Quality in Emerging Markets: Determinants and Spillovers”, IMF Working Paper No.71. Dewatripont, M., J. Tirole (1994), The Prudential Regulation of Banks, Cambridge, Massachusetts, MIT Press. Drehmann, M. and K. Tsatsaronis (2014), “The Credit-to-GDP Gap and Countercyclical Capital Buffers”, BIS Quarterly Review, March. Eichengreen, B., and P. Gupta (2013), “The Financial Crisis and Indian Banks: Survival of the Fittest?” Journal of International Money and Finance, 39. Festic, M., A. Kavkler and S. Repina (2011), “The Macroeconomic Sources of Systemic Risk in the Banking Sectors of Five New EU Member States”, Journal of Banking and Finance, 35 (2). Financial Stability Forum (FSF) (2009), Report of the Financial Stability Forum on Addressing Pro-cyclicality in the Financial System, Basel. Flannery, M.J. (1989), “Capital Regulation and Insured Banks’ Choice of Individual Loan Default Risks”, Journal of Monetary Economics, 24, pp. 235-258. Gennotte, G. and D. Pyle (1991), “Capital Controls and Bank Risk”, Journal of Banking and Finance 15, pp. 805-824. Ghosh, Jayati (2014), “Public Banks and the Burden of Private Infrastructure Investment”, at <www.macroscan.com>. Guttentag, J. M., and R. J. Herring (1986), “Disaster Myopia in International Banking”, Essays in International Finance, 164, International Finance section, Princeton University. Hahm, J., H. S. Shin and K. Shin (2011), “Non-Core Bank Liabilities and Financial Vulnerability”, Paper presented at the Federal Reserve Board and JMCB conference on “Regulation of Systemic Risk”, Washington, DC, September 15-16. Jain, T. R., S. C. Aggarwal and R. K. Rana (2011), Basic Statistics for Economists, V. K. India Enterprises, New Delhi. Jimenez, G., and J. Saurina (2006), “Credit Cycles, Credit Risk and Prudential Regulations”, International Journal of Central Banking, June. Kashyap, M. and S. Kumar (2013), “Foreign Banks in India: At an inflection”, <www.pwc.in>. Keeton, W. R. (1999), “Does Faster Loan Growth Lead to Higher Loan Losses?” Federal Reserve Bank of Kansas City Economic Review, Second Quarter 1999, pp. 57-75. Khemraj, T. and S. Pasha (2009), “The determinants of non-performing loans: an econometric case study of Guyana”, Paper at www.sta.uwi.edu. Kiyotaki, N. and J. Moore (1997), “Credit Cycles”, Journal of Political Economy, 105 (2), pp. 211-248. Lokare, S. M. (2014), “Re-emerging Stress in Asset Quality of Indian Banks: Macro-Financial Linkages”, RBI Working Paper No. 3. Louzis, D. P., A. T. Vouldis and V. Metaxas (2011), “Macroeconomic and bank-specific determinants of non-performing loans in Greece: A comparative study of mortgage, business and consumer loan portfolios”, Journal of Banking and Finance, 30, pp. 1-16. Messai, A. S. and F. Jouini (2013), “Micro and Macro Determinants of Non-performing Loans”, International Journal of Economics and Financial Issues, 3 (4), pp.852-860. Minsky, H. (1982), “Can ‘It’ happen again? – Essays on Instability and Finance”, M.E. Sharpe. Misra, B. M. and S. C. Dhal (2010), “Pro-cyclical Management of Banks’ Non-Performing Loans by the Indian Public Sector Banks”, Paper at www.bis.org/repofficepubl/arpresearch201003.08.pdf. Nkusu, M. (2011), “Nonperforming Loans and Macro-financial Vulnerabilities in Advanced Economies”, IMF Working Paper No. 11/161. Rajan. R. G. (1994), “Why Bank Credit Policies Fluctuate: A Theory and Some Evidence”, The Quarterly Journal of Economics, 109 (2), May, pp. 399-441. Rajaraman, I., and G. Vasishtha (2001), “Non-Performing Loans of PSU Banks – Some Panel Results”, Economic and Political Weekly, 37 (5), February. Ranjan, R., and S. C. Dhal (2003), “Non-Performing Loans and Terms of Credit of Public Sector Banks in India – An Empirical Assessment”, RBI Occasional Papers, 24 (3). Ramakumar, R. and P. Chavan (2011), “Changes in the Number of Rural Bank Branches in India - 1991 to 2008”, Review of Agrarian Studies, 1(1). Repullo, R. (2004), “Capital requirements, market power, and risk-taking in banking”, Journal of Financial Intermediation, 13, pp.156-182. Reserve Bank of India (2010), Report on Trend and Progress of Banking in India – 2009-10, <www.rbi.org.in>. Reserve Bank of India (2013a), “Banking Structure – The Way Forward”, Mumbai. Reserve Bank of India (2013b), “Presence of Foreign Banks in India”, Discussion Paper, <www.rbi.org.in>. Reserve Bank of India (2014), “Statistical Tables relating to Banks in India – 2013-14”, Mumbai. Reserve Bank of India (2015), Financial Stability Report – June 2015, Mumbai. Roodman, D. (2006), “How to Do xtabond2: An Introduction to “Difference” and “System” GMM in Stata”, Centre for Global Development, Working Paper 103. Salas, V. and J. Saurina (2002), “Credit Risk in Two Institutional Regimes: Spanish Commercial and Savings Banks”, Journal of Financial Services Research, 22(3), December. Samantaraya, A. (2016), “Procyclical Credit Growth and Bank NPAs”, Economic and Political Weekly, Vol. LI (12), March 9. Saunders, A., E. Strock and N. G. Travlos (1990), “Ownership Structure, Deregulation, and Bank Risk Taking”, Journal of Finance, 45 (2), pp. 643-654. Segoviano, M., Goodhart, C., Hofmann, B. (2006), “Default, Credit Growth, and Asset Prices”, IMF Working Paper No. 223. Skarica, B. (2013), “Determinants of Non-Performing Loans in Central and Eastern European Countries”, FEB Working Paper No. 7. Subbarao, D. (2009), “Impact of the Global Financial Crisis on India Collateral Damage and Response”, Speech delivered at the Symposium on ';The Global Economic Crisis and Challenges for the Asian Economy in a Changing World';, Tokyo, February 18, www.rbi.org.in. Swamy, V. (2012), “Impact of Macroeconomic and Endogenous Factors on Non-Performing Bank Assets”, International Journal of Banking and Finance, 9(1), pp. 27-47. Tanaskovic, S., and M. Jandric (2015), “Macroeconomic and Institutional Determinants of Non-Performing Loans”, Journal of Central Banking Theory and Practice, 1, pp. 47-62. Williamson, O. (1963), “Managerial Discretion and Business Behaviour”, American Economic Review, 53, December. Windmeijer, F. (2005), “A Finite Sample Correction for the Variance of Linear Efficient Two-Step GMM Estimators, Journal of Econometrics, 126, pp. 25–51.
| Annex A: Ratio of NPLs to Gross Loans - An International Comparison | | Country | 2000 | 2005 | 2006 | 2007 | 2008 | 2009 | 2010 | 2011 | 2012 | 2013 | 2014 | 2015 | | Advanced Economies | | Australia | 0.5 | 0.6 | 0.6 | 0.6 | 1.3 | 2.0 | 2.1 | 2.0 | 1.8 | 1.5 | 1.1 | 1.0 | | Belgium | 2.8 | 2.0 | 1.3 | 1.2 | 1.7 | 3.1 | 2.8 | 3.3 | 3.8 | 4.3 | 4.1 | 4.0 | | Canada | 1.3 | 0.5 | 0.4 | 0.4 | 0.8 | 1.3 | 1.2 | 0.8 | 0.7 | 0.6 | 0.5 | 0.5 | | France | 5.0 | 3.5 | 3.0 | 2.7 | 2.9 | 4.0 | 3.8 | 4.3 | 4.3 | 4.5 | 4.2 | - | | Germany | 4.7 | 4.1 | 3.4 | 2.7 | 2.9 | 3.3 | 3.2 | 3.0 | 2.9 | 2.7 | 2.3 | - | | Greece | 12.3 | 6.3 | 5.4 | 4.6 | 5.1 | 7.0 | 9.1 | 14.4 | 23.3 | 31.9 | 34.3 | 34.4 | | Italy | 7.8 | 7.0 | 6.6 | 5.8 | 6.3 | 9.4 | 10.0 | 11.7 | 13.7 | 16.5 | 17.3 | - | | Japan | 5.3 | 1.8 | 1.8 | 1.5 | 1.4 | 2.4 | 2.5 | 2.4 | 2.4 | 2.3 | 1.9 | 1.6 | | Spain | 1.2 | 0.8 | 0.7 | 0.9 | 2.8 | 4.1 | 4.7 | 6.0 | 7.5 | 9.4 | 8.5 | 7.0 | | United Kingdom | 2.5 | 1.0 | 0.9 | 0.9 | 1.6 | 3.5 | 4.0 | 4.0 | 3.6 | 3.1 | 1.8 | - | | United States | 1.1 | 0.7 | 0.8 | 1.4 | 3.0 | 5.0 | 4.4 | 3.8 | 3.3 | 2.5 | 2.0 | 1.7 | | Emerging Economies | | Argentina | 16.0 | 5.2 | 4.5 | 3.2 | 2.7 | 3.5 | 2.1 | 1.4 | 1.7 | 1.7 | 2.0 | 1.9 | | Brazil | 8.3 | 3.5 | 3.5 | 3.0 | 3.1 | 4.2 | 3.1 | 3.5 | 3.4 | 2.9 | 2.9 | 3.1 | | Chile | 1.7 | 0.9 | 0.7 | 0.8 | 1.0 | 2.9 | 2.7 | 2.3 | 2.2 | 2.1 | 2.1 | 2.0 | | China | 22.4 | 8.6 | 7.1 | 6.2 | 2.4 | 1.6 | 1.1 | 1.0 | 1.0 | 1.0 | 1.2 | - | | India | 12.8 | 5.2 | 3.5 | 2.7 | 2.4 | 2.2 | 2.4 | 2.7 | 3.4 | 4.0 | 4.3 | 4.3 | | Malaysia | 15.4 | 9.4 | 8.5 | 6.5 | 4.8 | 3.6 | 3.4 | 2.7 | 2.0 | 1.8 | 1.6 | 1.6 | | Russian Federation | 7.7 | 2.6 | 2.4 | 2.5 | 3.8 | 9.5 | 8.2 | 6.6 | 6.0 | 6.0 | 6.7 | 7.4 | | South Africa | 4.3 | 1.8 | 1.1 | 1.4 | 3.9 | 5.9 | 5.8 | 4.7 | 4.0 | 3.6 | 3.3 | 3.2 | | Thailand | 17.7 | 9.1 | 8.1 | 7.9 | 5.7 | 5.2 | 3.9 | 2.9 | 2.4 | 2.3 | 2.5 | 2.5 | Source: World Bank database at <data.worldbank.org>.
Note: Data for India are as reported in the World Bank database to maintain comparability with other countries and hence may not exactly match with those reported elsewhere in the paper taken from the supervisory returns of the RBI. | |