Press Release RBI Working Paper Series No. 10
Modelling Corporate Sector Distress in India
@Manjusha Senapati and Saptarshi Ghosal Abstract 1The paper attempts to formulate a model to predict corporate financial distress of non-government non-financial public limited companies and estimate distressed bank debt due to the sample companies for the period 2006-07 to 2013-14. The model estimates probability of a company being financially distressed in the following year using the multivariate logistic regression based on three financial ratios viz., long term liabilities to total assets, operating profits to total liabilities, and current assets to current liabilities. The model was tested for some stressed industries/companies and was found to capture the underlying distress. Distressed bank debt for the sample companies was found to be increasing since 2011-12. Key Words: Corporate Financial Distress, Logit Analysis, Accounting Data, India JEL Classification: G33 Introduction Prediction of corporate financial distress or corporate failure is a central issue in any economy. Generally, prediction of corporate distress through mathematical or statistical models predicts whether a company will undergo financial distress based on the current financial data (Sun et al. 2014). Since the pioneering work in the area of failure classification done by Beaver (1966) and Altman (1968), many studies have been carried out to either to improve upon or to replicate. In the Indian context, such analysis is still evolving and is largely based on market variables. Moreover, in the absence of information on distressed companies, academic studies have used ratings data available from secondary sources to define distressed companies2. The motivation to undertake the study was mainly provided by the numerous reports on increasing indebtedness of Indian companies (and business groups at the aggregate level) pointing towards increasing corporate leverage. The Financial Stability Report (RBI, 2014) also cited high and increasing leverage and low profitability of Indian corporate sector as a high risk area. Therefore, the objective of the study is to develop a model that is able to estimate the probability of a company of being financially distressed in the next year. Such model can quickly evaluate and can be used by the risk managers corporate risk profile and can be used by the risk managers. Banks can use such model to know about the financial health of companies and their credit worthiness. Another distinguishing feature of the current study is that it attempts to apply data driven definition of distress for the identification of such companies. Earlier studies have mostly used available ratings data based on the market variables. This study uses the panel regression methodology to estimate the distress probabilities of the corporate which has been applied very rarely in the empirical literature in the Indian context. Against this backdrop, Section II presents a brief literature review of the various studies done so far. In section III, the extent of exposure of banks’ credit to non-financial corporate sector is discussed, while section IV highlights the recognition of distress in India. In Section V, the definition of corporate distress considered in this paper is discussed. Section VI gives an overview about the data, variables and methodology considered in the estimation of logistic model. Empirical findings of the paper are discussed in Section VII followed by conclusions in Section VIII. II. Review of Literature Beaver (1966) studied the corporate distress initially and provided the prediction models based on ratios. Beaver proposed two types of single variable analysis viz., profile analysis and univariate discriminant model. Through profile analysis for five years before failure, he found that the means of financial ratios in two groups were significantly different, and the gap was noticeable nearer to the failure. He built univariate discriminant models with the five ratios viz. cash flow to total debt, net income to total assets, total debt to total assets, working capital to total assets, and current ratio and found that the cash flow to total debt has the ability to correctly classify both failed and non-failed companies, even five years before failure. However, the ratio analysis has some limitations, e.g. all the ratios do not have the same discriminatory power. Moreover, ratios do not predict the failed and non-failed companies with same degree of success. Altman (1968) calculated bankruptcy probabilities using ratio analysis for the data on US manufacturing companies. The idea behind use of ratio analysis was that the failing company will exhibit very different ratio measurements than their counterparts. The ratios measuring profitability, liquidity and solvency were found to be most significant indicators. Using Multiple Discriminant Analysis (MDA), he converted the linear combinations of independent variables in scores (called Z scores) so that they could be classified into one of the two groups of bankrupt and non-bankrupt company. Z-scores were constructed from six basic accounting values (working capital, total assets, retained earnings, earnings before interest and taxes, book value of total liabilities, and sales) and one market based variable (market value of equity). The Z-score was found to accurately determine the bankruptcy in most of the cases. He found that the bankruptcy could be predicted up to two years prior to actual failure. MDA was widely used for distress prediction during 1970s and 1980s (Sharma and Mahajan (1980), Altman and Lavallee (1981); Ko (1982); and Izan (1984)). However, MDA assumes that independent variables should follow multivariate normal distribution and equal covariance matrix. Several other studies which pointed out these limitations include Eisenbeis (1977); Nam and Jinn (2000); Fathi and Jean (2001); Ugurlu and Aksoy (2006); and Wang and Deng (2006). Karels and Prakash (1987) found that MDA would only be optimal if the normality conditions are met. Their study included search for financial ratios which were jointly multivariate normal. To provide higher prediction accuracy, several studies adopted logistic regression models. Ohlson (1980) used the data set for the period from 1970-76 and applied logistic regression analysis to develop the O-score model. Bernhardsen (2001) used the SEBRA database of Norges Central Bank to construct a model of bankruptcy prediction conditional on financial statements. The model is now used by the Norwegian Central Bank to predict bankruptcies. Among other studies which applied logistic regression include those by Zmijewski (1984); Nam and Jinn (2000); Laitinen and Laitinen (2000); Barniv et al. (2002); Charitow et al. (2004); Mohammad et al. (2005); Ugurlu and Aksoy (2006); Wang and Deng (2006); Chen (2008) and Ong et al. (2011). Argenti (1976) applied Altman’s (1968) model to UK companies and found that the corporate failure models developed for one country may not be applicable to another. Choe et al. (2002) also compared the accounting data between Australia and Korea and found out similar results. They cited that the differences were due to different economic and industrial environments between the countries. Not only the country specific factors matter in distress prediction but more accurate distress prediction models could be developed with industry specific data (Brigham et al. (1994)). In the Indian context, Gupta (1979) attempted refinement of Beaver’s (1966) method and used a simple non-parametric test for measuring the differentiating power of various financial ratios. Studies in the Indian context have been done for specific industries or companies’ viz. Gupta (1983) and Mulla (2002) for the textile industry, Selvam, et al. (2004) for cement industry, Krishna (2005) for IDBI, Sheela et al. (2012) and Bhunia et al. (2011) for pharmaceuticals and Kirubakaran et al. (2013) for public sector companies. Bagchi (2004) analyzed practical implication of accounting ratios in risk evaluation and concluded that accounting ratios still play a major role in credit risk evaluation. Kumar et al. (2012) compared three models viz. Z-score, O-score and Zmijewski’s model while assessing the distress of industrial corporations. They estimated the probability of bankruptcy for Texmo industries for the period 2005-06 to 2009-10 using the three models and concluded that O-score model based on logistic regression performs better. Gupta (2014) studied the predictive ability of two models, first a Z-score model utilizing multiple discriminant analysis (MDA) and second, a logit model. She utilized the dataset of 120 listed Indian companies. In the absence of default companies’ database, she utilised CRISIL ratings data (companies with ‘D’ ratings were considered as defaulting), while other companies in the database had ratings either ‘AA’ or ‘AAA’. Accounting ratios based on the information from annual reports of the companies (24 accounting ratios) were taken as predictors of default risk. The models could identify the defaulting companies thus establishing the significance of the information available from annual reports of the companies. Moreover, logistic regression models were found to have higher predictive ability and were able to provide probability of default directly. Existing studies in the Indian context have applied logistic regression technique but that has been done with cross section data. Application of panel logistic regression technique has not been attempted very often. Panel data models for discrete dependent variables will eliminate the bias of omitted variables that arise when the unobserved individual-specific effects are correlated with explanatory variables. Arellano and Honoré (2001) also argued that panel data models for discrete dependent variables could be utilised for controlling the unobserved heterogeneity. III. Exposure of Banks to Corporate Sector ̶ Recent Trends Analysis of outstanding credit of scheduled commercial banks to public sector’s financial and non-financial corporations and private sector’s financial and non-financial corporations reveals that private non-financial corporations have major share of outstanding credit of scheduled commercial banks (Table 1). Public and private limited companies could be a major source of risk arising of worsening corporate balance sheets. | Table 1: Outstanding Credit of Scheduled Commercial Banks to Public Sector and Private Corporate Sector | | (% Share) | | | Mar-08 | Mar-09 | Mar-10 | Mar-11 | Mar-12 | Mar-13 | Mar-14 | Mar-15 | | | Public Sector | | Public Financial Corporations | 5.1 | 4.6 | 5.2 | 5.4 | 4.0 | 1.7 | 3.4 | 4.3 | | Public Non-Financial Corporations | 16.2 | 19.0 | 17.0 | 19.6 | 21.7 | 24.0 | 24.5 | 22.9 | | | Private Corporate Sector | | Private Financial Corporations | 7.9 | 8.5 | 8.2 | 9.1 | 11.1 | 9.7 | 9.8 | 14.0 | | Private Non-Financial Corporations | 70.8 | 67.9 | 69.5 | 66.0 | 63.2 | 64.7 | 62.2 | 58.8 | | | 100.0 | 100.0 | 100.0 | 100.0 | 100.0 | 100.0 | 100.0 | 100.0 | | Source: Basic Statistical Returns of Scheduled Commercial Banks in India - Various Volumes | Lindner and Jung (2014) relate Indian corporate vulnerabilities to increased level of nonperforming and restructured loans in the banking system. Even the share of sub-standard and doubtful assets in the restructured corporate debt has been rising over the years (Figure 1). Concerns remain about corporate sector ability to service its debt. Financial Stability Reports has been highlighting that low debt servicing capabillity and high indebtedness of some of the Indian companies could pose a risk to the financial stability. In stressed scenarios, credit disbursal to such companies may pose serious risk to the asset quality of the lender banks. Out of total bank credit disbursed by SCBs, non-government non-financial (NGNF) companies accounted for 40.0 per cent, whereas stressed bank credit (bank credit in case of default by weak companies) is estimated to be 10.4 per cent as on March 20153 (Table 2). Table 2: Impact of Weakness in Debt Servicing Capacity of NGNF Companies on Bank Credit
(Share of bank credit in total bank credit of scheduled commercial banks) | | | Mar-13 | Mar-14 | Mar-15 | | All NGNF Companies | 31.5 | 38.5 | 40.0 | | Weak Companies | 7.8 | 9.5 | 10.4 | | Leveraged Weak Companies | 5.6 | 6.8 | 8.0 | | Source: Financial Stability Report , June 2016, RBI | Lindner et al. (2014) argued that with growing corporate sector vulnerabilities, NPAs in the banking system would also rise. With more capital requirements to be met by banks in future, this could put limit on the banks’ ability to provide credit. Besides its adverse impact on banks’ balance sheets, high indebtedness of corporate may also obstruct the transmission of monetary policy as corporate may not benefit from interest rates reductions due to high levels of debt. With the implementation of Basel III norms globally, many banks utilise their own internal ratings based models to arrive at an internal score for companies. However, this is different from getting a probability of a company being distressed (Gupta, 2014). Thus application of advanced statistical techniques along with continuous improvement in methodology is underscored to identify the weak or financially distressed companies. IV. Recognition of Distress in India The empirical studies on financial distress prediction in Indian context are constrained by the fact that the information on such companies is scarce (Jayadev, 2006). The Sick Industrial Companies (Special Provisions) Act (SICA) of 1985 was enacted with the objective of determining the sickness in industrial units, with regards to determining crucial sectors where public money is locked. It contained provisions for detection of sick and potentially sick industrial units. The criteria to determine a sick industrial unit are (i) a company which had accumulated losses equal to or more than its net worth, (ii) a company with five years of existence, (iii) having 50 or more workers, (iv) and having a factory license. The said Act of 1985 was further provided with the objective to constitute the Board for Industrial and Financial Reconstruction and also Appellate Authority thereof vested with the powers to recommend and supervise the implementation of the rehabilitation plans of the sick industries. Later, SICA (1985) was repealed and was replaced by the Sick Industrial Companies (Special Provisions) Repeal Act of 2003. The new Act aimed at plugging certain loopholes existing in the earlier SICA (1985). It aimed at reducing the incidence of industrial sickness by way of ensuring that companies did not misuse the legal provisions to gain access to benefits or concessions from financial institutions. Board for Industrial and Financial Reconstruction (BIFR) and Appellate Authority for Industrial and Financial Reconstruction (AAIFR) were dissolved and replaced by National Company Law Tribunal (NCLT) and National Law Appellate Tribunal (NCLAT), respectively4. Credit Information Bureau (India) Limited was incorporated in January 2001 with the objective of collecting credit related information regarding commercial and consumer borrowers. It can disseminate information on defaulters above ₹ 10 million w.e.f. March 2003. However, there is no unique code allotted to the defaulters and only names are available without any financial data. Hence, identifying the company with only names is a tedious task. RBI has also set up a framework in 2014 for early recognition of stress in order to arrest the increasing level of NPAs. The Central Repository of Information on Large Credits (CRILC) has been set up by RBI to collect, store and disseminate credit data to lenders. The banks are required to furnish credit information to CRILC on all their borrowers having aggregate fund and non-fund based exposure of ₹ 50 million and above with unique identification through Permanent Account Number (PAN). Till now, a major cause of concern was the existence of various overlapping laws and forums, and there was no single legislation which governed corporate insolvency in India. Resultantly, winding up of a business and recovery of debt is a cumbersome process. The Insolvency and Bankruptcy Code, 2016 offers a uniform and comprehensive legislation covering all companies, partnerships and individuals (other than financial firms). It aims to regulate, and streamline the process of winding up of the companies in India. Now, investors will also have a say in the restructuring of a company. With the professionals overseeing the winding up the insolvency resolution process is expected to be completed in a time bound manner. The National Company Law Tribunal (NCLT) will adjudicate insolvency resolution for companies. The Government is proposing a separate framework for bankruptcy resolution in failing banks and financial sector entities. V. Definition of Corporate Distress A company may be financially distressed if it is unable to pay its financial obligations as they mature (Lin, 2009). Such definition of distress is based on the theoretical framework of ‘cash flow’ or ‘liquid assets’ model. Liquidity asset flow model by Beaver (1966) considered a company to be reservoir of liquid assets which was supplied by inflows and drained by outflows. Basically firms with positive cash flow would be able to raise more funds whereas those with the negative cash flows will be unable to do so. Moreover, such firms with the negative cash flows would be unable to pay their obligations as they mature. Carmichael (1972) found that the financial difficulty that a company encounters was a situation when there was insufficiency of liquidity, equity, liquid capital and default of debt. Foster (1986) defines distress as a serious liquidity problem which was unable to be resolved without large scale restructuring of operations. Doumpos et al. (1998) mentioned distress in terms of negative net assets value i.e. when a company’s total liabilities exceed total assets from the accounting point of view. Ross et al. (1999) summarised distress to be one of the following four conditions (a) business failure i.e. a company cannot pay its outstanding debt after liquidation, (b) legal bankruptcy i.e. a company or its creditors apply to the court for a declaration of bankruptcy, (c) technical bankruptcy i.e. the company cannot fulfil the contract to repay principal and interest; and (d) accounting bankruptcy i.e. the company’s book net assets are negative. Chinese listed companies’ financial distress is defined as special treatment (ST) by Chinese stock exchange when their profits continue to be negative for two consecutive years. For Iranian companies, distress is defined as the situation where retained losses are more than 50 per cent of their capital. Sun et al. (2014) define the concept of relative financial distress which is relative deterioration of financial situation of a company in its life cycle. It is very difficult to identify which ratio or a set of ratios should be taken to identify a distressed company in the absence of any such criteria for Indian companies. The collection of data for distressed companies requires definition of distress and the specification of population from which companies are to be drawn. To arrive at the criteria, several financial ratios/variables were examined viz. change in net worth, ratio of long term borrowings to total assets, ratio of long term borrowings to total borrowings, interest coverage ratio, debt to equity ratio and return on equity. Ratings data was not used to identify a distressed company as there could be several ratings given to a single company, thus, presenting the problem of selection of ratings from the available list. Moreover, a company is generally not rated rather a particular security type provided by the company is rated. This also poses a problem as to which security type rating is to be considered. Moreover, if a company has not been rated, it cannot be included in the sample. In the present study, a company is defined to be financially distressed if its accumulated losses are more than 50 per cent5 of its net worth6. VI. Data Sources and Methodology Data Source Data used in the study is from the annual reports of NGNF public limited companies for the period 2006-07 to 2013-14. Different years’ sample datasets include 4000 plus companies with 40-50 per cent of them common from the previous years. A balanced panel of 1051 companies is taken for the period. These 1051 companies account for on an average 11 per cent of population paid-up capital (PUC) of NGNF public limited companies (as per the population PUC data received from Ministry of Corporate Affairs). The choice of, and investigation of explanatory variables is not the main objective of this paper. Hence no attempt has been made to develop new ratios for the purpose of the study. The explanatory variables are mainly those taken in past studies of distress prediction. Selection of Variables In distress prediction studies, choice of relevant financial ratios is very important. The list of ratios mentioned in the Appendix includes those which have been taken in the earlier studies and have been identified as indicators of measuring defaults. Several studies aiming to develop corporate distress prediction models have employed factor analysis (e.g., Libby, 1975 in case of US; Taffler, 1982 in case of UK; Ganesalingam and Kumar, 2001 in case of Australia; and Chen, 2011 in case of Taiwan). These studies employ factor analysis as the data reduction technique before conducting discriminant analysis or logistic regressions for financial distress predictions. In the present study, to choose from the list of 37 variables (Appendix), factor analysis technique is applied. The initial solution is obtained by principal component method, whereas Varimax rotation is applied for the final solution. The Eigen values of the selected 11 factors are given in Table 3A. In Table 3B, the variables with high factor loadings have been given. The variables included in a factor increase and decrease together. Only one variable from any factor has been included into the model of distress estimation. | Table 3A: Eigen Values of Selected 11 Factors | | | Factor 1 | Factor 2 | Factor 3 | Factor 4 | Factor 5 | Factor 6 | Factor 7 | Factor 8 | Factor 9 | Factor 10 | Factor 11 | Eigen
values | 7.808 | 5.977 | 3.838 | 3.112 | 2.870 | 2.185 | 1.948 | 1.309 | 1.049 | 0.987 | 0.952 |
| Table 3B: Selection of Variables using Factor Analysis | | Factors | Variables | Factor Loadings | | Factor 1 | Inventory to Sales | 0.99797 | | | Current Assets to Sales | 0.99755 | | | Working Capital to Sales | 0.99621 | | | Net worth to Sales | 0.99567 | | | Quick Assets to Sales | 0.99423 | | | Cash to Sales | 0.98674 | | | Cash Flow to Sales | 0.97787 | | | Net Income to Sales | 0.94592 | | Factor 2 | Quick Assets to Total Assets | 0.8448 | | Factor 3 | Cash Flow to Debt | 0.99824 | | | Net Income to Debt | 0.99536 | | | EBIT to Debt | 0.98821 | | | Quick Assets to Debt | 0.93513 | | Factor 4 | Net Income to Net Worth | 0.96211 | | | Cash Flow to Net Worth | 0.98687 | | Factor 5 | Current Assets to Total Assets | 0.93563 | | Factor 6 | Cash to Total Assets | 0.94032 | | Factor 7 | Operating Profit to Total Liabilities | 0.94268 | | Factor 8 | Current Assets to Current Liabilities | 0.93578 | | | Quick Assets to Current Liabilities | 0.86565 | | Factor 9 | Long term Liabilities to Total Assets | 0.96565 | | Factor 10 | Cash Flow to Total Assets | 0.97403 | | | EBIT to Total Assets | 0.93813 | | | Retained Earnings to Total Assets | 0.97164 | | Factor 11 | Public Deposits to Total Assets | 0.99704 | Methodology There are many alternatives for estimating probability of a company being distressed viz., linear regression, discriminant analysis and ‘classification trees’. However, the most widely used technique is that of logistic regression based on historical database of defaults. In the present study, the panel logistic regression technique is used for estimation of the distress probabilities of the companies. Given that a company belongs to some pre-specified population, the research question addressed is ‘what is the probability that the company becomes distressed within some pre-specified time period’. Unlike MDA, no assumption has been made regarding the distribution of predictors. Let yit be the value of response variable for company i at time t which takes value 1 if a company becomes distressed within next one year from time t, pit and let be the probability that yit = 1. It is convenient to assume that the dependence of pit on possible predictor variables is described by a logistic regression model. 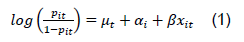 μt is an intercept term that is allowed to vary over time, αi represents all differences between companies that are stable over time, and xit is a column vector of variables that vary for both companies as well as over time. The objective is to estimate the intercept and β while controlling for time invariant covariates. To accomplish that, we use variations within companies to estimate these parameters. This involves reformulating the likelihood function so that it no longer contains individual specific parameter αi in the above equation. The method used is conditional maximum likelihood (Chamberlain, 1980). In fixed effects models, the conditional likelihood estimator proposed by Chamberlain (1980), when feasible, allows obtaining consistent estimates of the parameters that are no longer dependent on the individual effects7. Based on the three ratios viz., current assets to current liabilities, long term liabilities to total assets and operating profits to total liabilities, it is found that ratio of current assets to current liabilities as well as ratio of operating profits to total liabilities is consistently higher whereas ratio of long term liabilities to total assets is lower for non-distressed companies (Table 4). So distressed companies in general were more indebted and were less profitable. | Table 4: Ratios for Distressed and Non-distressed Companies | | | Non-Distressed | Distressed | | Year | Current Assets to Current Liabilities | Long Term Liabilities to Total Assets | Operating Profits to Total Liabilities | Current Assets to Current Liabilities | Long Term Liabilities to Total Assets | Operating Profits to Total Liabilities | | 2006-07 | 1.8517 | 0.1529 | 0.1170 | 1.0362 | 0.3018 | 0.0368 | | 2007-08 | 1.7589 | 0.1515 | 0.1093 | 0.9655 | 0.3023 | 0.0281 | | 2008-09 | 1.8201 | 0.1543 | 0.0963 | 0.9382 | 0.2780 | -0.0268 | | 2009-10 | 1.8087 | 0.1464 | 0.1072 | 1.0524 | 0.2849 | 0.0153 | | 2010-11 | 1.8845 | 0.1549 | 0.0971 | 1.5213 | 0.5463 | 0.0004 | | 2011-12 | 1.9736 | 0.1521 | 0.0805 | 0.8891 | 0.5988 | -0.0377 | | 2012-13 | 1.9424 | 0.1529 | 0.0771 | 1.0590 | 0.5270 | -0.0264 | | 2013-14 | 2.1116 | 0.1446 | 0.1040 | 1.2069 | 0.4750 | -0.0452 | VII. Empirical Findings Estimation of Distress (Logistic Regression) From the list of variables in the Table 3B above, the variables with highest factor loadings were included in the model. The model fit statistics were considered and the model with minimum value of AIC and SC criteria was chosen as the best model. The final model8 selected is presented in Table 5 below. Overall measure of goodness of fit is given by Likelihood ratio. Model convergence status describes whether maximum likelihood algorithm converged or not. The default criteria are gradient convergence criteria. One task of multiple testing is global testing which indicates that all of the individual null hypotheses are true. | Table 5: Analysis of Maximum Likelihood Estimates | | Variable | DF | Estimate | Standard
Error | Wald
Chi-Square | Pr > ChiSq | | Current assets to total assets | 1 | -0.213 | 0.8854 | 0.0579 | 0.8099 | | Cash to total assets | 1 | -2.8234 | 2.1046 | 1.7997 | 0.1797 | | Operating profit to total liabilities | 1 | -6.5605 | 0.9801 | 44.8061 | <.0001 | | Long Term liabilities to total Assets | 1 | 3.7597 | 0.6212 | 36.6254 | <.0001 | | Current assets to current liabilities | 1 | -0.7701 | 0.1465 | 27.627 | <.0001 |
| Testing Global Null Hypothesis: BETA=0 | | Test | Chi-Square | Pr > ChiSq | | Likelihood Ratio | 317.8529 | <.0001 | | Score | 271.0984 | <.0001 | | Wald | 175.8876 | <.0001 | | Convergence criterion (GCONV=1E-8) satisfied. | | Model Fit Statistics | | Criterion | Without
Covariates | With
Covariates | | AIC | 1061.203 | 767.35 | | SC | 1061.203 | 851.793 | | -2 Log L | 1061.203 | 743.35 | The signs of all the ratios entering the model were as expected, whether significant or not. Positive coefficients suggest the increase in the probability of being in distress with the corresponding increase in the value of the ratio, whereas negative coefficients suggest vice-versa. The three significant variables observed were operating profits to total liabilities, long term liabilities to total assets and current assets to current liabilities ratio. Operating profits to total liabilities ratio indicates funds from operations available to the companies as compared to total liabilities. This ratio is a measure of operating performance of companies. Lower value of the ratio indicates the probable delays in making the operating payments by the companies. Ratio of long term liabilities to total assets indicates the extent to which long term liabilities of a company are covered by its assets. The higher value of the ratio indicates higher risks for the company. Ratio of current assets to current liabilities is an indicator of short term solvency. The lower value of the ratio indicates poor solvency condition. Validation of Estimation As it is preferable to validate the model on a fresh data set hence the data received from Ministry of Corporate Affairs (MCA) for the years 2012-13 to 2014-15 was used to validate the estimated model. For these companies, the model should give high probabilities for the distressed companies as identified by the definition mentioned earlier. There were 16,923 public limited companies data for the three years, i.e. 2012-13 to 2014-15. Table 6 below gives the type I and type II and the overall misclassification errors for the estimation as well as the validation sample. | Table 6: Classification Errors (per cent) | | | Distressed classified as Non-distressed | Non-Distressed classified as Distressed | Overall
Misclassification | | | Type I | Type II | | Estimation Sample | 2.8 | 17.5 | 20.3 | | Validation Sample | 5.2 | 18.9 | 24.1 | Industry wise Distress Probabilities The debt weighted distress probability (Nordal and Syed, 2010) for an industry at time t can be given by Debt weighted distress probability may be interpreted as the average expected fraction of loan that becomes distressed next year. The debt weighted probability of distress arrived at for a larger sample9 of 12,774 NGNF public limited companies based on MCA data is shown in the Table 7 below. Apart from these, the distress probabilities of some specific industries/companies were also estimated and the model was found to capture the underlying distress for the industries/companies. | Table 7: Debt Weighted Distress Probability | | Debt Weighted | 2011-12 | 2012-13 | 2013-14 | 2014-15 | | Construction including Civil Eng. | 0.63 | 0.67 | 0.67 | 0.64 | | Electricity Gas Steam and Air Conditioning Supply | 0.73 | 0.78 | 0.72 | 0.74 | | Manufacturing | 0.35 | 0.39 | 0.42 | 0.40 | | Mining and Quarrying | 0.48 | 0.52 | 0.58 | 0.53 | | Services | 0.49 | 0.49 | 0.52 | 0.48 | | Others | 0.46 | 0.39 | 0.45 | 0.34 | The probability of distress (Debt Weighted) for some other industries viz. Iron and steel, and textiles are calculated and are presented in the table below. | Debt Weighted | 2011-12 | 2012-13 | 2013-14 | 2014-15 | | Textiles | 0.44 | 0.47 | 0.49 | 0.51 | | Iron and Steel | 0.43 | 0.47 | 0.48 | 0.50 | The debt weighted distress probabilities of construction including ‘civil engineering’ and ‘electricity gas steam and air conditioning supply’ are relatively very high (Table 7). These industries might have faced several bottlenecks during the period e.g. policy related delays and clearances of their projects which in turn could have hindered the timely completion of the projects for which loans were taken. For instance, gas based electricity companies were in losses as there was no adequate gas supply to these companies. Similarly, the road projects were delayed due to the non-clearance from environment ministry at that point of time (around 2011-12 to 2013-14). Estimation of Distressed Bank Debt Once we aggregate for all companies, we can obtain distressed bank debt in year t. This aggregate can be interpreted as the expected loss to the banking sector in the absence of realised collateral. The Figure 2 below presents the movements of distressed bank debt for these 1051 sample companies with year 2007-08 indexed to 100. The distressed bank debt of the companies in the sample is found to be gradually increasing. VIII. Conclusion The main aim of the paper is predicting distress probabilities of non-government non-financial public limited companies within next one year using the company’s annual reports and estimating distressed bank debt due to the companies becoming distressed. After considering a wide range of financial ratios as potential predictors of distress, the final model predicts probability for the next year using the multivariate fixed effect logistic regression based on the 3 financial ratios: long term liabilities to total assets ratio, operating profits to total liabilities, and current assets to current liabilities. The model was tested for some distressed industries/companies and was found to capture the underlying distress. Distressed Bank debt was found to be increasing since 2011-12 for the sample companies. The findings suggest that the corporates may visualise their distress in advance while the banks may make detailed analysis of corporate’s balance sheet to gauge their future commercial viability before lending.
References Altman, E. (1968), “Financial Ratios, Discriminant Analysis and the Prediction of Corporate Bankruptcy”, Journal of Finance, September: 189-209. Altman, E.I. and M. Lavallee (1981), “Business Failure Classification in Canada”, Journal of Business Administration, 12(1): 147-164. Arellano, M. and B. Honoré (2001), Panel Data Models: Some Recent Developments, In J. J. Heckman and E. Leamer (eds.): Handbook of Econometrics, Vol. 5, Chapter 53, North-Holland, p. 3229-3296. Argenti, J. (1976), Corporate Collapse: The Causes and Symptoms, McGraw-Hill. Bagchi, S. K. (2004), “Accounting Ratios for Risk Evaluation”, The Management Accountant, 39(7): 571-573. Bandopadhyay, A. (2006), “Predicting Probability of Default of Indian Corporate Bonds: Logistic and Z Score Model Approaches”, The Journal of Risk Finance, 7(3): 255 – 272. Barniv, R., A. Agarwal, and R. Leach (2002), “Predicting Bankruptcy Resolution”, Journal of Business Finance and Accounting, 29 (3 & 4): 497 – 520. Beaver, W. (1966), “Financial Ratios as Predictors of Failures”, Journal of Accounting Research, 4:71-111. Bernhardsen, E. (2001), “A Model of Bankruptcy Prediction”, Technical Report, Bank of Norway. Bhunia, A. and R. Sarkar (2011), “A Study on Financial Distress based on MDA”, Journal of Management Research, 3(2):1-11. Brigham, E.F. and L. C. Gapenski (1994), Financial Management: Theory and Practice, 7th ed., Dryden, Orlando, FL. Carmichael, D.R. (1972), The Auditor’s Reporting Obligation, Auditing Research Monograph No. 1 (New York: AICPA). Chamberlain, G. (1980), “Analysis of Covariance with Qualitative Data”, Review of Economic Statistics, 48:225-238. Charitow, A., E. Neophytou, and C. Charalambous (2004),”Predicting Corporate Failure: Empirical Evidence from the UK”, European Accounting Review, 13(3): 465 - 497. Chen, H.H. (2008), “The Timescale Effects of Corporate Governance Measure on Predicting Financial Distress”, Review of Pacific Basin Financial Markets & Policies, 11(1): 35-46. Chen, M. (2011), “Predicting Corporate Financial Distress Based on Integration of Decision Tree Classification and Logistic Regression”, Expert Systems with Applications, 38(9): 11261-11272. Choe, C. and Y. Her (2002), “A Comparative Study of Australian and Korean Accounting Data in Business Failure Prediction Models”, Journal of Accounting and Finance, 2002(1), 43-69. Doumpos, M. and C. Zopounidis (1998), “A Multinational Discrimination Method for the Prediction of Financial Distress: The Case of Greece”, Multinational Finance Journal, 3: 71–101. Eisenbeis, R.A. (1977), “Pitfalls in the Application of Discriminant Analysis in Business and Economics”, Journal of Finance, 32(3): 875-900. Fathi, E. and P.G. Jean (2001), “Financial Distress and Corporate Governance: An Empirical Analysis”, Corporate Governance: The International Journal of Business in Society, 1(1):15 – 23. Foster, G. (1986), Financial Statement Analysis, 2nd ed., Prentice Hall, NJ. Ganesalingam, S. and K. Kumar (2001), “Detection of Financial Distress via Multivariate Statistical Analysis”, Managerial Finance, 27(4): 45-55. Gupta L.C. (1979), “Financial Ratios as Forewarning Indicators of Corporate Sickness”. Bombay ICICI 1979 quoted by Pandey. I.M. (1979) Financial Management, Vikas Publishing House Pvt. Ltd, New Delhi. Gupta, L. C. (1983), Financial Ratios for Monitoring Corporate Sickness, New Delhi; Oxford University Press. Gupta, V. (2014), “An Empirical Analysis of Default Risk for Listed Companies in India: A Comparison of Two Prediction Models”, International Journal of Business and Management, 9(9). Izan, H.Y. (1984), “Corporate Distress in Australia”, Journal of Banking and Finance 8(2): 303-320. Jayadev, M. (2006), “Predictive Power of Financial Risk Factors: An Empirical Analysis of Default Companies”,Vikalpa, 31(3). Karels, G.V. and A. J. Prakash (1987), “Multivariate Normalcy and Forecasting of Business Bankruptcy”, Journal of Business Finance and Accounting, 14(4). Kirubakaran, J. and M. Dharmalingam (2013), “Testing the Financial Health of Public Sector Companies in India”, Madras University Journal of Business and Finance, 1(2). Ko, C.J. (1982), “A Delineation of Corporate Appraisal Models and Classification of Bankruptcy Firms in Japan”, Thesis, New York University, New York, NY. Krishna, C. V. (2005), “Measuring Financial Distress of IDBI Using Altman Z-Score Model”, The ICFAI Journal of Bank Management, 4(3): 7-17. Kumar, R. G. and K. Kumar (2012), “A Comparison of Bankruptcy Models”, International Journal of Marketing, Financial Services and Management Research, 1(4). Laitinen, E. K. and T. Laitinen (2000), “Bankruptcy Prediction: Application of the Taylor´s Expansion in Logistic Regression”, International Review of Financial Analysis, 9:327 – 349. Libby, R. (1975), “Accounting Ratios and the Prediction of Failure: Some Behavioral Evidence”, Journal of Accounting Research, 13(1): 150-161. Lin, T.H. (2009), “A Cross Model Study of Corporate Financial Distress Prediction in Taiwan: Multiple Discriminant Analysis, Logit, Probit and Neural Networks Models”, Neurocomputing 72: 3507–3516. Lindner, P. and Sung Eun Jung (2014), “Corporate Vulnerabilities in India and Banks’ Loan Performance”, IMF Working Paper, 14: 232. Mohamad, I.H., M.N.Annuar, M. Shamsher and H. Taufiq (2005), “Prediction of Corporate Financial Distress of PN4 Companies in Malaysia: A Logistic Model Approach”, Journal of Restructuring Finance, 2(2): 143-55. Mulla, M.A. (2002), “Use of Z Score Analysis for Evaluation of Financial Health of Textile Mills-A Case Study”, Abhigyan, 19(4): 37- 41. Nam, J.H. and T. Jinn (2000),“Bankruptcy Prediction: Evidence from Korean Listed Companies During the IMF Crisis”, Journal of International Financial Management and Accounting, 11 (3):178 – 197. Nordal, K. and Haseeb Syed (2010), “A Model for Predicting Aggregated Corporate
Credit Risk”, Economic Bulletin 2010, Norges Bank. Ohlson, J.A. (1980), “Financial Ratios and the Probabilistic Prediction of Bankruptcy”, Journal of Accounting Research, 18: 109-131. Ong, S., V. C. Yap and W.L. K. Roy, (2011),”Corporate Failure Prediction: A Study of Public Listed Companies in Malaysia”, Managerial Finance, 37(6): 553 – 564. RBI (2014), Financial Stability Report, December 2014, Reserve Bank of India <https://rbidocs.rbi.org.in/rdocs/PublicationReport/Pdfs/FSR29122014_FL.PDF> Ross, S.A., R.W. Westerfield, and J.F. Jaffe (1999), Corporate Finance, Second ed., Homewood IL, Irwin/Mcgraw-Hill. Selvam, M., S. Vanitha, and Babu (2004),“A study on Financial Health of Cement Industry-Z score Analysis”, The Management Accountant, July, 39(7):591-593. Sharma S. and V. Mahajan (1980), “Early Warning Indicators of Business Failure”, Journal of Marketing, 44: 80-89. Sheela, S.C. and K. Karthikeyan (2012), “Evaluating Financial Health of Pharmaceutical Industry in India Through Z Score Models”, International Journal of Social Sciences and Interdisciplinary Research, 1(5), May 2012. Sun, J., Hui Li, Qing-Hua Huang, and Kai-Yu He (2014), “Predicting Financial Distress and Corporate Failure: A Review from the State-of-the-art Definitions, Modeling, Sampling, and Featuring Approaches”, Knowledge-Based Systems 5: 41-56. Taffler, R. J. (1982), “Forecasting Company Failure in the UK Using Discriminant Analysis and Financial Ratio Data”, Journal of the Royal Statistical Society, 145(3): 342-358. Ugurlu, M. and H. Aksoy (2006), “Prediction of Corporate Financial Distress in an Emerging Market: The case of Turkey”, Cross Cultural Management, 13(4): 277-295. Wang, Z. J. and X. L. Deng (2006), “Corporate Governance and Financial Distress: Evidence from Chinese Listed Companies”, Chinese Economy, 39(5):5-27. Zmijewski, M. E. (1984), “Methodological Issues Related to the Estimation of Financial Distress Prediction Models”, Journal of Accounting Research, 22 (Supplement):59-82.
Appendix List of variables used in the Study | Sr. No. | Name of the Ratio | | 1 | Accounts Receivable to Sales | | 2 | Cash Flow to Debt | | 3 | Cash Flow to Net Worth | | 4 | Cash Flow to Sales | | 5 | Cash flow to Total Assets | | 6 | Cash to Current Liabilities | | 7 | Cash to FEFO | | 8 | Cash to Sales | | 9 | Cash to Total Assets | | 10 | Current and Long Term Liabilities to Total Assets | | 11 | Current Assets to Current Liabilities | | 12 | Current Assets to Sales | | 13 | Current Assets to Total Assets | | 14 | Current Liabilities to Total Assets | | 15 | Current, Long Term Liabilities and Preferred Stock to Total Assets | | 16 | Debt to Equity Ratio | | 17 | Debt to Total Assets | | 18 | Earnings Before Interest and Taxes(EBIT) to Total Assets | | 19 | EBIT to Debt | | 20 | Equity to Total Assets Ratio | | 21 | Interest Coverage Ratio | | 22 | Inventory to Sales | | 23 | Long Term Liabilities to Total Assets | | 24 | Net Profit to Debt | | 25 | Net Profit to Net Worth | | 26 | Net Profit to Sales | | 27 | Net Profit to Total Assets | | 28 | Net Worth to Sales | | 29 | Operating Profit to Total Liabilities | | 30 | Outstanding Public Dues to Total Assets | | 31 | Quick Assets (Current Assets excl. Inventories) to Total Assets | | 32 | Quick Assets to Current Liabilities | | 33 | Quick Assets to Debt | | 34 | Quick Assets to Sales | | 35 | Trade Credit to Total Assets | | 36 | Working Capital to Sales | | 37 | Working Capital to Total Assets | | Note: Debt is taken as long term borrowings of the companies; Cash flow is taken as sum of net profit and depreciation; and Fund expenditures for operations (FEFO) is taken as operating expenses minus depreciation. | |