| I. Macroeconomic Outlook The rebound from the COVID-19 induced slump has been sharper than anticipated and economic activity is expected to rebound strongly in 2021-22. Headline consumer price index (CPI) inflation receded into the tolerance band beginning December 2020. Core inflation pressures remain elevated, reflecting pass-through from higher crude oil and non-oil commodity prices, high fuel and other taxes post-COVID and increased operating costs. The evolving COVID-19 trajectory and progress on vaccination remain the key drivers of economic activity and inflation, globally and in India. Section 45-ZA of the RBI Act, 1934 requires that the Central Government shall, in consultation with the Reserve Bank of India (RBI), determine the inflation target in terms of consumer price index (CPI), once in every five years. Accordingly, in a notification on March 31, 2021, the Central Government, in consultation with the RBI, retained the inflation target at 4 per cent (with the upper tolerance level of 6 per cent and the lower tolerance level of 2 per cent) for the 5-year period April 1, 2021 to March 31, 2026. The experience with successfully maintaining price stability and the gains in credibility for monetary policy since the institution of the inflation targeting framework in 2016 would be reinforced by the retention of the target and the tolerance band.1 The experience during the COVID-19 period has testified to the flexibility of the framework to respond to sharp growth-inflation trade-offs and extreme supply-side shocks. I.1 Key Developments since the October 2020 MPR Since the release of the Monetary Policy Report (MPR) in October 2020, domestic economic activity has turned out to be better than anticipated on the back of a turnaround in gross fixed capital formation and a much shallower contraction in private consumption than in the preceding quarters of the financial year. The global economy is pulling out of the loss of momentum in Q4:2020, driven by multiple vaccine approvals, the launch of inoculation drives in many countries and the extension of monetary and fiscal stimuli. On the other hand, new mutants of the COVID-19 virus, second/third waves of infections, renewed lockdowns in many countries and uneven access to vaccines across countries continue to weigh on the outlook. The resurgence of commodity price inflation, supported by abundant global liquidity, has fuelled reflation trade in global financial markets. Despite the promise of continued accommodative monetary policies by central banks, bond yields have firmed up from very low levels, spurred by inflation concerns and expectations of stronger growth. Amidst stretched valuations, equity prices have become sensitive to the hardening of yields. In turn, exchange rates have become volatile, with capital outflows from emerging economies in early March interrupting their earlier ebullience on risk-on sentiments. Crude oil prices jumped sharply on production cuts by the Organization of the Petroleum Exporting Countries (OPEC) plus and on anticipation of stronger demand. Non-oil commodity prices have risen substantially across the board, putting upward pressures on inflation in commodity importing countries. Gold prices eased from the highs reached in August 2020 on a stronger US dollar and expectations of economic recovery. While inflation is expected to remain subdued in advanced economies (AEs) and most of the emerging market economies (EMEs) on account of negative output gaps, the large fiscal and monetary stimuli and elevated commodity prices have raised inflation concerns over longer horizons in advanced economies and in the nearer-term in the case of EMEs. Turning to the domestic economy, the gross domestic product (GDP) shrugged off the contractions of preceding quarters and moved into expansion zone in Q3:2020-21 (+ 0.4 per cent, year-on-year). High frequency indicators point to the growth momentum gaining strength in Q4 although the surge in COVID-19 infections in a few states in March 2021 imparts uncertainty to the assessment. The outlook for the agriculture sector remains bright, with higher rabi sowing, above normal north-east monsoon and adequate reservoir levels. Inflation receded into the tolerance band beginning December 2020 after breaching the upper threshold of 6 per cent for six consecutive months (June-November 2020). The late winter easing of vegetable prices that caused this softening has dissipated, however. In its February 2021 print, headline inflation firmed up again, with upside pressures getting generalised across constituents of core inflation. Monetary Policy Committee: October 2020-March 2021 During October 2020-March 2021, the Monetary Policy Committee (MPC) met thrice. In the October 2020 meeting, the MPC noted that the revival of the economy from the unprecedented COVID-19 pandemic assumed the highest priority in the conduct of monetary policy. High inflation was seen as easing with the unlocking of the economy, restoration of supply chains and normalisation of activity. Hence, the MPC decided to look through the inflation spike and unanimously voted to keep the policy repo rate unchanged. It also voted to continue with the accommodative stance as long as necessary – at least during the current financial year and into the next financial year – to revive growth on a durable basis and mitigate the impact of COVID-19 on the economy, while ensuring that inflation remained within the target going forward. In the run up to the December 2020 meeting, CPI inflation had increased to 7.6 per cent in October 2020 with food inflation surging to double digits across protein-rich items, edible oils, vegetables and spices on multiple supply shocks. Core inflation had remained sticky and was seen to firm up as economic activity normalised and demand picked up. At the same time, with the signs of economic recovery being far from broad-based and still dependent on sustained policy support, the MPC decided to maintain status quo on the policy rate and continue with the accommodative stance set out in the October resolution. By the time the MPC met in February 2021, CPI inflation had declined to 4.6 per cent in December 2020 on the back of a larger than anticipated deflation in vegetable prices. The MPC noted the sharp correction in food prices but was concerned that some pressures persisted, and core inflation remained elevated. As the recovery was still to gather firm traction and continued policy support remained crucial, the MPC unanimously decided to keep the policy repo rate unchanged and maintain its accommodative stance. The MPC’s voting pattern reflects the individual members’ assessments, expectations and policy preferences (Table I.1). The MPC’s unanimous vote on the policy rate in all the three meetings during October 2020-March 2021 was a reflection of the unprecedented pandemic and an unambiguous consensus on continued policy support. Macroeconomic Outlook Chapters II and III analyse macroeconomic developments during October 2020-March 2021. Turning to the outlook, the evolution of key macroeconomic and financial variables over the past six months warrants revisions in the baseline assumptions (Table I.2). | Table I.1 Monetary Policy Committees and Voting Patterns | | Country | Policy Meetings: October 2020 - March 2021 | | Total Meetings | Meetings with Full Consensus | Meetings without Full Consensus | | Brazil | 4 | 4 | 0 | | Chile | 4 | 4 | 0 | | Colombia | 5 | 3 | 2 | | Czech Republic | 4 | 4 | 0 | | Hungary | 5 | 5 | 0 | | India | 3 | 3 | 0 | | Israel | 4 | 0 | 4 | | Japan | 4 | 0 | 4 | | South Africa | 3 | 1 | 2 | | Sweden | 2 | 2 | 0 | | Thailand | 4 | 4 | 0 | | UK | 4 | 4 | 0 | | US | 4 | 4 | 0 | | Sources: Central bank websites. | First, global crude oil prices have hardened notably since November 2020 on the back of production cuts by the OPEC and non-OPEC allies (OPEC plus) and expected revival in demand with vaccine rollouts. Reflecting these developments as well as the attack on Saudi Arabia’s oil facilities, Brent crude crossed US$ 70 per barrel in early March. Prices, however, corrected to around US$ 65 in the second half of March over concerns of demand faltering on rising COVID-19 infections and increase in crude stockpiles. Taking into account these developments, crude prices (Indian basket) are assumed at US$ 64.6 per barrel for 2021-22 in the baseline, 58 per cent above the October MPR baseline for 2020-21 (Chart I.1). Second, the nominal exchange rate (the Indian rupee or INR vis-à-vis the US dollar) has moved in a range of INR 72-75 per US dollar since October 2020. The INR remained under depreciating pressure till mid-November 2020 due to COVID-related uncertainty, risk aversion and capital outflows. Subsequently, the INR appreciated, riding on the domestic recovery gaining traction, decline in the number of new infections, vaccine rollout, and the measures announced in the Union Budget 2021-22 to revive the economy. The INR depreciated sharply in late February on elevated global financial market volatility following the spike in sovereign bond yields in the US and other major AEs. Taking these developments into account, the exchange rate is assumed at INR 72.6 per US dollar for 2021-22 in the baseline. | Table I.2: Baseline Assumptions for Projections | | Indicator | MPR October 2020 | MPR April 2021 | | Crude oil (Indian basket) | US$ 40.9 per barrel during H2:2020-21 | US$ 64.6 per barrel during 2021-22 | | Exchange rate | ₹ 73.6/US$ during H2:2020-21 | ₹ 72.6/US$ during 2021-22 | | Monsoon | 9 per cent above long period average for 2020 | Normal for 2021 | | Global growth | (-) 4.9 per cent in 2020
5.4 per cent in 2021 | 5.5 per cent in 2021
4.2 per cent in 2022 | | Fiscal deficit (per cent of GDP) | Given the Covid-19 impact on activity, revenues, and expenditures and factoring in the additional borrowings announced, fiscal deficits are expected to be significantly higher | To remain within BE 2021-22
Centre: 6.8
Combined: 10.8 | | Domestic macroeconomic/ structural policies during the forecast period | No major change | No major change | Notes: 1. The Indian basket of crude oil represents a derived numeraire comprising sour grade (Oman and Dubai average) and sweet grade (Brent) crude oil.
2. The exchange rate path assumed here is for the purpose of generating the baseline projections and does not indicate any ‘view’ on the level of the exchange rate. The Reserve Bank is guided by the objective of containing excess volatility in the foreign exchange market and not by any specific level of and/or band around the exchange rate.
3. BE: Budget estimates.
4. Combined fiscal deficit refers to that of the Centre and States taken together.
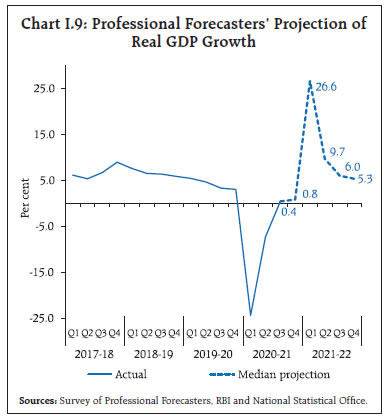
Sources: RBI estimates; Budget documents; and IMF. | 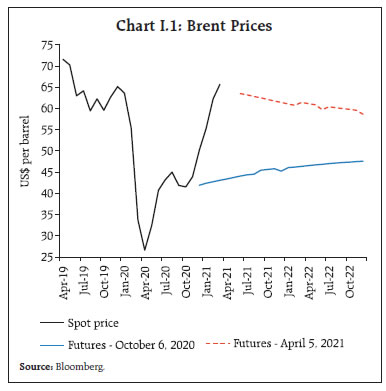 Third, global economic activity has improved relative to the outlook in October 2020 with vaccine rollouts and easing of lockdown restrictions, although it remains uneven across countries and sectors. The International Monetary Fund (IMF) in its January 2021 World Economic Outlook (WEO) update projected the global economy to expand by 5.5 per cent in 2021 (Chart I.2); the outlook remains heavily contingent upon the progress with COVID-19 containment measures and the scale and speed of the vaccination programme. The World Trade Organization’s (WTO) trade barometers suggest a moderation in global merchandise and services trade volumes from the marked improvement in Q4:2020. I.2 The Outlook for Inflation After breaching the upper tolerance threshold of 6.0 per cent for six consecutive months (June-November 2020), CPI inflation fell in December 2020 and eased further in January 2021 to 4.1 per cent on the back of a sharp correction in vegetable prices and softening of cereal prices. It rebounded to 5.0 per cent in February, however, driven primarily by base effects. Core inflation pressures remained elevated, with inflation excluding food and fuel at 6.0 per cent in February reflecting pass-through to retail prices from higher crude oil and non-oil commodity prices, high fuel and other taxes post-COVID and increased operating costs (Chapter II). Looking ahead, three months and one year ahead median inflation expectations of urban households rose by 80 basis points (bps) and 10 bps, respectively in the March 2021 round of the Reserve Bank’s survey2 in tandem with higher food and oil prices. The proportion of respondents expecting the general price level to increase by more than the current rate also increased for both three months and one year ahead horizons vis-à-vis the previous round (Chart I.3). 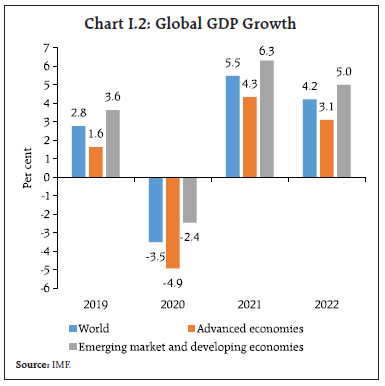 Manufacturing firms polled in the January-March 2021 round of the Reserve Bank’s industrial outlook survey3 expected further input cost pressures from raw materials in Q1:2021-22; moreover, positive sentiments on profit margins rose on the back of higher selling prices, suggesting a return of pricing power (Chart I.4). The IHS Markit’s purchasing managers’ index (PMI) survey for the manufacturing sector also reported strong increase in input prices in March 2021 along with higher output prices; for the services sector, input cost inflation was at an eight-year high while selling prices remained stable in February, reflecting efforts to boost sales. Professional forecasters surveyed4 by the Reserve Bank in March 2021 expected CPI inflation to ease from 4.9-5.0 per cent in H1:2021-22 to 4.3 per cent in Q3 and revert to 5.0 per cent in Q4 (Chart I.5). Taking into account the initial conditions, signals from forward-looking surveys and estimates from structural and other time-series models, CPI inflation is projected to average 5.0 per cent in Q4:2020-21, 5.2 per cent in Q1:2021-22 and Q2, 4.4 per cent in Q3, and 5.1 per cent in Q4, with risks broadly balanced (Chart I.6). The 50 per cent and the 70 per cent confidence intervals for headline inflation in Q4:2021-22 are 3.3-6.9 per cent and 2.4-7.8 per cent, respectively. 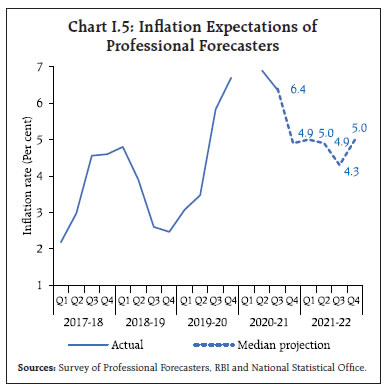 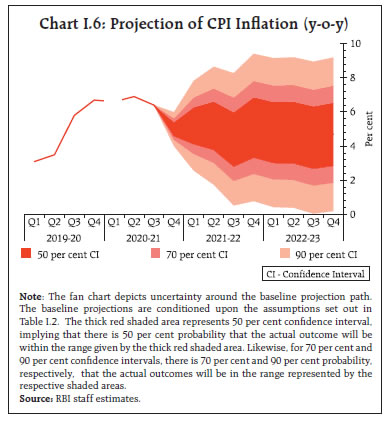 For 2022-23, assuming a normalisation of supply chains on the back of vaccine rollout, a normal monsoon and no major exogenous or policy shocks, structural model (Box I.1) estimates indicate that inflation will move in a range of 4.5-4.8 per cent. The 50 per cent and the 70 per cent confidence intervals for Q4:2022-23 are 2.9-6.5 per cent and 1.9-7.5 per cent, respectively. There are a number of upside and downside risks to the baseline inflation forecasts. The major upside risks include supply chain disruptions persisting for a longer period, rise in global crude oil and other commodity prices beyond what is currently in the baseline, and stronger pass-through of input costs amidst improvement in demand conditions and return of pricing power. Persistent structural demand-supply imbalances in key food items such as pulses, edible oils and fats, and eggs, meat and fish could also keep inflation elevated. The downside risks are mostly associated with a weaker than anticipated global and domestic demand in the case of another wave of infections and new mutants of the virus, fall in crude oil prices on weak demand and an early normalisation of supply chains. Prospects of a good rabi crop on top of a bumper kharif harvest in 2020-21 and effective supply management could keep food prices softer than in the baseline. I.3 The Outlook for Growth The rebound from the COVID-19 induced slump has been sharper than anticipated. Real GDP growth turned positive in Q3:2020-21 and a further strengthening is expected to have occurred in Q4:2020-21. Going forward, rural demand is likely to remain resilient on good prospects for the agriculture sector. Urban demand and demand for contact-intensive services is also expected to strengthen with the spread of vaccination. The fiscal stimulus under AtmaNirbhar 2.0 and 3.0 schemes and increased capital outlays and the investment-enhancing proposals in the Union Budget 2021-22 will likely accelerate public investment and crowd-in private investment. While the domestic financial conditions are expected to remain supportive in view of the guidance from RBI that systemic liquidity would continue to remain comfortable over the ensuing year, the risks of spillovers from volatility in global financial markets remain elevated. Box I.1: Quarterly Projection Model 2.0 The Quarterly Projection Model (QPM) in the RBI’s Forecast and Policy Analysis System (FPAS) is the workhorse model for generating medium term projections and undertaking policy scenario analysis, consistent with the central bank’s mandate under the flexible inflation targeting (FIT) framework (Benes et al., 2016). The QPM is a forward-looking, open economy, calibrated, new-Keynesian gap model, and incorporates specific characteristics of the Indian economy. With a view to enriching the model’s analytics and to capture monetary-fiscal-external-real sector interactions more comprehensively, the model structure has been expanded and the parameters of the QPM recalibrated, taking into account pre-COVID period data (up to Q4:2019) and latest empirical findings. In terms of its structure, the augmented QPM model (QPM 2.0) incorporates: a) fiscal-monetary dynamics, b) disaggregated fuel pricing (oil price, exchange rate and fuel taxes) and c) balance of payments and exchange rate interactions. The fiscal block in QPM 2.0 decomposes the primary deficit into structural (cyclically adjusted) and cyclical components, with shocks to the structural component impacting inflation through aggregate demand and country risk premia. The monetary policy stance affects the fiscal position through the interest rate channel (Escolano, 2010). The fuel block incorporates India’s complex system of pricing – items like petrol and diesel are priced on the basis of international oil prices, exchange rate and fuel taxes (excise duty and value added tax (VAT)); liquified petroleum gas (LPG) and kerosene prices are market determined but with lagged pass-through; and prices of electricity are administered by state governments. The cost-push implications are also incorporated in the enhanced aggregate supply block. Finally, the balance of payments module incorporates determinants of current and capital accounts and their interaction with the exchange rate management, guided by the objective of containing excess volatility in the foreign exchange market. This recognises the costs associated with spurts in volatility in the exchange rate (e.g., balance-sheet effects, dynamic Dutch disease) due to sudden surges or reversals in capital flows (Ghosh et al., 2016). The model properties of these features can be best represented through impulse response functions which trace out the impact on key macroeconomic variables in response to shocks. First, an expansionary structural fiscal shock contributes to demand pressures and creates a positive output gap. Increasing debt could contribute to depreciation of the currency through elevated country risk premia. The positive output gap and currency depreciation together lead to higher inflation, warranting monetary policy action (Chart I.1.1a). On the other hand, if the fiscal deficit shock is cyclical, it has a modest impact on inflation. Second, an increase in fuel taxes feeds into higher fuel prices and ex-food fuel inflation through the cost-push channel. Headline inflation goes up by 25 bps in response to a fuel tax increase of ₹10 per litre (Chart I.1.1b). Inflation expectations edge higher and remain entrenched, if tax reversals do not happen. Demand conditions also remain subdued for a longer period. Finally, the impact of capital flows depends, inter alia, on the RBI’s decision to intervene and sterilise. In case of a capital outflow shock of one percentage point (of nominal GDP) and assuming the RBI intervenes and sterilises 70 per cent of these capital outflows, the reserves will deplete by 0.7 percentage points of nominal GDP. The exchange rate will depreciate, inducing inflationary pressure (Chart I.1.1c). In the case of no intervention, the exchange rate depreciation will be relatively higher. A historical decomposition of the shocks suggests that the FIT framework helped in anchoring inflation expectations during 2016-20 leading to lower headline as well as core inflation. The disinflation during the post-FIT period was also supported by favourable supply shocks, both food and fuel, benign external factors and prudent fiscal policy (Chart I.1.2). References: Benes, J., K. Clinton, A. George, P. Gupta, J. John, O. Kamenik, D. Laxton, P. Mitra, G. Nadhanael, R. Portillo, H. Wang, and F. Zhang (2016), “Quarterly Projection Model for India: Key Elements and Properties”, RBI Working Paper Series No. 8. Ghosh, A. R., J. D. Ostry, and M. Chamon (2016), “Two Targets, Two Instruments: Monetary and Exchange Rate Policies in Emerging Market Economies”, Journal of International Money and Finance, 60, 172-196. Escolano, M. J. (2010), “A Practical Guide to Public Debt Dynamics, Fiscal Sustainability, and Cyclical Adjustment of Budgetary Aggregates”, International Monetary Fund. | Turning to the forward-looking surveys, consumer confidence5 for the year ahead dipped, although it was still in the optimistic zone, in the March 2021 round, driven by lower expectations on the general economic situation, the employment scenario and income conditions (Chart I.7). Sentiments in the manufacturing sector for the quarter ahead strengthened further in the January-March 2021 round of the Reserve Bank’s industrial outlook survey, reflecting optimism on production, order books, capacity utilisation, employment conditions and the overall business situation (Chart I.8). Surveys by other agencies also indicate optimism on future business expectations (Table I.3). According to the purchasing managers’ survey for March 2021, the one year ahead business expectations of firms in the manufacturing sector exhibit confidence; optimism of firms in the services sector strengthened to a one-year high in February. Professional forecasters polled in the March 2021 round of the Reserve Bank’s survey expected a sharp uptick in real GDP growth in Q1:2021-22, driven by base effects before tapering in subsequent quarters (Chart I.9 and Table I.4).
| Table I.3: Business Expectations Surveys | | Item | NCAER Business Confidence Index (February 2021) | FICCI Overall Business Confidence Index (February 2021) | Dun and Bradstreet Composite Business Optimism Index (January- March 2021) | CII Business Confidence Index (March 2021) | | Current level of the index | 84.8 | 74.2 | 79.9 | 68.7 | | Index as per previous survey | 65.5 | 70.9 | 46.2 | 62.9 | | % change (q-o-q) sequential | 29.6 | 4.7 | 72.9 | 9.2 | | % change (y-o-y) | -23.7 | 25.8 | 26.8 | 28.7 | Notes:
1. NCAER: National Council of Applied Economic Research.
2. FICCI: Federation of Indian Chambers of Commerce & Industry.
3. CII: Confederation of Indian Industry.
Sources: NCAER, FICCI, CII and Dun & Bradstreet Information Services India Pvt. Ltd. |
 Overall, economic activity is gathering strength, supported by the recovery in both demand and supply channels, sustained rollout of the vaccination programme, growth-enhancing proposals in the Union Budget and highly accommodative monetary conditions. Taking into account the baseline assumptions, the survey indicators, and model forecasts, real GDP growth6 is projected to pick up from (-) 8.0 per cent in 2020-21 to 10.5 per cent in 2021-22 – with a quarterly path of 26.2 per cent in Q1, 8.3 per cent in Q2, 5.4 per cent in Q3, and 6.2 per cent in Q4 – with risks evenly balanced (Chart I.10 and Table I.4). For 2022-23, assuming a normal monsoon, and no major exogenous or policy shocks, the structural model estimates indicate real GDP growth at 6.8 per cent, with quarterly growth rates in the range of 6.2-7.3 per cent. | Table I.4: Projections - Reserve Bank and Professional Forecasters | | (Per cent) | | | 2020-21 | 2021-22 | 2022-23 | | Reserve Bank’s Baseline Projections | | | | | Inflation, Q4 (y-o-y) | 5.0 | 5.1 | 4.7 | | Real GDP growth | -8.0 | 10.5 | 6.8 | | Median Projections of Professional Forecasters | | | | | Inflation, Q4 (y-o-y) | 4.9 | 5.0 | | | Real GDP growth | -7.5 | 11.0 | | | Gross domestic saving (per cent of GNDI) | 28.9 | 29.6 | | | Gross capital formation (per cent of GDP) | 27.7 | 30.1 | | | Credit growth of scheduled commercial banks | 6.4 | 8.0 | | | Combined gross fiscal deficit (per cent of GDP) | 14.0 | 10.5 | | | Central government gross fiscal deficit (per cent of GDP) | 9.5 | 6.8 | | | Repo rate (end-period) | 4.00 | 4.00 | | | Yield on 91-days treasury bills (end-period) | 3.3 | 3.9 | | | Yield on 10-year central government securities (end-period) | 6.2 | 6.5 | | | Overall balance of payments (US$ billion) | 97.2 | 50.6 | | | Merchandise exports growth | -10.3 | 15.0 | | | Merchandise imports growth | -19.0 | 24.1 | | | Current account balance (per cent of GDP) | 1.0 | -0.8 | | Note: GNDI: Gross National Disposable Income.
Sources: RBI staff estimates; and Survey of Professional Forecasters (March 2021). | There are upside as well as downside risks to the baseline growth path. A faster decline in COVID-19 infections helped by a rapid vaccination drive, large pent-up demand for contact-intensive services, and stronger global demand provide an upside to the baseline growth path. The uncertainty associated with the spread of COVID-19, including new mutants of the virus, deviation of the south-west monsoon from the baseline assumption of a normal monsoon, and elevated crude oil prices and global financial market volatility pose downside risks. I.4 Balance of Risks The baseline projections of inflation and growth are conditional on the assumptions of key domestic and international macroeconomic and financial conditions described in the previous sections. The inherent uncertainties associated with such assumptions have exacerbated due to the COVID-19 pandemic and could have a significant bearing on the inflation and growth trajectories. This section explores plausible alternative scenarios to assess the balance of risks around the baseline projections. (i) Global Growth Uncertainties The COVID-19 pandemic induced the severest global recession in decades in 2020. Global growth is expected to recover to 5.5 per cent in 2021, reflecting base effects, the expected moderation in new infections, the rollout of the vaccination programme and large monetary and fiscal support. However, the uncertainty about the pandemic’s spread and its containment continues to pose high risks to the global outlook on both sides. A faster spread of mutated coronavirus variants across the world and an unequal access to vaccines across countries can result in a shallower and delayed global recovery. A surge in global bond yields – as experienced in February 2021 on reflation trade – could induce large global financial market volatility, disorderly adjustment in asset prices and disrupt global demand. In such a scenario, if global recovery is 100 bps below the baseline, domestic growth and inflation could be lower by around 40 bps and 30 bps, respectively, from the baseline trajectories. Conversely, success in containing the spread of new mutants, widespread and equitable distribution of vaccines across the world, and additional policy stimulus could provide a boost to global economic activity. In this scenario, assuming that global growth surprises by 100 bps on the upside, domestic growth and inflation could edge higher by around 40 bps and 30 bps, respectively (Charts I.11a and I.12a). (ii) International Crude Oil Prices International crude oil prices have risen sharply on production cuts and hopes of demand revival. For a net energy importer like India, the dynamics of international crude price movements have significant macroeconomic implications. A quicker containment of COVID-19 inducing higher global growth than the baseline and a faster closing of the global output gap along with sustained production cuts by the OPEC plus could lead to a sharper increase in international crude oil prices. Assuming crude oil price to be 10 per cent above the baseline, domestic inflation and growth could be higher by 30 bps and weaker by around 20 bps, respectively, over the baseline. Conversely, crude oil prices could soften if the recovery is more subdued owing to a faster spread of virus mutations, the delays in vaccination or improved supplies of shale gas. As a result, if the price of the crude falls by 10 per cent relative to the baseline, inflation could ease by around 30 bps with a boost of 20 bps to growth (Charts I.11a and I.12a).  (iii) Exchange Rate The INR has exhibited two-way movements over the past six months, reflecting both global and domestic factors. Looking ahead, heightened volatility in global financial markets, especially a snapback in global sovereign bond yields – as observed in February 2021 – could lead to a broader risk aversion to EME assets and net capital outflows. In such a scenario, should the INR depreciate by 5 per cent from the baseline, inflation could move up by around 20 bps while GDP growth could be higher by around 15 bps through increased net exports (Charts I.11b and I.12b). On the other hand, given India’s relatively better growth outlook and expectations of strong capital inflows, there could be INR appreciation. If the INR appreciates by 5 per cent relative to the baseline, inflation and GDP growth could moderate by around 20 bps and 15 bps, respectively, vis-à-vis the baseline. (iv) Food Inflation Food inflation has softened since December 2020, largely led by the sharp fall in prices of vegetables and moderation in prices of cereals. Going forward, the bumper kharif harvest, record rabi sowing, further easing of supply chains and effective supply management measures could moderate food inflation by 100 bps below the baseline. Conversely, the recent hardening of global food prices and domestic demand-supply gaps in key food items like pulses, edible oils and fats, and eggs, fish and meat could lead to persistent upward pressures of around 100 bps on food inflation. Higher inflation expectations could then add to sustained pressures on headline inflation. The baseline assumes a normal south-west monsoon in 2021 and any deviations in the actual outturn on either side would be a critical factor in determining the food as well as headline inflation (Charts I.11b and I.12b). I.5 Conclusion Domestic economic activity is widely expected to rebound strongly in 2021-22. Rapid vaccination drive, large pent-up demand, investment enhancing measures by the government and better external demand provide an upside to the baseline growth path while surge in infections, new mutants, deviation of the south-west monsoon from the baseline assumption of a normal monsoon, higher crude oil and non-oil commodity prices and global financial market volatility impart downside risks to the baseline growth path. Lingering supply chain disruptions, rising global crude oil prices and stronger pass-through of input costs could push headline inflation above the baseline. There is also the probability of softer international crude oil prices on the back of a weaker than anticipated global demand, bountiful foodgrains production and effective supply management coming together to ease inflation more than anticipated. The evolving COVID-19 trajectory and progress on vaccination remain the key drivers of economic activity and inflation, globally and in India. _________________________________________________________
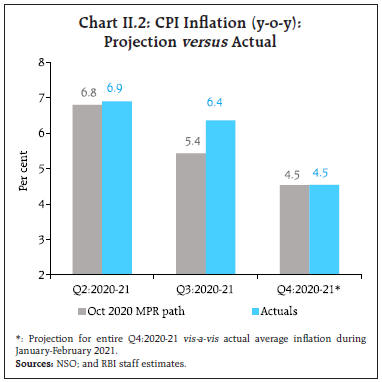
II. Prices and Costs In 2020-21, inflation breached the upper tolerance band of 6 per cent for six consecutive months in the post-lockdown period (June-November 2020) due to a series of cost-push shocks – supply chain disruptions; weather shocks; higher crude oil and other commodity prices; and higher taxes. The sharp correction during December-January was reversed on adverse base effects in February. Core inflation remained sticky at elevated levels. Costs of farm and industrial inputs recovered with the gradual unlocking of the economy and rural wage growth moderated although it remained higher than in the pre-lockdown period. In the months following the publication of the October 2020 MPR, inflationary pressures got accentuated and headline inflation1 remained above the upper tolerance threshold. Core inflation also stayed sticky at elevated levels. During December 2020-January 2021, however, there was a sharp correction and inflation eased significantly, moving closer to the target, only to reverse to 5.0 per cent in February 2021, primarily due to adverse base effects. Core inflation (CPI inflation excluding food and fuel) surged to a 28-month high of 6.0 per cent in February 2021 under the combined effects of rising industrial raw material prices, record high petroleum product prices and the higher cost of doing business in the post-lockdown period (Chart II.1). The Reserve Bank of India (RBI) Act enjoins the RBI to set out deviations of actual inflation outcomes from projections, if any, and explain the underlying reasons thereof. The October 2020 MPR had projected moderation in CPI inflation from 6.8 per cent in Q2:2020-21 to 5.4 per cent in Q3 and 4.5 per cent in Q4. In Q3, actual inflation was 100 basis points (bps) above projection (Chart II.2). A sharp, unanticipated increase in food inflation – double-digit inflation in eggs, meat and fish (due to fragmented supply chains), pulses (tight demand supply balance), edible oils (high international prices), and vegetables (unseasonal rains) – led to this substantial overshoot. Retail price margins for food also increased, with the persistence of supply chain disruptions. International crude oil prices (Indian basket) jumped from the baseline assumption of US$ 40.9 per barrel for H2:2020-21 to US$ 61.2 per barrel by February 2021. Gold prices remained elevated in Q3:2020-21 over COVID-19 concerns, supported by highly accommodative monetary policies in the major advanced economies. Cost-push pressures also impinged on core inflation more than anticipated. In Q4 (January-February), the correction in food prices resulted in actual inflation aligning with the projection (Chart II.2). 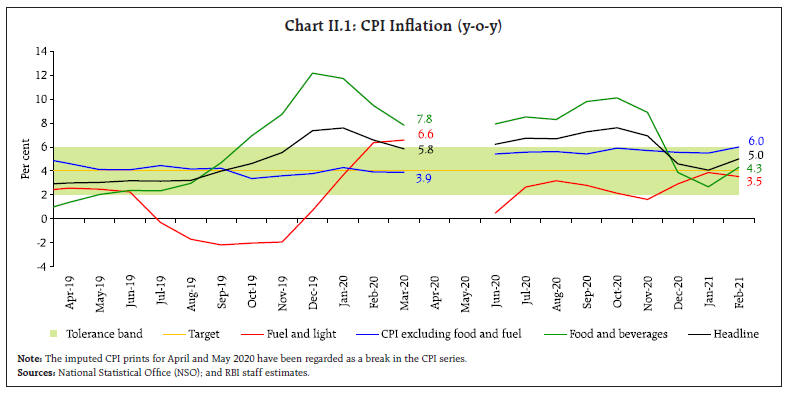
 II.1 Consumer Prices The sharp upward movement of inflation to a peak of 7.6 per cent in October 2020 came about from a pick-up in price momentum in food as well as in the core category.2 Thereafter, strong favourable base effects brought about a moderation in headline inflation to 6.9 per cent in November 2020, more than offsetting positive momentum in all these components. In December 2020, a negative momentum in headline inflation due to a sharp decline in food prices, along with favourable base effects, resulted in headline inflation declining by 2.3 percentage points. In January 2021, headline inflation moderated further due to a large negative momentum engendered by food prices. In February 2021, an adverse base effect of around 70 bps resulted in a substantial pick-up in inflation (Chart II.3). Reflecting broad-based price pressures, the distribution of CPI group/sub-group inflation in 2020-21 was centred at 4.9 per cent, higher than the sub-4 per cent levels seen in recent years (Chart II.4). With several sub-groups exhibiting double-digit inflation, the inflation distribution also exhibited a fat tail, pushing mean headline inflation in excess of 6.0 per cent. The diffusion indices of price changes in CPI items on a non-seasonally adjusted basis3 increased in January-February 2021, indicative of price pressures across the CPI basket (Chart II.5).4 II.2 Drivers of Inflation The relative role of various demand and supply shocks impinging upon the inflation dynamics can be captured through vector autoregression (VAR) estimates and historical decomposition.5 The high inflation episode in Q3:2020-21 was predominantly due to supply shocks. In Q4, supply side factors turned benign pulling down headline inflation. On the other hand, easy monetary conditions and the firming up of asset and crude oil prices contributed positively to the deviation of inflation from trend levels in Q3 and Q4. Muted demand conditions and moderation in rural wage growth pulled down inflation in Q3 and Q4, offsetting these effects (Chart II.6a). 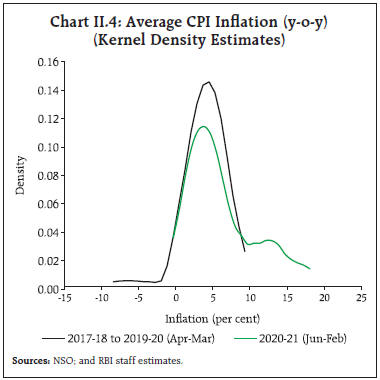 High volatility in perishable goods (non-durable goods with a 7-day recall6) from supply shocks in both directions had a significant bearing on the inflation trajectory. With the surge in vegetable prices, the contribution of perishables to overall inflation increased to 55.3 per cent during September-November 2020 from 46.8 per cent in June-August 2020. Subsequently, as vegetable prices corrected, perishables’ contribution decreased sharply to 32.0 per cent during December 2020-January 2021. In February 2021, following the lower rate of deflation in the prices of vegetables, perishables’ share increased to 38.6 per cent. Reflecting the increase in prices of protein-based food, edible oils and other food items, the contribution of semi-perishable goods (non-durable goods with a 30-day recall) remained elevated (Chart II.6b). Imported components contributed 0.5 percentage points to headline inflation in February 2021, driven by gold, silver, edible oils and higher domestic taxes on petroleum products (Chart II.6c). 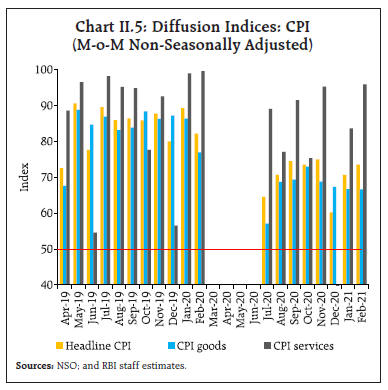 Food Group Food inflation rose sharply to 10.1 per cent in October 2020 and remained above 6 per cent for 14 consecutive months till November 2020. It moderated quickly in the subsequent months to 2.7 per cent in January 2021 before picking up to 4.3 per cent in February 2021. These large variations were primarily driven by movements in prices of vegetables (Chart II.7). The softening of inflation in respect of cereals and products, milk and sugar and confectionery also aided the easing in food inflation. On the other hand, there were upward pressures from oils and fats, non-alcoholic beverages, prepared meals and snacks and fruits. Despite a sizeable moderation, inflation in five out of twelve food sub-groups was still in double digits in February 2021. Seven of the twelve sub-groups recorded increases above the historical average (Chart II.8). Rural and urban food inflation exhibited broadly similar movements, with no significant difference between month-over-month changes in prices of food and its sub-groups in rural and urban areas.7 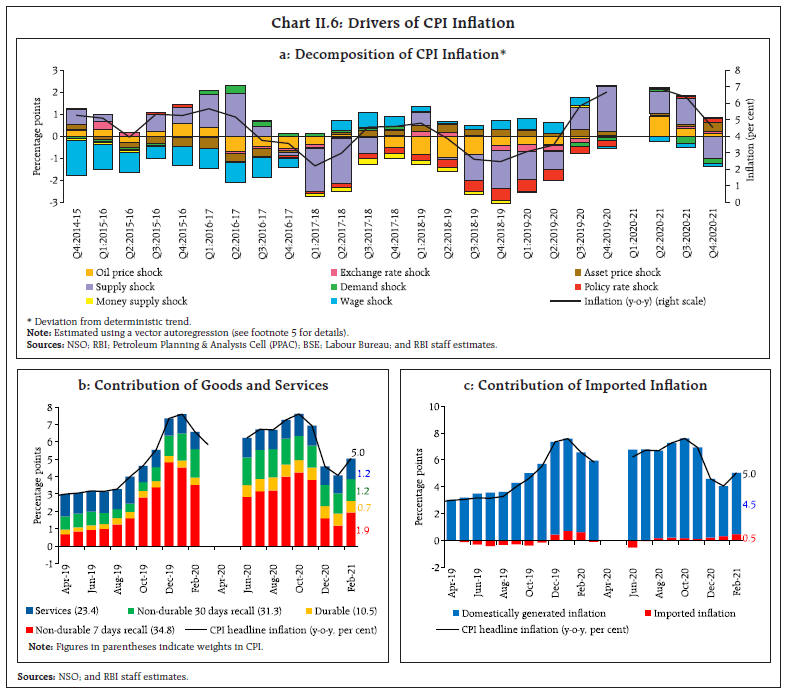 In the case of cereals (weight of 9.7 per cent in the CPI and 21.1 per cent in the food and beverages group), a bumper kharif rice production and record buffer stocks – around 6.7 times the norms for rice and 2.1 times for wheat as on March 16, 2021 – led to easing in inflation to (-)0.3 per cent in February 2021 from 7.9 per cent in June 2020. Higher rabi sowing has kept the price pressures subdued despite higher procurement and exports of both rice and wheat. 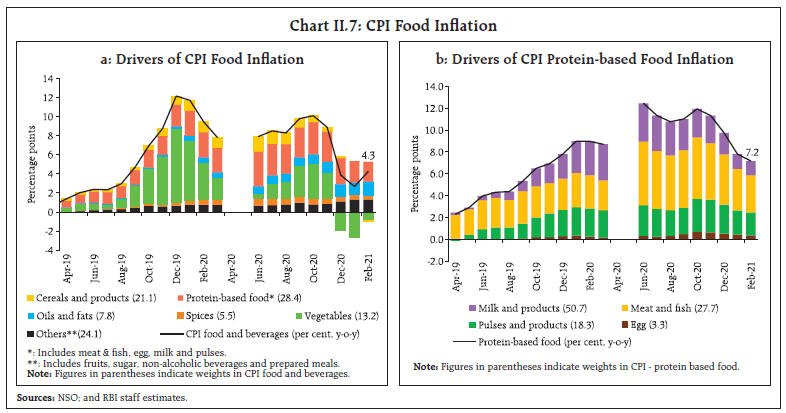 Inflation in prices of vegetables (weight of 6.0 per cent in the CPI and 13.2 per cent in the food and beverages group) rose steeply to a peak of 22.1 per cent in October 2020 and then corrected rapidly to move into deflation during December 2020-February 2021, driven primarily by a large fall in onion, tomato and potato prices (Chart II.9). Potato price inflation reached a peak of 107.0 per cent in November 2020. Higher imports and fresh arrivals of early rabi production in the market led to a sharp easing in prices during December 2020-February 2021, with a deflation of (-) 21.3 per cent in February 2021. 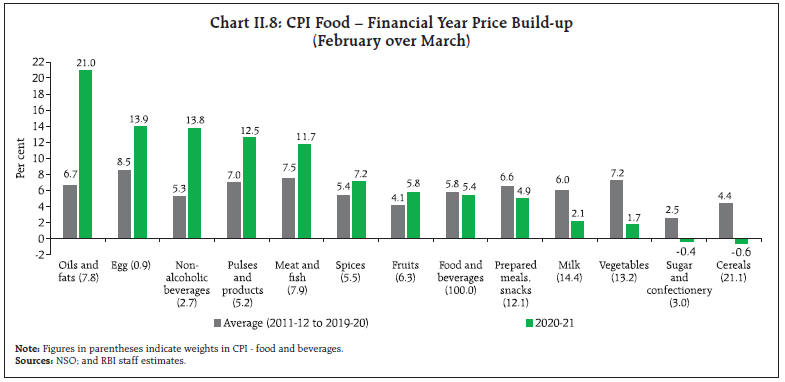
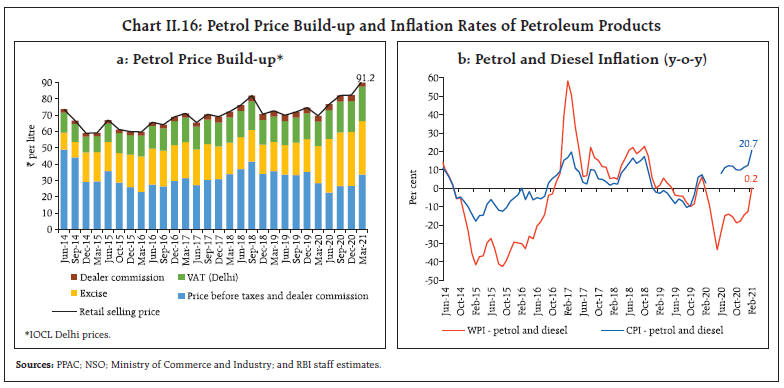
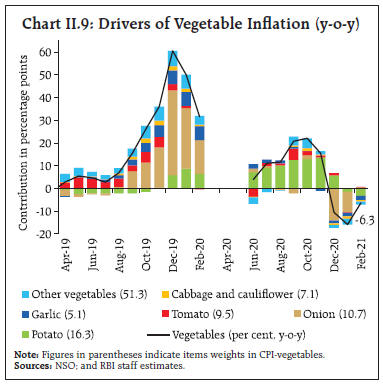 Inflation in onion prices, which was in negative territory during August-September 2020, witnessed substantial price pressures during September-November 2020 as excess rainfall in major producing regions of Madhya Pradesh, Gujarat, Karnataka and Maharashtra damaged the kharif crop and impacted late kharif production, resulting in lower market arrivals. To contain the escalation in prices, the Government imposed an export ban on onions in September 2020 (removed in January 2021), increased imports, released buffer stocks and imposed stock holding limits on wholesalers and retailers. These steps, along with fresh arrivals, led to onion prices moving into deflation during November 2020-January 2021. Onion prices picked up again in February 2021, however, due to drop in arrivals on account of unseasonal rainfall in January 2021 in Maharashtra. In the case of the third key vegetable, i.e., tomatoes, low arrivals from the key producing regions in Karnataka and Maharashtra on the back of excess rainfall pushed inflation to a peak of 54.5 per cent in September 2020. Thereafter, with an increase in fresh arrivals, prices eased beginning October 2020. In protein-based food items, inflation in pulses (weight of 2.4 per cent in the CPI and 5.2 per cent in the food and beverages group) was in double digits throughout 2020-21. To improve domestic supplies, the government eased restrictions and issued licenses for imports, reduced import duties on masur, released 2 lakh tonnes of tur (arhar) from the buffer stock and extended the time limit for import of tur under the import quota of 4 lakh tonnes for 2020-21. Reflecting these measures, as well as the arrival of kharif pulses and favourable base effects, pulses inflation moderated to 12.5 per cent in February 2021 from 18.3 per cent in October 2020. The production of pulses at 244 lakh tonnes in 2020-21 (second advance estimates for 2020-21) is expected to augment the domestic availability and improve the stock-use ratio (Chart II.12). Pulses inflation can thus be expected to moderate in the coming months, given the past relationship between production/stocks and prices8, although pressures may persist in some items like tur and urad. Among animal protein-rich items, inflation in egg, meat and fish also remained in double digits during most of 2020-21. It eased during November 2020 - February 2021, largely due to the fall in prices of chicken from improved supplies and a decline in demand due to bird flu during January 2021. Prices of mutton and pork, however, remained high due to supply bottlenecks and higher demand for protein-based food items. 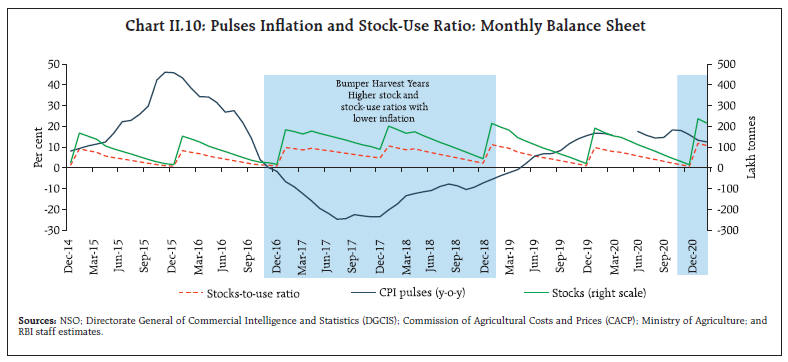 Prices of milk and products (weight of 6.6 per cent in the CPI and 14.4 per cent in the food and beverages group) remained muted in H2:2020-21, reflecting a quick restoration of supply chains of the well-established system of cooperatives amidst lower demand from the bulk segment. Prices of sugar and confectionery (weight of 1.4 per cent in the CPI and 3.0 per cent in the food and beverages group) eased during September 2020 - February 2021 on the back of expectations of a bumper crop and higher domestic production even as international sugar prices increased due to concerns over lower global availability in 2020-21.9 Prices of oils and fats (weight of 3.6 per cent in the CPI and 7.8 per cent in the food and beverages group) remained one of the major pressure points throughout the year. Higher demand for mustard oil coupled with elevated international prices10 (particularly palm oil and soybean oil) resulted in oils and fats inflation peaking at around 20 per cent in December 2020-February 2021. The government reduced the basic customs duty (BCD) on crude palm oil from 37.5 per cent to 27.5 per cent effective November 27, 2020 and then revised it to 32.5 per cent [including the Agricultural Infrastructure Development Cess (AIDC)] effective February 2, 2021. Mustard oil and refined oil were the highest contributors to elevated edible oil inflation. Retail Margins Average retail price margins over wholesale prices increased across all the major sub-groups (cereals, vegetables, edible oils and pulses) during the post-lockdown period, pulling up headline inflation. The margins were higher in edible oils, vegetables and pulses than in the other two sub-groups (Chart II.11).11 CPI Fuel Group Inflation in fuel prices initially moderated from 3.2 per cent in August 2020 to 1.6 per cent in November 2020, due to a decline in LPG and PDS kerosene prices and favourable base effects. Fuel inflation then increased to 3.5 per cent in February 2021, led by prices of LPG, kerosene and dung cake (Chart II.12a). The movements in LPG inflation largely reflected the lagged impact of international prices (Chart II.12b). PDS-kerosene prices were in deflation throughout 2020-21, as international prices to which they are linked have been below pre-COVID levels since April 2020 (Chart II.12c). CPI excluding Food and Fuel CPI inflation excluding food and fuel, or core inflation, remained sticky and hovered between 5.4 per cent and 6.0 per cent during September 2020 to February 2021. Excluding petrol, diesel, gold and silver also, core inflation remained elevated (between 4.5 per cent and 5.1 per cent) over this period (Chart II.13). While the price build-up in the core categories was similar to the historical average, considerable variation was observed across subgroups: transport and communication, pan, tobacco and intoxicants, personal care and effects, health and recreation and amusement exhibited substantially higher build-up than the long-term average whereas clothing and footwear, housing, household goods and services and education exhibited subdued build-ups (Chart II.14). 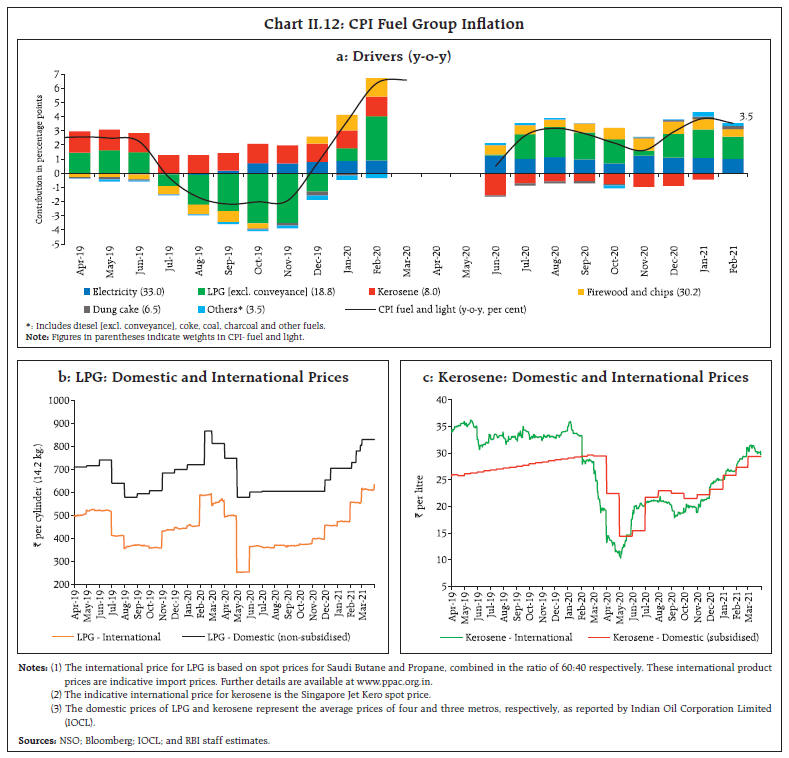 In H2:2020-21, crude oil prices (Indian basket) jumped by nearly 50 per cent – from around US$ 41 per barrel in September 2020 to US$ 61 per barrel in February 2021. This sharp rise in international prices, along with the non-reversal of the substantial post-lockdown hike in excise duties and value added taxes (VATs), resulted in domestic petrol and diesel pump prices reaching historical highs by February 2021 (Chart II.15b). The combined share of central excise and states’ value added tax (VAT) in petrol prices has risen from ₹22 per litre (31 per cent) in mid-2014 and ₹38 per litre (54 per cent) in March 2020 to ₹53 per litre (61 per cent) in February 2021 (Chart II.16a). While the WPI measures basic prices less trade discounts, thereby leaving out indirect taxes, retail prices are inclusive of taxes. CPI petrol and diesel inflation has been in double digits since July 2020 and was at 20.7 per cent in February 2021; in contrast, WPI petrol and diesel prices were in sharp double digit deflation for most part of the financial year, with February 2021 seeing a reading of only 0.2 per cent (Chart II.16b). 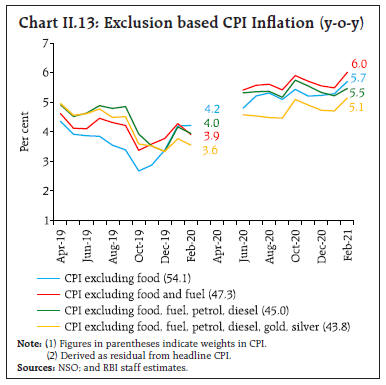
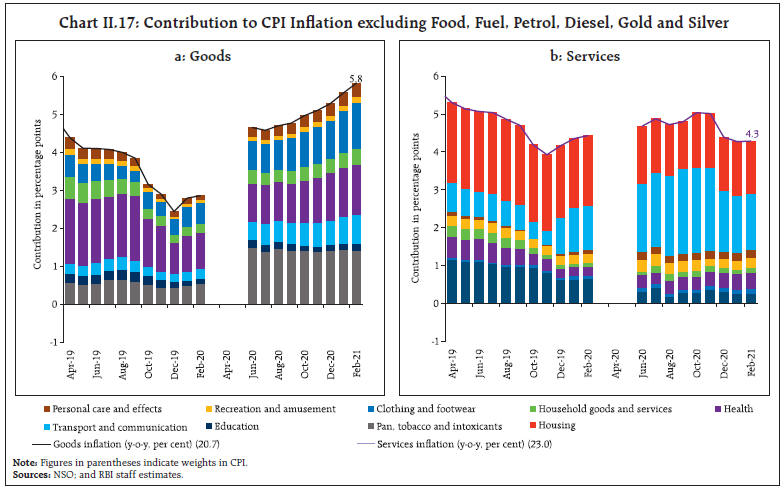
 Compared to pre-COVID levels, measures of core inflation remain elevated, indicative of significant cost-push pressures across sectors in the post-lockdown period. Price inflation in the goods component, i.e., excluding food, fuel, petrol, diesel, gold and silver (with a weight of 20.7 per cent in CPI) rose to 5.8 per cent in February 2021 from 4.7 per cent in August 2020, driven by health care goods – particularly medicines, clothing and footwear goods and transportation goods like motor vehicles (Chart II.17a). Core services inflation (weight of 23.0 per cent in CPI) rose from 4.0 per cent in August 2020 to 5.0 per cent in November 2020, primarily due to higher prices of recreation, education, transportation and communications services. Subsequently, core services inflation moderated to 4.3 per cent in January-February 2021 as inflation in prices of communication dropped sharply due to favourable base effects along with some moderation in education and recreation services inflation. Housing inflation, which primarily includes rental charges, at 3.2 per cent during November 2020 - February 2021 was lower than the pre-COVID levels; however, it was the second largest contributor to core services inflation (Chart II.17b). 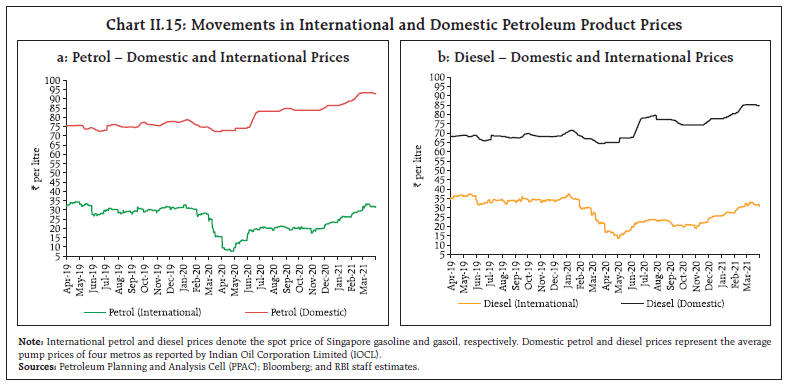
 In sum, headline inflation dynamics in the post-lockdown period were primarily driven by goods inflation. Services inflation is the more durable component of the CPI and drives goods inflation over time (Box II.1). Box II.1: CPI Goods and Services: Do they Converge after Shocks? Cross-country evidence suggests that services inflation, on average, exceeds goods inflation due to a variety of factors such as lower productivity in non-tradable services (Balassa-Samuelson effect), higher mark-ups in services due to reduced competition and increased demand for services as per capita income rises (Ferrara 2019, Zaman 2015). In the post-lockdown period, however, CPI goods inflation (with a weight of 76.6 per cent in the CPI basket) exceeded CPI services (weight of 23.4 per cent) inflation substantially, with the gap increasing from 2.2 percentage points in June 2020 to 3.8 percentage points in September 2020. In February 2021, the gap narrowed to around 30 bps. In the past too, there have been episodes of goods and services inflation exhibiting divergent patterns, as during September 2016 to September 2019. Movements in CPI goods inflation excluding vegetables and gold and CPI services inflation (barring the period influenced by the statistical HRA12 impact), however, tend to show greater co-movement (Chart II.1.1). For India, the evidence suggests that prices of goods and services exhibit co-movement over time, i.e., the two series are cointegrated (Table II.1.1). This is consistent with the cross-country evidence (Peach, 2004). Given the evidence of long-run cointegration, the short-run dynamics can be further explored through a Vector Error Correction Model (VECM). The VECM analysis indicates a significant error correction (EC) term in CPI goods prices, while it was found to be insignificant in the case of CPI services prices. This suggests that following a shock resulting in a divergence from the long run equilibrium, it is goods prices that make the necessary adjustment to restore equilibrium. 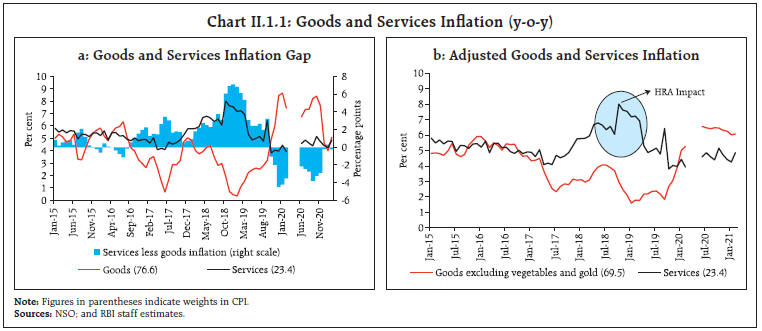
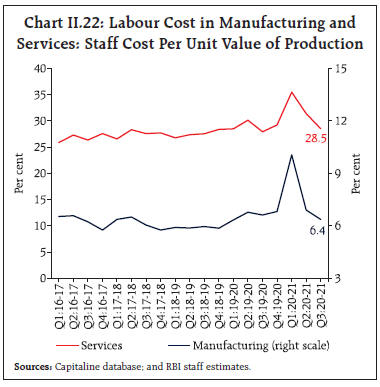
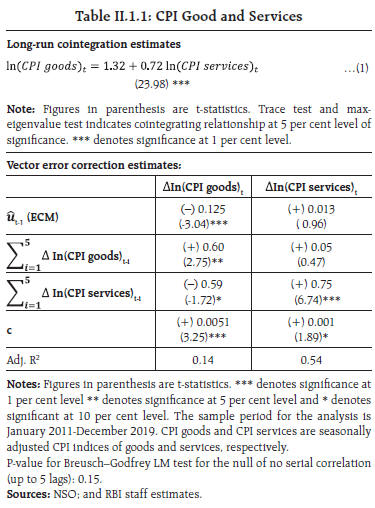 CPI goods prices are considerably influenced by the volatility induced by perishables such as vegetables and can result in divergences from CPI services prices over short periods. Services inflation, on the other hand, represents the relatively sticky component in the CPI basket and can spill over to goods inflation, resulting in generalised inflationary pressures. References: Ferrara, L. (2019), “What is Behind the Change in the Gap between Services Price Inflation and Goods Price Inflation?”, ECB Economic Bulletin Boxes, 5. Peach, R.W., Rich, R., and Antoniades, A. (2004), “The Historical and Recent Behavior of Goods and Services Inflation”, Federal Reserve Bank of New York, Economic Policy Review, December. Zaman, S. (2015), “The Gap Between Services Inflation and Goods Inflation”, Economic Trends, Federal Reserve Bank of Cleveland. | In addition to exclusion-based measures, trimmed means of inflation provide a measure of underlying inflation dynamics and are computed by statistically eliminating items with extremely positive and negative inflation. The trimmed mean indicators showed easing of inflation over the period under review in view of the omission of a few large outliers – such as vegetables, pulses, edible oils, transport fare, and pan, tobacco and intoxicants – in either direction. In contrast, exclusion-based measures, which capture persistent trends in inflation by eliminating ex-ante identified idiosyncratic and volatile components, suggest stickiness in inflation (Charts II.13 and II.18). Other Measures of Inflation Inflation measured by sectoral CPIs for agricultural labourers (CPI-AL) and rural labourers (CPI-RL) remained below headline CPI inflation in H2:2020-21. Lower inflation in food items along with their higher weight in CPI-AL and CPI-RL and subdued inflation in fuel, and clothing and footwear groups contributed to the relatively lower inflation prints for CPI-AL and CPI-RL. Inflation in terms of CPI for industrial workers (CPI-IW) though their gap narrowed. also remained below the headline CPI during H2.13 The price build-up in CPI-IW for clothing, housing and miscellaneous groups was lower relative to the headline CPI; that of fuel, and pan, tobacco and intoxicants groups was higher; and the fall in food prices was muted.14 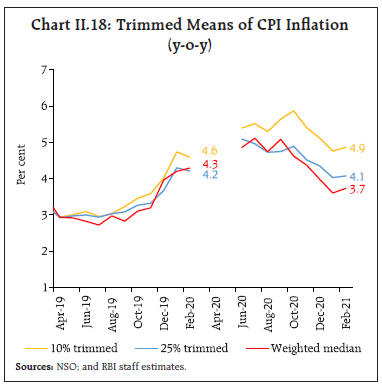 WPI inflation also remained below CPI inflation in H2:2020-21, although it has quickly inched up close to CPI inflation in recent months (Charts II. 19a). From its trough in May 2020, WPI inflation charted a V-shaped uptrend in view of a sharp rise in fuel and non-food commodity prices. In contrast, WPI food inflation decelerated continuously from September 2020 and fell into negative territory in January 2021 before moving up in February 2021 to 3.3 per cent. Average WPI food inflation during September 2020 to February 2021 at 3.7 per cent was way lower than average CPI food inflation at 6.6 per cent, with inflation across major food sub-groups, except vegetables, milk and products, oils and fats, recording lower prints in the WPI than in the CPI. The largest deviation between CPI and WPI emanated from inflation in petroleum products, especially in petrol and diesel, reflecting the wedge due to tax components. Similarly, tax implications were visible in prices for pan, tobacco and intoxicants – while CPI for these items remained in double digits (average 10.7 per cent), inflation in WPI beverages, and tobacco products averaged 0.2 and 2.5 per cent, respectively, during September 2020 to February 2021 (Chart II.19b). 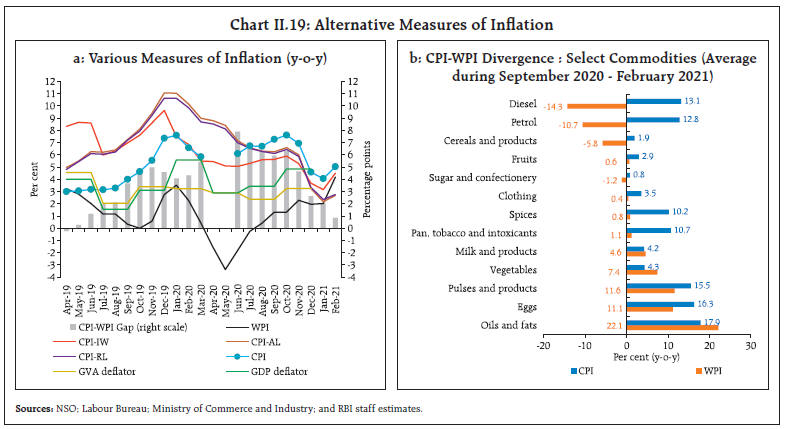 Inflation measured in terms of gross value added (GVA) and gross domestic product (GDP) deflators clocked a pick-up from Q1:2020-21 to Q3, broadly in alignment with WPI inflation. II.3 Costs The measures of cost inflation – farm inputs and industrial raw materials derived from WPI – moved higher with the gradual unlocking of the economy, albeit with transient dips (Chart II.20). The firming up of global crude oil prices during H2:2020-21 impacted the prices of inputs such as high-speed diesel, naptha, aviation turbine fuel, and furnace oil. Minerals and non-food articles also generally rose during October 2020-February 2021. Prices of fibres emerged out of deflation in January 2021 in line with a pick-up in raw cotton and raw silk prices. Reflecting this, inflation in cotton yarn price registered sharp uptick. 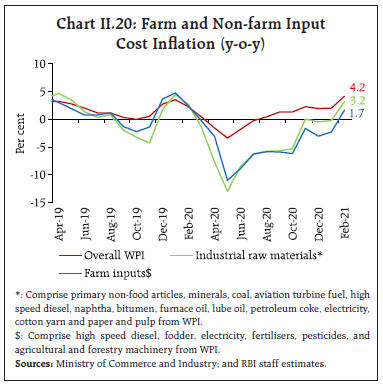 Within farm sector inputs, fodder price inflation remained elevated in double digits, during October 2020 to February 2021 due to the damage from excess rains during September-October 2020. Inflation in fertilisers remained muted in line with subdued cost of raw materials such as natural gas. Prices of electricity – a key constituent of both industrial and farm inputs – remained in deflation on an average during H2, barring a transient spike in November. Inflation in prices of agricultural machinery and implements recorded a modest increase during November 2020-February 2021. Nominal rural wages for both agricultural and non-agricultural labourers hardened during H1:2020-21, reflecting labour shortages during the lockdown period and the hike in wages by ₹20 under the Mahatma Gandhi National Rural Employment Guarantee (MGNREGA) scheme effective April 1, 2020. As the unlock phase progressed and labour availability improved, wage growth moderated in H2 although it remained higher than in the pre-lockdown period (Chart II.21). Growth in the value of production in Q3:2020-21 for listed firms in the manufacturing and services sectors outpaced the rise in staff costs. As a result, unit labour costs (measured as a ratio of staff cost to value of production) decreased during Q3:2020-21, reverting towards pre-COVID levels. Unit labour costs moderated from 6.9 per cent in Q2:2020-21 to 6.4 per cent in Q3:2020-21 for firms in the manufacturing sector and from 31.4 per cent to 28.5 per cent respectively, for the services sector firms (Chart II.22). Manufacturing, services and infrastructure firms polled in Reserve Bank’s enterprise surveys15 reported an increase in salary outgo in Q4:2020-21, with expectations of a further rise in Q1:2021-22 as the level of employment is likely to gradually edge up. Input costs were also expected to intensify further in Q1 and continue in Q2 and Q3 of 2021-22 with the pace of increase moderating a tad for the manufacturing sector. The surveyed firms reported passing through the costs to their selling prices in Q4:2020-21. Selling prices are expected to gain further traction in Q1:2021-22 and remain firm in Q2 and Q3 for all the three sectors (Chart II.23). 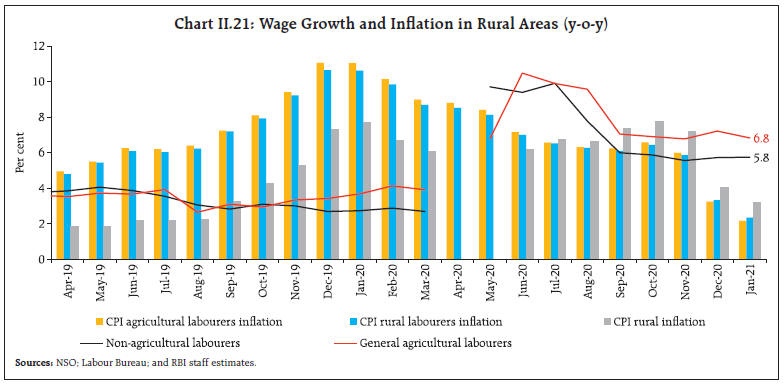
 Manufacturing firms polled for the purchasing managers’ index (PMI) reported an increase in input prices in Q3:2020-21, with a further firming up in Q4 from higher costs of chemicals, metals, minerals, cotton and plastic; higher cost pressures were passed through to the clients resulting in an increase in selling prices. PMI services firms also reported continued increase in input prices in Q3 and Q4, driven by fuel, with the sharpest increase reported in prices of consumer services. Despite an increase in input costs, services sector firms reported lower selling prices in efforts to boost sales. II.4 Conclusion In 2020-21, inflation breached the upper tolerance band of 6 per cent for six consecutive months in the post-lockdown period (June-November 2020) due to a series of cost-push shocks – supply chain disruptions; weather shocks; higher crude oil and other commodity prices; and higher taxes. Inflationary pressures persisted despite a bumper kharif harvest. The increase in petrol and diesel prices is showing up in trade and transport costs, taxi and auto fares, and its second-round effects could push-up the prices of goods and services further in a broad-based manner, with firms regaining pricing power. Effective supply measures and tax rationalisation are critical to help anchor inflation expectations. If inflation remains close to the target on a durable basis, it can then provide monetary policy the space to adequately support the nascent recovery. _________________________________________________________
III. Demand and Output After the unprecedented contraction in Q1, real gross domestic product (GDP) recorded sequential upturn in Q2 and regained positive territory in Q3 with the ambit of the recovery broadening to encompass a wider spectrum of sectors, supported by a significant decline in COVID-19 infections. The recent increase in COVID infections, if not contained, could push back the normalisation process and impede the broader revival of economic activity. Economic activity in India in H2:2020-21 turned out to be more resilient than anticipated in the October 2020 MPR, supported by a significant decline in new COVID-19 infections from the mid-September 2020 peak and the rollout of the vaccination drive from mid-January 2021. After the unprecedented contraction in Q1, real gross domestic product (GDP) recorded sequential upturn in Q2 and regained positive territory in Q3 with the ambit of the recovery broadening to encompass a wider spectrum of sectors since then. On the supply side too, the sustained resilience of agriculture and allied activities was complemented by manufacturing and services sector activity gaining some momentum. As a result, real gross value added (GVA) recorded positive growth in Q3 and is expected to be positive in Q4 also. III.1 Aggregate Demand Real GDP contracted by 8.0 per cent in 2020-21, according to the National Statistical Office’s (NSO) second advance estimates (SAE), although some slack can be attributed to on-budgeting of past subsidy payments in Q4 (Chart III.1a and Table III.1). The recovery in H2:2020-21 was on the back of revival in government expenditure and fixed investment and easing of the contraction in private consumption. Quarter-on-quarter seasonally adjusted annualised (qoq-SAAR) growth rates, however, moderated in Q3 and Q4 suggesting some flattening of momentum (Chart III.1b). 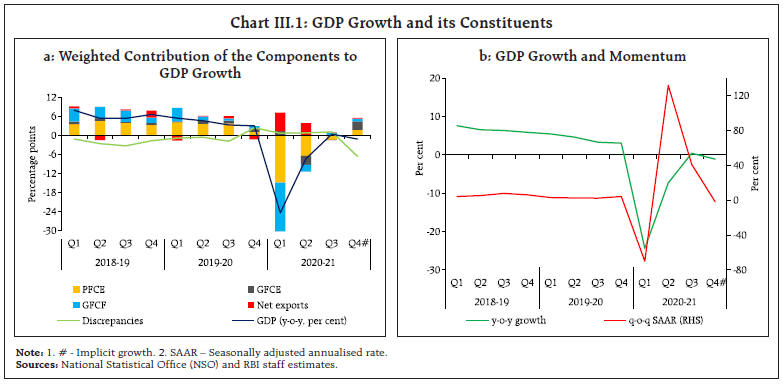
| Table III.1: Real GDP Growth | | (y-o-y, per cent) | | Item | 2019-20 | 2020-21 | Weighted Contribution* | 2019-20 | 2020-21 | | 2019-20 | 2020-21 | Q1 | Q2 | Q3 | Q4 | Q1 | Q2 | Q3 | Q4# | | Private final consumption expenditure | 5.5 | -9.0 | 3.1 | -5.1 | 7.6 | 6.5 | 6.4 | 2.0 | -26.3 | -11.3 | -2.4 | 3.1 | | Government final consumption expenditure | 7.9 | 2.9 | 0.8 | 0.3 | 1.8 | 9.6 | 8.9 | 12.1 | 12.8 | -24.0 | -1.1 | 29.2 | | Gross fixed capital formation | 5.4 | -12.4 | 1.7 | -4.0 | 13.3 | 3.9 | 2.4 | 2.5 | -46.4 | -6.8 | 2.6 | 2.8 | | Exports | -3.3 | -8.1 | -0.7 | -1.6 | 3.0 | -1.3 | -5.4 | -8.8 | -22.0 | -2.1 | -4.6 | -3.7 | | Imports | -0.8 | -17.6 | -0.2 | -4.0 | 9.4 | -1.7 | -7.5 | -2.7 | -41.1 | -18.2 | -4.6 | -4.3 | | GDP at market prices | 4.0 | -8.0 | 4.0 | -8.0 | 5.4 | 4.6 | 3.3 | 3.0 | -24.4 | -7.3 | 0.4 | -1.1 | *: Component-wise contributions to growth do not add up to GDP growth because change in stocks, valuables and discrepancies are not included,
#: Implicit growth.
Source: National Statistical Office (NSO). | GDP Projections versus Actual Outcomes The October 2020 Monetary Policy Report (MPR) projected GDP growth at (-) 9.8 per cent for Q2:2020-21, (-) 5.6 per cent for Q3 and 0.5 per cent for Q4, with risks tilted to the downside. Actual outcomes in terms of the NSO’s SAE overshot these projections by 250 and 600 basis points in Q2 and Q3, respectively (Chart III.2), which may be largely attributed to faster than anticipated reduction in new COVID-19 infections in the country. The upside surprise in Q2 and Q3 largely stemmed from a better-than-expected performance in gross fixed capital formation. Data for Q4:2020-21 are expected on May 31, 2021. III.1.1 Private Final Consumption Expenditure Private final consumption expenditure (PFCE) – the mainstay of aggregate demand, severely dented during the pandemic – revived in H2:2020-21 as spending expanded from essential commodities and services towards discretionary items on the back of gradual relaxation of restrictions. The contraction in real PFCE moderated to 2.4 per cent in Q3 from 11.3 per cent in Q2. Spending on transport, hotels and restaurants, recreation and culture, which together contribute around 20 per cent to PFCE, also began improving in Q4. Several high frequency indicators of private consumption crossed pre-COVID levels, attesting to a broad-based momentum. Drilling down further reveals a divergence between urban and rural demand, with the former suffering the maximum damage and taking longer time to recover due to the loss of employment and heightened uncertainty. Some coincident and proximate high frequency indicators show that urban consumption started inching up from Q3:2020-21 and gained further strength in Q4 with the easing of restrictions. Passenger vehicle sales remained robust since August and posted double-digit growth in January and February 2021, partly reflecting shifting of preferences towards own vehicles over public transportation in the wake of the pandemic. The production of consumer durables, that had collapsed during H1, got revitalised and surpassed pre-COVID levels in December 2020 (Chart III.3a). Credit card outstanding and other personal loans, however, remained subdued (Chart III.3b). Domestic air passenger traffic, is still tepid and around two-third of pre-COVID-19 levels, reflecting lackluster activity related to tourism and entertainment, and with business meetings increasingly preferring the virtual mode. 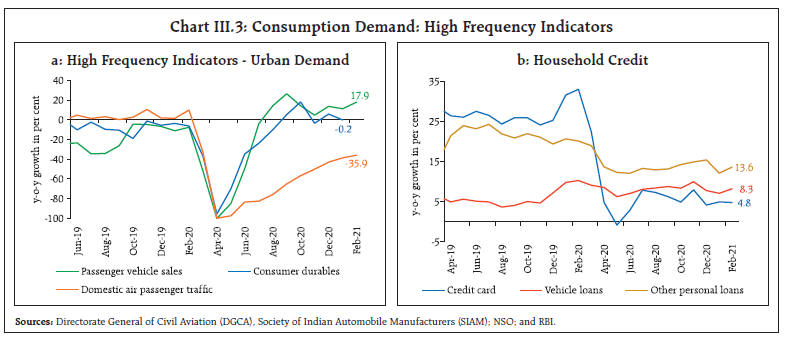 Rural consumption recouped quickly and remained resilient on the back of record kharif production, sustained employment under the Mahatma Gandhi National Rural Employment Guarantee Act (MGNREGA), and cash transfers under PM Kisan Samman Nidhi Yojana and other schemes. The households that sought employment under the MGNREGA scheme were 63 per cent higher in Q3:2020-21 and remained elevated in Q4. Indicators of rural demand – improved rabi acreage during 2020-21; higher production of fertilisers; and accelerated tractor sales during November-February – augur well for a brighter outlook. Motorcycle sales have remained in expansion zone since August 2020 (Chart III.4). The consumer non-durables output witnessed expansion in December 2020, before contracting in January 2021. Unemployment rates in both rural and urban areas recorded declines during H2 and supported private consumption. The labour force participation rate improved considerably in H2 vis-à-vis H1 but remains below pre-COVID levels. Nonetheless, the available data from different sources indicate that employment conditions have improved considerably in H2 (Chart III.5).
III.1.2 Gross Fixed Capital Formation The upturn in fixed investment gained traction during H2:2020-21, although it continues to be weighed down by surplus capacity and uncertainty surrounding the outlook. Congenial financial conditions are expected to continue supporting the recovery in fixed investment (Box III.1). Gross fixed capital formation (GFCF) expanded by 2.6 per cent on year-on-year basis in Q3 and is estimated to rise by 2.8 per cent in Q4. For the full year 2020-21, GFCF is estimated to have contracted by 12.4 per cent, given the sharp downturn in H1. The share of GFCF in aggregate GDP inched up to 32.8 per cent in H2 from 28.5 per cent in H1 and 31.9 per cent in H2:2019-20. Real estate and construction activity gained some momentum from Q3 – particularly in rural and semi-urban areas and affordable segments in urban areas – benefitting from lower mortgage rates, favourable pricing and a slash in stamp duty across several states. Among its proximate coincident indicators, steel consumption rose at a robust pace in January and February 2021 on top of double-digit growth in the preceding two months. Investment in machinery and equipment is also recovering as reflected by imports of capital goods remaining in the positive zone since December 2020 (Chart III.6a). The production of capital goods attained positive territory in December 2020 but shrank in January 2021. The capacity utilisation (CU) in the manufacturing sector improved to 66.6 per cent in Q3 from the previous quarter (Chart III.6b). Seasonally adjusted CU also increased to 65.2 per cent in Q3 from 64.4 per cent in the previous quarter. 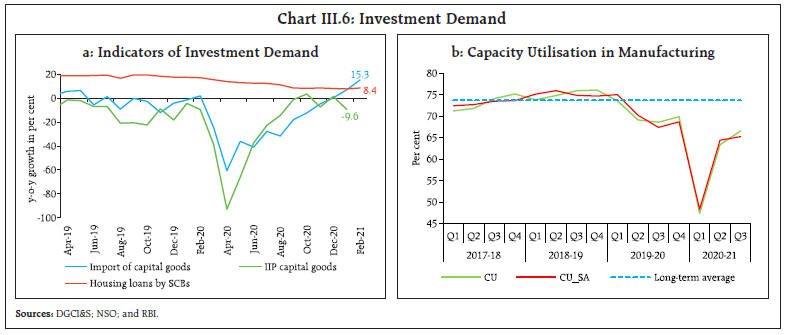
Box III.1: Investment and Financial Conditions Domestic financial conditions eased considerably with the onset of the pandemic as reflected in large drops in interest rates/spreads across the spectrum and ample surplus liquidity in the system on the back of conventional and unconventional policy measures by the Reserve Bank. The availability and cost of finance are amongst the important drivers of investment. A financial condition index (FCI) that is a summary indicator of financial conditions, helps to gauge their impact on investment activity. Following Kongsamut et. al. (2017), a FCI for India is constructed with variables drawn from equity, debt, money and forex markets. Using data from Q1:2002 to Q1:2020, the FCI includes the following five standardised variables – government securities (G-Sec) 10-year benchmark yield, corporate AAA bond spread over G-Sec yield, Nifty-50 return, repo rate and net foreign portfolio inflows – based on a preliminary analysis of their correlation and impact on investment. Dynamic factor model (DFM)1 and vector auto regression (VAR)2 approaches are used to construct FCIs (FCI1 and FCI2, respectively) for a robust analysis. Negative values of FCIs denote easier financial conditions while positive values indicate tighter financial conditions. Both the FCIs exhibit broadly similar directional changes (Chart III.1.2). The FCIs capture the tightening of financial conditions during the global financial crisis in 2008 and later in 2012-13 (associated with the period of high inflation and monetary tightening) as well as the recent easing of financial conditions after the pandemic. In terms of the DFM-based FCI, financial conditions at present are at their easiest since 2003. 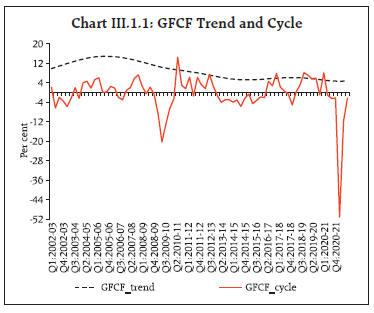
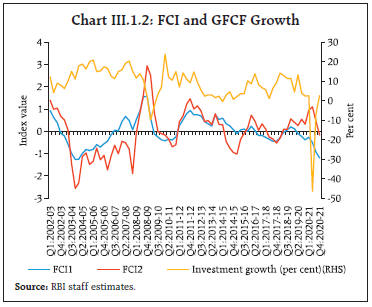 Both the measures of FCIs are negatively correlated (statistically significant) with growth in gross fixed capital formation (GFCF) and the correlation is higher for lagged FCI, i.e., the easing of financial conditions is associated with a subsequent rise in investment growth (Table III.I.1). Granger causality tests confirm that the financial conditions have a statistical significant impact on investment growth (Table.I.2). The role of financial conditions in supporting investment activity is also corroborated by regression analysis with controls for expected economic activity (Table III.I.3). | Table III.I.1: Correlation Coefficient of FCIs with Investment Growth (y-o-y) | | | FCI1 | FCI2 | | Lag 0 | -0.26* | -0.52* | | Lag 1 | -0.43* | -0.57* | | Lag 2 | -0.57* | -0.59* | | Lag 3 | -0.61* | -0.52* | | Lag 4 | -0.54* | -0.38* | * indicates significant at 1% level
Source: RBI staff estimates. |
| Table III.I.2: Granger Causality Test | | Hypothesis | FCI1 (DFM) | FCI2 (VAR) | | F-statistic | Prob | F-statistic | Prob | | FCI does not Granger cause investment growth | 2.04 | 0.14 | 3.76*** | 0.03 | | FCI (-1) does not Granger cause investment growth | 1.54 | 0.22 | 1.08 | 0.34 | | FCI (-2) does not Granger cause investment growth | 2.45*** | 0.09 | 2.33 | 0.11 | | FCI (-3) does not Granger cause investment growth | 0.37 | 0.69 | 0.29 | 0.75 | | FCI (-4) does not Granger cause investment growth | 0.02 | 0.98 | 0.39 | 0.68 | ***indicates significant at 10% level.
Source: RBI staff estimates. |
| Table III.I.3: Regression Estimates | | Dependent Variable: Investment Growth | | | Coefficient | t-Statistic | | Investment growth (-1) | 0.54 | 4.67* | | FCI1(-2) | -3.05 | -2.98* | | GDP growth(+2) | 0.58 | 2.69* | | Constant | 0.27 | 0.14 | | R2 | 0.59 | | | Prob (J-statistic) | 0.79 | | Q-statistic (upto 4 lags) (p-value) | 0.23 | *: Significant at 1 per cent level.
The equation is estimated through generalised method of moments approach with the following instruments: lags of the endogenous variables as well as lag of world GDP growth, Brent crude prices and annual deviation rainfall in India from its long period average.
Source: RBI staff estimates. | References: Hatzius, J., Hooper, P., Mishkin, F., Schoenholtz, K., Watson, M. (2010), ‘Financial Conditions Indexes: A Fresh Look after the Financial Crisis’, NBER Working Papers, No. 16150. Kongsamut, P., C. Mumssen, A. Paret, T. Tressel (2017), ‘Incorporating Macro-Financial Linkages into Forecasts Using Financial Conditions Indices: The Case of France’ IMF Working Paper No. 17/269. Gulati, S., Ghosh, B., Deepmala and Kumar, S. (2021), ‘Investment and Financial Conditions’, Mimeo. | Half-yearly unaudited financial statements of listed non-government non-financial (NGNF) companies indicate that companies reduced their assets and used funds to reduce liabilities and build-up cash holdings – the former signifying deleveraging while the latter is indicative of precautionary saving in uncertain times. The debt to equity ratio of these firms dropped by 4.4 percentage points to 39.7 per cent in H1:2020-21, although it was still higher than its level in the previous two years. Investment by these companies remained subdued (Table III.2). At the same time, the interest coverage ratio of listed non-financial private companies increased in Q3, indicating improved debt servicing capacity of these companies (Chart III.7). The deleveraging and improved debt service capacity along with congenial financial conditions, recovery in capacity utilisation, resuscitation of private consumption and the expanded scope of the Production-Linked Incentive (PLI) Scheme offer a conducive environment for capex spending by non-financial private companies. Bank lending to micro, small and medium enterprises (MSMEs) segment has improved with increased utilisation under the government’s Emergency Credit Line Guarantee Scheme (ECLGS) to meet working capital requirements. As on February 28, 2021, the utilisation under ECLGS stood at 82 per cent. The PLI, covering 13 sectors with a commitment of the government support amounting to nearly ₹1.97 lakh crore, has begun attracting investment, including FDI, in the manufacturing sector. The significantly higher allocation for capital expenditure in the Union Budget 2021-22 is expected to crowd in private investment, and hence, augurs well for the revival of the private sector investment cycle. At the same time, possible stress in the balance sheet of banks – once special dispensations related to moratorium, asset classification and restructuring wane – could weigh on the investment outlook. Capital infusion and efficient and effective handling of loan delinquencies should be accorded priority, so that impediment to credit availability does not undermine revival in the investment cycle. | Table III.2: Listed Private Manufacturing Companies | | (Per cent) | | Period | Debt to Equity Ratio | Debt to Assets Ratio | Cash to Total Assets Ratio | Fixed Assets (y-o-y growth) | | H2:2017-18 | 36.9 | 19.3 | 2.9 | | | H1:2018-19 | 37.9 | 19.5 | 2.6 | | | H2:2018-19 | 37.7 | 19.8 | 3.0 | 4.6 | | H1:2019-20 | 34.7 | 18.6 | 3.1 | 7.8 | | H2:2019-20 | 44.1 | 21.9 | 3.8 | 8.2 | | H1:2020-21 | 39.7 | 21.0 | 4.7 | 2.1 | Note: Based on data of 1,249 common listed private manufacturing companies.
Source: RBI staff estimates. | 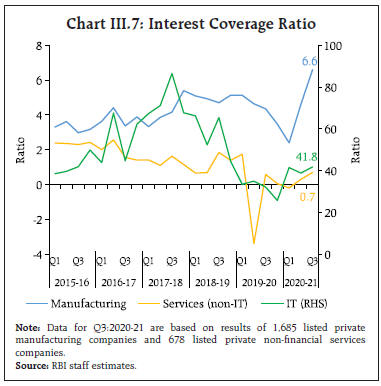 As per the first revised estimates for 2019-20, the gross domestic saving rate increased to 31.4 per cent of GDP from 30.6 per cent a year ago. Net household financial saving – a major source of funds for the economy – increased to 8.0 per cent of GDP in 2019-20 from 7.2 per cent in the preceding year. While the public sector was reliant on household surpluses for financing its deficit, the private sector depended primarily on internal resources for financing its investment needs (Chart III.8). According to preliminary estimates, the household financial savings rate spiked to 21.0 per cent of GDP in Q1:2020-21 as consumption waned amidst lockdowns and nearly normalised back to 10.4 per cent in Q2 as consumption recovered reinforced by pent-up demand3. III.1.3 Government Expenditure The contraction in Government Final Consumption Expenditure (GFCE) narrowed sharply from 24.0 per cent during Q2 to 1.1 per cent in Q3. GFCE support to aggregate demand revived in Q4 (the implicit growth in the SAE of NSO is 29.2 per cent). Overall, the fiscal support to aggregate demand remained substantial in H2. Excluding government expenditure, the economy would have recorded a contraction of 9.3 per cent in 2020-21. In 2021-22, the growth in revenue expenditure excluding interest and subsidy payments has been budgeted at 4.8 per cent, considerably on the lower side as compared with 13.1 per cent in 2020-21 (RE), indicating lower support to aggregate demand (Table III.3). | Table III.3: Key Fiscal Indicators – Central Government Finances | | Indicator | Per cent to GDP | | 2019-20 | 2020-21
(RE) | 2021-22
(BE) | | 1. Revenue receipts | 8.3 | 8.0 | 8.0 | | a. Tax revenue (Net) | 6.7 | 6.9 | 6.9 | | b. Non-Tax revenue | 1.6 | 1.1 | 1.1 | | 2. Non-debt capital receipts | 0.3 | 0.2 | 0.8 | | 3. Revenue expenditure | 11.6 | 15.5 | 13.1 | | a. Interest payments | 3.0 | 3.6 | 3.6 | | b. Major subsidies | 1.1 | 3.1 | 1.5 | | 4. Revenue expenditure excluding interest payments and subsidies | 7.3 | 8.6 | 7.8 | | 5. Capital expenditure | 1.7 | 2.3 | 2.5 | | 6. Capital outlay | 1.5 | 1.7 | 2.3 | | 7. Total expenditure | 13.2 | 17.7 | 15.6 | | 8. Gross fiscal deficit | 4.6 | 9.5 | 6.8 | | 9. Revenue deficit | 3.3 | 7.5 | 5.1 | | 10. Primary deficit | 1.6 | 5.9 | 3.1 | | Sources: Union Budget 2021-22 and RBI staff estimates. | During 2020-21, the fiscal position of the central government remained under stress due to revenue shortfalls and increase in COVID-19-related discretionary spending. Revenue collections gathered pace in H2, however, on the back of the pick-up in economic activity. The centre’s net tax revenue increased by 9.1 per cent during April-February 2020-21 and stood at 90.4 per cent of revised estimates (RE) for the full year (Chart III.9). Except excise and customs duties, tax collections witnessed declines across the board. Total GST collections were severely hit by the lockdown during H1:2020-21 but crossed the previous year’s level from September 2020 onwards (Chart III.10). In March 2021, GST collections were recorded at ₹1.24 lakh crore. Direct tax collections during April-February 2020-21 were 81.6 per cent of RE, down by 9.9 per cent over the previous year’s level. Total tax revenue is budgeted to be higher in 2021-22 than in the previous year (Table III.4). The revenue expenditure for the full year 2020-21 was revised upward by 14.5 per cent from the BE, mainly due to spending on major subsides. Outgoes on food subsidy in RE were over three and half times of the BE (2.2 per cent of GDP) because of distribution of free foodgrains to over 80 crore people and on-budgeting of past subsidy payments to the Food Corporation of India (FCI) in the form of National Small Saving Fund (NSSF) loans. The revenue expenditure, excluding interest and subsidy payments, is estimated to step-up by 33.6 per cent in Q4 (Chart III.11). The capital expenditure of the central government also inched up by 6.6 per cent in RE 2020-21 from BE on the back of higher spending on central sector schemes, railways, defence, transfers to the States, health and MSMEs. Higher capital expenditure in RE that is attributed to discretionary spending gave a thrust to fixed investment in the economy. The increased government expenditure reflects the fiscal policy push necessitated by the pandemic to save lives and livelihood and nurture the economic recovery. Reflecting decline in revenues and higher expenditures, the fiscal deficit (FD) and revenue deficit (RD) edged up considerably to 9.5 per cent and 7.5 per cent of GDP, respectively in 2020-21(RE). | Table III.4: Central Government Tax Collections | | Indicator | Per cent to GDP | | 2019-20 | 2020-21
(RE) | 2021-22
(BE) | | 1. Direct tax | 5.1 | 4.6 | 5.0 | | (i) Corporation | 2.7 | 2.3 | 2.5 | | (ii) Income | 2.4 | 2.3 | 2.5 | | 2. Indirect tax | 4.6 | 5.1 | 5.0 | | (i) GST | 2.9 | 2.6 | 2.8 | | (ii) Customs | 0.5 | 0.6 | 0.6 | | (iii) Excise | 1.2 | 1.8 | 1.5 | | 3. Gross tax revenue (1+2) | 9.7 | 9.7 | 9.9 | | 4. Net tax revenue | 6.6 | 6.9 | 6.9 | Note: BE: Budget Estimates. RE: Revised Estimates.
Source: Union Budget, 2021-22. | 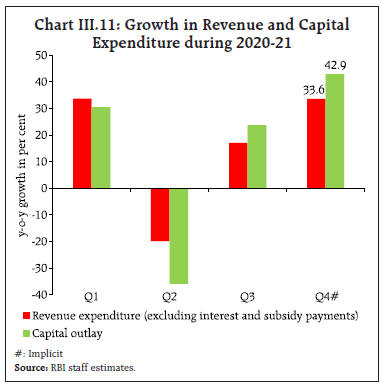 The Union Budget 2021-22 gave an impetus to growth through increased outlays for capital expenditure. Although total expenditure is budgeted to grow by only 1 per cent, the increased focus on capital expenditure that has multiplier effects would boost overall investment and growth in the economy. The allocation for capital expenditure has been budgeted higher by 26.2 per cent, while revenue expenditure is budgeted to fall by 2.7 per cent in 2021-22. The capital outlay (i.e., capital expenditure excluding loans and advances) is budgeted to edge up to 2.3 per cent of GDP in 2021-22 (BE) from 1.7 per cent in 2020-21(RE) (Chart III.12). The Union Budget 2021-22 expected the fiscal deficit (FD) to decline to 6.8 per cent of GDP and to 4.5 per cent by 2025-26. 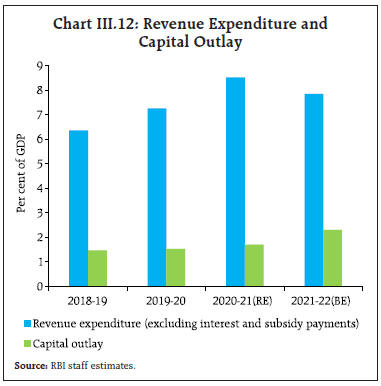 Based on data for 24 states for April-January 2020-21, states’ consolidated revenue receipts contracted largely due to downturn in own tax revenue, central tax transfer and own non-tax revenue. Consolidated revenue receipts, however, made a turnaround in H2 (October-January 2020-21) due to revival in GST collections. Despite COVID-19 related spending, states’ revenue expenditure (excluding interest payments and subsidies) rose marginally during April-January due to expenditure rationalisation. Capital expenditure after contracting in H1, posted a robust growth in H2 (October-January 2020-21), reflecting a qualitative improvement in expenditure composition. For 2021-22, the consolidated GFD (for 12 states for which data are available) is budgeted at 3.7 per cent of GSDP during 2021-22 as against 4.2 per cent in 2020-21(RE) (Table III.5). | Table III.5: State Government Finances - Key Deficit Indicators | | (per cent of GSDP) | | Item | 2019-20 | 2020-21
(BE) | 2020-21
(RE) | 2021-22
(BE) | | Revenue deficit | 0.1 | 0.1 | 1.7 | 0.5 | | Primary deficit | 0.7 | 1.1 | 2.4 | 1.8 | | Gross fiscal deficit | 2.3 | 2.6 | 4.2 | 3.7 | Notes: 1. Data pertain to 12 states out of 28 States and 3 Union Territories that have presented their Budgets for 2021-22.
2. GSDP is the sum of GSDP of the respective 12 states.
Source: Budget Documents of State Governments. | The Reserve Bank of India completed the central government’s market borrowing programme for 2020-21 successfully and in a non-disruptive manner (Table III.6). Despite a sharp increase in the quantum of the borrowings, ample surplus liquidity, regular open market operations (OMO) including special OMOs, regulatory measures and forward guidance enabled the government to complete its borrowings at a 16-year low weighted average cost – 5.79 per cent during 2020-21 as compared with 6.84 per cent in 2019-20 – along with the highest weighted average maturity. States’ gross borrowings of ₹7.98 lakh crore, also significantly higher than normal, were completed at a weighted average cost of 6.52 per cent during 2020-21. | Table III.6: Centre’s Borrowings | | (₹ Lakh Crore) | | Item | 2019-20 | 2020-21
(RE) | 2021-22
(BE) | | I Net borrowings (G-Sec) | 4.7 | 10.5 | 9.2 | | Repayments | 2.4 | 2.3 | 2.9 | | Gross borrowings (G-Sec) | 7.1 | 12.8 | 12.1 | | II T-Bills/Cash management bills (Net) | 1.5 | 2.2 | 0.5 | | III Net market borrowings (I+II) | 6.2 | 12.7 | 9.7 | | IV Securities against small savings | 2.4 | 4.8 | 3.9 | | V State provident fund | 0.1 | 0.2 | 0.2 | | VI Other receipts | 0.4 | 0.4 | 0.5 | | VII External debt | 0.1 | 0.5 | 0 | | VIII Total debt (III to VII) | 9.3 | 18.7 | 14.4 | | IX Drawdown on cash balances | 0.1 | -0.2 | 0.7 | | X Total funding (VIII+IX) | 9.4 | 18.5 | 15.1 | | Sources: Government of India; and RBI staff estimates. |
Eleven tranches of switch operations amounting to ₹1.53 lakh crore were undertaken during 2020-21, aiming at managing rollover risk and enhancing liquidity of government securities. The Union Budget 2021-22 has placed net market borrowings through G-Sec at ₹9.2 lakh crore, lower than in 2020-21 (RE). Market borrowings are slated to finance 61 per cent of the centre’s fiscal deficit in 2021-22(BE), higher than 57 per cent in RE 2020-21 (Chart III.13). Gross market borrowings of the central government through dated securities have been planned at ₹7.24 lakh crore in H1:2021-22 (60 per cent of the total budgeted amount for 2021-22). The ways and means advances (WMA) limit for the central government has been fixed at ₹1.20 lakh crore for H1:2021-22 to enable seamless bridging of intermittent mismatch between receipts and payments on account of leads and lags. III.1.4 External Demand With the global economy gradually emerging from one of its deepest recessions, India’s exports surpassed the pre-pandemic level and entered the expansionary zone from December 2020. Imports contraction became softer in H2:2020-21 and eventually turned positive from December 2020 after a gap of 9 months (Chart III.14). The positive contribution of net external demand to y-o-y growth fell in Q3 with improvement in imports outpacing exports. The contribution of net external demand to growth is estimated to improve in Q4. 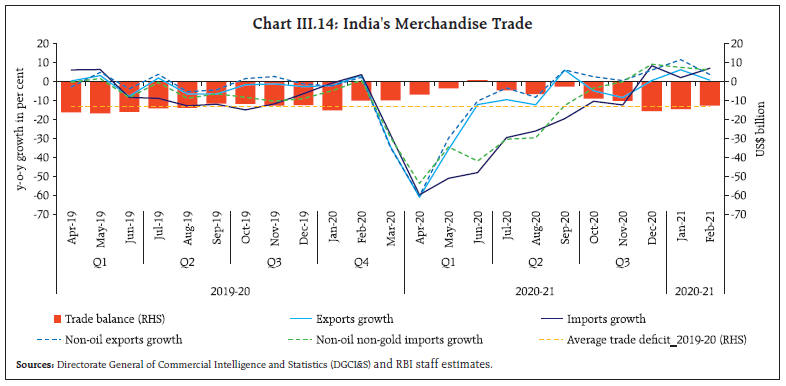 According to data released by the Directorate General of Commercial Intelligence and Statistics (DGCI&S), the pace of contraction in India’s merchandise exports, which peaked in Q1:2020-21 due to the disruptions caused by the COVID-19, moderated in Q2 and Q3 on the back of a gradual recovery in global demand conditions. Merchandise exports expanded for the third month in a row in February 2021 (Chart III.15 a). Non-oil exports rose by 3.1 per cent in Q3 and 7.5 per cent during January-February 2021 (Chart III.15c). At the disaggregated level, drugs and pharmaceuticals, iron ore and agricultural products pushed up non-oil export growth. Overall, during April-February 2020-21, merchandise exports contracted by 12.2 per cent. With the gradual opening up of the economy and revival of domestic demand, the pace of contraction in merchandise imports moderated to 4.7 per cent in Q3:2020-21 from 52.9 per cent in Q1 (Chart III.15b). In February 2021, merchandise imports rose by 7.0 per cent, registering an expansion for the third consecutive month. The rebound in non-oil non-gold imports has been broad-based, with major sectors including electronic goods, machinery, chemicals, and pearls and precious stones reaching pre-COVID levels in December 2020 (Chart III.15d). Gold imports rose by 38.0 per cent in Q3 and 124 per cent in February 2021. Overall, merchandise imports contracted by 23.1 per cent in April-February 2020-21. With imports contracting faster than exports, the merchandise trade deficit nearly halved to US$ 84.6 billion in April-February 2020-21 from US$151.4 billion in the corresponding period a year ago. Going forward, India’s oil import bill may edge up due to the rise in international crude oil prices since November 2020 in the face of rebalancing of global oil supply-demand conditions. Turning to the services sector, the initial setback to the exports of services in Q1:2020-21 waned gradually in view of the resilience of software exports (Chart III.16). While travel and transport sector and trade-related services were adversely impacted due to the global lockdown restrictions, domestic information technology (IT) companies benefitted from demand from international customers and increasingly adopted new models for IT and other work operations in the wake of the pandemic. Remittances recorded sequential improvement in Q2 and Q3 with the phased normalisation of global economic activity. While the current account surplus was 3.0 per cent of GDP in H1, the rising trade deficit pushed the current account back into deficit in Q3. 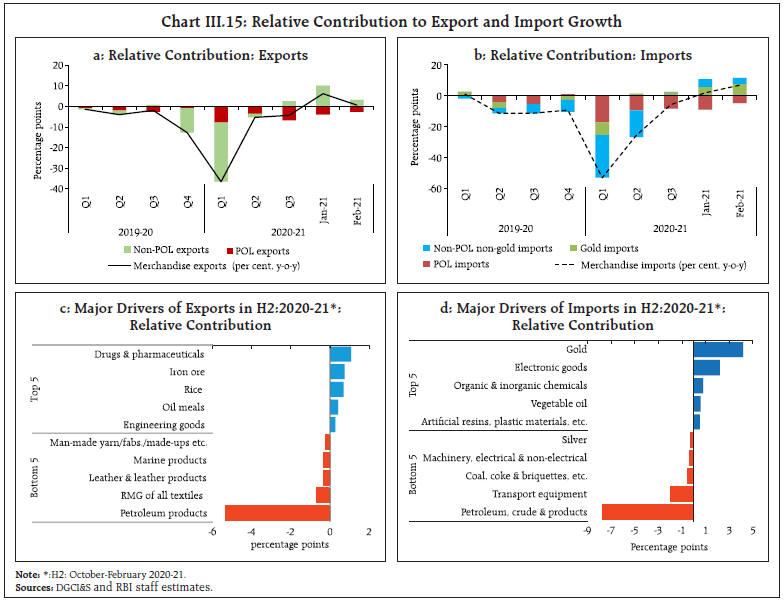 Net capital flows remained robust in 2020-21 supported by foreign direct investment (FDI) and foreign portfolio investment (FPI) on growing optimism about India’s growth prospects. Driven primarily by megadeals in the digital and retail sectors, net FDI at US$ 44.3 billion during April-January 2020-21 was higher than US$ 36.3 billion a year ago. The sharp upturn in net purchases by portfolio investors in the equity segment during H2 resulted in net FPI inflows at US$ 37.1 billion during 2020-21 (up to March 30) as against an outflow of US$ 5.2 billion during the same period last year (Chart III.17). While the accommodative monetary policies of major central banks improved the appetite for risk among global portfolio investors, robust earnings reported by domestic corporate sector, positive sentiments on COVID vaccination and optimism on domestic growth also helped in attracting record FPI inflows. Despite purchases by FPIs in the debt market in H2:2020-21, there was a cumulative net outflow at US$ 0.5 billion from this segment in 2020-21 (up to March 30). External commercial borrowings recorded net outflows during April-January 2020 partly due to pre-payments. Net flows under non-resident deposits, however, surged during the period. As on March 26, 2021, India’s foreign exchange reserves amounted to US$ 579.3 billion, covering 18.4 months of imports and 102.8 per cent of external debt (chart III.17). 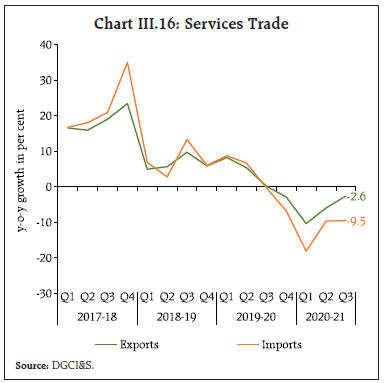
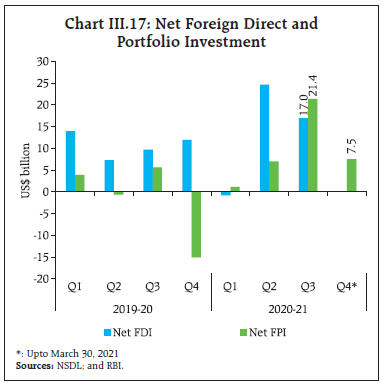 III.2 Aggregate Supply Gross value added (GVA) – the measure of aggregate supply – contracted by 6.5 per cent in 2020-21 as per the SAE released by the NSO. GVA posted a growth of 1.8 per cent in H2:2020-21 in contrast to a downturn of 14.9 per cent in H1:2020-21. The momentum in growth – Q-o-Q-SAAR – eased during Q3 and Q4 from Q2 (Chart III.18). 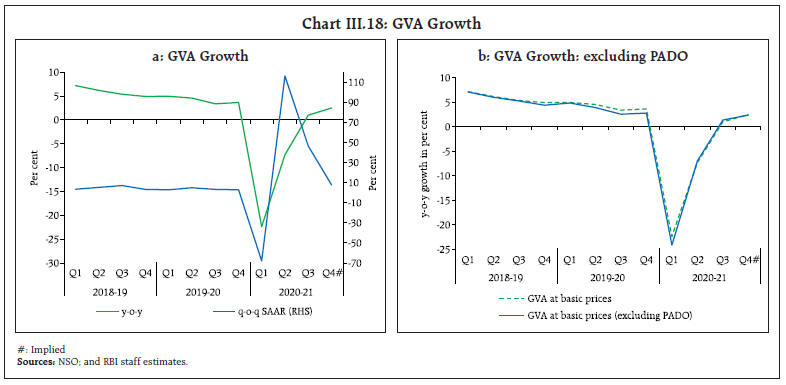
| Table III.7: Sector-wise Growth in GVA | | (y-o-y, per cent) | | Sector | 2019-20 (FRE) | 2020-21 (SAE) | Weighted Contribution 2020-21 | 2019-20 (FRE) | 2020-21 (SAE) | | Q1 | Q2 | Q3 | Q4 | Q1 | Q2 | Q3 | Q4 | | Agriculture, forestry and fishing | 4.3 | 3.0 | 0.4 | 3.3 | 3.5 | 3.4 | 6.8 | 3.3 | 3.0 | 3.9 | 1.9 | | Industry | -2.0 | -7.4 | -1.6 | 1.0 | -2.7 | -3.0 | -3.2 | -31.1 | -1.6 | 1.4 | 1.9 | | Mining and quarrying | -2.5 | -9.2 | -0.2 | -1.3 | -5.2 | -3.5 | -0.9 | -18.0 | -7.6 | -5.9 | -5.5 | | Manufacturing | -2.4 | -8.4 | -1.4 | 0.6 | -3.0 | -2.9 | -4.2 | -35.9 | -1.5 | 1.6 | 2.3 | | Electricity, gas, water supply and other utilities | 2.1 | 1.8 | 0.0 | 6.9 | 1.7 | -3.1 | 2.6 | -9.9 | 2.3 | 7.3 | 8.9 | | Services | 6.4 | -8.4 | -5.3 | 6.8 | 7.3 | 5.8 | 5.6 | -24.8 | -10.9 | 0.0 | 2.9 | | Construction | 1.0 | -10.3 | -0.8 | 3.7 | 1.0 | -1.3 | 0.7 | -49.4 | -7.2 | 6.2 | 8.4 | | Trade, hotels, transport, communication | 6.4 | -18.0 | -3.7 | 6.2 | 6.8 | 7.0 | 5.7 | -47.6 | -15.3 | -7.7 | -2.9 | | Financial, real estate and professional services | 7.3 | -1.4 | -0.3 | 8.8 | 8.9 | 5.5 | 4.9 | -5.4 | -9.5 | 6.6 | 6.9 | | Public administration, defence and other services | 8.3 | -4.1 | -0.5 | 5.6 | 8.8 | 8.9 | 9.6 | -9.7 | -9.3 | -1.5 | 3.2 | | GVA at basic prices | 4.1 | -6.5 | -6.5 | 5.0 | 4.6 | 3.4 | 3.7 | -22.4 | -7.3 | 1.0 | 2.5 | FRE: First Revised Estimates; SAE: Second Advance Estimates; #: Implicit growth.
Source: NSO. | Agriculture and allied activities remained resilient during 2020-21, partially offsetting the contraction in other components of GVA. Manufacturing activity entered expansion in Q3 but dipped back into contraction in January 2021. The services sector – battered by the pandemic – tenuously regained momentum in H2, buoyed by optimism on the roll-out of vaccines (Table III.7). III.2.1 Agriculture GVA in agriculture and allied activities expanded by 3.0 per cent in H2:2020-21, maintaining its pace of H1. Sufficient access to inputs, adequate and well-spread south-west and the north-east monsoon rains, sufficient reservoir levels and improved soil moisture pushed up rabi acreage by 2.9 per cent. The SAE for 2020-21 has placed kharif and rabi foodgrains production higher by 2.9 and 1.1 per cent, respectively, over their levels a year ago (Table III.8). Foodgrains production, including both the staple cereals, viz., rice and wheat, touched another record for the fifth consecutive year. Among the commercial crops, cotton and oilseeds (groundnut and ‘rapeseed and mustard’) achieved record production levels. All the crops, except pulses and jute and mesta, achieved their target levels for 2020-21. Horticultural production was also placed at a record level of 3,265.8 lakh tonnes during 2020-21 – 1.8 per cent higher than the final estimates for 2019-20 – driven largely by production of aromatics and medicinal crops, vegetables and fruits. Allied activities consisting of livestock, forestry and fishing – which constitute about 44 per cent of the sector – contributed about half of overall agricultural GVA growth in 2019-20 (Chart III.19). | Table III.8: Agricultural Production in 2020-21 (Second Advance Estimates) | | (in Lakh Tonnes) | | Crop | 2019-20 | 2020-21 | Variation in 2020-21 (Per cent) | | 2nd AE | Final | Target | 2nd AE | Over 2nd AE 2019-20 | Over Final 2019-20 | Over Target | | Foodgrains | 2919.5 | 2975.0 | 3010.0 | 3033.4 | 3.9 | 2.0 | 0.8 | | Kharif | 1423.6 | 1438.1 | 1493.5 | 1479.5 | 3.9 | 2.9 | -0.9 | | Rabi | 1496.0 | 1536.9 | 1516.5 | 1554.0 | 3.9 | 1.1 | 2.5 | | Rice | 1174.7 | 1188.7 | 1196.0 | 1203.2 | 2.4 | 1.2 | 0.6 | | Wheat | 1062.1 | 1078.6 | 1080.0 | 1092.4 | 2.9 | 1.3 | 1.1 | | Pulses | 230.2 | 230.3 | 256.0 | 244.2 | 6.1 | 6.0 | -4.6 | | Oilseeds | 341.9 | 332.2 | 370.0 | 373.1 | 9.1 | 12.3 | 0.8 | | Sugarcane | 3538.5 | 3705.0 | 3900.0 | 3976.6 | 12.4 | 7.3 | 2.0 | | Cotton # | 348.9 | 360.7 | 360.0 | 365.4 | 4.7 | 1.3 | 1.5 | | Jute & Mesta ## | 98.1 | 98.8 | 105.0 | 97.8 | -0.3 | -1.0 | -6.9 | #: lakh bales of 170 kgs. each.
##: lakh bales of 180 kgs. each.
Source: Ministry of Agriculture and Farmers’ Welfare, Government of India. | 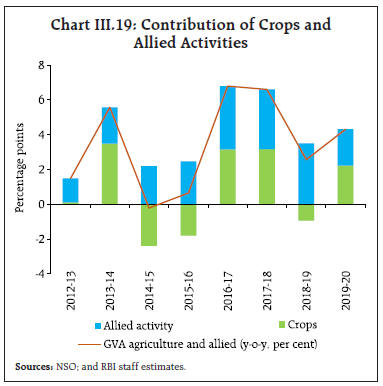 The procurement of paddy during the kharif marketing season that started in September 2020 was higher by 14.0 per cent year-on-year till March 31, 2021. For upcoming rabi marketing season (April-March), the government has set a target to procure 407.0 lakh tonnes of wheat, which is 2.3 per cent over and above the record procurement during the previous rabi season. Record procurement of cereals led to a significantly higher buffer stock of wheat and rice at 286.8 lakh tonnes (2.1 times the buffer norms) and 512.4 lakh tonnes (6.7 times the buffer norms), respectively, by mid-March 2020 notwithstanding 315 lakh tonnes of cereals distributed under the Pradhan Mantri Garib Kalyan Anna Yojana (Chart III.20). In terms of high frequency indicators, tractor sales posted strong growth in Q3 and January-February 2021, and two-wheeler sales remained buoyant (Table III.9). Farm exports remained strong during Q3 and Q4 (January-February), benefitting from a surge in global demand and higher international food prices. The Union Budget 2021-22 has announced measures targeted at infrastructure development in agriculture, rural areas, and fisheries by enhancing credit flow and improving supply chains for perishables while ensuring continuation of direct procurement of cereals by the government. The extension of the agriculture infrastructure fund to Agricultural Produce Market Committees (APMCs) and integration of additional 1,000 APMC mandis with electronic-National Agriculture Market (e-NAM)4 is expected to enhance farmers access to markets and prices and improve marketing efficiency in the agriculture sector. The proposal to expand “operation green” from 3 (onions, tomatoes and potatoes) to 22 perishable commodities is expected to improve supply chains, reduce price fluctuations and boost exports of perishable agricultural commodities. According to the National Oceanic and Atmospheric Administration (NOAA) of the US, there is around 60 per cent chance of a transition from La Niña to ENSO-Neutral during the April-June 2021, indicative of a normal south west monsoon. 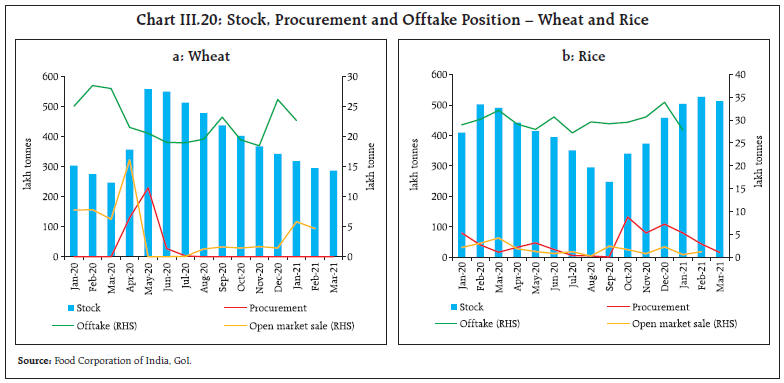
| Table III.9: High Frequency Indicators for Rural Economy | | Per cent | | Items | Growth | Jul-20 | Aug-20 | Sep-20 | Oct-20 | Nov-20 | Dec-20 | Jan-21 | Feb-21 | | Tractor sales | y-o-y | 38.5 | 74.7 | 28.3 | 7.7 | 51.3 | 43.1 | 46.7 | 31.1 | | Two-wheeler sales | y-o-y | -15.2 | 3.0 | 11.6 | 16.9 | 13.4 | 7.4 | 6.6 | 10.2 | | Fertilizer sales | y-o-y | 25.4 | 7.0 | -2.6 | 17.7 | 3.7 | -26.5 | -22.3 | NA | | Demand for employment (MGNREGA) | y-o-y | 66.3 | 60.4 | 63.3 | 81.0 | 43.1 | 47.2 | 30.0 | 20.3 | | Export - agri and allied sector | y-o-y | 15.3 | 14.1 | 31.5 | 34.2 | 12.5 | 12.9 | 21.5 | 27.1 | | Agriculture credit (Outstanding) | y-o-y | 5.4 | 4.9 | 5.9 | 7.4 | 8.5 | 9.4 | 9.9 | 10.2 | | Stocks-cereals (Ratio of actual stock to quarterly buffer norms) | Rice | 2.8 | 2.2 | 2.4 | 3.3 | 3.6 | 4.5 | 6.6 | 6.7 | | | Wheat | 2.0 | 1.7 | 2.1 | 2.0 | 1.8 | 1.7 | 2.3 | 2.1 | | Sources: Tractor Manufactures Association; SIAM; Ministry of Chemicals and Fertilzers; Ministry of Rural Development; CMIE; RBI; and Food Corporation of India. | III.2.2 Industry Industrial sector GVA was driven by the manufacturing sector emerging out of contraction in Q3, although in Q4, there has been some setback due to sharp retrenchment of production of capital goods and consumer non-durables (Chart III.21). In contrast, the mining sector continued to languish, throttled by supply bottlenecks. Crude oil and natural gas production dropped due to lack of critical infrastructure and equipment, and operational difficulties amidst the pandemic. Natural gas production crossed the pre-COVID levels in January 2021 following the start of production in KG-D6 field, which bodes well for the outlook. The index of industrial production (IIP) emerged out of a prolonged contraction in September 2020 but it lost momentum again in November and January 2021 (Chart III.22a). The improvement in manufacturing activity in Q3 was driven by basic metals, chemical and chemical products, motor vehicles and electrical equipment. 12 out of 23 industry groups entered positive territory in Q3 as compared to only 5 groups during Q2. In terms of the use-based classification, the recovery in Q3 was led by consumer durables and infrastructure/construction goods on the back of increase in sales of automobiles and electronics, and higher domestic demand from the auto and white goods segment for steel (Chart III.22d). In capital goods sector, the moderation was offset by higher output of agricultural tractors, harvesters, threshers, tyres and tubes. 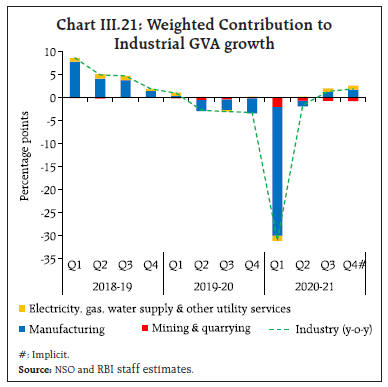
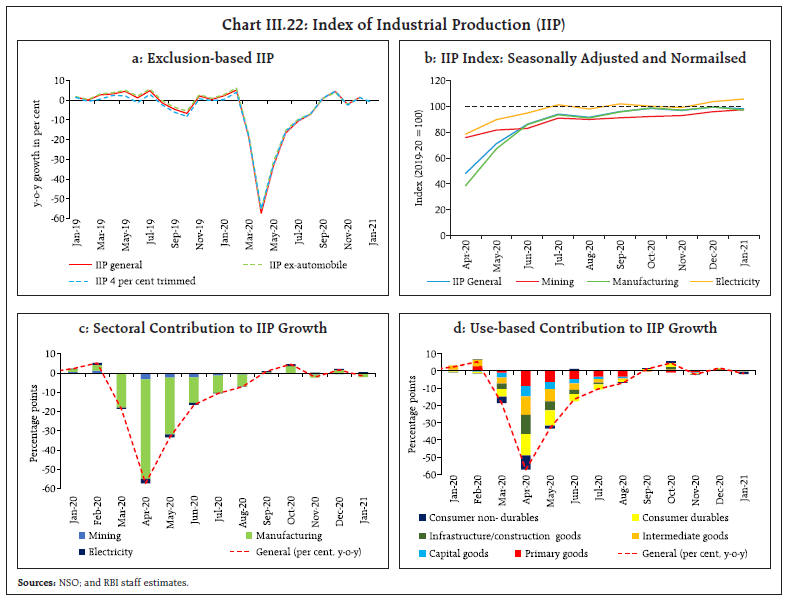 In January 2021, the IIP contracted by 1.6 per cent, pulled down by the downturn in manufacturing. Mining activity contracted further in January 2021. In terms of the use-based classification, capital goods production declined to a 5-month low while consumer non-durables output fell to an 8-month low. Electricity generation improved in Q3 and January 2021 reflecting buoyant demand although there was some deceleration in February 2021. The thermal sector contributed primarily to the upturn in electricity generation in Q3 and January with a growth of 7.6 per cent and 7.0 per cent, respectively, before easing to 1.9 per cent in February 2021. The rate of contraction in nuclear power generation became more pronounced during January-February 2021, while generation from renewable sources decelerated in January and contracted in February (Chart III.23a). Hydro power generation continued to contract in Q3 and January-February 2021. The deceleration in electricity demand in February was mainly due to a drop in consumption in western and southern regions (Chart III.23b). Nominal GVA of manufacturing companies posted a notable improvement in Q3 on the back of strong growth in profits (Chart III.24). Profit before tax of manufacturing companies surged on an improvement in net sales coupled with reduced interest expenses. Employee cost posted an uptick, however.
Business sentiment improved in H2:2020-21, with the Reserve Bank’s business assessment index rising to 113.1 in Q4:20-21 (the 93rd round of the industrial outlook survey) from 108.6 in Q3:2020-21. The business expectations index (BEI) also improved further to 119.6 for Q1:2021-22 as compared to 114.1 for Q4:2020-21. The manufacturing purchasing managers’ index (PMI) at 55.4 in March 2021 indicated expansion for the eighth consecutive month, driven by upturn in new orders and production (Chart III.25a). Overall, manufacturing activity and electricity generation are gradually normalising and approaching their 2019-20 levels (Table III.10). III.2.3 Services The services sector stepped out of contraction in H2:2020-21 with the phased unlocking of the economy, and recorded a growth of 1.4 per cent. The construction sector recuperated faster than anticipated – entering positive territory in Q3 – and rose by 7.3 per cent in H2 due to demand from the residential sector and highway construction (Chart III.26a). Indicators such as finished steel consumption mirrored the recovery in construction activity (Chart III.26b). Robust collection of the goods and services tax (GST) and issuances of e-way bills suggest a strong upturn in domestic trading activity. The ongoing normalisation of trade, both domestic and international, boosted railway freight traffic (Table III.11).
IT companies continued to record steady growth (Chart III.27). Growing demand for core transformation services5 and strong revenue conversion from earlier deals, coupled with low travel cost, supported IT companies during Q3. Sales of non-IT services companies remained in contraction zone in Q3, albeit with some moderation. Commercial vehicle sales – an indicator of transportation services – posted a sequential improvement in Q3:2020-21, with the pace of contraction moderating to 1.2 per cent from 20.1 per cent in Q2. Other indicators of transportation services – toll collections; rail freight traffic; and cargo handled by major ports – displayed expansion. Air passengers and cargo traffic – both domestic and international –remained in contractionary zone, despite some pick-up. Domestic flights are witnessing some momentum as travellers are increasingly shedding their inhibitions. The services PMI exhibited expansion during H2 and at 55.3 in February, it was above its long period average on the back of new work and business activity gaining hold (Chart III.25b). In H2, public administration, defence and other services (PADO) expanded marginally from the contraction in H1, driven by government revenue expenditure on public administration. Other services in PADO – private education; health; personal services; and cultural and recreational activities – continued to be tepid. Growth in central government revenue expenditure, excluding interest payments and subsidies, recovered in Q3 and strengthened further in Q4. GVA in financial, real estate and professional services rebounded and expanded by 6.8 per cent in H2, reflecting the strong performance of information technology and financial companies. Accelerated growth in aggregate deposits and the improvement in bank credit extended support to financial services during H2. The real estate sector gained steam from Q3, particularly in rural and semi-urban areas and affordable segments in urban areas, on the back of lower mortgage rates, favourable pricing and slash in stamp duty across several states. In residential real estate, new launches registered y-o-y growth for the first time in eight quarters during Q3:2020-21 while the inventory overhang moderated to an average of 55 months in Q3 from 73 months in Q2 (Chart III.28a). Growth in the RBI’s all-India housing price index remained unchanged in Q3 from the previous quarter (Chart III.28b). III.3 Conclusion Economic activity in India is gathering pace on improving business sentiment. Rural demand is leading the expansion, and there is growing evidence of catch-up in urban demand. The fiscal stimulus under AatmaNirbhar 2.0 and 3.0, coupled with increased allocation for capital expenditure under the Union Budget 2021-22, should accelerate public investment and crowd in private investment. The production-linked incentives scheme is expected to enhance India’s manufacturing capabilities and bolster exports. Despite gaining some traction, the contact-intensive services sector may take some time to reach pre-COVID levels. The recent increase in COVID infections, if not contained, could push back the normalisation process and impede the broader revival of economic activity. The sharp rise in global crude oil and commodity prices and global financial market volatility impart downside risks to the recovery. _________________________________________________________
IV. Financial Markets and Liquidity Conditions During H2:2020-21, domestic financial markets continued to post recovery in market activity amidst easy liquidity conditions. Nevertheless, concerns about a surge in infections in a few states, global bond sell-off, the large government borrowing, and uncertainty about the pace and scale of economic recovery kept market sentiments subdued. The pace of monetary transmission improved while bank credit growth registered an upturn. Going forward, the RBI’s market operations would ensure ample surplus liquidity in consonance with the accommodative policy stance to revive growth on a durable basis by mitigating the impact of COVID-19. Introduction In H2:2020-21, global financial markets remained largely buoyant, fuelled by optimism around a speedy vaccine-led recovery. Growing inflation concerns over fiscal stimulus amidst extremely accommodative monetary policies rattled global bond markets in February 2021. Long-term sovereign bond yields jumped sharply in the US and induced bouts of volatility across financial markets and regions of the world. The consequent yield curve steepening resulted in portfolio reallocation and corrections in equity prices. Despite the recent declines, stock indices remain elevated on anticipation of stronger recovery. In the currency markets, the US dollar appreciated in the first quarter of 2021 driven by rising bond yields while EME currencies faced depreciation pressures from bouts of capital outflows. IV.1 Domestic Financial Markets During H2:2020-21, domestic financial markets continued to post recovery in market activity amidst easy liquidity conditions. Nevertheless, concerns about a surge in infections in a few states, global bond sell-off, the large government borrowing and uncertainty about the pace and scale of economic recovery kept market sentiments subdued. IV.1.1 Money Market The money market remained largely stable during H2:2020-21, reflecting surplus liquidity conditions. The weighted average call rate (WACR) in the unsecured overnight money market eased and slipped below the reverse repo rate, beginning the second half of October 2020 (Chart IV.1). The negative spread of WACR relative to the reverse repo rate averaged 14 bps in H2. In the overnight call money segment, the weighted average rate (WAR) of traded deals generally remained above the reverse repo rate while that of reported deals remained below1. The share of the reported deals in the total volume of the call money segment increased to 54 per cent in H2:2020-21 from 46 per cent in H1, thereby pulling down the WACR below the reverse repo rate (Chart IV.2). The increased share of reported deals reflected the sharp increase in lending share of co-operative banks from 60 per cent in October to 79 per cent in November and the concomitant reduction in the borrowing share of public sector banks (PSBs) from 26 per cent to 1.0 per cent during the same period. 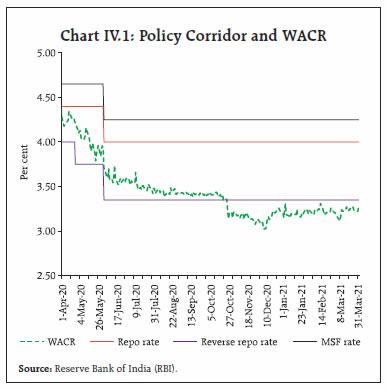
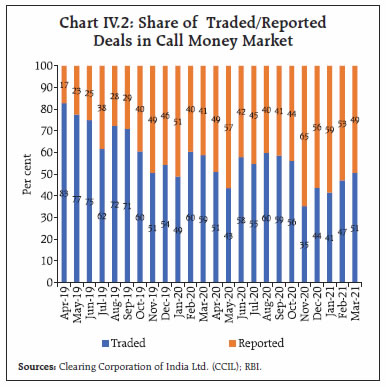 The share of the collateralised money market (triparty repo and market repo) in the overnight money market volume increased further to 97 per cent in H2: 2020- 21 from 95 per cent in H2: 2019-20 (Chart IV.3). Within the secured segment, the share of triparty repo in the overnight money market volume increased due to ramped-up lending by mutual funds in this segment. The combined volume in the overnight and term segments of the triparty repo market expanded sharply during H2:2020-21 – daily average volume increased from ₹1.67 lakh crore in October 2020 to ₹2.67 lakh crore in March 2021. There was a sharp increase (decrease) in the share of borrowing by public sector (private sector) banks in both triparty and market repo segments – the share of public sector banks increased from 14 per cent in October 2020 to 56 per cent in March 2021 in the triparty repo and from 10 per cent to 17 per cent in market repo segment over the same period – as these segments provide access to funds from mutual funds. Moreover, the share of mutual funds in triparty repo lending increased from 61 per cent in October 2020 to 68 per cent in March 2021. 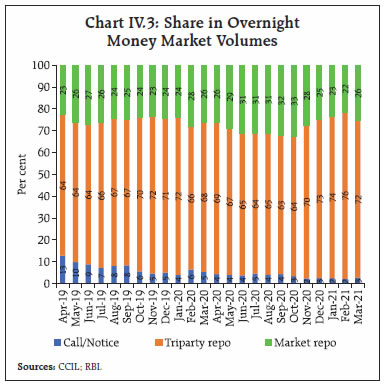 The rates in the secured overnight segments remained consistently below the WACR and the reverse repo rate (Chart IV.4), impelled by the surplus liquidity conditions, as alluded to earlier. Following the reactivation of the 14-day variable rate reverse repo auctions in mid-January 2021 with the resumption of normal liquidity management operations, money market rates and their spreads from the WACR firmed up somewhat from end- January 2021 (Table IV.1). Interest rates on longer-term money market instruments like 91-day Treasury Bills (T-Bills) rates and the 3-month certificates of deposit (CDs) rates also traded below the reverse repo rate, on an average, by 16 bps and 9 bps, respectively. Interest rates on CDs and commercial papers (CPs), however, inched up above the reverse repo rate in March 2021. Reflecting the surplus system liquidity and weak credit demand, banks reduced their recourse to CDs. As a result, fresh issuance of CDs declined to ₹53,468 crore during H2:2020-21 (up to March 12, 2021) from ₹1.69 lakh crore in the corresponding period of 2019-20. CP issuances declined moderately to ₹9.54 lakh crore during H2:2020-21 from ₹10.04 lakh crore during the corresponding period of 2019- 20 (Chart IV.5.a). CP rates generally traded above the reverse repo rate, with an average spread of 33 bps during H2:2020-21. A temporary rise in the weighted average discount rate (WADR) was observed in the last fortnight of January and March 2021 due to increased issuances by non-banking financial companies (NBFCs) (Chart IV.5.b). | Table IV.1: Policy Transmission in the Money Market | | (Basis points) | | | Change in Rates | Average Spread over WACR | | Repo | Call (WACR) | Triparty repo | Market repo | 3-month CD | 91-day T-bill | 3-month CP | Triparty repo | Market repo | 3-month CD | 91-day T-bill | 3-month CP | | H1: 2020-21 (Apr 03 – Sep 30, 2020) | -40 | -87 | 265 | 211 | -156 | -97 | -155 | -59 | -59 | -2 | -26 | 80 | | H2: 2020-21 (Oct 01-Mar 31, 2021) | 0 | -13 | 14 | 15 | -11 | 0 | -67 | -14 | -17 | 5 | -2 | 46 | | Jan 11*- Mar 31, 2021 | 0 | 12 | 13 | 18 | 25 | 24 | 22 | -7 | -17 | 13 | 7 | 65 | Note: - (+): easing (hardening).
*: Period after the announcement of resumption of normal liquidity operations by the RBI.
Sources: RBI; CCIL:F-TRAC; CCIL; FBIL; and RBI staff estimates. |
IV.1.2 Government Securities (G-sec) Market During H2: 2020-21, the 10-year G-sec yield firmed up by 30 bps, although it remained at decadal low levels. During Q3:2020-21, the yield softened by 15 bps from 6.04 per cent to 5.89 per cent, aided by policy measures viz., (i) introduction of on-tap TLTROs; (ii) extended dispensation of enhanced held to maturity (HTM) limit for banks; (iii) open market operation (OMO) purchase auctions; (iv) simultaneous purchase and sale of securities (special OMOs)2 ; and (iv) the monetary policy committee’s (MPCs) forward guidance on maintaining accommodative monetary policy stance as long as necessary to revive growth on a durable basis. The extent of softening, however, was limited over concerns about large supply of bonds with the announcement of additional borrowing of ₹1.1 lakh crore by the Central Government to fund the shortfall in GST compensation for states. 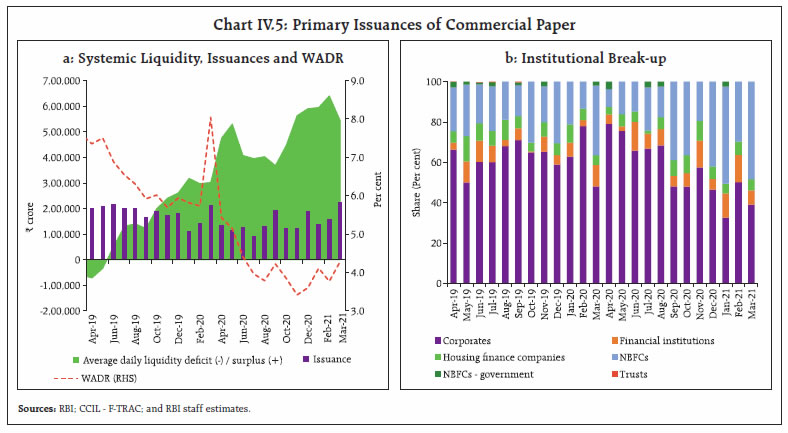 During Q4, yields remained range bound with an upward bias till the presentation of the Union Budget 2021-22 on February 1, 2021 (Chart IV.6). Yields spiked following the announcement of Government borrowings of ₹12.05 lakh crore for 2021-22 and additional borrowing of ₹80,000 crore for 2020-21. Yields subsequently eased somewhat on the back of (i) the OMO purchases for an enhanced amount of ₹20,000 crore on February 10, 2021 at lower than the market’s expected cut-offs; (ii) extension of the dispensation of enhanced HTM limit of 22 per cent of NDTL up to March 31, 2023; and (iii) forward guidance by the RBI on ensuring ample liquidity to foster congenial financing conditions. Yields firmed up from the second half of February in the wake of the sharp rise in US treasury yields and higher crude oil prices. The cancellation of the last scheduled G-sec auction for 2020-21 resulted in some moderation in yields towards end-March. 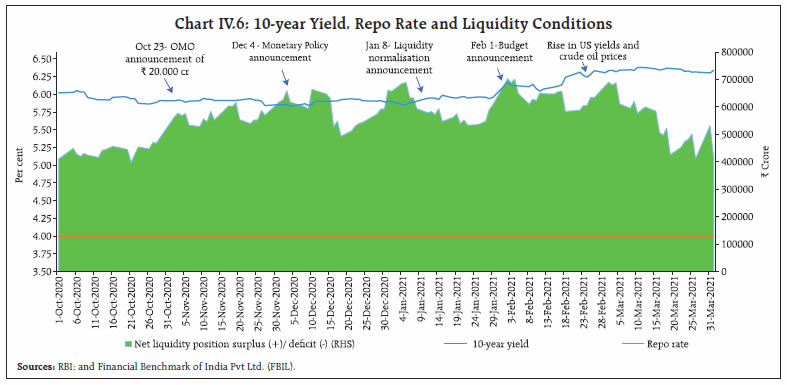 Yields on treasury bills across maturities traded below the policy repo rate as systemic liquidity continued to remain in large surplus (Chart IV.7). The average level of the yield curve increased by 19 bps in H2:2020-21 and the slope steepened by 5 bps3 (Chart IV.8). The slope dynamics reflect larger rise in long term yields compared with the short term, the latter driven by the large systemic liquidity surplus in consonance with the accommodative monetary policy stance. State Development Loans The weighted average spread of cut-off yields on SDLs over G-sec yields of corresponding maturities was 53 bps during H2, same as in H1:2020-21 (Chart IV.9). The spread widened post the Union Budget announcement of February 1, 2021 but narrowed substantially in end-March 2021 following the cancellation of the last G-sec auction. The average inter-state spread on securities of 10-year maturity (fresh issuance) was 11 bps in H2 as compared with 9 bps in H1:2020-21.
Switching of Securities In order to facilitate debt consolidation, the Reserve Bank conducted six switch operations on behalf of the central government amounting to ₹77,371 crore during H2:2020-21. The weighted average maturity (WAM) of the outstanding stock of G-secs increased to 11.31 years as at end-March 2021 from 10.97 years as at end-September 2020. The weighted average coupon (WAC) at 7.27 per cent was lower than 7.44 per cent over the same period. IV.1.3 Corporate Bond Market During H2:2020-21, corporate bond yields remained almost unchanged. Yields on AAA-rated 3-year bonds issued by NBFCs softened by 1 basis point to 5.54 per cent, while those on corporates and public-sector undertakings (PSUs), financial institutions (FIs) and banks hardened by 5 bps and 11 bps to 5.40 per cent and 5.20 per cent, respectively, at end-March 2021 (Chart IV.10a). The risk premium or spread on AAA-rated 3-year bonds (over 3-year G-sec) moderated from 63 bps to 36 bps for NBFCs, 43 bps to 22 bps for corporates and 17 bps to 2 bps for PSUs, FIs and banks (Chart IV.10b). Resource mobilisation through issuances of corporate bonds in the primary market at ₹3.06 lakh crore during H2:2020-21 (up to February 2021) was marginally lower than ₹3.08 lakh crore during the corresponding period of the previous year (Chart IV.11a). Almost the entire resource mobilisation in the corporate bond market (97.3 per cent) was through the private placement route. Outstanding investments by FPIs in corporate bonds declined to ₹1.3 lakh crore at end- March 2021 from ₹1.5 lakh crore at end-September 2020. Consequently, foreign portfolio invenstors (FPIs’) utilisation of the approved limit for investment in corporate bonds declined to 23.1 per cent at end- March 2021 from 33.8 per cent at end-September 2020. The daily average secondary market trading volume in the corporate bond market declined by 26.4 per cent to ₹6,084 crore during H2:2020-21 (up to February 2021) over the corresponding period of the previous year (Chart IV.11b). 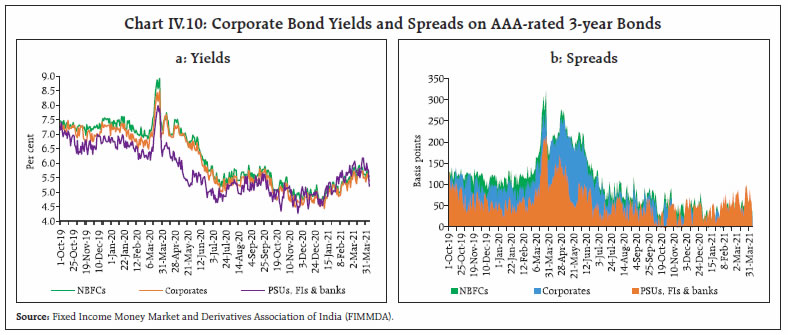
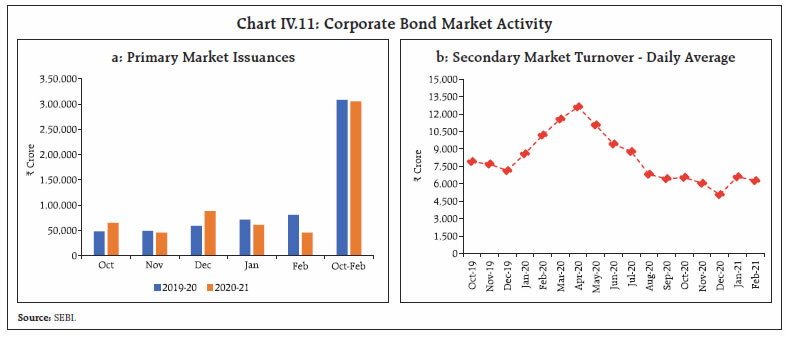 Between March 26, 2020 and March 31, 2021, the spread of AAA-rated 3-year bonds (over 3-year G-sec) issued by corporates fell from 276 bps to 22 bps. The spreads on BBB- (BBB minus) bonds – the lowest rated investment grade corporate bonds – also moderated significantly by 171 bps over the same period (Table IV.2). The market perception of credit risk has also improved: State Bank of India’s and ICICI Bank’s 3-year credit default swap (CDS) spreads reduced by 11 bps each during H2:2020-21. IV.1.4 Equity Market Domestic equities scaled all-time highs in H2:2020-21 on positive global cues, record FPI inflows, revival in economic activity, robust corporate earnings, roll-out of COVID-19 vaccine and announcement of a growth-oriented Union Budget 2021-22. The BSE Sensex gained 30.1 per cent in H2:2020-21 to close at 49,509 on March 31, 2021 (Chart IV.12a). | Table IV.2: Financial Markets - Rates and Spread | | Instrument | Interest Rates (per cent) | Spread in bps (over corresponding risk-free rate) | | As on March 26, 2020 | As on March 31, 2021 | Variation
(in bps) | As on March 26, 2020 | As on March 31, 2021 | Variation | | (1) | (2) | (3) | (4 = 3-2) | (5) | (6) | (7 = 6-5) | | CP (3-month) | 6.74 | 3.65 | -309 | 170 | 38 | -132 | | Corporate Bonds | | | | | | | | (i) AAA (1-yr) | 7.76 | 4.15 | -361 | 246 | 29 | -217 | | (ii) AAA (3-yr) | 8.47 | 5.40 | -307 | 276 | 22 | -254 | | (iii) AAA (5-yr) | 7.84 | 6.14 | -170 | 141 | 8 | -133 | | (iv) AA (3-yr) | 9.15 | 6.17 | -298 | 344 | 99 | -245 | | (v) BBB-minus (3-yr) | 12.29 | 10.05 | -224 | 658 | 487 | -171 | | 10-yr G-sec | 6.22 | 6.17 | -5 | - | - | - | | Sources: CCIL: F-TRAC; FIMMDA; and Bloomberg. | The Indian equity market remained upbeat in October 2020 following the phased unlocking of the economy, Q2 corporate earnings and a slew of liquidity and regulatory measures by the RBI. Domestic equities, however, witnessed cautious trading towards the end of the month due to uncertainty surrounding the outcome of the US presidential elections. In November, the BSE Sensex gained by 11.4 per cent, supported by FPI inflows, positive developments on the vaccine and the Government’s approval of a ₹1.5 lakh crore production-linked incentive (PLI) scheme for 10 manufacturing sectors. Equity markets extended their gains in December 2020 amidst better-than- expected GDP data for Q2:2020-21, expectations of swifter global economic recovery after the US stimulus package and the announcement of Brexit trade deal. Subsequently, the emergence of new strains of coronavirus in the UK and several other countries dampened sentiments and capped market rallies. Overall, the BSE Sensex increased by 25.4 per cent during Q3:2020-21. In January 2021, domestic markets surged on the back of upbeat corporate results for Q3:2020-21 and accelerated roll-out of COVID-19 vaccines. The benchmark index closed above 50000 for the first time on February 3, 2021 and scaled an all-time high of 52154 on February 15, 2021 riding on the budget euphoria. Markets, however, declined towards the end of the month following a spike in US treasury yields, rise in crude oil prices and fresh COVID-19 cases in a few Indian states. The equity market resumed its upward trajectory in early March 2021 following robust GST collections, positive GDP data for Q3:2020-21 and improvement in manufacturing and services PMI for February 2021. Market ebullience, however, sobered reflecting inflation worries and a surge in infections in certain states. During H2, FPIs were net buyers to the tune of ₹1.98 lakh crore while MFs were net sellers amounting to ₹0.99 lakh crore in the Indian equity market (Chart IV.12b). Resource mobilisation through public and rights issues of equity increased to ₹1.04 lakh crore during 2020-21 (up to February 2021) from ₹66,324 crore in the corresponding period of the previous year. IV.1.5. Foreign Exchange Market During H2:2020-21, the Indian rupee (INR) traded mostly with an appreciating bias against the US dollar on the back of growth revival and robust foreign investments amidst a weakening US dollar (Chart IV.13). After some depreciation in November 2020, the INR appreciated to ₹72.29 on February 24, 2021 owing to sustained strong FPI inflows but depreciated somewhat thereafter due to elevated global financial market volatility on the back of rising US yields, firming global crude prices and moderation in FPI inflows.
Strong FPI flows to most EMEs, largely driven by ample global liquidity, have induced an appreciation of their currencies. The appreciation of INR was modest relative to its EME peers in H2 (Chart IV.14a). In terms of the real effective exchange rate (REER), the INR depreciated between September 2020 and February 2021 in contrast to major EMEs (Chart IV.14b). In terms of the 40-currency nominal effective exchange rate (NEER), the INR depreciated by 0.2 per cent (at end-March 2021 over the average of September 2020), while it depreciated by 1.4 per cent in terms of the 40-currency REER (Table IV.3).
Table IV.3: Nominal and Real Effective Exchange Rate Indices (Trade-weighted)
(Base: 2015-16 = 100) | | Item | Index: end-March 2021
(P) | Appreciation (+) / Depreciation (-)
(Per cent) | | end-March 2021 over September (average) 2020 | | 40-currency REER | 104.0 | -1.4 | | 40-currency NEER | 94.7 | -0.2 | | 6-currency REER | 102.3 | -1.2 | | 6-currency NEER | 88.5 | -0.9 | | ₹/US$ | 73.5 | 0.0 | P: Provisional.
Sources: RBI; and FBIL. | Financial Barometer A cross-market financial barometer illustrates the recovery in financial markets from the height of the pandemic-induced disruptions.4 The barometer presents four different stages since the declaration of the pandemic. In response to the gradual unlocking of the economy and resumption of normal market activity, all nine indicators suggest improvement in financial market sentiments in March 2021 vis-à-vis the elevated stress levels of March and May 2020 (Chart IV.15). IV.1.6 Credit Market Credit offtake improved in H2, with the momentum picking up beginning October and registering a positive growth (financial year basis) since November. Non-food credit by scheduled commercial banks (SCBs) rose by 6.4 per cent (y-o-y as on March 12) as compared with 6.1 per cent a year ago (Chart IV.16). Credit growth accelerated across all bank groups, especially public sector banks (PSBs) (Chart IV.17a). Of the incremental credit extended by SCBs on a y-o-y basis (March 12, 2021 over March 13, 2020), 53.8 per cent was provided by PSBs, 45.7 per cent by private sector banks and 0.5 per cent by foreign banks (Chart IV.17b). Among major sectors5, credit to agriculture grew by 10.2 per cent (y-o-y) in February 2021 – the highest since April 2017 (Chart IV.18a). Credit growth to the services sector also remained strong. Credit to the industrial sector, however, contracted marginally by 0.2 per cent, mainly due to a decline in credit to large industries (which account for more than 80 per cent of credit to the industrial sector). On the positive side, credit to medium industries registered a robust growth of 21.0 per cent, reflecting the measures taken by the Government of India and the RBI for enhancing credit flows to the MSME sector. In terms of the contribution of different sectors in incremental credit, personal loans accounted for the largest share (41.7 per cent), followed by the services sector (39.0 per cent) (Chart IV.18b). In the overall non-food credit growth of February 2021, the relative contributions of personal loans and credit to the services sector were 2.7 percentage points and 2.5 percentage points, respectively (Chart IV.18c). 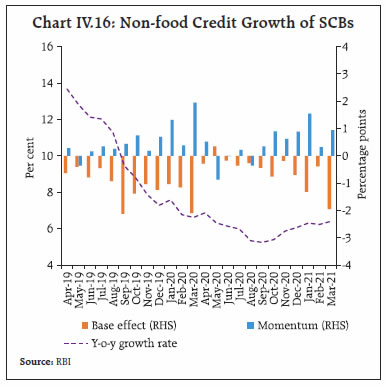 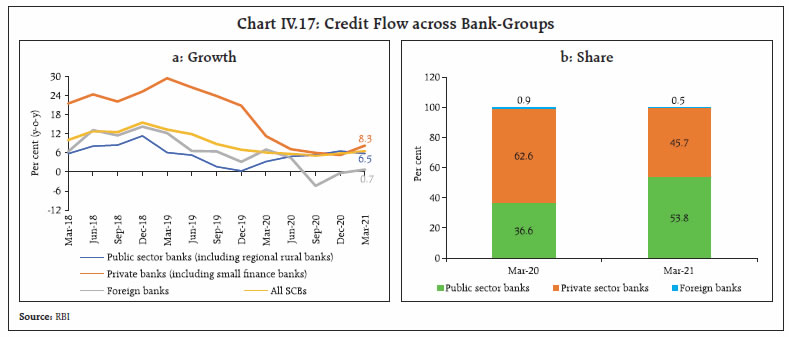 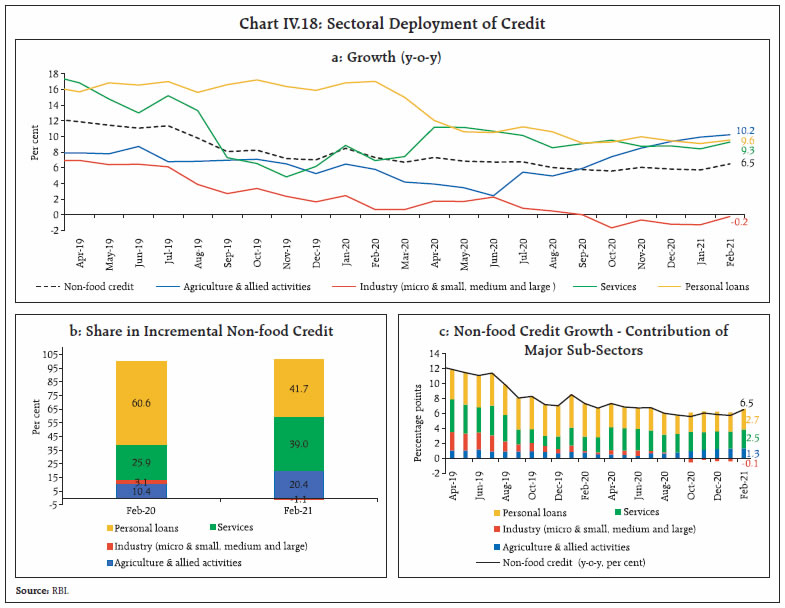 Within industry, credit to mining and quarrying, food processing, beverages and tobacco, textile, gems and jewellery, vehicle, vehicle parts and transport equipment registered accelerated growth (on a y-o-y basis) in February 2021. Credit growth to petroleum, coal products and nuclear fuels and cement and cement products, however, decelerated, while that to chemicals and chemical products, basic metal and metal products, construction, all engineering and infrastructure contracted. Unlike the sharp deceleration in credit to the industrial sector, that to the services sector accelerated during H2:2020-21 (up to February 2021) mainly due to robust credit offtake in transport operators and trade segments (Chart IV.19a). On a financial year basis (up to February 2021), credit growth to the services sector accelerated at a modest pace (Chart IV.19b). Personal loans segment, which has generally performed well in recent years, decelerated during H2 so far primarily due to a sharp slowdown in growth of housing loans, its largest component (Chart IV.19c). Amongst other constituents of personal loans, consumer durable loans and credit card outstanding witnessed tepid growth while loans against gold and jewellery picked up significantly (Chart IV.19d). The asset quality of SCBs improved during 2020-21 (up to December), with the overall non-performing assets (NPA) ratio declining to 6.8 per cent in December from 8.3 per cent in March 2020, reflecting mainly the regulatory dispensations in response to the COVID-19 pandemic (Chart IV.20a). The NPA ratios eased across all the major sectors over the same period (Chart IV.20b).
Banks’ non-SLR investments, i.e., investments in CPs, bonds, debentures and shares of public and private corporates fell in H2:2020-21 (up to March 12) (Chart IV.21a). Adjusted non-food credit growth (i.e., non-food credit including non-SLR investments) increased to 6.0 per cent as on March 12, 2021 from 5.5 per cent a year ago (Chart IV.21b). With muted credit offtake, strong deposit growth and increased government market borrowings, banks augmented their SLR investments. Excess SLR holdings increased to 11.4 per cent of net demand and time liabilities (NDTL) on February 26, 2021 from 8.2 per cent at end-March 2020 (Chart IV.22). IV.2 Monetary Policy Transmission Monetary transmission to deposit and lending rates of banks improved significantly during 2020-21, aided by large surplus liquidity, the implementation of the external benchmark system and subdued credit demand. The weighted average lending rate (WALR) on fresh rupee loans declined by 107 bps since March 2020 in response to the reduction of 115 bps in the policy repo rate (Table IV.4). The median spread charged by public sector banks returned to pre-COVID levels with the gradual return of normalcy in financial markets; however, it remained elevated for private sector banks (Chart IV.23). Spreads of WALRs on outstanding rupee loans and fresh rupee loans over 1-year MCLR were the lowest in respect of housing loans, reflecting lower defaults and the availability of collateral (Chart IV.24). Other personal loans i.e. loans other than housing, vehicle and education loans are mostly unsecured and involve higher credit risk and hence, the spread was the highest for this category. The lower WALRs on rupee export credit reflected the interest rate subvention provided by the government. 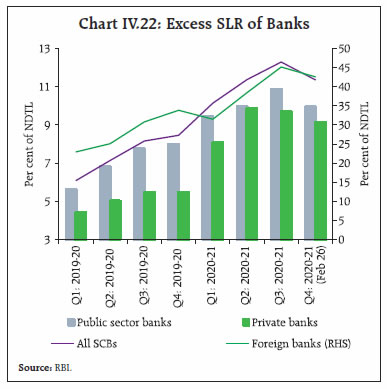
| Table IV.4: Transmission from the Repo Rate to Banks’ Deposit and Lending Rates | | (Basis points) | | Period | Repo Rate | Term Deposit Rates | Lending Rates | | Median Term Deposit Rate | WADTDR | 1 - Year Median MCLR | WALR - Outstanding Rupee Loans | WALR - Fresh Rupee Loans | | February - September 2019 (Pre-external benchmark) | -110 | -9 | -7 | -30 | 2 | -40 | | October 2019 - March 2021* (Post-external benchmark) | -140 | -175 | -145 | -120 | -100 | -138 | | March 2020 - March 2021* | -115 | -144 | -106 | -95 | -82 | -107 | | February 2019 - March 2021* | -250 | -205 | -152 | -150 | -98 | -178 | | October 2020 -March 2021* | 0 | -6 | -28 | -13 | -30 | -10 | *: Latest data on WADTDR and WALRs pertain to February 2021.
WADTDR: Weighted Average Domestic Term Deposit Rate.
MCLR: Marginal Cost of Funds-based Lending Rate.
WALR: Weighted Average Lending Rate.
Source: RBI. | 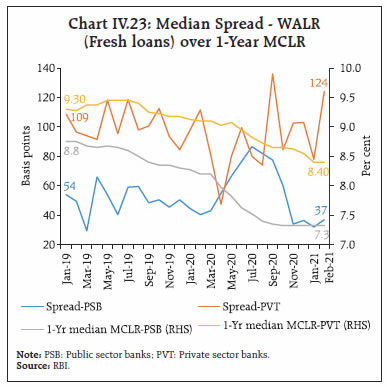 There has been a significant improvement in transmission to all new loans sanctioned since October 2019 in respect of the retail and MSE sectors where the new floating rate loans were mandatorily linked to one of the prescribed external benchmarks.6 The quantum of decline in WALRs on MSME loans, housing loans, vehicle loans and other personal loans exceeded the decline in WALR on aggregate fresh rupee loans to all sectors (138 bps) during the same period (Chart IV.25). Notably, the introduction of external benchmark linked loans has incentivised banks to adjust their term as well as saving deposit rates in line with the benchmark rates to protect their net interest margins (NIMs), thus accelerating the pace of transmission to lending rates by bringing down the overall MCLR and, in turn, lending rates on other sectors as well.7 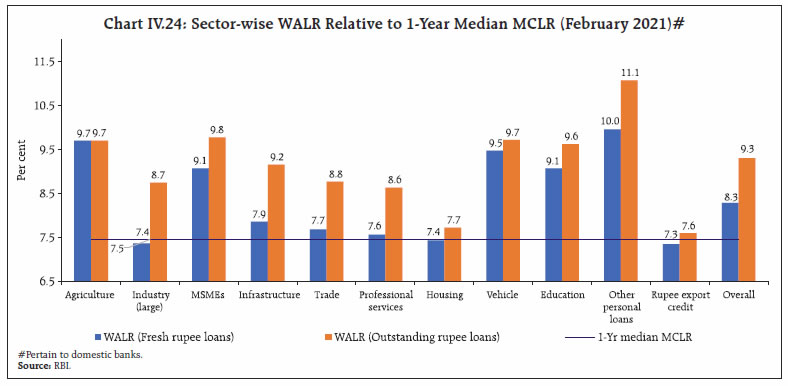 In respect of fresh rupee loans linked to the policy repo rate, the median spread charged by domestic banks was the highest in the case of other personal loans, which are mostly unsecured as indicated earlier (Table IV.5). Among the bank groups, the median spread charged by public sector banks for different categories of loans was lower than those of private sector banks.
Table IV.5: Loans linked to External Benchmark – Median Spread over Policy Repo Rate
(February 2021) | | (Percentage points) | | | Personal Loans | MSME Loans | | Housing | Vehicle | Education | Other Personal Loans | | Public Sector Banks (12) | 3.6 | 4.8 | 4.5 | 6.8 | 6.1 | | Private Sector Banks (20) | 6.7 | 7.2 | 7.4 | 7.8 | 7.0 | | Domestic Banks (32) | 4.4 | 5.0 | 4.8 | 7.0 | 6.5 | Note: Figures in parentheses are number of banks.
Source: RBI. | The responsiveness of term deposit rates to policy rate changes has also improved in the past year, reflecting the combined impact of surplus liquidity, the external benchmark-based pricing of loans and weak credit demand. The weighted average domestic term deposit rate (WADTDR) on outstanding rupee deposits declined by 152 bps during the ongoing easing cycle (i.e., since February 2019), of which the decline of 106 bps has occurred since March 2020. The median term deposit rate, which reflects the prevailing card rates, has registered a sizeable decline of 144 bps since March 2020 (Chart IV.26). Apart from the reduction in term deposit rates, banks have also lowered their saving deposit rates. These deposit rates of five major banks, which ranged 3.50- 4.00 per cent at the beginning of the current easing cycle (early February 2019) and 3.25-3.50 per cent immediately prior to the introduction of the external benchmark were placed at 2.70-3.00 per cent in March 2021. This adjustment in saving deposit rates is critical for transmission, given their large share (33.0 per cent as on March 12, 2021) in aggregate deposits. Amongst bank groups, the pass-through to deposit and lending rates was the highest for foreign banks (Chart IV.27). The deposit base of foreign banks is primarily made up of low cost and lower duration wholesale deposits which adjust quickly to policy rate changes, prompting faster transmission to lending rates as well.8 While the decline in WADTDR on outstanding rupee term deposits of private sector banks (170 bps) exceeded that of public sector banks (124 bps) in the current easing cycle, the reduction in lending rates was higher for the latter group. Historically, WADTDR of private sector banks has been higher than those offered by public sector banks. As credit demand slowed post COVID-19, private sector banks reduced their term deposit rates sharply, and their WADTDR fell below the level of public sector banks (Chart IV.28). Administered interest rates on small savings instruments – which compete with bank deposits and have a sizeable bearing on monetary transmission – are linked to market yields on G-secs with a lag and are fixed on a quarterly basis at a spread of 0-100 bps over and above G-sec yields of comparable maturities. The interest rates on the various small savings instruments, after being lowered sharply during Q1:2020-21 in alignment with the formula-based rates, were left unchanged during the remaining quarters of 2020-21 and Q1: 2021-22. The interest rates on small savings for various instruments are 69-198 bps higher than the formula-based rates (Table IV.6). IV.3 Liquidity Conditions and the Operating Procedure of Monetary Policy The RBI Act 1934 requires the RBI to place the operating procedure relating to the implementation of monetary policy and changes thereto from time to time, if any, in the public domain. In consonance with the accommodative stance of monetary policy, liquidity measures during H2:2020-21 aimed at reinforcing easy financial conditions to support the nascent economic recovery. Normal liquidity management operations – suspended in April 2020 in the face of COVID-related dislocations – were resumed in January 2021 with the Reserve Bank reiterating the availability of ample liquidity in the system. Overall, the total liquidity support announced by the Reserve Bank since February 6, 2020 (up to March 31, 2021) amounted to ₹13.6 lakh crore [6.7 (6.9) per cent of 2019-20 (2020-21) nominal GDP] (Table IV.7). 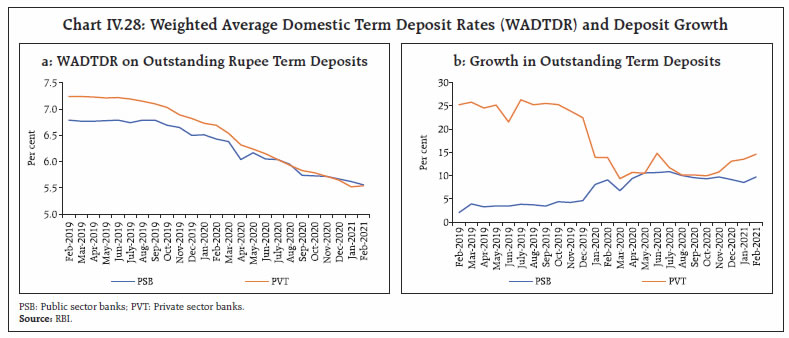
| Table IV.6: Interest Rates on Small Savings Instruments – Q1:2021-22 | | Small Savings Scheme | Maturity
(years) | Spread
(Percentage point) $ | Average G-sec Yield (%) of Corresponding Maturity
(December 2020 -February 2021) | Formula based Rate of Interest (%) (applicable for Q1:2021-22) | Government Announced Rate of Interest (%) in Q1:2021-22 | Difference
(basis points) | | (1) | (2) | (3) | (4) | (5) = (3) + (4) | (6) | (7) = (6) - (5) | | Savings Deposit | - | - | - | - | 4.00 | - | | Public Provident Fund | 15 | 0.25 | 6.16 | 6.41 | 7.10 | 69 | | Term Deposits | | | | | | | | 1 Year | 1 | 0 | 3.52 | 3.52 | 5.50 | 198 | | 2 Year | 2 | 0 | 4.02 | 4.02 | 5.50 | 148 | | 3 Year | 3 | 0 | 4.51 | 4.51 | 5.50 | 99 | | 5 Year | 5 | 0.25 | 5.51 | 5.76 | 6.70 | 94 | | Recurring Deposit Account | 5 | 0 | 4.51 | 4.51 | 5.80 | 129 | | Monthly Income Scheme | 5 | 0.25 | 5.49 | 5.74 | 6.60 | 86 | | Kisan Vikas Patra | 124 Months# | 0 | 6.16 | 6.16 | 6.90 | 74 | | NSC VIII issue | 5 | 0.25 | 5.63 | 5.88 | 6.80 | 92 | | Senior Citizens Saving Scheme | 5 | 1.00 | 5.51 | 6.51 | 7.40 | 89 | | Sukanya Samriddhi Account Scheme | 21 | 0.75 | 6.16 | 6.91 | 7.60 | 69 | $: Spreads for fixing small saving rates as per Government of India Press Release of February 2016.
#: Current maturity is 124 months.
Note: Compounding frequency varies across instruments.
Sources: Government of India; and RBI staff estimates. |
Table IV.7: Liquidity Measures since February 6, 2020
(As on March 31, 2021) | | (₹ crore) | | Measures | Announced Amount | | LTRO | 2,00,000 | | Variable rate repo | 2,25,000 | | SLF for PDs | 7,200 | | CRR cut | 1,37,000 | | MSF (dip by 1% in SLR) | 1,37,000 | | TLTRO | 1,00,000 | | TLTRO (2.0) | 50,000 | | Net OMO purchases | 1,50,000 | | Special liquidity facility for mutual funds | 50,000 | | Refinance to NABARD, SIDBI, NHB and EXIM Bank | 75,000 | | Special liquidity scheme for NBFCs | 30,000 | | 56-day term repo | 1,00,000 | | On Tap TLTRO | 1,00,000 | | Total | 13,61,200 | | As proportion of 2019-20 GDP (%) | 6.7 | | As proportion of 2020-21 GDP (%) | 6.9 | | Source: RBI. | Drivers and Management of Liquidity During Q3, the festival related expansion in currency in circulation (CiC) was the major source of leakage of liquidity (₹0.95 lakh crore), which was more than offset by the infusion through net forex operations (₹2.0 lakh crore) and OMO purchases (₹0.89 lakh crore), including three OMOs in state development loans (SDLs)9. Government spending and the drawdown of excess cash reserve ratio (CRR) balances by banks also augmented system liquidity (Chart IV.29a). Consequently, the surplus liquidity – as reflected in average daily net absorptions under the liquidity adjustment facility (LAF) – soared to ₹5.33 lakh crore during the quarter. Banks returned TLTRO funds amounting to ₹0.37 lakh crore – 33.1 per cent of the total amount of ₹1.13 lakh crore availed under the scheme. In Q4, surplus liquidity increased further to ₹5.9 lakh crore due to injection from forex operations and net OMO purchases, despite leakage through CiC and reduced government spending. Total OMO purchases during 2020-21 amounted to ₹3.13 lakh crore. Reserve money (RM) increased by 14.2 per cent (y-o-y) during 2020-21 (up to March 26) driven by currency demand while money supply (M3) increased by 12.6 per cent (y-o-y) (up to March 12). The surplus liquidity was mopped up through the overnight fixed rate reverse repo under the LAF and the reactivated 14-day variable rate reverse repos (VRRR) (Chart IV.29b). Five 14-day VRRR auctions of ₹2 lakh crore each were conducted in Q4, which were well received as reflected in the bid-cover ratio (bidding offers as a proportion of the notified amount) of 1.3 or more in each auction. The liquidity absorbed through the fixed rate reverse repo has steadily increased from a fortnightly average of ₹4.3 lakh crore during January 16-29, 2021 to ₹4.9 lakh crore during January 30 - March 31 (Chart IV.30). OMOs – both purchases and sales – are a key instrument to adjust the durable liquidity in the banking system in sync with the monetary policy stance. During 2020- 21, ₹1.00 lakh crore was infused through outright purchases from eight auction announcements (including three of state development loans). These announcements contributed to softening of yields (Box IV.1). 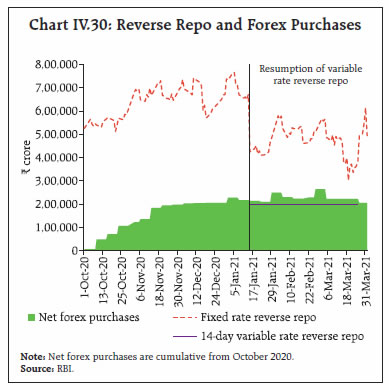 Box IV.1: Announcement Effect of Open Market Operations on Financial Markets OMO auctions conducted by the central bank not only impact government bond yields but also have a significant effect on other financial instruments, given that these are priced off risk-free government bonds. The instantaneous announcement effect of OMOs is examined for the benchmark 10-year government securities, AAA 5-year corporate bonds (CBs) and 5-year overnight index swaps (OIS)10 using daily data on secondary market yields/ rates spanning 10 years (January 2012 – January 2021) in an event study (ES) framework (Hartley and Rebucci, 2020). During the sample period, there were 98 OMO announcements – 83 purchases and 15 sales. These announcements were made after the closure of market trading hours; therefore, the difference in yields between the opening rate of the next trading day and the closing rate of the OMO announcement day, controlled for other factors, captures the announcement effect. Results from paired t-tests11 suggest negative and statistically significant softening in yields/rates, on an average, of (i) 2 bps on G-sec and corporate bonds; and (ii) 1 bps on OIS, validating the presence of announcement effects (Table IV.1.1)12. | Table IV.1.1: Closing and Opening Yields/Rates – Paired t-test | | Variable | Window | Mean | t-stat. | p-value | | 10-Yr G-Sec | Open (+1) - Close (0) | -0.02** | -2.39 | 0.01 | | 5-Yr CBs | Close (+1) - Close (0) | -0.02** | -2.02 | 0.02 | | 5-Yr OIS | Open (+1) - Close (0) | -0.01** | -2.35 | 0.01 | Note: Close (0): Announcement day closing; Open (+1): Next day opening; Close (+1): Next day closing.
** represents significance at 5 per cent. | The instantaneous announcement impact is corroborated by regression analysis of the events (OMO announcements) with appropriate controls viz., for intraday global factors through the global economic policy uncertainty index [GEPUI]13, the inter-day difference in yields/rates on the announcement day as an indicator of the hysteresis phenomenon14 and changes in liquidity to account for intra-day liquidity effects on corporate bonds in the baseline regression (Reg-1). Apart from these variables, the size of the OMO auction is included in the second regression (Reg-2). Finally, for identifying the impact of the prevailing liquidity conditions on the announcement effect, an interaction term between the size of the OMO purchase announcement and the liquidity conditions on the announcement day is also included in the third regression (Reg-3).15 The impact of the OMO announcement is captured by the constant term (C) in Reg-1 and by the coefficients on OMO auction amounts (as percentage of NDTL) in Reg-2 and Reg-3. All the control variables are demeaned (by taking deviation from the mean). 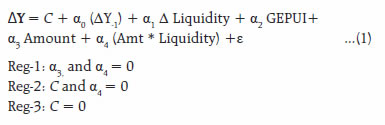 The estimates of Reg-1 indicate that, on an average, the OMO announcements soften G-sec, corporate bond yields and OIS rates by 2-3 basis points (bps) each (Table IV.I.2). While the hysteresis phenomenon is significant only in the G-sec segment, increased global uncertainty marginally hardens yields/rates across markets (statistically significant). Every ₹10,000 crore of OMO auction announcement (equivalent to 0.1 per cent of NDTL, on an average) eases yields/rates by 1-2 bps (Reg-2). The interaction term in Reg-3 is found to be statistically significant in the G-sec and corporate bond segment, suggesting that the prevailing liquidity situation also matters – thus, the announcement effect is expected to be larger in deficit liquidity conditions. Overall, the analysis indicates that the OMO announcements during 2020-21 have cumulatively eased G-sec and corporate bond yields by about 20-25 bps each and the OIS rates by around 10 bps. Special OMOs (OTs), LTRO and TLTRO auctions also had a significant impact on G-sec yields, thereby moderating the term spread (Talwar et. al, 2021). | Table IV.1.2: Announcement Effect of OMOs | | | Reg-1 | Reg-2 | Reg-3 | | G-sec | CBs | OIS | G-sec | CBs | OIS | G-sec | CBs | OIS | | Dependent Variable | | Independent Variables | ΔY
(open(+1)-close(0)) | ΔY
(close(+1)-close(0)) | ΔY
(open(+1)-close(0)) | ΔY
(open(+1)-close(0)) | ΔY
(close(+1)-close(0)) | ΔY
(open(+1)-close(0)) | ΔY
(open(+1)-close(0)) | ΔY
(close(+1)-close(0)) | ΔY
(open(+1)-close(0)) | | Constant (C) | -0.03*** | -0.03*** | -0.02*** | - | - | - | - | - | - | | ΔY (close (0)-open (0)) | 0.72*** | - | 0.06 | 0.73*** | - | 0.09 | 0.74*** | - | 0.09 | | ΔY (close (0)-close(-1)) | - | 0.25 | - | - | 0.25 | - | - | 0.24 | - | | ΔLiquidity (close (+1)-close (0)) | - | -0.06 | - | - | -0.05 | - | - | -0.05 | - | | GEPUI | 0.0002*** | 0.0001** | 0.0001** | 0.0001** | 0.0001* | 0.00005** | 0.0002*** | 0.0001 | 0.0000** | | Amount | - | - | - | -0.18*** | -0.14* | -0.10** | -0.33*** | -0.25** | -0.11** | | Amount x Liquidity | - | - | - | - | - | - | -0.07* | -0.06** | -0.001 | | Diagnostic (p - value) | | | | | | | | | | | B-G LM Test | 0.456 | 0.064 | 0.209 | 0.458 | 0.139 | 0.112 | 0.578 | 0.098 | 0.117 | | Arch-LM Test | 0.856 | 0.099 | 0.839 | 0.933 | 0.135 | 0.946 | 0.953 | 0.151 | 0.947 | Note: close (0): Announcement day closing; open (+1): Next day opening; close (+1): Next day closing; close(-1): Previous day closing; ***, ** and * represent significance at 1 per cent, 5 per cent and 10 per cent, respectively.
Source: RBI staff estimates. | References: Hartley, J. S. and A. Rebucci (2020), “An Event Study of COVID-19 Central Bank Quantitative Easing in Advanced and Emerging Economies”, NBER Working Paper No. 27339, June. Talwar, B. A., Kushawaha, K.M., and I. Bhattacharyya (2021), “Unconventional Monetary Policy in Times of COVID-19”, RBI Bulletin, March, pp 41-56. | Policy Measures To nurture the revival of activity in sectors that have multiplier effects on growth, the Reserve Bank announced “On-tap targeted long-term repo operations (TLTRO)” with tenors of up to three years for a total amount of up to ₹1 lakh crore at a floating rate linked to the policy repo rate in October 2020. The liquidity availed by banks under the scheme is to be deployed in corporate bonds, commercial paper and non-convertible debentures issued by the entities in five sectors16 over and above their investments in these instruments as on September 30, 2020. Moreover, to enable banks to exploit the synergies between central bank liquidity under on-tap TLTRO scheme and the Emergency Credit Line Guarantee Scheme 2.0 (ECLGS 2.0) of the Central Government, the Reserve Bank expanded the scope of the on-tap TLTRO in December to all stressed sectors identified by the Kamath Committee in addition to the five sectors announced earlier in October 2020. In February 2021, the RBI (i) allowed lending by banks to NBFCs under the TLTRO on-tap scheme for incremental lending to specified stressed sectors; (ii) announced a gradual restoration of the cash reserve ratio (CRR) in two phases in a non-disruptive manner to 3.5 per cent of NDTL effective March 27, 2021 and 4.0 per cent effective May 22, 2021; (iii) extended the facility for availing funds under the marginal standing facility (MSF) by dipping into the SLR up to 3.0 per cent of NDTL until September 30, 2021; and (iv) provided CRR exemption for credit flows to new MSME borrowers on exposures up to ₹25 lakh per borrower for credit extended up to October 1, 2021. During H2:2020-21, thirteen auctions of OTs have been conducted. In March, the scale of OTs was increased to ₹15,000 crore (on March 4) and subsequently an asymmetric OT having a liquidity impact (purchase ₹20,000 crore; sales ₹15,000 crore) was conducted on March 10, 2021 which elicited favourable response on the purchase leg with bid-cover ratio of 4. As staff and IT resources were severely affected in financial markets with the onset of the COVID-19 pandemic, the RBI shortened trading hours for various markets regulated by it effective April 7, 2020. Subsequently, with the phased roll-back of the lockdown and easing of restrictions on movement of people and resumption of normal functioning of offices, the RBI decided to restore trading hours in a phased manner beginning November 9, 2020. To meet any additional / unforeseen demand for liquidity and to provide flexibility to the banking system in year-end liquidity management, the Reserve Bank decided to conduct two fine-tuning variable rate repo auctions of ₹ 0.25 lakh crore each on March 26 and March 31, 2021 of 11 days and 5 days tenor, respectively. Furthermore, it was decided not to conduct the 14-day VRRR auction on March 26 to ensure the availability of ample liquidity for managing year-end requirements. IV.4 Conclusion During H2, domestic financial markets and conditions remained congenial, supported by ample surplus liquidity. Market activity continued to revive, building on the recovery witnessed in the later part of H1 and steered by the forward guidance provided on liquidity and the orderly evolution of the yield curve. The pace of monetary transmission improved further and bank credit growth registered an upturn. Going forward, the RBI’s market operations would ensure ample surplus liquidity in consonance with the accommodative policy stance to revive growth on a durable basis and mitigate the impact of COVID-19 on the economy. _________________________________________________________
V. External Environment In Q1:2021 (January-March), the global economy gradually regained momentum. Rapid mutations of the virus, concerns over the effectiveness of available vaccines and limited access to vaccines in many countries keep the near-term outlook clouded and the recovery remains fragile, incomplete, uneven and divergent. Inflation risks are widely perceived to be rising in an environment of exceptional monetary and fiscal accommodation, leading to turbulence in global financial markets and capital outflows from emerging markets in the second half of Q1:2021. In Q1:2021 (January-March), the global economy gradually regained momentum of recovery gathered in Q3:2020, which had encountered headwinds in Q4 as many advanced economies (AEs) and some emerging market economies (EMEs) had to reimpose restrictions/lockdowns in the wake of second/third wave of infections coupled with the newer and more virulent strains of the virus. Mass vaccination drives are underway in several countries, but rapid mutations of the virus, concerns over the effectiveness of available vaccines and limited access to vaccines in many countries keep the near-term outlook clouded and the recovery remains fragile, incomplete, uneven and divergent. Prolonged monetary accommodation, easy financial conditions and rounds of fiscal stimulus buoyed stock markets around the world, with strong rallies pushing equity valuations to record levels in February 2021 to a point of disconnect with the real economy. In the bond market, short term yields remain anchored on low policy rates, but longer-term yields have surged since the second half of February 2021 across the world on rising inflation expectations and apprehensions about possible reversal of monetary policy stances. In turn, equity and currency markets have experienced bouts of volatility. Commodity prices continue to spiral up under a combination of supply disruptions and revival of demand, translating into intensifying input price pressures on account of severely stretched supply chains. Consequently, inflation risks are widely perceived to be rising in an environment of exceptional monetary and fiscal accommodation, leading to turbulence in global financial markets and capital outflows from emerging markets in the second half of Q1:2021. V.1 Global Economic Conditions Economic activity across major AEs and EMEs posted a strong recovery in Q3:2020, following a record plunge in Q2 amidst widespread lockdowns. As stated earlier, activity stalled again in Q4 as countries battled new waves of infections and speedily communicable mutations of the virus. With inoculations underway, high frequency indicators, however, point to some pick-up in Q1:2021. Nonetheless, activity remains below the pre-pandemic levels even as GDP contractions ease across major economies. The US economy contracted by 3.5 per cent in 2020, marking an abrupt halt to its expansion for more than a decade (Table V.1). Notwithstanding steady decline in the unemployment rate from a record level of April 2020, labour market conditions remain weak and fragile with employment well below the Federal Reserve's (Fed's) goal of full employment. Incoming data for Q1:2021 suggest some stabilisation – retail sales picked up sharply in January before moderating in February on severe winter weather, and the Institute for Supply Management (ISM)’s manufacturing purchasing managers' index (PMI) in March posted its strongest expansion since December 1983. US$1.9 trillion fiscal stimulus by the new administration has boosted prospects for the US economy. | Table V.1: Real GDP Growth | | (Per cent) | | Country | Q1- 2020 | Q2- 2020 | Q3- 2020 | Q4- 2020 | 2020 (E) | 2021 (P) | 2022 (P) | | Quarter-over-quarter, seasonally adjusted annualised rate (Q-o-q, SAAR) | | Canada | -7.5 | -38.5 | 40.6 | 9.6 | - | - | - | | Euro area | -14.2 | -38.8 | 59.9 | -2.6 | - | - | - | | Japan | -2.2 | -29.3 | 22.8 | 11.7 | - | - | - | | South Korea | -5.0 | -12.0 | 8.8 | 5.0 | - | - | - | | UK | -10.9 | -57.9 | 87.1 | 5.2 | - | - | - | | US | -5.0 | -31.4 | 33.4 | 4.3 | - | - | - | | Year-on-year (Y-o-y) | | Advanced Economies | | Canada | -0.3 | -12.7 | -5.3 | -3.2 | -5.4 | 3.6 | 4.1 | | Euro area | -3.3 | -14.6 | -4.2 | -4.9 | -6.6 | 4.2 | 3.6 | | Japan | -2.0 | -10.3 | -5.8 | -1.4 | -4.8 | 3.1 | 2.4 | | South Korea | 1.4 | -2.7 | -1.1 | -1.2 | -1.0 | 3.1 | 2.9 | | UK | -2.2 | -21.4 | -8.5 | -7.3 | -9.8 | 4.5 | 5.0 | | US | 0.3 | -9.0 | -2.8 | -2.4 | -3.5 | 5.1 | 2.5 | | Emerging Market Economies | | Brazil | -0.3 | -10.9 | -3.9 | -1.1 | -4.1 | 3.6 | 2.6 | | China | -6.8 | 3.2 | 4.9 | 6.5 | 2.3 | 8.1 | 5.6 | | India | 3.0 | -24.4 | -7.3 | 0.4 | -8.0 | 11.5 | 6.8 | | Indonesia | 3.0 | -5.3 | -3.5 | -2.2 | -2.1 | 4.8 | 6.0 | | Philippines | -0.7 | -16.9 | -11.4 | -8.3 | -9.5 | 6.6 | 6.5 | | Russia | 1.4 | -7.8 | -3.5 | -1.8 | -3.0 | 3.0 | 3.9 | | South Africa | 0.4 | -17.8 | -6.2 | -4.1 | -7.0 | 2.8 | 1.4 | | Thailand | -2.1 | -12.1 | -6.4 | -4.2 | -6.1 | 2.7 | 4.6 | | Memo: | 2020 (E) | 2021 (P) | 2022 (P) | | World Output | -3.5 | 5.5 | 4.2 | | World Trade Volume | -9.6 | 8.1 | 6.3 | E: Estimate. P: Projection. -: Not applicable.
Note: India's data correspond to fiscal year (April-March).
Sources: Bloomberg; Official statistical agency of each country and IMF WEO Update, January 2021. | Euro area GDP declined by 6.6 per cent in 2020, with Q4 reading reversing the strong rebound witnessed in Q3 as emergence of the second wave of the virus along with more virulent strains led to a re-clamping of lockdowns across major constituent economies. This weakness continued into Q1:2021 with most economies extending lockdown restrictions even as they continued with the slow pace of vaccination. Consumer and business sentiments remain weak, with declining retail sales in January and the fourth consecutive month of decline in the composite PMI in February owing to subdued service sector activity. The Japanese economy expanded by 11.7 per cent (q-o-q, SAAR) in Q4, extending the third quarter’s recovery from the worst recession witnessed in the first half of 2020. Resilient trade conditions as reflected in a strong pick-up in exports and high capital spending underpinned by significant government support led to the GDP expansion. With the third wave of COVID-19 infections and the re-imposition of the state of emergency in the Tokyo area, however, the momentum for recovery slowed down in Q1, accompanied by large contractions in retail sales and industrial production in January and February. The manufacturing PMI, on the other hand, expanded in February 2021 for the first time since April 2019, with March witnessing further expansion. In the UK, GDP expanded in Q4, but it moderated from the record pace registered in Q3, leading to an overall contraction of 9.8 per cent in 2020. In early Q1:2021, infections reached new peaks, with newer and more contagious variants pushing the economy into its third nationwide lockdown in January. Furthermore, the new trading arrangement with the European Union (EU) post-Brexit is likely to weigh on activity in early 2021. The economic recovery continued in China for the third consecutive quarter in Q4, resulting in an overall annual increase of 2.3 per cent in 2020 and making it the only major economy to register growth in a pandemic-ravaged year (Table V.2). China’s growth has been powered by strong and robust recovery in manufacturing and exports underpinned by policy support measures. By contrast, the recovery in consumption activity remains relatively weak. The Chinese economy seems to have lost some steam in Q1 from COVID-19 flare-ups in January and the associated containment measures. The Caixin composite PMI – though in expansion – eased to a ten-month low in February. Even the Caixin manufacturing PMI for March turned out to be the lowest in the current 11-month period of expansion. | Table V.2: Select Macroeconomic Indicators for BRICS | | | Country | 2020 (E) | 2021 (P) | | Country | 2020 (P) | 2021 (P) | Real GDP growth rate
(per cent) | Brazil | -4.1 | 3.6 | General Govt. gross debt
(as per cent of GDP) | Brazil# | 95.6 | 92.1 | | Russia | -3.0 | 3.0 | Russia | 21.0 | 20.7 | | India | -8.0 | 11.5 | India | 85.5 | 83.1 | | China | 2.3 | 8.1 | China | 65.2 | 69.4 | | South Africa | -7.0 | 2.8 | South Africa | 77.7 | 84.9 | | | Country | 2020 | 2021(P) | | Country | 2020 (P) | 2021 (P) | CPI inflation rate
(per cent) | Brazil | 3.2 | 2.9 | Current account balance
(as per cent of GDP) | Brazil | 0.3 | 0.02 | | Russia | 3.4 | 3.2 | Russia | 1.2 | 1.8 | | India | 6.1@ | 3.7 | India | 0.3 | -0.9 | | China | 2.5 | 2.7 | China | 1.3 | 0.7 | | South Africa | 3.3 | 3.9 | South Africa | -1.6 | -1.8 | | | Country | 2020 (P) | 2021(P) | | Country | 2020 | 2021(P) | General Govt. net lending/ borrowing
(as per cent of GDP) | Brazil | -16.8 | -6.5 | Forex reserves*
(in US$ billion) | Brazil | 355.6 | 356.1 | | Russia | -5.3 | -2.6 | Russia | 596.1 | 586.3 | | India | -13.1 | -10.9 | India | 588.4 | 586.7 | | China | -11.9 | -11.8 | China | 3536.0 | 3528.8 | | South Africa | -14.0 | -11.1 | South Africa | 54.2 | 53.3 | P: Projection. E: Estimate.
*: Forex reserves for 2021 pertain to February 2021.
#: Gross debt refers to the nonfinancial public sector, excluding Eletrobras and Petrobras, and includes sovereign debt held by the central bank.
@: Average of the period from June 2020 to February 2021.
Notes: India's data correspond to fiscal year (April-March).
Sources: Bloomberg; Official statistical agency of each country; WEO October 2020 database and January 2021 Update; IMF Fiscal Monitor Update, January 2021; and IRFCL, IMF. | The Brazilian economy contracted in Q4 on y-o-y basis following declines in household and government consumption expenditure, while weak services and external sector activity added further downward pressures. The near-term growth outlook remains clouded with emergency transfer programs expected to unwind, while the more contagious COVID-19 P1 variant continues to spread rapidly weighing heavily on economic activity with the composite PMI reflecting contraction since January 2021. The Russian economy contracted in 2020, with a modest recovery in H2 (July-December) preventing a deeper plunge. The South African economy rebounded sharply in Q3:2020 following a historic plunge in Q2, driven primarily by manufacturing, mining and trade activity. In Q4, the recovery slowed down, with new waves of the deadly virus amidst a slow vaccine rollout and renewed load shedding. These factors extended into Q1:2021. Across major South-East Asian economies, GDP declined in Q4:2020, with contraction varying in the range of (-) 2.2 per cent to (-) 8.3 per cent (y-o-y) as the virus impeded economic activity. The global composite PMI moderated during November-January within the expansion zone as the resurgence of infections across major economies pulled down services activity, especially in the contact-intensive industries. There was some uptick in February readings for both manufacturing and services activity on the back of the strong performance in the US (Chart V.1a). Composite leading indicators (CLIs) suggest growth is stabilising across major AEs and EMEs (Chart V.1b). 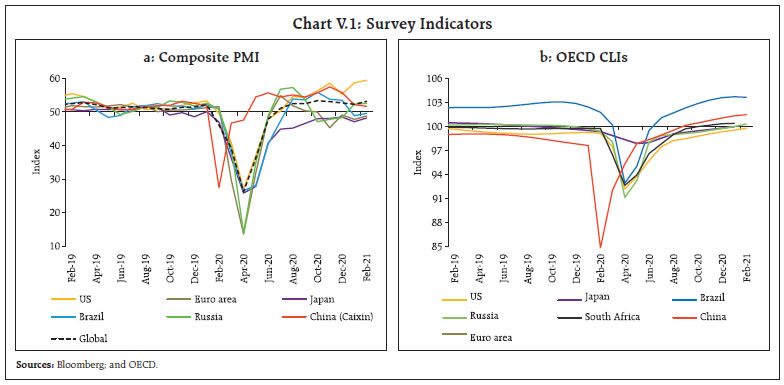 Global trade recovered faster than expected from the deep contraction witnessed in Q2:2020 on the back of the robust trade performance of EMEs (Chart V.2a). The WTO’s Goods Trade Barometer rebounded in Q4:2020; however, this momentum is unlikely to be sustained in H1:2021 (January-June) as its key constituents such as export orders and automotive products have started showing signs of deceleration. The Baltic Dry Index, which measures shipping costs for a wide variety of bulk commodities such as coal, iron ore, and grain, rose sharply in January and February 2021 due to firming container shipping freight rates and an unfavourable base effect (Chart V.2b). V.2 Commodity Prices and Inflation Global commodity prices have been rising since May, after recovering from a plunge in the early part of 2020. The Bloomberg commodity price index increased by 17.8 per cent between September 2020 and March 2021. The food price index of the Food and Agriculture Organization (FAO) increased by 18.4 per cent between September 2020 and February 2021 – the index was at its highest level in February 2021 since July 2014, with pressures being particularly high for vegetable oil prices due to tightening availability of supplies among major exporters. For meat, low demand for poultry meat amidst avian influenza outbreaks has kept price pressures somewhat muted (Chart V.3a). Crude oil prices lost some steam in September-October on waning demand prospects but have picked up since November on vaccine optimism and extension of production cuts by OPEC plus. The US stimulus and Brexit agreement further boosted the market sentiments. In February, prices surged to their highest level since the pandemic amidst tightening global supplies and falling crude inventories in the US and Europe. Saudi Arabia’s decision to voluntarily cut production by an additional 1.0 million barrels per day during February-April added to bullish sentiments. Following an attack on Saudi Arabia’s oil facilities, Brent prices increased further, moving closer to US$70 per barrel in mid-March. However, prices corrected thereafter, on near-term demand concerns amidst rising infections and build up in the US crude inventories. Despite the correction, Brent crude prices increased by 21.9 per cent in Q1:2021 (Chart 3b). Base metal prices, measured by the Bloomberg’s base metal spot index, increased by 28.4 per cent between September 2020 and March 2021, surpassing pre-COVID levels on strong rallies witnessed in H2:2020. The upturn has been primarily driven by strong restocking by China and positive sentiments propelled by stimulus measures across major economies. The robust recovery in manufacturing and industrial activity along with persistent supply chain disruptions, shipping difficulties and labour and container shortages have boosted prices of industrial metals. In contrast, gold prices after wrapping up the year 2020 with a phenomenal gain of 25.1 per cent, lost sheen with prices correcting by 10.0 per cent in Q1:2021. Rising US bond yields, the strengthening US dollar and strong risk-on sentiments reduced the safe haven appeal of the yellow metal (Chart V.4). 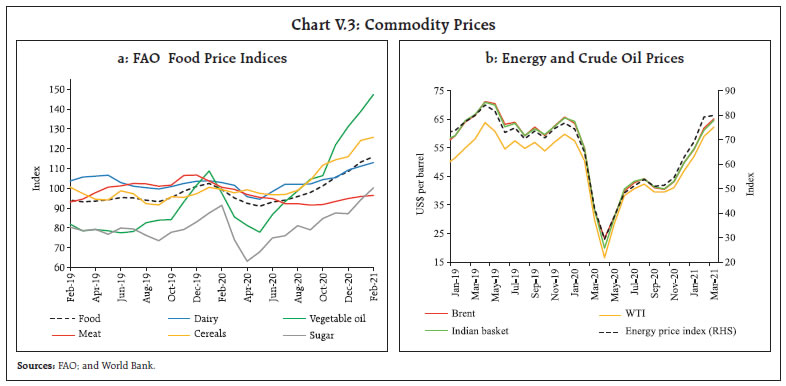
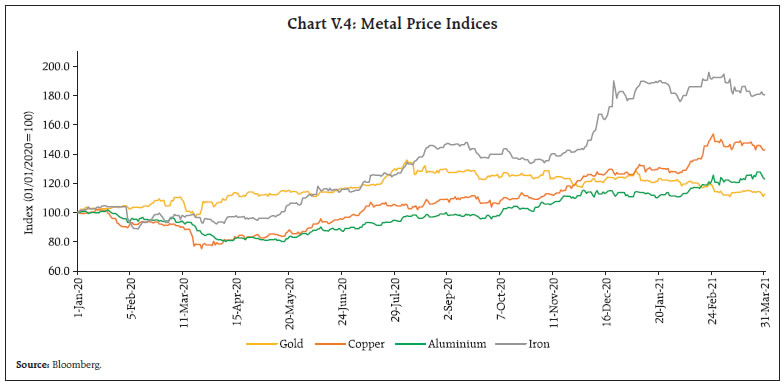 CPI inflation remains benign and below target in major AEs, while for major EMEs, barring China, Thailand and Indonesia, CPI inflation has mostly picked up, even moving above targets in a few of them (Table V.3). In the US, inflation based on the personal consumer expenditures (PCE) price index has risen since December. However, average inflation remains well below the Fed’s 2 per cent target as relatively soft aggregate demand and earlier declines in consumer energy prices contained price pressures. Inflation expectations have, however, shown some uptick in the latest readings of survey-based measures. After being in deflation for the last five months of 2020, Euro area CPI inflation has moved back to the positive zone since January 2021 on rising cost of services and non-energy industrial goods with energy prices rebounding in March. Nonetheless, inflation remains low and below the ECB’s target owing to substantial slack in product and labour markets. In Japan, CPI remained in deflation for the fifth consecutive month in February as COVID-19 weighed on demand; lower crude oil prices in the initial period and discounts on travel within Japan through the ‘Go To Travel’ campaign by the national government added to the downside. In the UK, CPI inflation remains relatively subdued over both direct and indirect COVID-induced factors, particularly the reduction in value added tax for certain services and lower energy prices. Despite some pick-up in December-January, it remains way below the Bank of England’s (BoE's) target (Chart V.5a). | Table V.3: Inflation Performance | | (Per cent) | | Country | Inflation Target | Q1:2020 | Q2:2020 | Q3:2020 | Q4:2020 | Q1:2021 | | Advanced Economies | | Canada | 1.0-3.0 | 1.8 | 0.0 | 0.2 | 0.8 | 1.1 | | Euro area | 2.0 | 1.1 | 0.2 | 0.0 | -0.3 | 1.0 | | Japan | 2.0 | 0.5 | 0.1 | 0.2 | -0.8 | -0.5 | | UK | 2.0 | 1.7 | 0.6 | 0.6 | 0.5 | 0.6 | | US | 2.0 | 1.7 | 0.6 | 1.2 | 1.2 | 1.5 | | Emerging Market Economies | | Brazil | 3.75 ± 1.5 | 3.8 | 2.1 | 2.6 | 4.2 | 4.9 | | Russia | 4.0 | 2.4 | 3.1 | 3.6 | 4.4 | 5.5 | | India | 4.0 ± 2.0 | 6.7 | 6.2* | 6.9 | 6.4 | 4.5 | | China | - | 5.0 | 2.7 | 2.3 | 0.1 | -0.3 | | South Africa | 3.0-6.0 | 4.4 | 2.4 | 3.1 | 3.2 | 3.1 | | Indonesia | 3.0 ± 1.0 | 2.9 | 2.3 | 1.4 | 1.6 | 1.5 | | Philippines | 3.0 ± 1.0 | 2.7 | 2.3 | 2.5 | 3.1 | 4.5 | | Thailand | 1.0-3.0 | 0.4 | -2.7 | -0.7 | -0.4 | -0.5 | | Turkey | 5.0 | 12.1 | 11.7 | 11.8 | 13.5 | 15.6 | *: Data refer to June 2020 only.
Notes: (1) Inflation for the US is in terms of personal consumption expenditure.
(2) Quarterly inflation is the simple average of inflation in each month of the quarter. Q1:2021 is the average of the months for which data are available.
(3) The ECB aims at inflation rates of below, but close to 2%. The Fed adopted ‘flexible average inflation targeting’ in August 2020 wherein it would allow the inflation rate to go above the target of 2 per cent rate for brief periods to make up for the shortfall from the target in earlier periods. Bank of Canada aims to keep inflation at the 2 per cent mid-point of an inflation control target range of 1-3 per cent.
(4) Brazil’s inflation target for 2020 was 4.0 ± 1.5 per cent.
Sources: Central bank websites; and Bloomberg. | In Russia, the inflation rate has overshot the target since November 2020, primarily attributed to the weakening ruble and firming global commodity prices, especially food prices, besides the lingering supply side disruptions inflicted by the pandemic. In Brazil too, CPI inflation has edged up, though it remains within the central bank’s target range. The increase in global commodity prices, the depreciating Brazilian real and rapid recovery in domestic demand supported by emergency aid programs, led to the upward pressures in prices. CPI inflation in South Africa saw some uptick in January on higher prices for food, housing and utilities, and miscellaneous goods and services. In February, however, it eased marginally, moving below the central bank’s target range on softening health and food prices. China, on the other hand, registered deflation since November, barring December. There has been a significant easing in consumer prices due to lower pork prices on improved supply and favourable base effects. Renewed lockdown restrictions due to fresh outbreaks resulting in decreased travel and consumer spending before the Chinese new year in February also kept the price pressures low (Chart V.5b). V.3 Monetary Policy Stance In order to mitigate the impact of the COVID-19 pandemic on their domestic economies, governments and central banks have provided unprecedented and large fiscal and monetary stimuli since March 2020. The IMF estimates that the total fiscal support pledged in 2020 through additional spending, revenue foregone and liquidity support was about US$14 trillion or 13.5 per cent of world GDP (Table V.4). Monetary policy turned even more accommodative with expansion of asset purchase programmes and launch/extension of special liquidity programmes by central banks in most AEs and EMEs in Q4:2020. Rate cuts continued in both Q4:2020 and Q1:2021, mainly by EMEs. A few major EMEs, however, raised rates in March in response to inflation concerns. 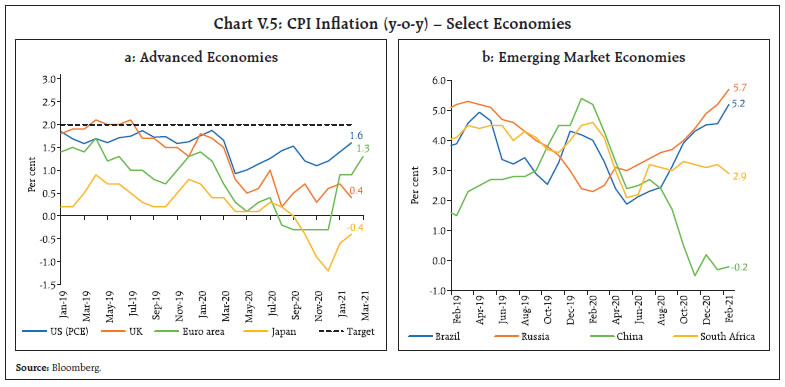
| Table V.4: Fiscal Support in 2020 in Response to COVID-19 | | (Amount in US$ billion; Per cent as proportion of GDP) | | Country | Amount | Per cent | | Advanced Economies | - | 24.0 | | Canada | 306 | 18.7 | | European Union | 1,358 | 10.6 | | Japan | 2,210 | 44.0 | | UK | 877 | 32.4 | | US | 4,013 | 19.2 | | Emerging Market Economies | - | 6.1 | | Brazil | 206 | 14.5 | | Russia | 63 | 4.4 | | India | 215 | 8.1 | | China | 904 | 6.0 | | South Africa | 28 | 9.8 | | Source: IMF Fiscal Monitor Update, January 2021. | The Fed has maintained the target range for the federal funds rate at 0 to 0.25 per cent since March 2020. The Federal Open Market Committee (FOMC) has since December 2020 stated that monthly asset purchases of at least US$80 billion of Treasury securities and US$40 billion of agency mortgage-backed securities would continue till further progress has been made towards the maximum employment and price stability goals. The Fed also extended the temporary dollar liquidity swap lines and the temporary repurchase agreement facility for foreign and international monetary authorities up to September 2021. In March, the Fed extended the Paycheck Protection Program Liquidity facility by three months up to June 2021 to provide support for the flow of credit to small businesses. The FOMC increased the per counterparty limit for overnight reverse repo to US$80 billion from US$30 billion. The European Central Bank (ECB) in its December 2020 meeting increased purchases under the Pandemic Emergency Purchase Program (PEPP) by €500 billion (approximately US$607 billion)1 to €1.85 trillion (approximately US$2.25 trillion) and extended the horizon for purchases by nine months to end-March 2022. Furthermore, it also extended the period for the more favourable terms of the third series of the targeted longer-term refinancing operations by 12 months to June 2022, besides other recalibrations. The collateral easing measures were extended up to June 2022. Four additional Pandemic Emergency Longer-Term Refinancing Operations would be conducted in 2021. The Eurosystem repo facility for central banks and all temporary swap/repo lines with non-euro area central banks were extended till March 2022. In March 2021, the ECB said that purchases under the PEPP would be at a significantly higher pace over the next quarter compared to the initial months of the year. The BoE has maintained a pause on the Bank Rate at its all-time low of 0.1 per cent since March 2020. In its November 2020 meeting, the BoE increased the target stock of purchase of UK government bonds by an additional £150 billion (approximately US$197 billion). In March 2021, the UK government updated the remit of BoE’s Monetary Policy Committee (MPC) to reflect the “government’s economic strategy for achieving strong, sustainable and balanced growth that is also environmentally sustainable and consistent with the transition to a net zero economy.”2 Given the implications of climate change for monetary policy and financial stability, a number of central banks are actively pursuing green goals (Box V.1). Box V.1: Central Bank Actions to Mitigate Climate Change Risk: Cross-country Experience In 2020, the average temperature of global land and ocean surfaces was 1.17°C higher than the twentieth-century average of 13.9°C, making it the second warmest year on record. The five warmest years since 1880 have been only recently after 2015 (Chart V.1.1a). Global temperatures are expected to increase by another 1.5 degree between 2030 and 2052, and to continue upwards thereafter [Intergovernmental Panel on Climate Change (IPCC), 2018]. The rise in global temperature is mainly attributed to an increase in greenhouse gas emissions. As a result, El Niño–Southern Oscillation changes in the global atmospheric circulation have been wild, influencing, in turn, temperature and precipitation across the globe (Chart V.1.1b). The higher global temperatures and the associated shifts in weather patterns are key risks to the growth and inflation outlook across AEs and EMEs through various channels. While the most evident channel is agricultural output, others could be adverse effects on labour productivity, mortality rates and investment decisions (Acevedo et al., 2018; Batten, 2020). Thus, climate change poses severe challenges to the central banks’ mandate of price and financial stability. Conventional models followed by the central banks cannot predict climate-related risks accurately, including exposure to “green swan”3 risks, which are in nature of “climate black swan events”, i.e., extreme financially disruptive events that could be the next systemic financial crisis (Bolton et al. 2020). In 2017, eight central banks and supervisors established the Network of Central Banks and Supervisors for Greening the Financial System (NGFS) which had 89 central banks and supervisors from around the world by March 2021. The NGFS recommended integration of climate-related factors into prudential supervision and emphasised the importance of a robust and internationally consistent climate and environmental disclosure framework. A recent survey of 26 central banks reveals that central banks consider climate change to be an emerging challenge both in terms of its potential threat to the economy and impact on their operational frameworks (NGFS, 2020). The prime motivation for the central banks is to mitigate financial risks on their balance sheets due to exposures to climate change related risks. Furthermore, central banks are in favour of formulating pro-active measures in moving towards a low-carbon economy while ensuring smooth monetary transmission over the long-term (Table V.1.1). 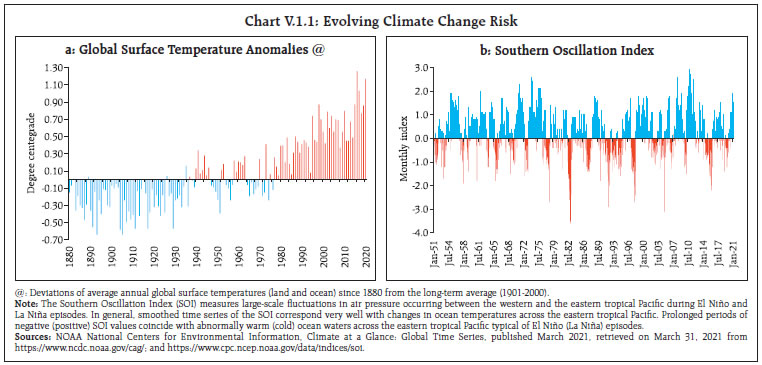
| Table V.1.1: Mitigating Climate Change Risk – Select Central Bank Initiatives | | Central Bank | Strategy | Central Bank | Strategy | | Advanced Economies | | Bank of Canada | • Pilot project to help banks and insurance companies to develop climate change risk scenarios
• A multi-year research plan focused on climate-related risks and Canada-specific climate scenarios by staff members | Hong Kong Monetary Authority (HKMA) | • Developed a common assessment framework to help banks to assess their individual “greenness baseline”
• Banks were advised to assess climate-related physical risk and transition risk associated with the projects and businesses they are funding
• Assistance to the Government in implementation of green bond issuance programme | | Bank of England (BoE) | • In March 2021, the Monetary Policy Committee's remit was modified to include support to the Government's economic strategy of transition to a net zero emissions economy
• Became member of the government-regulator task force to examine the most effective way to approach climate related financial disclosures, including exploring the appropriateness of mandatory reporting | Reserve Bank of New Zealand (RBNZ) | • Supervisory engagement on the identification and management of climate risks among New Zealand’s financial institutions
• Better management of RBNZ balance sheet to mitigate climate change risk | | European Central Bank (ECB) | • Set up a climate change centre in January 2021 to bring together the work on climate issues in different parts of the ECB
• Climate risk stress test exercise to assess the impact on the European banking sector over a 30-year horizon | Federal Reserve | • The Federal Reserve supervisors expect banks to have systems in place that appropriately identify, measure, control, and monitor all of their material risks, “which for many banks are likely to extend to climate risks.”
• Formally joined the Network for Greening the Financial System in December 2020 | | Emerging Market Economies | | Banco Central do Brasil | • Capital requirements guidelines for banks for pricing-in environmental risks through which banks evaluate lending practices, stress-test against the exposure to environmental risks and disclose their risk assessment methods and exposure to social and environmental damages | | People's Bank of China (PBoC) | • Issued green bond guidelines for building a green finance system in 2015
• Mandatory for financial institutions to disclose environment-related information to support and incentivise green investment
• Incentives included, among others, for re-lending operations by the PBoC, specialised green guarantee programs, interest subsides for green loan-supported projects, and the launch of a national-level green development fund | | Reserve Bank of India | • In 2015, included the small renewable energy sector under the Priority Sector Lending (PSL) scheme
• Sensitising public, investors and banks regarding the need, opportunities, and challenges of green finance through its regular reports and other communications | | Source: Websites of respective central banks. | To sum up, changing weather patterns and increased reliance on bioenergy could increase the volatility of food and energy prices and hence impart substantial volatility to headline inflation, making it challenging for central banks to meet their inflation targets. Nowcasting and forecasting models of central banks need to be augmented to adequately account for weather effects. References: Acevedo, S., M. Mrkaic, N. Novta, E. Pugacheva and P. Topalova (2018), “The Effects of Weather Shocks on Economic Activity: What are the Channels of Impact?”, IMF Working Paper, WP/18/144s. Batten, S., R. Sowerbutts and M. Tanaka (2020), “Climate Change: Macroeconomic Impact and Implications for Monetary Policy”, in: Ecological, Societal, and Technological Risks and the Financial Sector, July 2020. Bolton P., D. Morgan, da Silva. L. A. P., S. Frédéric and S. Romain (2020), The Green Swan: Central Banking and Financial Stability in the Age of Climate Change, Bank for International Settlements. IPCC (2018), Global Warming of 1.5oC. Available at: https://www.ipcc.ch/sr15/ NGFS (2020), “Survey on Monetary Policy Operations and Climate Change: Key Lessons for Further Analyses”, NGFS Technical Document, December. | The Bank of Japan (BoJ) in December 2020 extended the duration of the special program to support financing in response to COVID-19 by six months to September 2021 and made adjustments to the programme. Following a review of the measures taken under “quantitative and qualitative monetary easing with yield curve control”, the BoJ announced further effective and sustainable monetary easing in March 2021: (i) establishment of an “Interest Scheme to Promote Lending” under which interest rates, linked to the short-term policy rate, would apply as an incentive to financial institutions' current account balances with the BoJ, corresponding to amount lent by the institutions under eligible fund-provisioning measures; (ii) the range of 10-year government bond yield fluctuations would be +/- 25 basis points (bps) from the target level; and (iii) the annual target for purchase of exchange-traded funds and Japan real estate investment trusts has been removed, while the ceiling has been retained. The Bank of Canada (BoC) has maintained a pause on the policy rate since reducing it to 0.25 per cent in March 2020. In October, the BoC announced it would gradually reduce quantum of weekly purchase of government securities, while recalibrating its quantitative easing program towards longer-term bonds that have a more direct influence on borrowing rates. The Reserve Bank of New Zealand (RBNZ) has maintained its policy rate at the historic low of 0.25 per cent since March 2020. In November, the RBNZ announced additional stimulus in the form of a “Funding for Lending Programme” aimed at reducing banks’ funding costs. In February 2021, the RBNZ stated that it had completed the operational work to make its policy rate, the official cash rate, negative if need arose for further monetary stimulus. The New Zealand government modified the MPC’s remit with effect from March 1, 2021 to assess and outline, inter alia, the impact of its decisions on the government’s policy relating to sustainable house prices. In March, the RBNZ withdrew a few temporary liquidity facilities, which were introduced in response to the COVID-19 pandemic, as they had low usage. Amongst the major AE central banks, Australia and Iceland reduced policy rates in Q4:2020. In November, the Reserve Bank of Australia (RBA) cuts its policy rate by 15 bps to a new low of 0.10 per cent and reduced the target for 3-year government bond yields to the same level. It also launched a quantitative easing programme of purchase of government bonds of 5-10 years maturity worth AUD100 billion (approximately US$72 billion) to be carried out over six months. In February 2021, the RBA extended the asset purchase programme that was to end by mid-April 2021 by six months with purchase of additional AUD100 billion (approximately US$76 billion). In March, the RBA indicated that it had adjusted bond purchases to enable smooth functioning of the market and would do more, if required. The central bank of Iceland reduced its policy rate by 25 bps in November to 0.75 per cent (Chart V.6a). Given the conventional policy space, a few EMEs cut the policy rates further in 2021, while others started reversing monetary stimulus. The People’s Bank of China has maintained the one-year Loan Prime Rate at 3.85 per cent since April 2020, while the South African Reserve Bank has maintained its policy rate at 3.5 per cent since July 2020. After maintaining a pause through Q4:2020, in January 2021, Banco Central do Brasil (BCB) withdrew the forward guidance introduced in August 2020 when the underlying measures of inflation were below the target. In its March meeting, with inflation projected to be at the upper bound of the target, the BCB raised the Selic rate by 75 bps to 2.75 per cent and indicated that a similar magnitude hike will likely be effected in its next policy meeting. The Bank of Russia, after maintaining a pause through Q4:2020, raised the policy rate by 25 bps to 4.5 per cent in March and indicated that it was a beginning of return to neutral monetary policy. 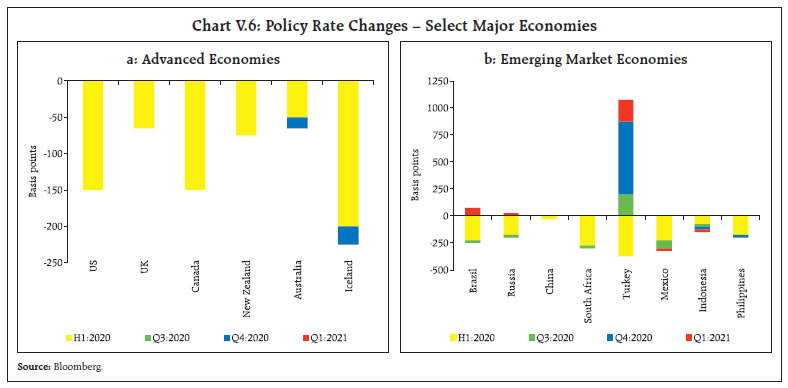 The central bank of Turkey followed up the rate hike in September 2020 with an increase of 475 bps in November and by another 200 bps each in December 2020 and March 2021 and indicated that the tight monetary policy stance would be maintained decisively for an extended period until strong indicators pointed to a permanent fall in inflation. Amongst other EME central banks, Bank Indonesia (BI) and Bangko Sentral ng Pilipinas cut their policy rates by 25 bps each in Q4: 2020 (November), while BI and Banco de México cut rates by 25 bps each in February during Q1:2021 (Chart V.6b). V.4 Global Financial Markets The global financial markets remained buoyant, supported by highly accommodative monetary and fiscal policies and vaccine-led recovery optimism. Stock markets reached record highs in a few jurisdictions in February 2021, despite output being well-below pre-pandemic path, raising concerns of a disconnect between the markets and the real economy and risks of future financial fragility (Box V.2). Among AEs, US equity markets scaled new peaks every month between November 2020 and March 2021. Apart from the earlier noted ultra-accommodative monetary policy and vaccine news, the US markets were also boosted by the Presidential election results in early November and the additional fiscal stimulus packages in December and March. In Q1:2021, there were episodes of correction, mostly due to surge in yields in the bond market. Among other major AEs also, November 2020 was one of the best months on record in terms of gains. The UK and the EU stock indices moved up, benefitting additionally from the trade agreement concluded before the expiry of the transitional period following Brexit. Towards end-January 2021, these indices corrected due to the volatility brought on by US markets and again in the second half of February. In March, the indices were up again to almost 13-month highs. The Nikkei crossed 30,000 in February 2021 for the first time since 1990. Stock markets in EMEs powered further ahead through Q4:2020 and up to mid Q1:2021, mirroring those in the US and other AEs and supported by burgeoning foreign portfolio flows (Chart V.7). With resumption of capital outflows since the latter part of February, EME stock indices have shed gains. Box V.2: Financial Markets and Real Economy Disconnect – Bubble or Retreat? Under the unprecedented and continuing monetary accommodation by most central banks, financial markets across the world have been exuberant. Equity markets touched record highs, even as COVID-19 pushed the global economy into its severest contraction in decades. This is in sharp contrast to the typical co-movement between the equity markets and the real economy, especially in severely stressed situations (Chart V.2.1). The apparent disconnect between the real economy and asset prices could be due to non-price factors (Claessens and Kose, 2017). A steep decline in risk premiums and risk-free discount rates have driven up asset prices (Igan et al., 2020). Certain segments of the equity markets, particularly small-cap, health and pharmaceuticals, and technology notched higher gains than others. Despite episodic corrections, the US S&P and the Indian BSE Sensex, inter alia, reached all-time highs in Q1:2021. Though reflation trade, creeping bond yields and inflation expectations led to a correction in the stock markets in the latter part of February, markets picked up again in March with the US stimulus, mainly in AEs. Against this backdrop, a preliminary examination has been undertaken to understand the drivers of stock markets at the global level. The variables included in the empirical exercise are: MSCI world stock index (LWorld_stk), World GDP (LWorld_GDP), gold prices (LGold) and yield on 10-year US government securities (US_10yr)4. All the variables are integrated of order one, i.e., I(1), and the Johansen-cointegration test reveals the presence of one long-run cointegrating relationship5. The estimated long-run equation from a vector error correction model (VECM) is as follows: Figures in parentheses are estimated t-values. All coefficients are statistically significant at 1 per cent level. The results suggest that higher real GDP growth boosts equity prices, while higher interest rates and gold prices are associated with corrections in equity prices. A higher level of GDP growth translates to higher corporate earnings, which in turn results in higher equity returns (Gracia and Liu, 1999). Rise in yields and gold prices presents portfolio diversification options, and are inversely related to stock prices. The short-run dynamics show that the coefficient of the error correction term of the ΔLWorld_stk is statistically significant with the correct negative sign implying that the stock prices adjust towards long-run relationship after a shock and that the estimated model is stable (Table V.1.1). In the case of a shock, gold prices are the quickest to adjust, followed by stock prices. 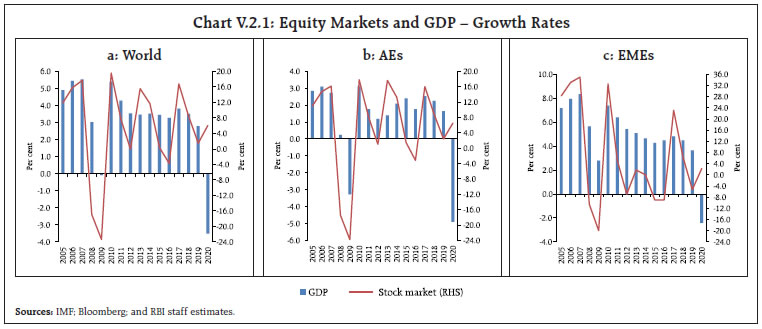
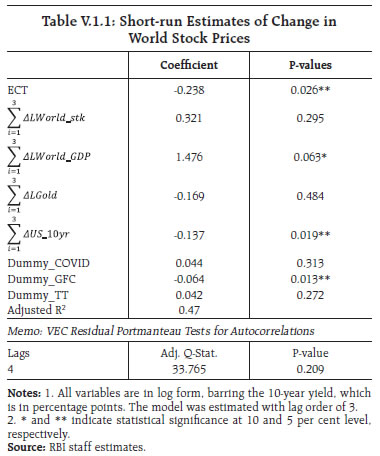 Summing up, unprecedented large scale monetary and fiscal accommodation by most countries and vaccine optimism have contributed to a sharp rebound in stock markets across the world. The empirical evidence still supports the conventional wisdom that a long-run relationship holds between the financial markets and the real sector. References: Claessens, S. and M. A. Kose, (2017), “Asset Prices and Macroeconomic Outcomes: A Survey”, World Bank Group Policy Research Working Paper 8259. Garcia, V.F. and L. Liu (1999), “Macroeconomic Determinants of Stock Market Development”, Journal of Applied Economics, 2, pp.29–59. Igan, D., D. Kirti and M. S. Peria (2020), “The Disconnect between Financial Markets and the Real Economy”, IMF Special Notes Series on COVID-19, August 26. | Bond yields remained low in major AEs till end-2020 driven by low or negative policy rates, forward guidance of low for longer, explicit yield curve control policies in a few countries and safe haven demand due to continued uncertainty with new rounds of infections, fatalities and virus mutations. In the US, however, bond yields have been inching up gradually from Q3:2020 on expectations of reflation (Chart V.8a). In January 2021, the 10-year yield rose above 1 per cent for the first time since March 2020 on expectations of further stimulus by the new US administration, better economic recovery prospects and rising inflation expectations. In February, the large sell-offs saw longer term yields, especially of the 10-year and 30-year bonds shoot up, leading to steepening of the yield curve. The 10-year yield at end-March 2021 was 106 bps higher than its level at end-September 2020. There has also been a steepening of the yield curve in several other countries, both AEs and EMEs, particularly since the second half of February. Low policy rates have kept the short-term yields low, while longer maturities have been rising. This necessitated further bond purchases by countries like Australia which practice yield curve control. The rise in yields led to portfolio reallocation resulting in correction in equity markets noted above. In currency markets, the US dollar weakened further in Q4:2020. In 2021, it has strengthened mainly due to rising bond yields and expectations of higher inflation and higher interest rates. As regards emerging market currencies, there has been resumption of capital outflows in Q1:2021 from most regions, causing the emerging markets currencies to depreciate (Chart V.8b). The MSCI Emerging Market Currency Index, which increased by 5.3 per cent in Q4:2020, dipped by 1.1 per cent in Q1:2021.
V.5 Conclusion In 2021, real GDP is expected to register a strong rebound following the record contraction in the previous year. The actual outcome will depend on how the race against the virus and its mutations is won. Inflation concerns are creeping up at a time when both monetary and fiscal policies are highly accommodative, there are promises of continued low rates for long and demand is recovering. If rising inflation and consequent movements in the bond markets lead to large valuation shifts in equity and other financial markets, it could lead to extreme volatility in global financial markets which could then spill over to emerging economies and impede the nascent global recovery. Monetary authorities in major advanced economies need to remain vigilant to these developments and be sensitive to the spillovers of their policies to the rest of the world.
ABBREVIATIONS | AEs | Advanced Economies | | AEs | Advance Estimates | | AL | Agricultural Labourers | | APMC | Agricultural Produce Market Committee | | ARCH | Autoregressive Conditional Heteroskedasticity | | AUD | Australian Dollar | | BCB | Banco Central do Brasil | | BCD | Basic Customs Duty | | BE | Budget Estimates | | BEI | Business Expectations Index | | BG | Breusch-Godfrey | | BI | Bank Indonesia | | BIS | Bank for International Settlements | | BoC | Bank of Canada | | BoE | Bank of England | | BoJ | Bank of Japan | | BoR | Bank of Russia | | bps | Basis Points | | BRICS | Brazil, Russia, India, China and South Africa | | CACP | Commission for Agricultural Costs and Prices | | CBs | Corporate Bonds | | CCIL | Clearing Corporation of India Limited | | CD | Certificate of Deposit | | CDS | Credit Default Swap | | CGA | Controller General of Accounts, Ministry of Finance | | CI | Confidence Interval | | CiC | Currency in Circulation | | CII | Confederation of Indian Industry | | CLI | Composite Leading Indicator | | COVID-19 | Coronavirus Disease 2019 | | CP | Commercial Paper | | CPC | Central Pay Commission | | CPI | Consumer Price Index | | CPI-AL | Consumer Price Index for Agricultural Labourers | | CPI-IW | Consumer Price Index for Industrial Workers | | CPI-RL | Consumer Price Index for Rural Labourers | | CRR | Cash Reserve Ratio | | CU | Capacity Utilisation | | DCA | Department of Consumer Affairs | | DFM | Dynamic Factor Model | | DGCA | Directorate General of Civil Aviation | | DGCI&S | Directorate General of Commercial Intelligence and Statistics | | EC | Error Correction | | ECB | European Central Bank | | ECLGS | Emergency Credit Line Guarantee Scheme | | EMEs | Emerging Market Economies | | eNAM | National Agriculture Market | | ENSO | El Niño - Southern Oscillation | | ES | Event Study | | ETFs | Exchange -Traded Funds | | EU | European Union | | EXIM | Export-Import Bank of India | | FAE | First Advance Estimates | | FAO | Food and Agriculture Organization | | FBIL | Financial Benchmarks India Pvt Ltd | | FCI | Financial Condition Index | | FD | Fiscal Deficit | | FDI | Foreign Direct Investment | | Fed | Federal Reserve | | FICCI | Federation of Indian Chambers of Commerce and Industry | | FIMMDA | Fixed Income Money Market and Derivatives Association of India | | FIs | Financial Institutions | | FIT | Flexible Inflation Targeting | | FOMC | Federal Open Market Committee | | FPAS | Forecast and Policy Analysis System | | FPI | Foreign Portfolio Investment | | FRE | First Revised Estimates | | F-TRAC | Financial Market Trade Reporting and Confirmation System | | GDP | Gross Domestic Product | | GEPUI | Global Economic Policy Uncertainty Index | | GFCE | Government Final Consumption Expenditure | | GFCF | Gross Fixed Capital Formation | | GFD | Gross Fiscal Deficit | | GNDI | Gross National Disposable Income | | GoI | Government of India | | GSDP | Gross State Domestic Product | | G-Sec | Government Securities | | GST | Goods and Services Tax | | GVA | Gross Value Added | | H1 | First Half of the Financial Year (April-September) | | H2 | Second Half of the Financial Year (October-March) | | HKMA | Hong Kong Monetary Authority | | HRA | House Rent Allowance | | HTM | Held to Maturity | | IIP | Index of Industrial Production | | IMF | International Monetary Fund | | INR | Indian Rupee | | IOCL | Indian Oil Corporation Limited | | IOS | Industrial Outlook Survey | | IPCC | Intergovernmental Panel on Climate Change | | IRFCL | International Reserves and Foreign Currency Liquidity | | ISM | Institute for Supply Management | | LAF | Liquidity Adjustment Facility | | LM | Lagrange Multiplier | | LPG | Liquified Petroleum Gas | | LTROs | Long Term Repo Operations | | MCLR | Marginal Cost of Funds Based Lending Rate | | MEP | Minimum Export Price | | MFs | Mutual Funds | | MGNREGA | Mahatma Gandhi National Rural Employment Guarantee Act | | MMRP | Modified Mixed Reference Period | | MOAFW | Ministry of Agriculture and Farmers’ Welfare | | m-o-m | Month-on-Month | | MOSPI | Ministry of Statistics and Programme Implementation | | MPC | Monetary Policy Committee | | MPR | Monetary Policy Report | | MSCI | Morgan Stanley Capital International | | MSF | Marginal Standing Facility | | MSMEs | Micro, Small and Medium Enterprises | | MSP | Minimum Support Price | | NABARD | National Bank for Agriculture and Rural Development | | NBER | National Bureau of Economic Research | | NBFCs | Non-Banking Financial Companies | | NCAER | National Council of Applied Economic Research | | NDS | Negotiated Dealing System | | NDTL | Net Demand and Time Liabilities | | NEER | Nominal Effective Exchange Rate | | NGFS | Network of Central Banks and Supervisors for Greening the Financial System | | NGNF | Non-Government Non-Financial | | NHB | National Housing Bank | | NIMs | Net Interest Margins | | NOAA | National Oceanic and Atmospheric Administration | | NPA | Non-Performing Asset | | NSC | National Savings Certificate | | NSDL | National Securities Depository Limited | | NSO | National Statistical Office | | NSSF | National Small Saving Fund | | NSSO | National Sample Survey Office | | OECD | Organisation for Economic Cooperation and Development | | OIS | Overnight Index Swaps | | OMCs | Oil Marketing Companies | | OMOs | Open Market Operations | | OPEC | Organization of the Petroleum Exporting Countries | | OT | Operation Twist | | OTC | Over-the-Counter | | PADO | Public Administration, Defence and Other services | | PBoC | People’s Bank of China | | PCE | Personal Consumption Expenditure | | PDS | Public Distribution System | | PDs | Primary Dealers | | PEPP | Pandemic Emergency Purchase Programme | | PFCE | Private Final Consumption Expenditure | | PLI | Production Linked Incentive | | PMI | Purchasing Managers’ Index | | POL | Petroleum, Oil and Lubricants | | PSBs | Public Sector Banks | | PSL | Priority Sector Lending | | PSU | Public Sector Undertaking | | Q1 | First Quarter | | Q2 | Second Quarter | | Q3 | Third Quarter | | Q4 | Fourth Quarter | | q-o-q | Quarter-on-Quarter | | QPM | Quarterly Projection Model | | RBA | Reserve Bank of Australia | | RBI | Reserve Bank of India | | RBNZ | Reserve Bank of New Zealand | | RD | Revenue Deficit | | RE | Revised Estimates | | REER | Real Effective Exchange Rate | | RHS | Right Hand Side | | RL | Rural Labourers | | RM | Reserve Money | | SAAR | Seasonally Adjusted Annualised Rate | | SAE | Second Advance Estimates | | SARB | South African Reserve Bank | | SCBs | Scheduled Commercial Banks | | SDLs | State Development Loans | | SEBI | Securities and Exchange Board of India | | SIAM | Society of Indian Automobile Manufacturers | | SIDBI | Small Industries Development Bank of India | | SLF | Special Liquidity Facility | | SLR | Statutory Liquidity Ratio | | SOI | Southern Oscillation Index | | T-Bill | Treasury Bill | | TLTRO | Targeted Long-Term Repo Operation | | UK | United Kingdom | | US | United States | | US$ | US Dollar | | VAR | Vector Autoregression | | VAT | Value Added Tax | | VECM | Vector Error Correction Model | | VRRR | Variable Rate Reverse Repo | | WAC | Weighted Average Coupon | | WACR | Weighted Average Call Money Rate | | WADR | Weighted Average Discount Rate | | WADTDR | Weighted Average Domestic Term Deposit Rate | | WALR | Weighted Average Lending Rate | | WAR | Weighted Average Rate | | WCFI&ES | Working - Class Family Income & Expenditure Survey | | WEO | World Economic Outlook | | WMA | Ways and Means Advances | | WPI | Wholesale Price Index | | WTI | West Texas Intermediate | | WTO | World Trade Organization | | y-o-y | Year-on-Year | | YTD | Year to Date | |