During 2020-21, scheduled commercial banks (SCBs) reported a discernible improvement in their asset quality, capital buffers and profitability, notwithstanding the disruptions of the pandemic. While credit offtake remained subdued, elevated deposit growth on the liabilities side was matched by growth in investments on the assets side. Nonetheless, incipient stress remains in the form of higher restructured advances. Banks would need to bolster their capital positions to absorb potential stress as well as to augment credit flow when policy support is phased out. 1. Introduction IV.1 During 2020-21, the banking sector navigated the disruptions caused by the pandemic and the economic downturn with resilience, cushioned by various policy measures undertaken by the Reserve Bank and the Government. Asset quality improved, partly attributable to imposition of the asset classification standstill. Public sector banks (PSBs) reported net profits after a gap of five years. More generally, the capital position of banks improved, aided by recapitalisation by the government as well as raising of funds from the market. Nonetheless, incipient stress remains in the form of increased proportion of restructured advances and the possibility of higher slippages arising from sectors that were relatively more exposed to the pandemic. Nevertheless, with the green shoots of recovery re-emerging in H1:2021-22, banks are expected to further shore up their financials. IV.2 Against this background, this chapter discusses the operations and performance of the banking sector during 2020-21 and H1:2021-22. Balance sheet developments are analysed in Section 2, followed by an assessment of their financial performance and financial soundness in Sections 3 and 4, respectively. Sections 5 to 12 address specific themes relating to sectoral deployment of credit, performance of banking stocks, ownership patterns, corporate governance and compensation practices, foreign banks’ operations in India and overseas operations of Indian banks, developments in payments systems, consumer protection and financial inclusion. Developments related to regional rural banks (RRBs), local area banks (LABs), small finance banks (SFBs) and payments banks (PBs) are analysed separately in Sections 13 to 16. The chapter concludes by bringing together major issues that emerge from the analysis and offers some perspectives on the way forward. 2. Balance Sheet Analysis IV.3 The consolidated balance sheet of scheduled commercial banks (SCBs) accelerated during 2020-21, notwithstanding the pandemic and the contraction in economic activity in the first half of the year. Deposit growth on the liabilities side was matched by investments on the assets side; however, credit offtake remained subdued (Table IV.1 and Chart IV.1). Supervisory data suggest that while nascent signs of recovery are visible in credit growth, deposit growth has slowed down in 2021-22 so far. IV.4 The share of PSBs in total advances as well as in deposits has been declining since 2010-11, while private sector banks (PVBs) have been improving their share. Table IV.1: Consolidated Balance Sheet of Scheduled Commercial Banks
(At end-March) | | (Amount in ₹ crore) | | Item | Public Sector Banks | Private Sector Banks | Foreign Banks | Small Finance Banks | Payments Banks | All SCBs | | 2020 | 2021 | 2020 | 2021 | 2020 | 2021 | 2020 | 2021 | 2020 | 2021 | 2020 | 2021 | | 1. Capital | 72,040 | 59,328 | 26,866 | 30,641 | 85,710 | 91,465 | 5,151 | 5,375 | 1,035 | 1,300 | 1,90,802 | 1,88,109 | | 2. Reserves and Surplus | 5,80,886 | 6,49,142 | 5,81,749 | 7,07,345 | 1,08,987 | 1,24,706 | 11,047 | 14,800 | -461 | -704 | 12,82,208 | 14,95,289 | | 3. Deposits | 90,48,420 | 99,00,766 | 41,59,044 | 48,00,646 | 6,84,239 | 7,77,173 | 82,488 | 1,09,472 | 855 | 2,543 | 1,39,75,045 | 1,55,90,600 | | 3.1. Demand Deposits | 5,71,383 | 6,84,451 | 5,47,521 | 6,82,095 | 2,17,825 | 2,37,412 | 2,381 | 3,964 | 8 | 19 | 13,39,118 | 16,07,941 | | 3.2. Savings Bank Deposits | 30,41,902 | 34,62,923 | 11,72,739 | 14,56,019 | 70,007 | 87,032 | 10,284 | 22,198 | 847 | 2,524 | 42,95,779 | 50,30,696 | | 3.3. Term Deposits | 54,35,134 | 57,53,392 | 24,38,784 | 26,62,532 | 3,96,408 | 4,52,729 | 69,823 | 83,310 | - | - | 83,40,149 | 89,51,963 | | 4. Borrowings | 7,09,780 | 7,18,850 | 8,27,575 | 6,25,683 | 1,28,761 | 1,02,331 | 30,004 | 27,828 | - | 198 | 16,96,120 | 14,74,890 | | 5. Other Liabilities and Provisions | 3,71,706 | 4,03,292 | 2,36,890 | 2,66,732 | 2,57,381 | 1,68,893 | 4,057 | 6,076 | 216 | 737 | 8,70,250 | 8,45,729 | | Total Liabilities/Assets | 1,07,82,831 | 1,17,31,378 | 58,32,123 | 64,31,048 | 12,65,079 | 12,64,567 | 1,32,747 | 1,63,552 | 1,645 | 4,072 | 1,80,14,425 | 1,95,94,617 | | | (59.9) | (59.9) | (32.4) | (32.8) | (7.0) | (6.5) | (0.7) | (0.8) | (0.0) | (0.0) | (100.0) | (100.0) | | 1. Cash and balances with RBI | 4,36,774 | 5,39,149 | 2,72,616 | 2,92,019 | 51,238 | 59,163 | 5,058 | 6,921 | 33 | 174 | 7,65,720 | 8,97,426 | | 2. Balances with banks and money at call and short-notice | 4,66,615 | 5,93,721 | 2,12,324 | 2,73,711 | 99,468 | 1,51,549 | 8,701 | 12,309 | 455 | 812 | 7,87,563 | 10,32,102 | | 3. Investments | 29,40,636 | 34,00,895 | 12,93,031 | 15,12,480 | 4,31,277 | 4,73,418 | 24,203 | 30,660 | 694 | 2,413 | 46,89,842 | 54,19,866 | | 3.1 In Government Securities (a+b) | 24,09,182 | 27,89,985 | 10,66,313 | 12,57,222 | 3,84,102 | 4,30,779 | 20,748 | 27,142 | 694 | 2,412 | 38,81,039 | 45,07,541 | | a) In India | 23,71,783 | 27,52,716 | 10,57,074 | 12,36,747 | 3,62,540 | 3,90,195 | 20,748 | 27,142 | 694 | 2,412 | 38,12,839 | 44,09,212 | | b) Outside India | 37,399 | 37,270 | 9,240 | 20,476 | 21,562 | 40,584 | - | - | - | - | 68,201 | 98,329 | | 3.2 In Other Approved Securities | 102 | 12 | - | - | - | - | - | - | - | - | 102 | 12 | | 3.3 In Non-Approved Securities | 5,31,352 | 6,10,898 | 2,26,718 | 2,55,258 | 47,175 | 42,639 | 3,455 | 3,518 | - | 1 | 8,08,700 | 9,12,313 | | 4. Loans and Advances | 61,58,112 | 63,48,758 | 36,25,154 | 39,39,292 | 4,28,076 | 4,23,546 | 90,554 | 1,08,613 | - | 0.1 | 1,03,01,897 | 1,08,20,208 | | 4.1 Bills purchased and discounted | 1,60,977 | 1,45,894 | 1,25,111 | 1,19,295 | 59,273 | 60,380 | 37 | 124 | - | - | 3,45,398 | 3,25,694 | | 4.2 Cash Credits, Overdrafts, etc. | 24,16,408 | 24,91,776 | 9,70,317 | 10,11,497 | 2,07,717 | 1,75,337 | 6,872 | 8,861 | - | - | 36,01,314 | 36,87,471 | | 4.3 Term Loans | 35,80,727 | 37,11,087 | 25,29,726 | 28,08,501 | 1,61,085 | 1,87,828 | 83,646 | 99,628 | - | 0.1 | 63,55,184 | 68,07,043 | | 5. Fixed Assets | 1,06,507 | 1,06,826 | 38,268 | 39,713 | 4,129 | 4,457 | 1,671 | 1,676 | 200 | 222 | 1,50,775 | 1,52,894 | | 6. Other Assets | 6,74,187 | 7,42,030 | 3,90,729 | 3,73,832 | 2,50,891 | 1,52,434 | 2,559 | 3,373 | 263 | 452 | 13,18,629 | 12,72,121 | Notes: 1. -: Nil/negligible.
2. Components may not add up to their respective totals due to rounding-off numbers to ₹ crore.
3. Detailed bank-wise data on annual accounts are collated and published in Statistical Tables Relating to Banks in India, available at https://www.dbie.rbi.org.in.
4. Figures in parentheses are shares in total assets/ liabilities of different bank groups in all SCBs.
Source: Annual accounts of respective banks. | 2.1 Liabilities IV.5 During 2020-21, deposit mobilisation by SCBs was the highest in seven years, mainly contributed by the low-cost current account and savings account (CASA) deposits (Chart IV.4). In H1:2021-22, there was a moderation in deposit growth with normalisation of economic activity and rising inflation. IV.6 For the last three years, private non-financial corporations have been net savers, progressively increasing their deposits with SCBs while their credit offtake has remained anaemic. Moreover, the household sector’s deposits—64 per cent of the total as at end-March 2021—also picked up pace (Chart IV.2). IV.7 With term deposit rates falling across the board, their growth moderated during 2020-21 (Chart IV.3a). Correspondingly, their distribution across interest rates shifted leftwards, with 5-6 per cent interest rate emerging as the modal class (Chart IV.3b). IV.8 Historically, PVBs have relied heavily on borrowings to supplement their deposits and fuel credit growth. On the other hand, PSBs leveraged their wide deposit base and availability of low-cost CASA deposits to fund their lending. In 2020-21, borrowings of PVBs contracted for the first time since 2016-17, while those of PSBs accelerated after contracting for two consecutive years. Despite robust CASA deposit growth, PSBs raised higher resources through borrowings than the previous year as their credit growth accelerated over the first three quarters of the year (Chart IV.5).
2.2 Assets IV.9 SCBs’ credit growth has decelerated over previous two years, largely reflecting muted demand conditions and risk aversion (Box IV.1). Signs of recovery became visible in H1:2021-22. Box IV.1: Slowdown in Credit Growth: Supply or Demand Driven? Persistent anemic credit growth in recent years has led to a vigorous debate amongst policymakers and analysts on the underlying causes. In the presence of asymmetric information, stickiness of loan interest rates leads to delays in price adjustments. In the interim, there can be disequilibrium whenever supply does not equal demand at the prevailing interest rate (Stiglitz and Weiss, 1981). The observed credit Ct is assumed to be the minimum of the estimated demand for credit (Ctd) and estimated supply for credit (Cts): The disequilibrium model is estimated by using the maximum likelihood method (MLE). The model facilitates determination of probabilities with which each observation belongs to either the demand or supply equation (Maddala and Nelson, 1974). Using monthly data for the period April 2001-March 2020, the disequilibrium model is estimated for India. The benchmark prime lending rate (BPLR) of State Bank of India is taken as a proxy for the market clearing interest rate, while the logarithm of credit is taken as dependent variable. The results suggest that the slowdown in credit is reflecting a scissors effect. Industrial activity (IIP) and investment (GFCF) constrained credit demand, while stressed balance sheets of banks2 limited credit supply (Table 1). Hence, policies aimed at boosting aggregate demand need to be supplemented with strengthening bank balance sheets to reduce stress for a sustainable boost to credit growth. | Table 1: Estimation Results | | Explanatory variables/Dependent variables | Log Credit
(Model 1) | Log Credit
(Model 2) | Explanatory variables/Dependent variables | Log Credit
(Model 1) | Log Credit
(Model 2) | | Credit Demand | Credit Supply | | Constant | 0.1339*** (0.0114) | 5.6117*** (0.036) | Constant | 0.0008 (0.0083) | -2.5247*** (0.0063) | | BPLR_lag 1 | 0.6222*** (0.0114) | 2.8388*** (0.037) | Time trend | -0.00004 (0.00002) | -0.0013*** (0.00005) | | Time trend | 0.0021 (0.0022) | -0.0004 (0.001) | SAR_lag1 | -0.0006 (0.0009) | -0.0062** (0.0029) | | GFCF_lag 1 | | 0.0253** (0.0129) | CRAR_lag2 | 0.0006 (0.0011) | | | IIP_lag 1 | 0.1488*** (0.0014) | | Log_deposit_lag 2 | | 1.4017*** (0.0124) | | IIP_lag 2 | | 0.0151 (0.019) | Cost of Fund_lag 1 | 0.0009 (0.0009) | | | Sensex growth | 0.0287 (0.0177) | | BPLR_lag 2 | 0.0008 (0.0009) | -0.1051 (0.0807) | | CPI Inflation_lag 1 | 0.9217*** (0.0003) | | AQR Dummy | 0.0020 (0.0023) | -0.0249*** (0.0077) | | BPLR_lag 2 | -0.5351*** (0.0114) | -1.4109*** (0.0373) | St. Dev. of demand equation error | 1.1380*** (0.0005) | 0.6042*** (0.0405) | | AQR dummy | | 0.6648*** (0.0065) | St. Dev. of supply equation error | 0.0073*** (0.00001) | 0.0256*** (0.0001) | | GFC Dummy | -0.2900*** (0.0002) | | Log-likelihood | 1114.16 | -658.63 | Note: 1. AQR: Asset Quality Review; GFC: Global Financial Crisis; IIP: Index of Industrial production; GFCF: Gross Fixed Capital Formation.
2. lag 1: lagged by one period; lag 2: lagged by two periods.
3. ***, **, and * indicate 1 per cent, 5 per cent and 10 per cent levels of significance, respectively.
4. Figures in parenthesis are standard errors. | References: Maddalla, G. S., and F. Nelson. 1974. Maximum Likelihood Methods for Models of Markets in Disequilibrium. Econometrica 42(6): 1013–1030. Stiglitz, Joseph E.; Weiss, Andrew (1981). Credit Rationing in Markets with Imperfect Information”. The American Economic Review. 71 (3): 393–410. Verma, R (2021). Slowdown in Credit Flow in India: Supply or Demand Driven, mimeo. | IV.10 Credit growth of PVBs decelerated from Q4: 2019-20 till Q3:2020-21 as the pandemic took its toll. Since Q4:2020-21, however, PVBs’ credit showed signs of revival (Chart IV.6). IV.11 Within population groups, the relatively higher credit growth to rural and semi-urban areas after the outbreak of COVID-19 is a bright spot (Chart IV.7). While PSBs remained the major contributor of rural lending, given their reach and accessibility, the share of PVBs has also climbed up.
IV.12 The credit-to-GDP ratio increased to a five-year high, narrowing the credit-GDP gap (Chart IV.8a). India’s credit-to-GDP ratio is still markedly lower than the G20 average (Chart IV.8b). IV.13 As the share of advances in total assets fell, that of investments increased in an environment of risk aversion and limited profitable lending avenues. This resulted in a decline in the credit-deposit (C-D) ratio and a corresponding elevation in the investment-deposit (I-D) ratio, especially in incremental terms (Chart IV.9). IV.14 Central Government and State Government securities were preferred by both PSBs and PVBs during 2020-21, indicating their preference for safer investments. Consequently, the share of other debt securities in PSBs’ total portfolio declined after increasing for three consecutive years (Chart IV.10). 2.3 Maturity Profile of Assets and Liabilities IV.15 Mismatches in the maturity of assets and liabilities are intrinsic to banking business, but they have implications for liquidity, profitability and risk exposures. During 2020-21, while the negative gap in the maturity bucket of up to one year moderated, the positive gap in the maturity bucket of more than five years turned negative as banks attracted less short-term CASA deposits and more longer-term deposits (Chart IV.11).
IV.16 In the case of borrowings, PSBs and PVBs displayed widely contrasting patterns. The share of short-term and long-term borrowings increased year-on-year in the case of PSBs, while PVBs relied more on borrowings with maturity between one and five years (Table IV.2). 2.4 International Liabilities and Assets IV.17 The total international liabilities of banks located in India expanded in 2020-21 on the back of rupee denominated deposits and equities held by non-resident Indians (NRIs) (Appendix Table IV.9). The sizeable increase in international assets, on the other hand, was led by their loans and debt securities (Appendix Table IV.10). However, international assets of banks in India (including foreign banks) were only 42 per cent compared to their international liabilities (Chart IV.12a). IV.18 During the period under review, the share of claims of Indian banks (including their domestic and foreign branches) shifted away from non-financial private institutions and favoured other banks (Appendix Table IV.11 and Chart IV.12b). The country-composition of international claims remained stable, with the share of the top five out of six countries against which Indian banks held the highest share of claims increasing further (Appendix Table IV.12). Table IV.2: Bank Group-wise Maturity Profile of Select Liabilities /Assets
(At end-March) | | (Per cent) | | Assets/Liabilities | PSBs | PVBs | FBs | SFBs | PBs | All SCBs | | 2020 | 2021 | 2020 | 2021 | 2020 | 2021 | 2020 | 2021 | 2020 | 2021 | 2020 | 2021 | | 1 | 2 | 3 | 4 | 5 | 6 | 7 | 8 | 9 | 10 | 11 | 12 | 13 | | I. Deposits | | | | | | | | | | | | | | a) Up to 1 year | 40.4 | 36.2 | 38.1 | 34.3 | 63.9 | 62.4 | 59.6 | 53.6 | 10.0 | 13.0 | 40.9 | 37.0 | | b) Over 1 year and up to 3 years | 22.8 | 21.9 | 28.1 | 28.9 | 28.3 | 30.8 | 37.5 | 42.1 | 90.0 | 87.0 | 24.8 | 24.7 | | c) Over 3 years and up to 5 years | 10.2 | 11.3 | 8.5 | 9.2 | 7.7 | 6.7 | 0.7 | 1.7 | - | - | 9.5 | 10.3 | | d) Over 5 years | 26.6 | 30.6 | 25.3 | 27.7 | 0.0 | 0.0 | 2.2 | 2.6 | - | - | 24.7 | 28.0 | | II. Borrowings | | | | | | | | | | | | | | a) Up to 1 year | 49.2 | 54.5 | 51.7 | 41.4 | 83.4 | 83.8 | 41.1 | 46.9 | - | 100.0 | 52.9 | 50.8 | | b) Over 1 year and up to 3 years | 27.5 | 21.0 | 24.2 | 34.0 | 10.3 | 11.8 | 44.0 | 37.3 | - | - | 24.9 | 26.2 | | c) Over 3 years and up to 5 years | 13.0 | 12.8 | 11.3 | 13.9 | 2.2 | 2.0 | 11.3 | 13.8 | - | - | 11.3 | 12.5 | | d) Over 5 years | 10.2 | 11.7 | 12.8 | 10.6 | 4.2 | 2.4 | 3.6 | 2.1 | - | - | 10.9 | 10.4 | | III. Loans and Advances | | | | | | | | | | | | | | a) Up to 1 year | 25.1 | 24.8 | 32.3 | 32.2 | 61.4 | 55.4 | 38.1 | 41.8 | - | 100.0 | 29.3 | 28.9 | | b) Over 1 year and up to 3 years | 40.9 | 36.9 | 33.6 | 34.1 | 19.3 | 22.7 | 42.4 | 34.0 | - | - | 37.4 | 35.3 | | c) Over 3 years and up to 5 years | 10.9 | 14.9 | 12.7 | 12.8 | 7.1 | 9.1 | 9.0 | 11.0 | - | - | 11.4 | 13.8 | | d) Over 5 years | 23.1 | 23.5 | 21.4 | 20.9 | 12.1 | 12.8 | 10.4 | 13.2 | - | - | 21.9 | 22.0 | | IV. Investments | | | | | | | | | | | | | | a) Up to 1 year | 23.7 | 23.7 | 54.2 | 50.6 | 83.4 | 85.1 | 59.0 | 58.1 | 100.0 | 97.4 | 37.8 | 36.8 | | b) Over 1 year and up to 3 years | 13.1 | 16.6 | 15.1 | 20.7 | 11.0 | 10.3 | 26.3 | 25.4 | - | 1.9 | 13.5 | 17.3 | | c) Over 3 years and up to 5 years | 10.6 | 13.2 | 6.8 | 6.5 | 2.0 | 2.2 | 3.1 | 2.9 | - | 0.4 | 8.7 | 10.3 | | d) Over 5 years | 52.7 | 46.4 | 23.8 | 22.2 | 3.6 | 2.4 | 11.6 | 13.6 | - | 0.2 | 40.0 | 35.6 | Notes: 1. - : Nil/Negligible.
2. The sum of components may not add up to 100 due to rounding off.
Source: Annual accounts of banks. | 2.5 Off-Balance Sheet Operations IV.19 The size of contingent liabilities of all SCBs relative to their total on-balance sheet exposures declined in 2020-21, after increasing in the previous year. For PSBs, however, the share increased as their forward exchange contracts that include all admissible derivative products increased by more than 40 per cent. For FBs, while off-balance sheet exposures decreased, they remained more than nine times their total liabilities (Chart IV.13). The overall deceleration in banks’ contingent liabilities was on account of muted growth in their forward exchange contracts in line with subdued foreign exchange transactions (Appendix Table IV.2).
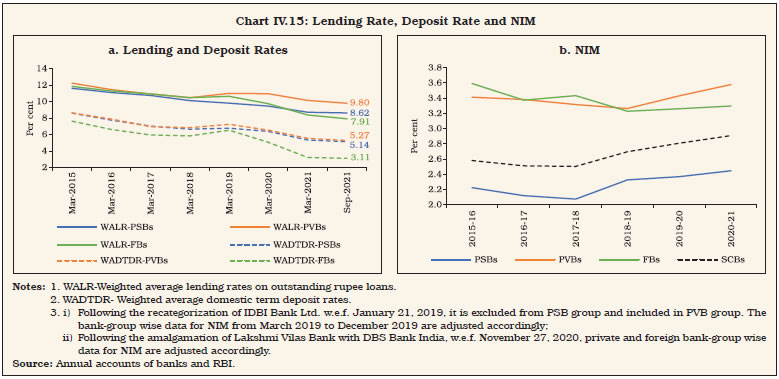
3. Financial Performance IV.20 The financial performance of SCBs in 2020-21 was marked by a discernible increase in profitability as their income remained stable but expenditure declined. This was in sharp contrast with the past five years during which PSBs incurred losses and profitability of PVBs was declining (Chart IV.14). IV.21 The total income of banks remained stable, despite a marginal decline in its largest component viz. interest income, in an environment characterised by low credit offtake and interest rates (Table IV.3). The fall was cushioned by a sizeable increase in income from investments. Income from trading also accelerated, as banks booked profits on falling G-Sec yields. IV.22 The contraction in SCBs’ expenditure was led by a decline in the interest expended on deposits and borrowings on account of moderation in interest rates and contraction in total borrowings. Across bank groups, the transmission of policy rate changes to term deposit rates was highest for FBs (Chart IV.15 a). At the system level, interest earned by banks outpaced their interest expenses, and hence the net interest margin (NIM) improved (Chart IV.15 b). 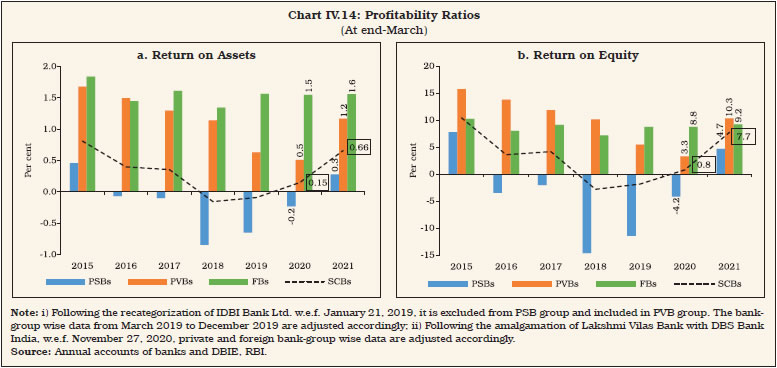
| Table IV.3: Trends in Income and Expenditure of Scheduled Commercial Banks | | (Amount in ₹ crore) | | Item | Public Sector Banks | Private Sector Banks | Foreign Banks | Small Finance Banks | Payments Banks | All SCBs | | 2019-20 | 2020-21 | 2019-20 | 2020-21 | 2019-20 | 2020-21 | 2019-20 | 2020-21 | 2019-20 | 2020-21 | 2019-20 | 2020-21 | | 1. Income | 8,34,320 | 8,31,882 | 5,46,347 | 5,45,833 | 83,223 | 82,081 | 19,219 | 22,500 | 55 | 1,004 | 14,83,164 | 14,83,301 | | | (7.6) | (-0.3) | (17.0) | (0.4) | (19.1) | (-4.3) | (76.4) | (17.1) | - | (1733.7) | (12.1) | (0.01) | | a) Interest Income | 7,16,203 | 7,07,092 | 4,49,006 | 4,51,617 | 66,673 | 63,888 | 16,948 | 19,523 | 46 | 101 | 12,48,876 | 12,42,222 | | | (5.1) | (-1.3) | (14.1) | (1.1) | (20.0) | (-7.2) | (75.0) | (15.2) | - | (120.1) | (9.5) | (-0.5) | | b) Other Income | 1,18,117 | 1,24,790 | 97,341 | 94,216 | 16,550 | 18,193 | 2,271 | 2,976 | 9 | 903 | 2,34,288 | 2,41,079 | | | (26.0) | (5.6) | (32.6) | (-2.9) | (15.5) | (7.6) | (86.7) | (31.1) | - | (9932.3) | (28.2) | (2.9) | | 2. Expenditure | 8,60,335 | 8,00,064 | 5,27,236 | 4,76,357 | 67,043 | 63,116 | 17,251 | 20,462 | 389 | 1,304 | 14,72,253 | 13,61,303 | | | (2.2) | (-7.0) | (20.0) | (-9.1) | (21.0) | (-10.4) | (75.7) | (18.6) | - | (235.5) | (9.3) | (-7.5) | | a) Interest Expended | 4,68,005 | 4,31,627 | 2,58,038 | 2,32,555 | 28,810 | 21,769 | 7,928 | 9,122 | 14 | 55 | 7,62,794 | 6,95,128 | | | (3.9) | (-7.8) | (11.6) | (-9.3) | (17.7) | (-28.8) | (74.8) | (15.1) | - | (307.7) | (7.3) | (-8.9) | | b) Operating Expenses | 1,92,720 | 2,02,879 | 1,26,663 | 1,30,456 | 21,584 | 22,318 | 7,152 | 7,549 | 488 | 1,251 | 3,48,607 | 3,64,453 | | | (10.1) | (5.3) | (15.9) | (3.6) | (15.4) | (-0.3) | (70.3) | (5.6) | - | (156.6) | (13.4) | (4.5) | | Of which : Wage Bill | 1,15,839 | 1,23,378 | 47,357 | 50,274 | 7,878 | 7,888 | 3,811 | 4,302 | 264 | 398 | 1,75,149 | 1,86,239 | | | (14.1) | (6.5) | (20.8) | (6.9) | (17.2) | (-4.0) | (79.2) | (12.9) | - | (50.6) | (17.1) | (6.3) | | c) Provision and Contingencies | 1,99,609 | 1,65,558 | 1,42,535 | 1,13,346 | 16,648 | 19,029 | 2,171 | 3,791 | -112 | -2 | 3,60,852 | 3,01,722 | | | (-7.7) | (-17.1) | (44.1) | (-20.0) | (36.2) | (8.9) | (100.8) | (74.6) | - | | (9.9) | (-16.4) | | 3. Operating Profit | 1,73,594 | 1,97,376 | 1,61,646 | 1,82,823 | 32,829 | 37,994 | 4,139 | 5,829 | -446 | -302 | 3,71,763 | 4,23,720 | | | (16.0) | (13.7) | (27.8) | (13.1) | (22.8) | (15.8) | (91.4) | (40.8) | | | (21.9) | (14.0) | | 4. Net Profit | -26,015 | 31,818 | 19,111 | 69,477 | 16,180 | 18,965 | 1,968 | 2,038 | -334 | -300 | 10,911 | 1,21,998 | | | | | (-30.8) | (248.3) | (11.5) | (23.6) | (81.9) | (3.5) | | | | (1018.1) | | 5. Net Interest Income (NII) | 2,48,198 | 2,75,465 | 1,90,968 | 2,19,063 | 37,863 | 42,119 | 9,020 | 10,401 | 32 | 45 | 4,86,082 | 5,47,094 | | | (7.5) | (11.0) | (17.6) | (15.0) | (21.8) | (10.0) | (75.3) | (15.3) | - | (40.7) | (13.2) | (12.6) | | 6. Net Interest Margin (NIM) | 2.37 | 2.45 | 3.43 | 3.58 | 3.26 | 3.30 | 8.34 | 7.02 | 1.95 | 1.58 | 2.81 | 2.91 | Notes: 1. Figures in parentheses refer to per cent variations over the previous year.
2. Following amalgamation of Lakshmi Vilas Bank with DBS Bank India, w.e.f. November 27, 2020, private and foreign bank-group wise growth rates are based on adjusted bank-group totals.
3. Percentage variations could be slightly different as absolute numbers have been rounded off to ₹ crore.
4. NIM has been defined as NII as percentage of average assets.
Source: Annual accounts of respective banks. |
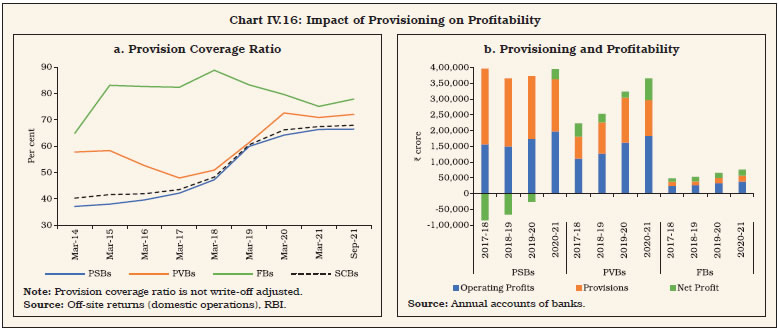 IV.23 Banks were required to maintain additional provisions of at least 10 per cent on moratorium amounts, which was allowed to be spread out across two quarters viz. Q4:2019-20 and Q1:2020-21. Most banks, especially PVBs, frontloaded the required provisions in the March 2020 quarter resulting in a higher provision coverage ratio for the year. Combined with lower slippage, this muted the provision requirements during 2020-21 which helped in boosting banks’ profitability (Chart IV.16). IV.24 Profitability of banks, measured in terms of spread between return on funds and cost of funds, improved with the decline in the latter exceeding that in the former. The improvement was especially evident in PSBs, while niche banks in the SFB and PB categories could not maintain their spreads (Table IV.4). | Table IV.4: Cost of Funds and Return on Funds | | Bank Group/ Variable | Year | Cost of Deposits | Cost of Borrowings | Cost of Funds | Return on Advances | Return on Investments | Return on Funds | Spread | | 1 | 2 | 3 | 4 | 5 | 6 | 7 | 8 | (8-5) | | PSBs | 2019-20 | 5.0 | 4.6 | 4.9 | 8.2 | 6.9 | 7.8 | 2.8 | | | 2020-21 | 4.2 | 4.3 | 4.2 | 7.5 | 6.6 | 7.2 | 3.0 | | PVBs | 2019-20 | 5.3 | 6.2 | 5.4 | 10.1 | 6.6 | 9.2 | 3.8 | | | 2020-21 | 4.3 | 5.5 | 4.5 | 9.1 | 6.2 | 8.3 | 3.9 | | FBs | 2019-20 | 3.7 | 4.1 | 3.7 | 8.5 | 6.7 | 7.6 | 3.9 | | | 2020-21 | 2.4 | 3.4 | 2.5 | 7.1 | 6.1 | 6.5 | 4.0 | | SFBs | 2019-20 | 8.2 | 9.8 | 8.7 | 19.9 | 7.5 | 17.3 | 8.7 | | | 2020-21 | 6.8 | 8.8 | 7.3 | 17.1 | 6.8 | 14.9 | 7.6 | | PBs | 2019-20 | 1.6 | - | 1.6 | - | 3.5 | 3.5 | 1.9 | | | 2020-21 | 3.0 | 5.3 | 3.1 | 9.3 | 4.0 | 4.0 | 0.9 | | SCBs | 2019-20 | 5.0 | 5.4 | 5.0 | 8.9 | 6.8 | 8.3 | 3.2 | | | 2020-21 | 4.2 | 4.9 | 4.2 | 8.1 | 6.4 | 7.6 | 3.3 | Notes: 1. Cost of Deposits = Interest Paid on Deposits / Average of Current and Previous Years’ Deposits.
2. Cost of Borrowings = (Interest Expended - Interest on Deposits) /Average of Current and Previous Years’ Borrowings.
3. Cost of Funds = (Interest Expended) /Average of Current and Previous Years’ (Deposits + Borrowings).
4. Return on Advances = Interest Earned on Advances / Average of Current and Previous Years’ Advances.
5. Return on Investments = Interest Earned on Investments / Average of Current and Previous Years’ Investments.
6. Return on Funds = (Interest Earned on Advances + Interest Earned on Investments) /Average of Current and Previous Years’ (Advances + Investments).
7. Following the amalgamation of Lakshmi Vilas Bank with DBS Bank India, w.e.f. November 27, 2020, private and foreign bank-group wise data are adjusted accordingly.
Source: Calculated from balance sheets of respective banks. | 4. Soundness Indicators IV.25 During 2020-21, SCBs bolstered their capital positions, and also improved their asset quality, liquidity and leverage ratios, despite the pandemic. The number of banks under the Reserve Banks’s prompt corrective action (PCA) framework reduced from four at end-March 2020 to one at end-September 2021, reflecting bank-level as well as overall improvement in SCBs’ soundness indicators. 4.1 Capital Adequacy IV.26 The capital to risk-weighted assets ratio (CRAR) of SCBs has improved sequentially every quarter from end-March 2020 to reach 16.6 per cent at end-September 2021 (Table IV.5). This was essentially driven by a rise in core capital across bank groups, attributable to higher retained earnings, recapitalisation of PSBs by the government and raising of capital from the market. A slowdown in the accumulation of risk weighted assets (RWAs) of both PSBs and FBs helped to boost their capital ratios. IV.27 The number of banks breaching the regulatory minimum requirement of CRAR (including capital conservation buffer) (10.875 per cent) declined to one during 2020-21 from three in the previous year. The fatter right tails for end-March 2021 distributions as compared with those for 2019 imply that a bigger share of banks maintained higher CRAR and CET-1 ratio, with the peak between 2.5 to 5 per cent over andabove the minimum (Chart IV.17)3. Although the implementation of the last tranche of 0.625 per cent of capital conservation buffer (CCB) was deferred till October 1, 2021, banks proactively raised more capital to be in readiness for the imminent transition. IV.28 Resource mobilisation by banks through public and rights issues increased sharply in 2020-21, reflecting the follow-on public offer (FPO) of equity capital by a PVB to meet its capital requirements (Table IV.6). IV.29 In September 2020, the Parliament approved ₹20,000 crore capital infusion for PSBs which was fully disbursed by April 1, 2021. Since 2014, the government has infused ₹3.43 lakh crore in PSBs. In the Union Budget of 2021-22, the government has proposed to infuse another tranche of ₹20,000 crore into PSBs, which will help in augmenting their capital. IV.30 The resources raised by PSBs through private placement almost doubled during 2020-21. In 2021-22 so far, both PSBs and PVBs have resorted to this route for raising capital (Table IV.7). Table IV.5: Component-wise Capital Adequacy of SCBs
(At end-March) | | (Amount in ₹ crore) | | | PSBs | PVBs | FBs | SCBs | | 2020 | 2021 | 2020 | 2021 | 2020 | 2021 | 2020 | 2021 | | 1. Capital Funds | 6,99,872 | 7,93,971 | 6,54,772 | 7,72,389 | 1,88,665 | 2,04,433 | 15,56,686 | 17,90,330 | | i) Tier I Capital | 5,65,830 | 6,49,082 | 5,80,718 | 7,01,622 | 1,72,887 | 1,86,369 | 13,30,816 | 15,54,796 | | ii) Tier II Capital | 1,34,042 | 1,44,889 | 74,054 | 70,767 | 15,777 | 18,064 | 2,25,870 | 2,35,535 | | 2. Risk Weighted Assets | 54,46,253 | 56,56,060 | 39,56,956 | 41,92,303 | 10,65,889 | 10,49,878 | 1,05,35,311 | 1,09,86,622 | | 3. CRAR (1 as % of 2) | 12.9 | 14.0 | 16.5 | 18.4 | 17.7 | 19.5 | 14.8 | 16.3 | | Of which: Tier I | 10.4 | 11.5 | 14.7 | 16.7 | 16.2 | 17.8 | 12.6 | 14.2 | | Tier II | 2.5 | 2.6 | 1.9 | 1.7 | 1.5 | 1.7 | 2.1 | 2.1 | | Source: Off-site returns, RBI. |
4.2 Leverage and Liquidity IV.31 The leverage ratio (LR), calculated as the ratio of tier-1 capital to total exposures, constrains the build-up of leverage by banks. Despite regulatory moderation in October 2019 requiring banks to maintain 4 and 3.5 per cent ratios for domestic systemically important banks and other banks, respectively as compared to 4.5 per cent earlier, the LR of SCBs rose for the second consecutive year during 2020-21. While the improvement was spread across all bank groups, it was led by a sharp improvement in the tier-1 capital of PVBs (Chart IV.18 a). | Table IV.6: Public and Rights Issues by the Banking Sector | | (Amount in ₹ crore) | | Year | PSBs | PVBs | Total | Grand Total | | Equity | Debt | Equity | Debt | Equity | Debt | | 1 | 2 | 3 | 4 | 5 | 6 | 7 | 8= (6+7) | | 2019-20 | - | - | 410 | - | 410 | - | 410 | | 2020-21 | - | - | 15,000 | - | 15,000 | - | 15,000 | | 2021-22* | - | - | - | - | - | - | - | Note: 1. *: Up to November 2021.
2. -: Nil/Negligible.
Source: SEBI. | IV.32 The liquidity coverage ratio (LCR) - designed to help banks withstand liquidity pressures in the short-term - requires banks to maintain high quality liquid assets (HQLAs) to meet 30 days’ net outgo under stressed conditions. In March 2020, banks were allowed to avail funds under the marginal standing facility by dipping into the statutory liquidity ratio (SLR) by up to an additional one per cent of their net demand and time liabilities (NDTL) for three months. This dispensation was progressively extended up to December 31, 2021 to enable banks to meet their LCR requirements and provide comfort on their liquidity needs and will expire thereafter. Additionally, the LCR requirement for SCBs was brought down from 100 per cent to 80 per cent in April 2020 and was gradually restored in two phases by April 1, 2021. Notwithstanding the regulatory relaxation, banks continued to maintain LCR above 100 per cent: the ratio increased from 145 per cent at end-March 2020 to 158.9 per cent by end-March 2021 and 160.9 per cent by end-September 2021 (Chart IV.18 b). | Table IV.7: Resources Raised by Banks through Private Placements | | (Amount in ₹ crore) | | | 2019-20 | 2020-21 | 2021-22 (up to November) | | No. of Issues | Amount Raised | No. of Issues | Amount Raised | No. of Issues | Amount Raised | | PSBs | 20 | 29,573 | 36 | 58,697 | 16 | 32,567 | | PVBs | 8 | 23,121 | 4 | 33,878 | 5 | 17,222 | Note: Includes private placement of debt and qualified institutional placement. Data for 2021-22 are provisional.
Source: BSE, NSE and Merchant Bankers. |
4.3 Non-Performing Assets IV.33 The moderation in GNPA ratios of banks that began in 2019-20, continued during the period under review to reach 7.3 per cent by end-March 2021. Provisional supervisory data suggest a further moderation in the ratio to 6.9 per cent by end-September 2021. During 2020-21, this improvement was driven by lower slippages, partly due to the asset classification standstill. With the decline in delinquent assets, their provision requirements also dropped and the net NPA ratio of PSBs and PVBs eased from the previous year. On the contrary, FBs reported increasing accretions to NPAs and deteriorating asset quality due to amalgamation of a troubled PVB with an FB (Chart IV.19). 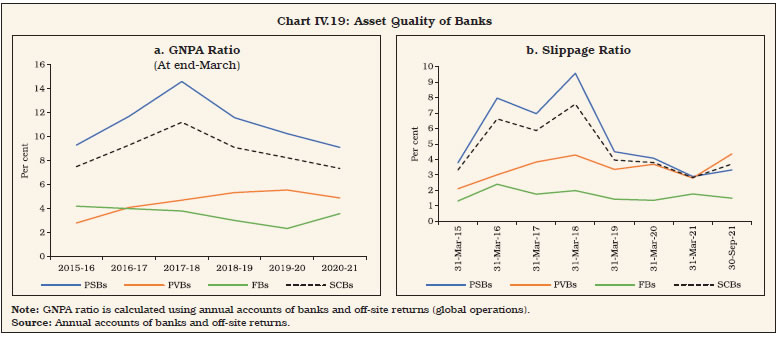
| Table IV.8: Movement in Non-Performing Assets | | (Amount in ₹ crore) | | Item | PSBs | PVBs | FBs | SFBs | All SCBs | | Gross NPAs | | | | | | | Closing Balance for 2019-20 | 6,78,317 | 2,09,568 | 10,208 | 1,709 | 8,99,803 | | Opening Balance for 2020-21 | 5,46,590 | 2,05,335 | 10,208 | 1,709 | 7,63,842 | | Addition during the year 2020-21 | 2,78,711 | 1,03,625 | 12,840 | 5,470 | 4,00,646 | | Reduction during the year 2020-21 | 74,685 | 38,824 | 4,698 | 377 | 1,18,584 | | Written-off during the year 2020-21# | 1,34,000 | 69,995 | 3,307 | 832 | 2,08,134 | | Closing Balance for 2020-21 | 6,16,616 | 2,00,141 | 15,044 | 5,971 | 8,37,771 | | Gross NPAs as per cent of Gross Advances* | | | | | | | 2019-20 | 10.3 | 5.5 | 2.3 | 1.9 | 8.2 | | 2020-21 | 9.1 | 4.9 | 3.6 | 5.4 | 7.3 | | Net NPAs | | | | | | | Closing Balance for 2019-20 | 2,30,918 | 55,683 | 2,005 | 765 | 2,89,370 | | Closing Balance for 2020-21 | 1,96,451 | 55,809 | 2,987 | 2,981 | 2,58,228 | | Net NPAs as per cent of Net Advances | | | | | | | 2019-20 | 3.7 | 1.5 | 0.5 | 0.8 | 2.8 | | 2020-21 | 3.1 | 1.4 | 0.7 | 2.7 | 2.4 | Notes: 1. #: Includes prudential as well as actual write-offs.
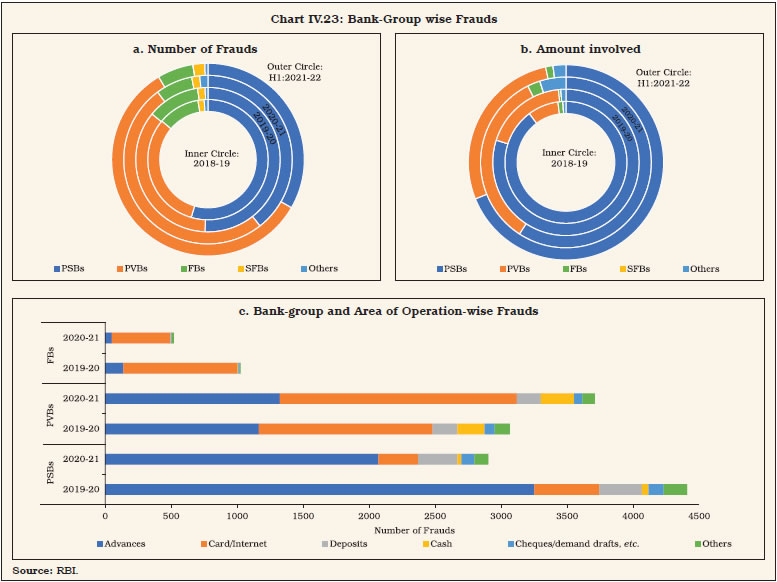
2. Closing balance for 2019-20 and opening balance for 2020-21 do not match due to amalgamation of banks. The amalgamated banks’ GNPAs are reported under ‘addition during the year’.
3. *: Calculated by taking gross NPAs from annual accounts of respective banks and gross advances from off-site returns (global operations).
Source: Annual accounts of banks and off-site returns (global operations), RBI. | IV.34 As observed since 2018, write-offs were the predominant recourse for lowering GNPAs in 2020-21 (Table IV.8 and Chart IV.20). In the case of FBs, the contribution of upgradation improved substantially, but it was not enough to offset fresh slippages. IV.35 Consistent with the improvement in asset quality, the proportion of standard assets to total advances of SCBs increased in 2020-21, largely because of the improved performance of PVBs (Table IV.9). Within standard assets, the share of restructured standard advances (RSA) increased from 0.4 per cent at end March 2020 to 0.8 per cent at end-March 2021, largely representing the onetime restructuring scheme for standard advances announced by the Reserve Bank in August 2020. The RSA further increased to 1.8 per cent at end September 2021 due to restructuring scheme 2.0 for retail loans and MSMEs which does not entail an asset classification downgrade. 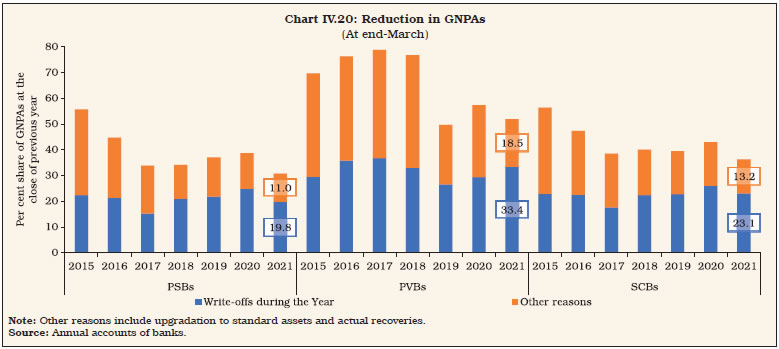
| Table IV.9: Classification of Loan Assets by Bank Group | | (Amount in ₹ crore) | | Bank Group | End-March | Standard Assets | Sub-Standard Assets | Doubtful Assets | Loss Assets | | Amount | Per cent* | Amount | Per cent* | Amount | Per cent* | Amount | Per cent* | | PSBs | 2020 | 53,27,903 | 89.2 | 1,32,530 | 2.2 | 4,04,724 | 6.8 | 1,07,163 | 1.8 | | | 2021 | 55,87,450 | 90.6 | 1,03,744 | 1.7 | 3,51,014 | 5.7 | 1,22,217 | 2.0 | | PVBs | 2020 | 34,14,554 | 94.9 | 56,588 | 1.6 | 92,396 | 2.6 | 34,986 | 1.0 | | | 2021 | 37,57,240 | 95.3 | 65,363 | 1.7 | 90,228 | 2.3 | 31,350 | 0.8 | | FBs | 2020 | 4,25,857 | 97.7 | 3,273 | 0.8 | 5,775 | 1.3 | 1,161 | 0.3 | | | 2021 | 4,10,418 | 97.6 | 3,648 | 0.9 | 5,566 | 1.3 | 986 | 0.2 | | SFBs** | 2020 | 89,800 | 98.1 | 1,023 | 1.1 | 648 | 0.7 | 39 | 0.0 | | | 2021 | 1,05,619 | 94.6 | 4,965 | 4.4 | 841 | 0.8 | 165 | 0.1 | | All SCBs | 2020 | 92,58,114 | 91.7 | 1,93,413 | 1.9 | 5,03,543 | 5.0 | 1,43,349 | 1.4 | | | 2021 | 98,60,726 | 92.7 | 1,77,720 | 1.7 | 4,47,648 | 4.2 | 1,54,717 | 1.5 | Notes: 1. Constituent items may not add up to the total due to rounding off.
2. *: As per cent of gross advances.
3. **: Refers to scheduled SFBs.
Source: Off-site returns (domestic operations), RBI. | IV.36 The share of large borrowal accounts (exposure of ₹5 crore or more) in total advances declined to 51 per cent at end-March 2021 from 54.2 per cent a year ago. Their contribution to total NPAs also declined in tandem from 75.4 per cent to 66.2 per cent during the same period. The special mention accounts-2 (SMA-2) ratio, which signals impending stress, has risen across bank groups since the outbreak of the pandemic. The RSA ratio has also increased during the same period, partly reflecting the impact of resolution framework (RF) 1.0 and 2.0 (Chart IV.21). 4.4 Recoveries IV.37 During 2020-21, all the recovery channels, most notably Lok Adalats, witnessed a sizeable decline in the cases referred for resolution (Table IV.10). Even though initiation of fresh insolvency proceedings under the Insolvency and Bankruptcy Code (IBC) of India was suspended for a year till March 2021 and COVID-19 related debt was excluded from the definition of default, it constituted one of the major modes of recoveries in terms of amount recovered. Allowing pre-pack resolution window for MSMEs is expected to assuage the mounting pressure of pending cases before NCLTs, reducehaircuts and improve declining recovery rates4. IV.38 Another important mode of asset resolution for banks, especially PVBs, has been sale of NPAs to asset reconstruction companies (ARCs) by taking haircuts. In recent years, however, the preference of banks has shifted to alternative avenues, with asset sales declining as a proportion to outstanding GNPAs across bank groups. This was partly due to the worsening acquisition cost of ARCs as a proportion of book value of assets, reflecting higher haircuts and lower realisable values in respect of their acquired assets (Chart IV.22). IV.39 The recovery of security receipts (SRs) issued by ARCs is a critical indicator of their performance. Since 2018, the Reserve Bank has been disincentivising banks from holding SRs in excess of 10 per cent of the transaction value of sale of stressed assets through increasedprovisions.5 Consequently, the share of SRs subscribed to by banks has decreased over the years, and their share hovered around 58per cent in 2019-20 and 2020-216. The share of ARCs in SR holdings has declined over the years, with the investor base having gradually diversified with an increasing share of foreign institutional investors and other qualified buyers (Table IV.11). | Table IV.10: NPAs of SCBs Recovered through Various Channels | | (Amount in ₹ crore) | | Recovery Channel | 2019-20 | 2020-21 (P) | | No. of cases Referred | Amount Involved | Amount recovered* | Col. (4) as per cent of Col. (3) | No. of cases Referred | Amount Involved | Amount recovered* | Col. (8) as per cent of Col. (7) | | 1 | 2 | 3 | 4 | 5 | 6 | 7 | 8 | 9 | | Lok Adalats | 59,86,790 | 67,801 | 4,211 | 6.2 | 19,49,249 | 28,084 | 1,119 | 4.0 | | DRTs | 33,139 | 2,05,032 | 9,986 | 4.9 | 28,182 | 2,25,361 | 8,113 | 3.6 | | SARFAESI Act | 1,05,523 | 1,96,582 | 34,283 | 17.4 | 57,331 | 67,510 | 27,686 | 41.0 | | IBC@ | 1,986 | 2,24,935 | 1,04,117 | 46.3 | 537 | 1,35,139 | 27,311 | 20.2 | | Total | 61,27,438 | 6,94,350 | 1,52,597 | 22.0 | 20,35,299 | 4,56,094 | 64,228 | 14.1 | Notes: 1. P: Provisional.
2. *: Refers to the amount recovered during the given year, which could be with reference to the cases referred during the given year as well as during the earlier years.
3. DRTs: Debt Recovery Tribunals.
4. @: Cases admitted by National Company Law Tribunals (NCLTs) under IBC.
5. The resolution plan of Essar Steel India Ltd. was approved in 2018-19. However, as apportionment among creditors was settled in 2019-20, the recovery is reflected in the latter year data.
Source: Off-site returns, RBI and Insolvency and Bankruptcy Board of India (IBBI). |
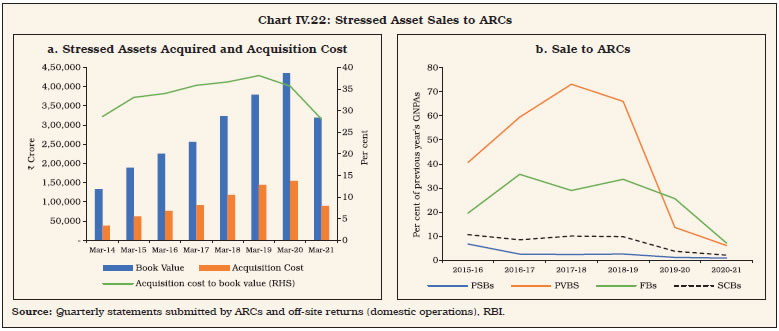 4.5 Frauds in the Banking Sector IV.40 Apart from eroding customer confidence, frauds present multiple challenges for the financial system in the form of reputational risk, operational risk and business risk. During 2020-21, the reported number of cases of frauds declined (Table IV.12). In terms of amount involved, a bulk of these cases occurred earlier but were reported during the year 2020-21 (Table IV.13). IV.41 In terms of area of operations, an overwhelming majority of cases reported during 2020-21 in terms of number and amount involved related to advances, while frauds concerning card or internet transactions made up 34.6 per cent of the number of cases. IV.42 In 2020-21, there was a marked increase in frauds related to PVBs, both in terms of number as well as the amount involved. During H1:2021-22, PVBs accounted for more than half of the number of reported fraud cases (Chart IV.23a). In value terms, however, the share of PSBs was higher, indicating predominance of high value frauds (Chart IV.23b). While the major share of loans-related cases pertained to PSBs, PVBs accounted for a majority of card/ internet and cash-related cases (Chart IV.23c). | Table IV.11: Details of Financial Assets Securitised by ARCs | | (Amount in ₹ crore) | | Item | Mar-19 | Mar-20 | Mar-21 | | Reporting ARCs | 18 | 23 | 21 | | 1. Book Value of the Assets acquired from banks/FIs | 1,86,770 | 2,95,097 | 3,19,838 | | Reporting ARCs | 12 | 11 | 11 | | 2. Amount of Security Receipts (SRs) issued | 14,691 | 59,347 | 69,995 | | 3. Security Receipts Subscribed to by: | | | | | a Selling Banks/ Financial Institutions | 10,659 | 34,147 | 41,076 | | b Asset Reconstruction Companies (ARCs) | 3,663 | 12,421 | 13,942 | | c FIIs | 151 | 8,750 | 9,861 | | d Others (Qualified Institutional Buyers) | 219 | 4,028 | 5,116 | | 4. Amount of SRs completely redeemed | 558 | 9,062 | 13,283 | | 5. SRs Outstanding | 13,087 | 39,618 | 42,266 | | Source: Quarterly statements submitted by ARCs. |
| Table IV.12: Frauds in Various Banking Operations Based on the Date of Reporting | | (Cases in number and amount in ₹ crore) | | Area of Operation | 2018-19 | 2019-20 | 2020-21 | 2020-21 (April-September) | 2021-22 (April-September) | | Number of frauds | Amount Involved | Number of frauds | Amount Involved | Number of frauds | Amount Involved | Number of Frauds | Amount Involved | Number of Frauds | Amount involved | | Advances | 3,603 | 64,539 | 4,608 | 1,81,942 | 3,501 | 1,37,023 | 1,669 | 63,529 | 1,802 | 35,060 | | Off-balance Sheet | 33 | 5,538 | 34 | 2,445 | 23 | 535 | 14 | 439 | 10 | 612 | | Forex Transactions | 13 | 695 | 8 | 54 | 4 | 129 | 1 | 0 | 1 | 0 | | Card/Internet | 1,866 | 71 | 2,677 | 129 | 2,545 | 119 | 1,247 | 49 | 1,532 | 60 | | Deposits | 593 | 148 | 530 | 616 | 504 | 434 | 245 | 149 | 208 | 362 | | Inter-Branch Accounts | 3 | 0 | 2 | 0 | 2 | 0 | 2 | 0 | 0 | 0 | | Cash | 274 | 56 | 371 | 63 | 329 | 39 | 132 | 22 | 245 | 51 | | Cheques/DDs, etc. | 189 | 34 | 201 | 39 | 163 | 85 | 77 | 48 | 107 | 149 | | Clearing Accounts | 24 | 209 | 22 | 7 | 14 | 4 | 4 | 1 | 9 | 1 | | Others | 200 | 244 | 250 | 173 | 278 | 54 | 108 | 25 | 157 | 47 | | Total | 6,798 | 71,534 | 8,703 | 1,85,468 | 7,363 | 1,38,422 | 3,499 | 64,261 | 4,071 | 36,342 | Notes: 1. Refers to frauds of ₹1 lakh and above.
2. The figures reported by banks and financial institutions are subject to change based on revisions filed by them.
3. Frauds reported in a year could have occurred several years prior to year of reporting.
4. Amounts involved are as reported and do not reflect the amount of loss incurred. Depending on recoveries, the loss incurred gets reduced. Further, the entire amount involved in loan accounts is not necessarily diverted.
Source: RBI. |
| Table IV.13: Frauds in Various Banking Operations Based on the Date of Occurrence | | (Cases in number and amount in ₹ crore) | | Area of operation | Prior to 2018-19 | 2018-19 | 2019-20 | 2020-21 | 2021-22 (April - September) | | Number of frauds | Amount Involved | Number of frauds | Amount Involved | Number of frauds | Amount Involved | Number of frauds | Amount Involved | Number of Frauds | Amount involved | | Advances | 8,752 | 3,33,362 | 2,129 | 40,516 | 1,525 | 31,074 | 903 | 13,373 | 205 | 237 | | Off-balance Sheet | 71 | 5,817 | 19 | 2,927 | 5 | 371 | 5 | 12 | 0 | 0 | | Forex Transactions | 11 | 597 | 5 | 145 | 7 | 135 | 3 | 1 | 0 | 0 | | Card/Internet | 485 | 31 | 2,090 | 83 | 2,645 | 130 | 2,296 | 104 | 1,104 | 32 | | Deposits | 475 | 606 | 550 | 163 | 438 | 338 | 306 | 421 | 66 | 32 | | Inter-Branch Accounts | 3 | 0 | 3 | 0 | 0 | 0 | 1 | 0 | 0 | 0 | | Cash | 95 | 40 | 275 | 64 | 381 | 37 | 336 | 45 | 132 | 21 | | Cheques/DDs, etc. | 109 | 34 | 165 | 28 | 201 | 69 | 144 | 163 | 41 | 12 | | Clearing Accounts, etc. | 17 | 9 | 26 | 206 | 13 | 2 | 9 | 3 | 4 | 0 | | Others | 289 | 277 | 201 | 58 | 144 | 132 | 206 | 35 | 45 | 18 | | Total | 10,307 | 3,40,773 | 5,463 | 44,191 | 5,359 | 32,290 | 4209 | 14,158 | 1,597 | 353 | Notes: 1. Refers to frauds of ₹1 lakh and above.
2. The figures reported by banks and financial institutions are subject to change based on revisions filed by them.
3. Data based on ‘date of occurrence’ may change for a period of time as frauds reported late but having occurred earlier would get added.
4. Data in the table pertain to cases reported from 2018-19 till September 30, 2021.
Source: RBI. |
 4.6 Enforcement Actions IV.43 In order to separate enforcement action from the supervisory process and in accordance with international best practices, the Enforcement Department was created in the Reserve Bank in 2017. The department is entrusted with ensuring uniformity and consistency in enforcement of regulations and engendering compliance in the regulated entities (REs). During 2020-21, the number of instances of imposition of penalty reduced, with enforcement action being undertaken against 11 SCBs. Monetary penalties were imposed for non-compliance with provisions or contravention of certain directions issued by the Reserve Bank, including frauds classification and reporting, exposure norms and IRAC norms, interest rate on deposits and lending to MSMEs (Table IV.14). | Table IV.14: Enforcement Actions | | Regulated Entity | April 2019 to March 2020 | April 2020 to March 2021 | | Instances of imposition of penalty | Total Penalty
(₹ crore) | Instances of imposition of penalty | Total Penalty
(₹ crore) | | Public Sector Banks | 29 | 35.1 | 4 | 9.5 | | Private Sector Bank | 11 | 11.5 | 3 | 5.9 | | Cooperative Banks | 9 | 7.4 | 43 | 3.9 | | Foreign Banks | 1 | 1.0 | 3 | 8.0 | | Payments Banks | - | - | 1 | 1.0 | | Small Finance Banks | - | - | - | - | | NBFCs | 2 | 0.1 | 7 | 3.1 | | Total | 52 | 55 | 61 | 31 | | Source: RBI. | 5. Sectoral Bank Credit: Distribution and NPAs IV.44 Headline credit growth remained anaemic during 2020-21, although sectorally some bright spots appeared: agriculture credit revived from a sharp deceleration of the previous year; PVBs increased their lending to the services sector; and PSBs cushioned the deceleration in total retail credit growth, albeit partly. On the other hand, credit growth to services by PSBs and to retail by PVBs slowed down amidst rising NPA ratios (Chart IV.24). IV.45 A drill down into the data reveals that although credit to large industries contracted, their medium-sized counterparts received sharply higher credit flows, incentivised by the Emergency Credit Line Guarantee Scheme(ECLGS)7. The higher NPAs of large industrial borrowers at the end of March 2021 as compared to better asset quality of medium enterprises may also be a driving factor. Within services, credit growth to trade surpassed its pre-pandemic growth rate in 2020-21. Remarkably, its share in services sector credit also grew sharply in 2020-21. After the IL&FS event, NBFCs—especially those with lower ratings— found raising resources from the market difficult and turned to banks. SCBs’ credit to NBFCs grew in double digits during 2015-16 to 2019-20 but decelerated in 2020-21 on a high base (Table IV.15). 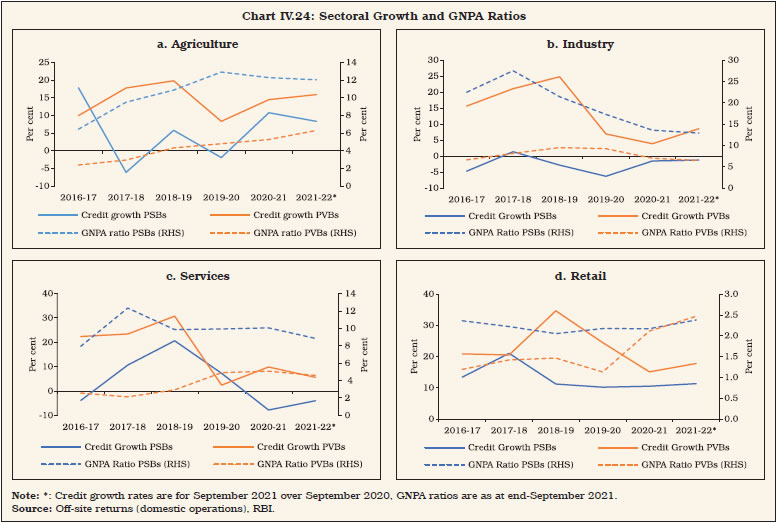
| Table IV.15: Sectoral Deployment of Gross Bank Credit | | (Amount in ₹ crore) | | Sr. No. | Item | Outstanding as on | Per cent variation (y-o-y) | | Mar-19 | Mar-20 | Mar-21 | Sep-21 | 2018-19 | 2019-20 | 2020-21 | 2021-22 (up to September)* | | 1 | Agriculture & Allied Activities | 12,17,594 | 12,39,575 | 13,84,815 | 14,30,480 | 10.0 | 1.8 | 11.7 | 10.7 | | 2 | Industry, of which | 32,93,638 | 32,52,801 | 32,53,636 | 32,34,613 | 5.2 | -1.2 | 0.03 | 3.3 | | | 2.1 Micro & Small Industries | 4,39,811 | 4,37,658 | 4,72,529 | 5,41,554 | 5.2 | -0.5 | 8.0 | 16.8 | | | 2.2 Medium | 1,23,843 | 1,12,367 | 1,87,599 | 2,06,151 | -1.7 | -9.3 | 67.0 | 47.0 | | | 2.3 Large | 26,11,567 | 26,11,377 | 24,76,702 | 23,59,112 | 6.1 | -0.01 | -5.2 | -3.4 | | 3 | Services, of which | 26,02,287 | 27,54,823 | 27,45,324 | 27,24,810 | 25.1 | 5.9 | -0.3 | 1.3 | | | 3.1 Trade | 5,83,930 | 6,28,142 | 7,14,210 | 6,75,820 | 12.4 | 7.6 | 13.7 | 3.7 | | | 3.2 Commercial Real Estate | 2,43,122 | 2,66,357 | 2,52,696 | 2,76,980 | 18.9 | 9.6 | -5.1 | 8.7 | | | 3.3 Tourism, Hotels & Restaurants | 56,194 | 60,039 | 62,722 | 61,027 | 7.9 | 6.8 | 4.5 | -2.1 | | | 3.4 Computer Software | 22,236 | 24,404 | 23,742 | 21,570 | -0.3 | 9.8 | -2.7 | -4.4 | | | 3.5 Non-Banking Financial Companies | 6,27,089 | 7,36,447 | 7,98,241 | 8,24,189 | 38.4 | 17.4 | 8.4 | 14.8 | | 4 | Retail Loans, of which | 23,04,313 | 26,59,249 | 29,86,461 | 31,10,368 | 18.6 | 15.4 | 12.3 | 14.0 | | | 4.1 Housing Loans | 12,04,362 | 13,96,444 | 15,61,913 | 15,99,395 | 19.5 | 15.9 | 11.8 | 11.2 | | | 4.2 Consumer Durables | 9,195 | 11,154 | 21,569 | 28,409 | -51.7 | 21.3 | 93.4 | 69.2 | | | 4.3 Credit Card Receivables | 1,11,361 | 1,32,076 | 1,38,560 | 1,43,937 | 34.5 | 18.6 | 4.9 | 2.2 | | | 4.4 Vehicle/Auto Loans | 2,69,677 | 2,89,366 | 3,29,522 | 3,61,849 | 12.9 | 7.3 | 13.9 | 21.2 | | | 4.5 Education Loans | 76,233 | 79,056 | 78,823 | 82,433 | 1.8 | 3.7 | -0.3 | 2.9 | | | 4.6 Advances against Fixed Deposits (incl. FCNR (B), etc.) | 77,135 | 80,753 | 74,013 | 72,718 | -0.1 | 4.7 | -8.3 | 1.7 | | | 4.7 Advances to Individuals against Shares, Bonds, etc. | 9,339 | 5,619 | 5,619 | 6,092 | 46.3 | -39.8 | 0 | -12.7 | | | 4.8 Other Retail Loans | 5,47,010 | 6,64,781 | 7,76,441 | 8,15,535 | 25.6 | 21.5 | 16.8 | 20.8 | | 5 | Gross Bank Credit | 95,26,932 | 1,00,98,420 | 1,06,40,811 | 1,07,52,479 | 13.4 | 6.0 | 5.4 | 6.8 | Note: 1. Figures in the table may not tally with the figures released by RBI in ‘Sectoral Deployment of Bank Credit’ every month due to difference in coverage of banks.
2. Percentage variations are March over March.
3. The data pertain to SCBs.
4. *September 2021 over September 2020.
Source: Off-site returns (domestic operations), RBI. | IV.46 During 2020-21, retail loan portfolios of banks outgrew their services sector lending, aided by double digit acceleration in housing loans- the biggest component of retail loans. Vehicle loans gained traction, reflecting consumer interest after companies announced substantial discounts on automobiles. IV.47 The RSA ratio of SCBs had been decelerating for five consecutive years since 2015 on better asset quality recognition by banks after the asset quality review (AQR). With the restructuring scheme announced in August 2020 by the Reserve Bank in response to the pandemic, the RSA ratio, especially of services and retail loans increased sharply in 2020-21, led by contact-intensive services (Chart IV.25). 5.1 Priority Sector Credit IV.48 Priority sector lending (PSL) accelerated in 2020-21, primarily driven by revival in credit to agriculture—especially Kisan Credit Card (KCC) loans—and micro and small enterprises (MSEs) by both PSBs and PVBs (Chart IV.26 and Appendix Table IV.3). IV.49 PSL, which is typically pro-cyclical, is also influenced by bank-specific characteristics such as asset quality of the PSL vis-à-vis non-priority sector loans, size of the lending bank and their branch network (Box IV.2). IV.50 During 2020-21, all bank groups managed to achieve the overall PSL targets. Shortfalls were observed in certain sub-targets by PSBs (micro enterprises) and PVBs (agriculture; small and marginal farmers (SMFs) and non-corporate individual farmers) (Table IV.16). A phased increase in PSL targets for SMFs and weaker sections as per the revised PSL guidelines issued in September 2020 is expected to deepen credit penetration to thesesectors12. 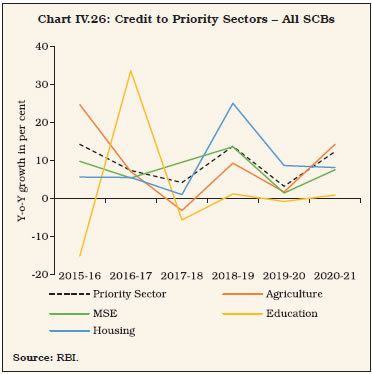
Box IV.2: Determinants of Priority Sector Lending Priority sector lending – aimed at meeting requirements of sectors which are credit-starved but are socially significant began in India in 1969. SCBs8 are required to lend 40 per cent of their previous year’s adjusted net bank credit (ANBC) or credit equivalent of off balance-sheet exposures (CEOBE), whichever is higher, to the priority sector. Despite uniform regulatory requirements, banks have deviated from the regulatory target in some periods across banks and bank groups. Multiple avenues are available to banks to meet regulatory obligations in case of shortfall in direct lending, including Inter- Bank Participation Certificates (IBPCs), securitisation of priority sector loans, depositing shortfalls in funds such as the Rural Infrastructure Development Fund (RIDF) and other funds with NABARD, NHB, SIDBI and MUDRA Ltd. In 2016, trading in priority sector lending certificates (PSLCs) was introduced, which was a game changer as it allowed buying for shortfall and selling for overachievement of PSL targets without corresponding transfer of loan, cash flows or risk. Empirically, priority sector lending is found to depend on various bank-specific characteristics like the nature of ownership, size as well as performance (Kumar, Batra, & Deisting, 2016). A fixed effect panel regression for the period March 2005 till December 2020 with organic PSL by banks as the dependent variable using quarterly bank-wise data on 59 banks suggests that asset quality plays an important role in priority sector lending decisions: banks which face priority sector asset quality stress tended to lend less to it. GDP, which is a control for macro-economic factors, and bank size9 – a bank-specific control variable – have a positive relationship with PSL. A dummy for the March quarter was found to be positive and significant, as banks tended to backload their PSL in the last quarter to improve their annual average and achieve the regulatory target10. Branches to assets ratio, a proxy for banks’ reach, is also found to be significant11. | Table 1: Determinants of Priority Sector Lending | | Variables | Dependent Variables | | Priority Sector Advances | Priority Sector Agricultural Advances | Priority Sector MSE Advances | | Dependent Variable (-1) | 0.477*** | 0.564*** | 0.746*** | | | (0.111) | (0.0947) | (0.0313) | | Priority GNPA Ratio | -0.0161*** | | | | | (0.00314) | | | | Non-Priority GNPA Ratio | 0.00495** | | 0.00492*** | | | (0.00192) | | (0.00171) | | Agriculture GNPA Ratio | | -0.00606*** | | | | | (0.000868) | | | MSE GNPA Ratio | | | -0.0154*** | | | | | (0.00326) | | March Dummy | 0.0351*** | 0.0616*** | 0.0461*** | | | (0.0103) | (0.0161) | (0.0156) | | GDP | 0.0568** | | 0.0979** | | | (0.0231) | | (0.0454) | | Agricultural GDP | | 0.0896*** | | | | | (0.0329) | | | CRAR | | 0.00230 | 0.00329 | | | | (0.00332) | (0.00231) | | PSLC Dummy | 0.0597*** | 0.0443** | -0.0204 | | | (0.0217) | (0.0167) | (0.0225) | | Bank Size | 0.480*** | 0.397*** | 0.290*** | | | (0.106) | (0.0962) | (0.0515) | | Branches per Asset | 0.00240*** | | | | | (0.000542) | | | | Rural Branches per Asset | | 0.00713*** | | | | | (0.00173) | | | Urban Branches per Asset | | | 0.00344*** | | | | | (0.000623) | | RoE | 0.00 | | | | | (0.000) | | | | Constant | -1.307*** | -1.990*** | -2.581*** | | | (0.338) | (0.495) | (0.371) | | Observations | 2,765 | 2,769 | 2,749 | | R-squared | 0.970 | 0.938 | 0.948 | | Number of Banks | 59 | 59 | 59 | Notes: 1. Robust standard errors in parentheses
2. *** p<0.01, ** p<0.05, * p<0.1 | For the sub-targets on lending to agriculture (18 per cent) and micro and small enterprises (MSEs) (7.5 per cent), similar models are estimated with rural and urban branches to assets ratio, respectively. The coefficients are significant and positive. Banks with significant brick-and-mortar presence in rural areas lend higher to priority agriculture sector while those in urban areas specialise in MSE lending. A positive and significant PSLC dummy for overall PSL as well as sub-targets suggests that the introduction of PSLCs has given banks an opportunity to profitably trade in PSLCs while simultaneously fulfilling regulatory targets. References: Kumar, M., Batra, N., & Deisting, F. (2016). Determinants Of Priority Sector Lending: Evidence From Bank Lending Patterns In India. The International Journal of Business and Finance Research. | IV.51 The total trading volume of PSLCs grew by 26 per cent to ₹5,89,163 crores during 2020-21. Among the four PSLC categories, significant growth was recorded in case of PSLC-General and PSLC-Micro Enterprises (Chart IV.27). IV.52 The weighted average premiums (WAPs) for PSLCs increased year-on-year by 11 to 44 basis points across categories in 2020-21, with PSLC-SMF and PSLC-A categories commanding significantly higher premiums than PSLC-G and PSLC-ME. During H1:2021-22, the WAP on PSLCs-ME increased sharply due to change in the definition of MSMEs. The increase in WAP across other categories may be attributed to COVID-related stress (Table IV.17). Table IV.16: Priority Sector Lending by Banks
(As on March 31, 2021) | | (Amount in ₹ crore) | | Item | Target/ sub-target (per cent of ANBC/ CEOBE) | Public Sector Banks | Private Sector Banks | Foreign Banks | Small Finance Banks | | Amount Outstanding | Per cent of ANBC/ CEOBE | Amount Outstanding | Per cent of ANBC/ CEOBE | Amount Outstanding | Per cent of ANBC/ CEOBE | Amount Outstanding | Per cent of ANBC/ CEOBE | | 1 | 2 | 3 | 4 | 5 | 6 | 7 | 8 | 9 | 10 | | Total Priority Sector Advances | 40/75* | 24,16,750 | 41.06 | 14,33,674 | 40.62 | 1,99,969 | 41.02 | 59,055 | 86.00 | | of which | | | | | | | | | | | Total Agriculture | 18.0 | 10,68,112 | 18.15 | 5,29,637 | 15.01 | 45,457 | 18.97 | 19,239 | 28.02 | | Small and marginal farmers | 8.0 | 5,53,455 | 9.40 | 2,40,754 | 6.82 | 24,233 | 10.11 | 17,798 | 25.92 | | Non-corporate Individual Farmers# | 12.14 | 7,69,173 | 13.07 | 3,64,026 | 10.31 | 29,187 | 12.18 | 20,422 | 29.74 | | Micro Enterprises | 7.50 | 4,18,763 | 7.11 | 2,93,072 | 8.30 | 18,050 | 7.53 | 16,580 | 24.14 | | Weaker Sections | 10.0 | 7,27,794 | 12.37 | 3,58,002 | 10.14 | 28,037 | 11.70 | 36,377 | 52.97 | Notes: 1. Amount outstanding and achievement percentage are based on the average achievement of banks for four quarters of the financial year.
2. *: Total priority sector lending target for Small Finance Banks is 75 per cent.
3. #: Target for non-corporate farmers is based on the system-wide average of the last three years’ achievement. For FY 2020-21, the applicable system wide average figure is 12.14 percent.
4. For foreign banks having less than 20 branches, only the total PSL target of 40 per cent is applicable.
Source: RBI. | IV.53 While the share of priority sector accounts in total bank lending increased only marginally from 35 per cent in 2019-20 to 36 per cent in 2020-21, their share in total GNPAs increased markedly from 32.8 per cent to 40.5 per cent during the same period, led by delinquencies in agricultural and micro and small enterprises PSL (Table IV.18). 5.2 Credit to Sensitive Sectors IV.54 Banks’ exposure to sensitive sectors decelerated during 2020-21. Nevertheless, it grew at a higher pace than overall credit growth, led by the real estate sector, especially by PVBs and FBs. Banks’ capital market exposure contracted for the second consecutive year (Chart IV.28 and Appendix Table IV.4). | Table IV.17: Weighted Average Premium on Various Categories of PSLCs | | (Per cent) | | PSLC Category | 2017-18 | 2018-19 | 2019-20 | 2020-21 | 2020-21 (Apr-Sep) | 2021-22 (Apr-Sep) | | PSLC-A | 1.29 | 0.79 | 1.17 | 1.55 | 1.61 | 2.00 | | PSLC-ME | 0.61 | 0.57 | 0.44 | 0.88 | 0.54 | 2.03 | | PSLC-SMF | 1.54 | 1.15 | 1.58 | 1.74 | 1.87 | 2.38 | | PSLC-G | 0.59 | 0.31 | 0.35 | 0.46 | 0.49 | 0.85 | | Source: RBI. |
Table IV.18: Sector-wise GNPAs of Banks
(At end-March) | | (Amount in ₹ crore) | | Bank Group | Priority Sector | Of which | Non-priority Sector | Total NPAs | | Agriculture | Micro and Small Enterprises | Others | | Amt. | Per cent# | Amt. | Per cent# | Amt. | Per cent# | Amt. | Per cent# | Amt. | Per cent# | Amt. | Per cent# | | PSBs | | | | | | | | | | | | | | 2020 | 2,36,212 | 36.66 | 1,11,571 | 17.31 | 90,769 | 14.09 | 33,872 | 5.26 | 4,08,205 | 63.34 | 6,44,417 | 100.00 | | 2021 | 2,58,228 | 44.76 | 1,15,281 | 19.98 | 1,01,786 | 17.64 | 41,161 | 7.13 | 3,18,747 | 55.24 | 5,76,974 | 100.00 | | PVBs | | | | | | | | | | | | | | 2020 | 36,219 | 19.69 | 14,462 | 7.86 | 16,111 | 8.76 | 5,646 | 3.07 | 1,47,751 | 80.31 | 1,83,970 | 100.00 | | 2021 | 50,557 | 27.04 | 18,900 | 10.11 | 23,473 | 12.56 | 8,184 | 4.38 | 1,36,384 | 72.96 | 1,86,941 | 100.00 | | FBs | | | | | | | | | | | | | | 2020 | 1,692 | 16.57 | 376.07 | 3.68 | 1070.24 | 10.48 | 245.66 | 2.41 | 8,516 | 83.43 | 10,208 | 100.00 | | 2021 | 1,802 | 17.67 | 328.97 | 3.23 | 1193.62 | 11.70 | 279.48 | 2.74 | 8,397 | 82.33 | 10,199 | 100.00 | | SFBs | | | | | | | | | | | | | | 2020 | 1,376 | 80.51 | 255.77 | 14.96 | 753.88 | 44.10 | 366.59 | 21.45 | 333 | 19.49 | 1,709 | 100.00 | | 2021 | 4,974 | 83.31 | 1509.6 | 25.28 | 2049.4 | 34.32 | 1415.23 | 23.70 | 996 | 16.69 | 5,971 | 100.00 | | All SCBs | | | | | | | | | | | | | | 2020 | 2,75,499 | 32.79 | 1,26,664 | 15.07 | 1,08,704 | 12.94 | 40,131 | 4.78 | 5,64,806 | 67.21 | 8,40,305 | 100.00 | | 2021 | 3,15,561 | 40.45 | 1,36,019 | 17.44 | 1,28,502 | 16.47 | 51,039 | 6.54 | 4,64,524 | 59.55 | 7,80,085 | 100.00 | Notes: 1. Amt.: – Amount; Per cent: Per cent of total NPAs.
2. Constituent items may not add up to the total due to rounding off.
3. # Share in total NPAs.
Source: Off-site returns (domestic operations), RBI. |
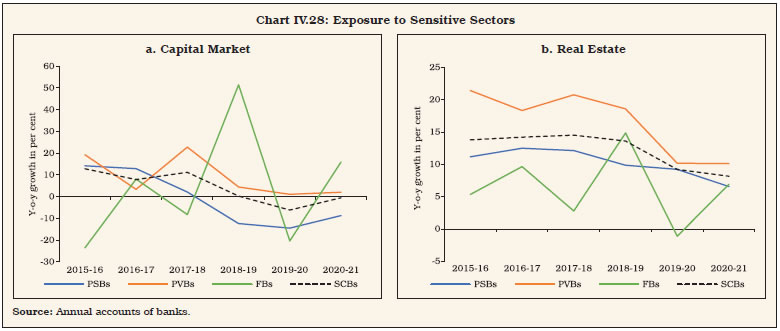
6. Performance of Banking Stocks IV.55 After the outbreak of the COVID-19 pandemic, equity markets in India fell sharply, tracking global cues. Banking sector stocks were hit hard, reflecting investors’ concerns about their financial health, although the impact was not homogenous across banks and bank groups. Subsequently, in response to the policy measures initiated by the Reserve Bank and the Government of India, stock prices revived (Chart IV.29) IV.56 Empirical evidence suggests that stock prices of banks with weak balance sheets were hammered down more by investors in the pandemic shock (Box IV.3) 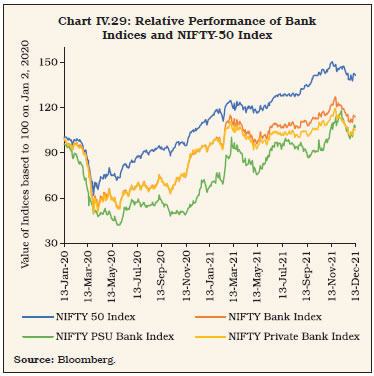
Box IV.3: Impact of COVID-19 Lockdown on Banking Stock Performance Globally, the pandemic and lockdowns led to persistent underperformance of banking sector stocks vis-à-vis the headline index. Market anxiety over potential liquidity risks led to a sell-off in these stocks. Subsequently, however, as policy support measures were introduced, reversals also became evident (Acharya et al., 2021; Kunt et al., 2021). In India, too, the imposition of a nation-wide lockdown effective from March 24, 2020 onwards triggered investors’ anxiety about banking stocks. In order to unravel this phenomenon empirically, a two-step approach is adopted13. In the first step, an event study model (MacKinlay, 1997; Mathur et al., 2021) was employed to compute equation (1), which is estimated over a period of 91 to 11 days prior to the event day, i.e. imposition of lockdown. As expected, CARs for SCBs declined significantly following the announcement of the nation-wide lockdown (Chart 1). Moreover, the impact was felt across the board, irrespective of bank size and bank group (Chart 2).
In the second step, a cross-sectional regression model (equation 3) is used to investigate the role of bank-level characteristics in explaining the CARs15:  where the size of the bank (proxied by log of total assets) and a binary variable for bank group (0 for PVBs and 1 for PSBs) are used as control variables. Balance sheet and financial variables such as profitability (RoE), asset quality (GNPA ratio and slippage ratio) and capital adequacy (CET-1 ratio), are represented by Xb. The results from the regression analysis suggest that controlling for size and ownership, banks which had stronger balance sheets and financial positions – such as higher RoE and CET-1 ratio – in the pre-pandemic period suffered lower losses. On the other hand, banks which entered the pandemic with higher GNPA and slippage ratios were penalised by markets with sharper price corrections (Table 1). These findings highlight the importance of robust balance sheets of banks so as to withstand large macroeconomic shocks. | Table 1: Regression Results | | Dependent Variable: CAR (-1, +1) | | Categories | Model 1 | Model 2 | Model 3 | Model 4 | Model 5 | | Size | 0.050 | 0.070 | 0.127 | -0.101 | 0.117 | | | (1.070) | (0.976) | (1.005) | (0.997) | (0.782) | | Bank-Group Dummy | 0.731 | 1.259 | 2.108 | 3.943 | 1.806 | | | (2.625) | (2.404) | (2.667) | (2.814) | (1.931) | | ROE | - | 0.100* | - | - | - | | | | (0.040) | | | | | CET-1 ratio | - | - | 0.724* | - | - | | | | | (0.282) | | | | GNPA ratio | - | - | - | -0.414* | - | | | | | | (0.181) | | | Slippage Ratio (annualized) | - | - | - | - | -1.180*** | | | | | | | (0.238) | | Number of Observations | 30 | 30 | 30 | 30 | 30 | | Adjusted R2 | -0.07 | 0.11 | 0.09 | 0.08 | 0.43 | | BIC | 206.30 | 203.07 | 203.64 | 204.19 | 189.76 | Notes: 1. Figures in parenthesis represents standard errors
2. ***p < 0.001, **p < 0.01, *p < 0.5 | References Acharya, V. V., Engle III, R. F., & Steffen, S. (2021). Why did bank stocks crash during COVID-19? (No. w28559). National Bureau of Economic Research. Demirgüç-Kunt, A., Pedraza, A., & Ruiz-Ortega, C. (2021). Banking sector performance during the covid-19 crisis. Journal of Banking & Finance, 106305. Mathur, A., Sengupta, R., & Pratap, B. (2021). Saved by the bell? Equity market responses to surprise Covid-19 lockdowns and central bank interventions. (Forthcoming) MacKinlay, A. C. (1997). Event Studies in Economics and Finance. Journal of Economic Literature, 35(1), 13–39. | 7. Ownership Pattern in Commercial Banks IV.57 Government ownership in Canara Bank, Punjab National Bank, Indian Bank and Union Bank of India increased substantially following the amalgamation of ten PSBs into four, effective from April 1, 202016. During H2:2020-21, the government’s shareholding increased in Punjab and Sind Bank due to recapitalisation17 and decreased in Bank of Baroda, Canara Bank, Punjab National Bank and State Bank of India, owing to capital raising through private placements (Chart IV.30). Furthermore, as at end-September 2021, government shareholding decreased in Bank of India, Bank of Maharashtra, Canara Bank, Indian Bank, Punjab National Bank and Union Bank of India on account of raising of fresh equity from the market. Capital infusions planned for PSBs during 2021-22 are expected to change their ownership pattern further18. 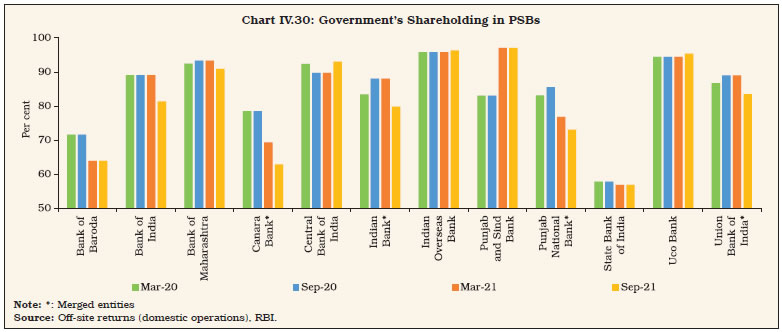 IV.58 During the year, one private sector bank, Lakshmi Vilas Bank Limited, amalgamated with a foreign bank, DBS Bank India Limited, with effect from November 27, 2020. With this, 21 PVBs were operational in India as at end-March 2021. In terms of foreign investments, non-residents’ shareholding was well within the limits of 74 per cent for PVBs including Local Area Banks (LABS) and Small Finance Banks (SFBs) and 20 per cent for PSBs (Appendix Table IV.5). 8. Corporate Governance IV.59 Effective governance and balanced compensation practices in banks are important risk mitigation tools as they boost depositors’ confidence and also reinforce financial stability. Following the discussion paper on ‘Governance in Commercial Banks in India’ issued in June 2020 and the feedback received thereon, the Reserve Bank issued an interim set of instructions addressing several operational subjects on April 26, 2021. 8.1 Composition of Boards IV.60 Apart from ensuring competency, diversity and meeting the fit-and-proper criterion, appointment of independent directors goes a long way in ensuring board effectiveness. Most PVBs in India have achieved this in varying degrees, with the dominant presence of independent directors on their boards as well as in their key supervisory committees, including the Audit Committee of the Board (ACB), Risk Management Committee of the Board (RMCB) and Nomination and Remuneration Committee (NRC) (Chart IV.31). IV.61 It is also necessary to limit the presence of management on the board and key supervisory committees to ensure functional independence. Ensuring that the Chair of the board is not a member of these committees helps minimise role conflicts. The share of PVBs where the Chair is not a member of an ACB increased to 47 per cent at end-March 2021 from 35 per cent a year ago. However, the share remained unchanged at 29 per cent in the case of RMCBs19. 8.2 Executive Compensation IV.62 The compensation paid to a bank Chief Executive Officer (CEO) in comparison to a representative bank employee varies greatly across different bank groups. For PSBs, on an average, CEOs earn 3 times the typical employee20, while the same was as high as 75 times in the case of SFBs and 67 times in the case of PVBs. The corresponding multiple was low for FBs as the remuneration received by employees is relatively high. The variation across bank groups remained consistent through 2018-19 and 2019-20 (Chart IV.32). IV.63 Revised guidelines on compensation21 require that the compensation of CEOs / Whole Time Directors (WTDs) / Material Risk Takers (MRTs) must be adjusted for all types of risk, their outcomes and time horizons. Moreover, the mix of cash, equity and other forms of payment must be consistent with risk alignment, wherein the variable pay component should be in the range of 50 to 75 per cent of the total pay, a minimum of 60 per cent of which should be under deferral arrangements. The cash component of variable pay is also capped between 33 to 50 per cent22 under the revised guidelines (Chart IV.33).
9. Foreign Banks’ Operations in India and Overseas Operations of Indian Banks IV.64 During 2020-21, the number of FBs operating in the country reduced as compared to a year ago23, however, total branches of FBs increased due to amalgamation of Lakshmi Vilas Bank with DBS Bank, with effect from, November 27, 2020 (Table IV.19). On the other hand, PSBs have been reducing their overseas presence for the last three and a half years to achieve greater cost efficiency. PVBs also shut down their less profitable operations abroad during the year (Appendix Table IV.6). | Table IV.19: Operations of Foreign Banks in India | | | Foreign banks operating through branches | Foreign banks having representative offices | | No. of Banks | Branches | | Mar-16 | 46 | 325 | 39 | | Mar-17 | 44 | 295 | 39 | | Mar-18 | 45 | 286 | 40 | | Mar-19 | 45# | 299* | 37 | | Mar-20 | 46# | 308* | 37 | | Mar-21 | 45# | 874* | 36 | Notes: 1. #: Includes two foreign banks, namely SBM Bank (India) Limited and DBS Bank India Limited which are operating through Wholly Owned Subsidiary (WOS) mode.
2. *: Includes branches of SBM Bank (India) Limited and DBS Bank India Limited (including branches of amalgamated entity i.e. Lakshmi Vilas Bank as on March 2021) operating through WOS mode
Source: RBI. | 10. Payment Systems and Scheduled Commercial Banks IV.65 The payment systems landscape in India is undergoing transformation due to rapid technological advancements and innovations, complemented by supportive regulatory policies. The Reserve Bank’s Payment and Settlement Systems: Vision 2019-2021 envisaged payment systems that are not just safe and secure, but are also efficient, fast and affordable. In addition, there has been a greater thrust by the government for rapid adoption of digital payment services by all segments of the society. IV.66 Digital modes of payments have grown by leaps and bounds over the last few years. As a result, conventional paper-based instruments such as cheques and demand drafts now constitute a negligible share (Chart IV.34). IV.67 The growth in volume of total payments decelerated to 26.7 per cent during 2020-21 from 43.7 per cent a year ago. In terms of value, total payments contracted for the second consecutive year, mainly due to decline in value of transactions via RTGS and paper-based instruments (Table IV.20). 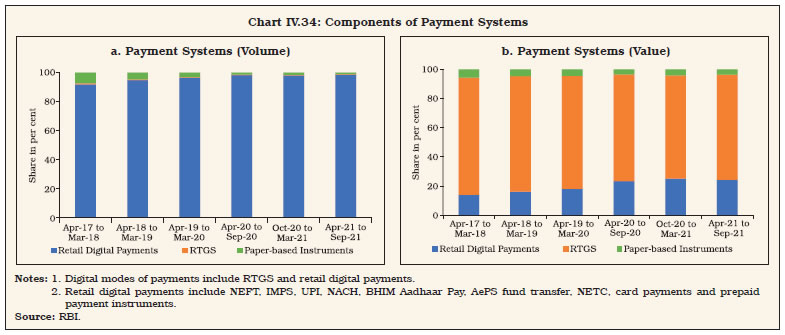
| Table IV.20: Payment Systems Indicators | | Item | Volume (Lakh) | Value (₹ Crore) | | 2018-19 | 2019-20 | 2020-21 | 2018-19 | 2019-20 | 2020-21 | | 1. Large Value Credit Transfers – RTGS | 1,366 | 1,507 | 1,592 | 13,56,88,187 | 13,11,56,475 | 10,55,99,849 | | 2. Credit Transfers | 1,18,481 | 2,06,297 | 3,17,868 | 2,60,90,471 | 2,85,56,593 | 3,35,04,226 | | 2.1 AePS (Fund Transfers) | 11 | 10 | 11 | 501 | 469 | 623 | | 2.2 APBS | 14,949 | 16,747 | 14,373 | 86,226 | 99,048 | 1,11,001 | | 2.3 ECS Cr | 54 | 18 | - | 13,235 | 5,146 | - | | 2.4 IMPS | 17,529 | 25,792 | 32,783 | 15,90,257 | 23,37,541 | 29,41,500 | | 2.5 NACH Cr | 8,834 | 11,100 | 16,465 | 7,29,673 | 10,37,079 | 12,16,535 | | 2.6 NEFT | 23,189 | 27,445 | 30,928 | 2,27,93,608 | 2,29,45,580 | 2,51,30,910 | | 2.7 UPI | 53,915 | 1,25,186 | 2,23,307 | 8,76,971 | 21,31,730 | 41,03,658 | | 3. Debit Transfers and Direct Debits | 4,914 | 6,027 | 10,457 | 5,24,556 | 6,05,939 | 8,65,520 | | 3.1 BHIM Aadhaar Pay | 68 | 91 | 161 | 815 | 1,303 | 2,580 | | 3.2 ECS Dr | 9 | 1 | - | 1,260 | 39 | - | | 3.3 NACH Dr | 4,830 | 5,842 | 9,646 | 5,22,461 | 6,04,397 | 8,62,027 | | 3.4 NETC (linked to bank account) | 6 | 93 | 650 | 20 | 200 | 913 | | 4. Card Payments | 61,769 | 72,384 | 57,787 | 11,96,888 | 14,34,813 | 12,91,799 | | 4.1 Credit Cards | 17,626 | 21,773 | 17,641 | 6,03,413 | 7,30,894 | 6,30,414 | | 4.2 Debit Cards | 44,143 | 50,611 | 40,146 | 5,93,475 | 7,03,920 | 6,61,385 | | 5. Prepaid Payment Instruments | 46,072 | 53,811 | 49,743 | 2,13,323 | 2,15,558 | 1,97,696 | | 6. Paper-based Instruments | 11,238 | 10,414 | 6,704 | 82,46,065 | 78,24,822 | 56,27,108 | | Total - Retail Payments (2+3+4+5+6) | 2,42,473 | 3,48,933 | 4,42,557 | 3,62,71,304 | 3,86,37,726 | 4,14,86,348 | | Total Digital Payments (1+2+3+4+5) | 2,32,602 | 3,40,026 | 4,37,445 | 16,37,13,425 | 16,19,69,379 | 14,14,59,089 | | Total Payments (1+2+3+4+5+6) | 2,43,839 | 3,50,440 | 4,44,149 | 17,19,59,490 | 16,97,94,201 | 14,70,86,197 | Notes: 1. RTGS system includes customer and inter-bank transactions only.
2. The figures for cards are for transactions at point of sale (POS) terminals only, which include online transactions.
3. Figures in the columns might not add up to the total due to rounding off of numbers.
4. -: nil
Source: RBI. | 10.1 Digital Payments IV.68 In recent years, the Reserve Bank has been encouraging wider adoption of digital modes of payments and strengthening of the required infrastructure. The pandemic provided a fillip to the faster adoption of retail digital payments. 24x7x365 availability of Centralised Payment Systems (CPS) i.e., National Electronic Funds Transfer (NEFT) and Real Time Gross Settlement (RTGS), with effect from December 2019 and December 2020, respectively, reduced risks and enhanced efficiency of the entire payments ecosystem. Subsidies provided through the Payment Infrastructure Development Fund (PIDF), operationalised in January 2021, have helped to develop infrastructure in Tier-3 to Tier-6 centres and north-eastern states and are expected to give a boost, going forward. Granting non-bank Payment System Providers (PSPs)24 direct access to the CPS will widen the reach of digital financial services to all segments of users. IV.69 RTGS, which facilitates high value transactions on real time basis, dominates the digital payments space in value terms. On the other hand, Unified Payments Interface (UPI) from the retail segment has a majority share in transaction volume. The robust growth in transactions using innovative payment systems such as National Electronic Toll Collection (NETC), BHIM Aadhaar Pay and Aadhaar Enabled Payment System (AePS) points to greater acceptability of contactless payments during the year (Table IV.20). To measure the progress of digitisation and assess the deepening and penetration of digital payments, the Reserve Bank launched a composite Digital Payments Index (DPI) in January 2021, comprising five broad parameters (weights indicated in brackets) – (i) payment enablers (25 per cent); (ii) payment infrastructure – demand-side factors (10 per cent); (iii) payment infrastructure – supply-side factors (15 per cent); (iv) payment performance (45 per cent); and (v) consumer centricity (5 per cent). The index is computed semi-annually, with March 2018 as the base period (Chart IV.35). 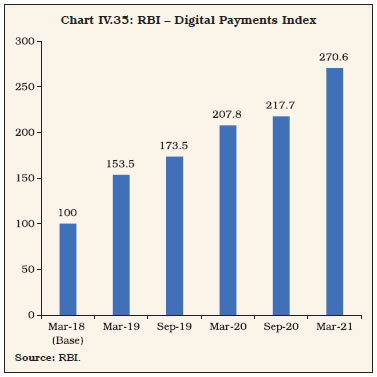 10.2 ATMs IV.70 During 2020-21, the total number of automated teller machines (ATMs) (on-site and off-site) operated by SCBs increased for the second consecutive year after declining in 2018-19. The number of PSB ATMs, however, declined in their pursuit of greater cost efficiency by leveraging network externalities (Table IV.21, Appendix Table IV.7). | Table IV.21: Number of ATMs | | (At end-March) | | Sr. No. | Bank Group | On-Site ATMs | Off-site ATMs | Total Number of ATMs | | 2020 | 2021 | 2020 | 2021 | 2020 | 2021 | | I | PSBs | 80,691 | 78,007 | 57,855 | 59,106 | 1,38,546 | 1,37,113 | | II | PVBs | 30,483 | 34,828 | 38,886 | 37,566 | 69,369 | 72,394 | | III | FBs | 225 | 690 | 678 | 1,135 | 903 | 1,825 | | IV | SFBs* | 1,870 | 2,079 | 56 | 52 | 1,926 | 2,131 | | V | PBs# | 2 | 1 | 14 | 111 | 16 | 112 | | VI | WLAs | - | - | - | - | 23,597 | 25,013 | | VII | All SCBs (I to V) | 1,13,271 | 1,15,605 | 97,489 | 97,970 | 2,10,760 | 2,13,575 | | VIII | Total (VI+VII) | - | - | - | - | 2,34,357 | 2,38,588 | Notes: 1. *: 10 scheduled SFBs as at end-March 2020 and end-March 2021.
2. #: 1 scheduled PB (Paytm Payments Bank) as at end-March 2020 and end-March 2021.
Source: RBI. | IV.71 The densely populated urban and metropolitan areas accounted for a majority—56.3 per cent—share in total SCBs’ ATMs at end March 2021. While ATMs of PSBs were more evenly distributed across geographies, those of other bank-groups were skewed towards urban and metropolitan areas. In contrast, a majority of whi te label ATMs (WLAs) (around 85 per cent) were concentrated in rural and semi-urban areas (Table IV.22). | Table IV.22: Geographical Distribution of ATMs – Bank-Group wise | | (At end-March 2021) | | Sr. No. | Bank Group | Rural | Semi - Urban | Urban | Metro- politan | Total | | 1 | 2 | 3 | 4 | 5 | 6 | 7 | | I | PSBs | 28,255 | 39,349 | 39,725 | 29,784 | 1,37,113 | | | | (20.6) | (28.7) | (29.0) | (21.7) | (100.0) | | II | PVBs | 6,140 | 18,197 | 18,918 | 29,139 | 72,394 | | | | (8.5) | (25.1) | (26.1) | (40.3) | (100.0) | | III | FBs | 96 | 365 | 413 | 951 | 1,825 | | | | (5.3) | (20.0) | (22.6) | (52.1) | (100.0) | | IV | SFBs* | 241 | 665 | 651 | 574 | 2,131 | | | | (11.3) | (31.2) | (30.5) | (26.9) | (100.0) | | V | PBs# | 21 | 28 | 28 | 35 | 112 | | | | (18.8) | (25.0) | (25.0) | (31.3) | (100.0) | | VI | All SCBs (I to V) | 34,753 | 58,604 | 59,735 | 60,483 | 2,13,575 | | | | (16.3) | (27.4) | (28.0) | (28.3) | (100.0) | | VII | All SCBs (y-o-y growth) | 3.0 | 1.3 | 2.2 | -0.4 | 1.3 | | VIII | WLAs | 13,187 | 8,162 | 2,296 | 1,368 | 25,013 | | | | (52.7) | (32.6) | (9.2) | (5.5) | (100.0) | | IX | WLAs (y-o-y growth) | 14.3 | 3.8 | -7.8 | -19.8 | 6.0 | Notes: 1. Figures in parentheses indicate percentage share of total ATMs under each bank group.
2. *: 10 scheduled SFBs as at end-March 2020 and end-March 2021.
3. #: 1scheduled PB (Paytm Payments Bank) as at end-March 2020 and end-March 2021.
Source: RBI. | 11. Consumer Protection IV.72 The Reserve Bank strives to ensure bank customer protection through an efficient and effective grievance redressal mechanism. With the advent of technology-based banking products and growing usage of these products by vulnerable sections of the society, financial literacy, consumer protection and awareness assume critical importance. The launch of the Reserve Bank - Integrated Ombudsman Scheme (RB-IOS) on November 12, 2021 aims at developing a hassle-free grievance redressal mechanism for customers of the entities regulated by the Reserve Bank. The Scheme, while doing away with the jurisdictions of each ombudsman office, covers customer complaints on all areas of ‘deficiency in services’ rendered by the REs and as defined in the Scheme, except those mentioned in the exclusion list. | Table IV.23: Nature of Complaints at BOs | | Categories | 2018-19 | 2019-20 | 2020-21 | | ATM/ Debit Cards | 29,603 | 69,205 | 60,203 | | Mobile / Electronic Banking | 12,051 | 39,627 | 44,385 | | Credit Cards | 13,172 | 26,616 | 40,721 | | Failure to Meet Commitments | 11,948 | 22,758 | 35,999 | | Non-observance of Fair Practice Code | 39,188 | 40,124 | 33,898 | | Levy of Charges without Prior Notice | 7,518 | 17,268 | 20,949 | | Loans and Advances | 6,380 | 14,731 | 20,218 | | Non-adherence to BCSBI Codes | 5,921 | 11,758 | 14,490 | | Deposit Accounts | 8,520 | 10,188 | 8,580 | | Pension Payments | 7,331 | 6,884 | 4,966 | | Remittances | 3,277 | 4,130 | 3,394 | | DSAs and Recovery Agents | 602 | 1,474 | 2,440 | | Para-Banking | 1,127 | 1,134 | 1,236 | | Notes and Coins | 799 | 551 | 332 | | Others | 31,339 | 30,844 | 39,686 | | Out of Purview of BO Scheme | 5,956 | 9,412 | 10,250 | | Total | 1,84,732 | 3,06,704 | 3,41,747 | Note: Data pertain to April to March.
Source: Various offices of Banking Ombudsman. | IV.73 During 2020-21, the number of complaints with Banking Ombudsman (BO) rose at a lower pace relative to the preceding year, with grievances pertaining to ATMs/debit cards, mobile/electronic banking and credit cards contributing 42.5 per cent of the total complaints (Table IV.23). IV.74 The share of complaints emanating from urban and metropolitan areas accounted for more than 73 per cent of the total complaints received during 2020-21. Moreover, the share of complaints from metropolitan customers almost doubled in 2020-21 over 2018-19 levels, while the share of complaints from urban customers reduced significantly during the same period (Chart IV.36a). IV.75 PSBs and PVBs accounted for more than three-fourth of the total complaints received during 2020-21. Almost all pension-related complaints were filed against PSBs, which are the traditional preference of pensioners. On the other hand, a large share of complaints (55 per cent) relating to levy of charges without prior notice were filed against PVBs (Chart IV.36b, Appendix Table IV.8). IV.76 Deposit insurance plays a crucial role in protecting the interests of small depositors and thereby ensuring public confidence in the banking system. The Deposit Insurance and Credit Guarantee Corporation (DICGC) extends deposit insurance to all commercial banks including LABs, PBs, SFBs, RRBs and co-operative banks. By end-March 2021, 98.1 per cent depositors were insurance-protected under the ₹5 lakh cover, with the amount of deposits covered by insurance close to 51 per cent of the total (Table IV.24). 
Table IV.24: Bank Group-wise Insured Deposits
(As at March 31, 2021) | | (Amount in ₹ crore) | | Bank Group | No. of Insured Banks | Total Assessable Deposits (AD)* | Total Insured Deposits (ID)* | ID as percentage of AD | | 1 | 2 | 3 | 4 | 5 | | Public Sector Banks | 12 | 85,23,813 | 47,91,132 | 56.2 | | Private Sector Banks** | 37 | 42,77,955 | 17,01,193 | 39.8 | | Foreign Banks | 45 | 7,06,141 | 47,970 | 6.8 | | Regional Rural Banks | 43 | 4,66,478 | 3,91,451 | 83.9 | | Co-operative Banks | 1,919 | 9,92,491 | 6,88,790 | 69.4 | | Local Area Banks | 2 | 892 | 714 | 80.1 | | Total | 2,058 | 1,49,67,770 | 76,21,251 | 50.9 | Notes: 1. *: Based on deposit base of September 2020 i.e., six months prior to the reference date.
2. **: Data on private sector banks is inclusive of ten small finance banks and six payment banks.
Source: Deposit Insurance and Credit Guarantee Corporation. |
IV.77 The size of the Deposit Insurance Fund (DIF), which is used for settlement of claims of depositors of banks taken into liquidation/amalgamation stood at ₹1,29,904 crore as on March 31, 2021, yielding a reserve ratio of 1.70 per cent from 1.61 per cent a year ago25. Moreover, claims amounting to ₹993 crore were processed and sanctioned during 2020-21, out of which claims amounting to ₹564 crore were in respect of nine co-operative banks. The net outgo of funds towards settlement of claims was, however, lower on account of recovery of ₹569 crore during 2020-21. 12. Financial Inclusion IV.78 Financial inclusion acts as a driver of balanced economic growth. The latest Financial Access Survey (FAS) of the International Monetary Fund (IMF)26 highlights the progress made by India in dealing with the last mile problem of financial inclusion and increasing the popularity of financial products in the previous decade. The Pradhan Mantri Jan Dhan Yojana (PMJDY) and its linkage with Aadhar and mobile phones created the JAM trinity, which was a game changer not only for the welfare schemes under direct benefit transfers (DBTs) but also for financial inclusion. Over the last decade, India has taken long strides in expanding the number of commercial bank branches and deposit accounts, on a scale comparable with other emerging market economies (EMEs), although below levels achieved by advanced economies (AEs) (Chart IV.37a and b). With increase in banking outreach, the number of ATMs per 100,000 adults has also grown, however, penetration remained low in an international comparison (Chart IV.37c). The number of loan accounts with commercial banks per 1,000 adults has also remained lower than country peers (Chart IV.37d). IV.79 The National Strategy for Financial Inclusion 2019-2024 (NSFI) and the National Strategy for Financial Education 2020-2025 (NSFE) was released by the Reserve Bank in January 2020 and August 2020, respectively, which provide a road map for accelerating the process of financial inclusion and promoting financial literacy and consumer protection. The Reserve Bank introduced the Financial Inclusion Index (FI Index) in August 2021 to monitor the progress of policy initiatives to promote financial inclusion (Box IV.4).  IV.80 Two distinct pillars of financial inclusion progress in India are: (a) advancement in digital technology (FinTech); and (b) greater participation of women. Financial inclusion acts as a key facilitator for reducing gender inequality and helps engender women’s economic empowerment. As of December 15, 2021, 24.54 crore bank accounts were opened for women beneficiaries under PMJDY, accounting for 55.6 per cent of the total account holders under the scheme. Over the last decade, the number of loan accounts and outstanding loans of female borrowers grew at a CAGR of 43.2 per cent and 22.7 per cent, as against 29.0 per cent and 16.4 per cent, respectively, for male borrowers. The number of deposit accounts and deposit balances of females also grew at a faster rate than that of males, indicating reduced gender disparity in the usage of formal financial services (Chart IV.38). Women-centric financial products and alternative delivery channels such as women business correspondents (BCs) and women self-help groups (SHGs), helped in this direction. Notwithstanding these developments, further progress needs to be made to achieve greater financial equality and inclusion of women. Box IV.4: Financial Inclusion Index The Financial Inclusion Index (FI Index) released by the Reserve Bank in August 2021 aggregates relevant indicators into a composite index to map the progress of financial inclusion in the country. The index captures the expansion of banking, investments, insurance, postal as well as the pension sector and is responsive to ease of access, availability, extent of usage and quality of services, inequality and deficiency in services, extent of financial literacy and consumer protection in the formal financial system. Similar to the methodology used by the United Nations Development Programme (UNDP) for computation of the Human Development Index (HDI) and Human Poverty Index (HPI), the FI Index is based on three sub-indices (weights indicated in brackets) viz., Access (35 per cent), Usage (45 per cent) and Quality (20 per cent) (Chart 1). Out of a total 97 indicators, 90 are primary indicators and the remaining 7 indicators are inequality measures which are computed as Gini coefficient based on Lorenz curve analysis. Indicators are adjusted for inflation by applying Consumer Price Index (CPI), wherever necessary. As selected indicators are measured in different units, they are normalised before aggregation based on the following formula: where Yi represent the ith indicator and ti the desired goal of the ith indicator. Since the indicators are normalised with respect to complete absence of financial inclusion, there is no base year for the index (i.e., the value of each constituent indicator depends on its own historical progress so far). Consequently, the lowest value of each normalised indicator is ‘0’ and the highest value is ‘100’. The normalised indicators are aggregated on the basis of exogenously determined weights to arrive at a single measure of financial inclusion for each dimension. The calculated dimensions are used to construct three sub-indices which in turn are aggregated to construct the composite FI Index. Data on the index available so far suggest that FI-Access is markedly higher than FI-Usage and FI-Quality. While recognising the progress made in providing financial access, it also highlights the ground that need to be covered for improved usage and quality of financial services (Chart 2). Reference Sharma A.K., Sengupta S., Roy I., & Phukan S. (2021), RBI Bulletin, Vol. LXXV, No. 9, pp 89-95, September 2021. Available at https://www.rbi.org.in/Scripts/BS_ViewBulletin.aspx
|
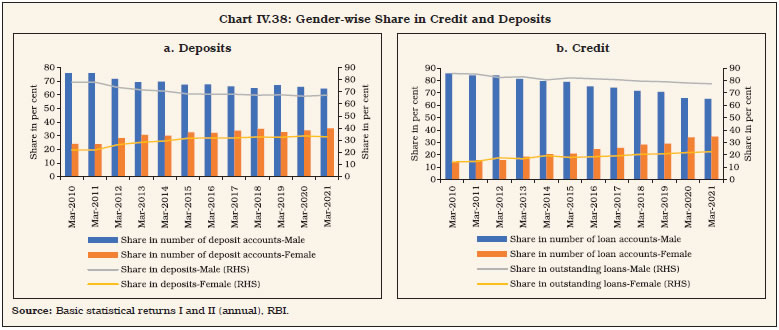 12.1 Financial Inclusion Plans IV.81 Financial Inclusion Plans (FIPs) were introduced by the Reserve Bank in 2010 with the objective of encouraging banks to adopt a planned and structured approach towards financial inclusion. FIP returns submitted by banks show that progress has been made in provisioning of banking services in the rural areas and with time, their usage have also increased. However, the growth of traditional brick and mortar banking branches has remained tepid, while banking services through BCs have gained greater prominence in the last few years. At end-March 2021, BC outlets constituted more than 95 per cent of the total banking outlets in villages, led by the rapid growth in the number of BCs in villages with population more than 2,000. On the usage front, Basic Savings Bank Deposit Accounts (BSBDA) and Information and Communication Technology (ICT) based transactions through BCs witnessed strong growth during 2020-21 (Table IV.25). 12.2 Pradhan Mantri Jan Dhan Yojana IV.82 Since its inception in August 2014, PMJDY has been contributing towards financial inclusion of the unserved and underserved population of the country. Over the span of seven years, the number of total beneficiaries under PMJDY expanded to 44.12 crores, with deposits of ₹1.49 lakh crore deposits as on December 15, 202127. The majority of these accounts are maintained with PSBs and RRBs (97 per cent), with nearly two-thirds of the total accounts operational in rural and semi-urban areas (Chart IV.39a). The usage of these accounts, however, moderated as evident from the marginal decline in average balances for September 2021 across all bank groups (Chart IV.39b). There has been a steady increase in the number of RuPay debit cards issued, driven by both PSBs and RRBs. | Table IV.25: Progress in Financial Inclusion Plan | | Sr. No. | Particulars | End-March 2010 | End-March 2015 | End-March 2019 | End-March 2020 | End-March 2021* | | 1 | Banking Outlets in Villages- Branches | 33,378 | 49,571 | 52,489 | 54,561 | 55,112 | | 2 | Banking Outlets in Villages>2000-BCs | 8,390 | 90,877 | 1,30,687 | 1,49,106 | 8,50,406^ | | 3 | Banking Outlets in Villages<2000-BCs | 25,784 | 4,08,713 | 4,10,442 | 3,92,069 | 3,40,019 | | 4 | Total Banking Outlets in Villages – BCs | 34,174 | 4,99,590 | 5,41,129 | 5,41,175 | 11,90,425^ | | 5 | Banking Outlets in Villages – Other Modes | 142 | 4,552 | 3,537 | 3,481 | 2,542 | | 6 | Banking Outlets in Villages –Total | 67,694 | 5,53,713 | 5,97,155 | 5,99,217 | 12,48,079 | | 7 | Urban Locations Covered Through BCs | 447 | 96,847 | 4,47,170 | 6,35,046 | 4,26,745^ | | 8 | BSBDA - Through Branches (No. in Lakh) | 600 | 2,103 | 2,547 | 2,616 | 2,659 | | 9 | BSBDA - Through Branches (Amt. in Crore) | 4,400 | 36,498 | 87,765 | 95,831 | 1,18,392 | | 10 | BSBDA - Through BCs (No. in Lakh) | 130 | 1,878 | 3,195 | 3,388 | 3,796 | | 11 | BSBDA - Through BCs (Amt. in Crore) | 1,100 | 7,457 | 53,195 | 72,581 | 87,623 | | 12 | BSBDA - Total (No. in Lakh) | 735 | 3,981 | 5,742 | 6,004 | 6,455 | | 13 | BSBDA - Total (Amt. in Crore) | 5,500 | 43,955 | 1,40,960 | 1,68,412 | 2,06,015 | | 14 | OD Facility Availed in BSBDAs (No. in Lakh) | 2 | 76 | 59 | 64 | 60 | | 15 | OD Facility Availed in BSBDAs (Amt. in Crore) | 10 | 1,991 | 443 | 529 | 534 | | 16 | KCC - Total (No. in Lakh) | 240 | 426 | 491 | 475 | 466 | | 17 | KCC - Total (Amt. in Crore) | 1,24,000 | 4,38,229 | 6,68,044 | 6,39,069 | 6,72,624 | | 18 | GCC - Total (No. in Lakh) | 10 | 92 | 120 | 202 | 202 | | 19 | GCC - Total (Amt. in Crore) | 3,500 | 1,30,160 | 1,74,514 | 1,94,048 | 1,55,826 | | 20 | ICT-A/Cs-BC-Total Transactions (No. in Lakh) # | 270 | 4,770 | 21,019 | 32,318 | 47,668 | | 21 | ICT-A/Cs-BC-Total Transactions (Amt. in Crore) # | 700 | 85,980 | 5,91,347 | 8,70,643 | 11,48,237 | Notes: 1. *: Provisional.
2. ^: Significant change in numbers is due to reclassification done by banks.
3. #: Transactions during the year.
Source: FIP returns submitted by banks. |
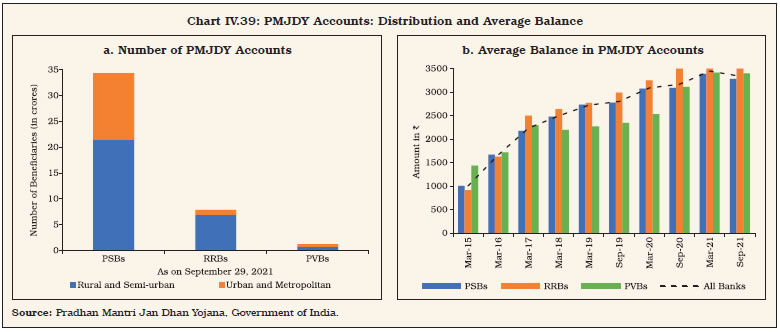 12.3 New Bank Branches by SCBs IV.83 Opening of new bank branches moderated for the second consecutive year, with focus of banks shifting to leveraging the BC model and digitisation of banking operations, enabled by automation and data analytics. During 2020-21, new bank branches opened by SCBs declined by 29.2 per cent, on top of a contraction of 6.0 per cent in the previous year. The decline occurred across all population groups as well as bank groups, except for PSBs which increased their brick-and-mortar banking outreach by 15.8 per cent as compared to a year ago (Chart IV.40). IV.84 Although fewer branches were opened across all tier centres, more than half of the new branches were opened in Tier 1 and Tier 2 centres in 2020-21 (Table IV.26). 12.4 Microfinance Programme IV.85 Microfinance involves extension of small loans and other financial services to low-income individuals or groups who are otherwise deprived of access to formal financial services. Over the years, microfinance programmes have played a significant role in facilitating financial inclusion, particularly among the unbanked and underbanked segments of the population. The Self-Help Group – Bank Linkage Programme (SHG – BLP) promoted by the National Bank for Agriculture and Rural Development (NABARD) has emerged as the world’s largest microfinance programme in terms of number of beneficiaries and micro-credit extended. 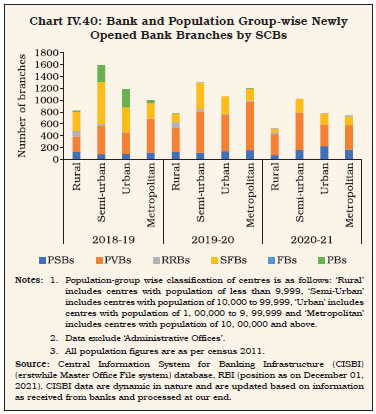
| Table IV.26: Tier-wise Break-up of Newly Opened Bank Branches by SCBs | | Centre | 2017-18 | 2018-19 | 2019-20 | 2020-21 | | Tier 1 | 1694 | 2191 | 2266 | 1520 | | | (40.2) | (47.5) | (52.3) | (49.6) | | Tier 2 | 359 | 520 | 371 | 280 | | | (8.5) | (11.3) | (8.6) | (9.1) | | Tier 3 | 620 | 709 | 568 | 481 | | | (14.7) | (15.4) | (13.1) | (15.7) | | Tier 4 | 374 | 361 | 354 | 262 | | | (8.9) | (7.8) | (8.2) | (8.5) | | Tier 5 | 472 | 373 | 282 | 177 | | | (11.2) | (8.1) | (6.5) | (5.8) | | Tier 6 | 693 | 454 | 492 | 346 | | | (16.5) | (9.9) | (11.4) | (11.3) | | Total | 4212 | 4608 | 4333 | 3066 | | | (100.0) | (100.0) | (100.0) | (100.0) | Notes: 1. Tier-wise classification of centres is as follows: ‘Tier 1’ includes centres with population of 1, 00,000 and above, ‘Tier 2’ includes centres with population of 50,000 to 99,999, ‘Tier 3’ includes centres with population of 20,000 to 49,999, ‘Tier 4’ includes centres with population of 10,000 to 19,999, ‘Tier 5’ includes centres with population of 5,000 to 9,999, and ‘Tier 6’ includes centres with population of less than 5000.
2. Data exclude ‘Administrative Offices’.
3. All population figures are as per census 2011.
4. Figures in the parentheses represent proportion of the branches opened in a particular area vis-à-vis the total.
Source: CISBI (erstwhile Master Office File system) database, RBI (position as on December 01, 2021). CISBI data are dynamic in nature and are updated based on information as received from banks and processed at our end. | IV.86 At end-March 2021, while SHGs’ savings with banks increased by 43.3 per cent, their loans outstanding with banks declined by 4.4 per cent in relation to end-March 2020 levels. Loans disbursed during 2020-21 declined by 25.2 per cent in comparison to a growth of 33.2 per cent a year ago. Micro-credit disbursements to Joint Liability Groups (JLGs) and microfinance institutions also contracted by 30 per cent and 37 per cent, respectively, attributable to subdued economic activity on account of nation-wide lockdowns due to the pandemic (Appendix Table IV.13). IV.87 On an average, the amount of savings per SHG augmented by 30.8 per cent from ₹25,531 in 2019-20 to ₹33,392 in 2020-21, whereas the credit outstanding per SHG has decreased by 5.8 per cent from ₹1.90 lakh to ₹1.79 lakh during the same period (Chart IV.41). The NPA ratio of SHGs continued to improve, however, from 5.2 per cent in 2018-19 (4.9 per cent in 2019-20) to 4.7 per cent in 2020-2128. 12.5 Credit to Micro, Small and Medium Enterprises IV.88 The number of MSME accounts decelerated for all SCBs during 2020-21, primarily driven by PVBs and FBs. The share of PSBs in total MSME credit outstanding has witnessed a secular decline since 2017-18, with corresponding increase in the share of PVBs. The average amount of credit disbursed by PVBs, however, was much lower than that by PSBs (Table IV.27). 12.6 Trade Receivables Discounting System IV.89 The Trade Receivables Discounting System (TReDS) was launched by the Reserve Bank in 2017 to facilitate financial inclusion of MSMEs. It is an electronic platform for financing/discounting trade receivables of MSMEs due from large corporates, PSUs and government departments with banks/NBFCs through a competitive auction process. Over the last four years, there has been noteworthy growth in the financing of trade receivables of MSMEs through the TReDS platform. During 2020-21, the number of invoices uploaded and financed through the platform grew by more than 62 per cent, with the success rate29 improving to 91.3 per cent from 90.2 per cent in the previous year (Table IV.28). Going forward, with the central government permitting non-factor NBFCs and other entities to offer factoring services, credit supply to MSMEs through the platform is expected to increase further. Onboarding of more public sector enterprises on the TReDS can make a material difference in making the scheme more effective. | Table IV.27: Credit Flow to the MSME Sector by SCBs | | (Number of accounts in lakh, amount outstanding in ₹ crore) | | Bank Groups | Items | 2017-18 | 2018-19 | 2019-20 | 2020-21 | | PSBs | No. of accounts | 111.01 | 112.96 | 110.82 | 150.77 | | | (-0.86) | (1.76) | (-1.89) | (36.05) | | Amount Outstanding | 8,64,597.79 | 8,80,032.90
| 8,93,314.83
| 9,08,659.06 | | | (4.30) | (1.79) | (1.51) | (1.72) | | PVBs | No. of accounts | 148.33 | 205.30 | 270.62 | 266.81 | | | (24.03) | (38.41) | (31.82) | (-1.41) | | Amount Outstanding | 4,10,760.21 | 5,63,678.47 | 6,46,988.27 | 7,92,041.95 | | | (-4.69) | (37.23) | (14.78) | (22.42) | | FBs | No. of accounts | 2.20 | 2.40 | 2.74 | 2.60 | | | (6.28) | (9.09) | (14.17) | (-5.11) | | Amount Outstanding | 48,881.34 | 66,939.13 | 73,279.06 | 83,223.79 | | | (33.91) | (36.94) | (9.47) | (13.57) | | All SCBs | No. of accounts | 261.54 | 320.68 | 384.18 | 420.19 | | | (11.95) | (22.61) | (19.80) | (9.37) | | Amount Outstanding | 13,24,239.35 | 15,10,650.52 | 6,13,582.17 | 17,83,924.80 | | | (2.15) | (14.08) | (6.81) | (10.56) | Note: Figures in the parentheses indicate y-o-y growth rates.
Source: Financial Inclusion and Development Department, RBI. |
| Table IV.28: Progress in MSME Financing through TReDS | | (Invoices in number, amount in ₹ crore) | | Financial Year | Invoices Uploaded | Invoices Financed | | Invoices | Amount | Invoices | Amount | | 2017-18 | 22,704 | 1,094.82 | 19,890 | 814.54 | | 2018-19 | 2,51,695 | 6,699.57 | 2,32,098 | 5,854.48 | | 2019-20 | 5,30,077 | 13,088.27 | 4,77,969 | 11,165.86 | | 2020-21 | 8,61,560 | 19,669.84 | 7,86,555 | 17,080.14 | | Source: RBI. | 12.7 Regional Banking Penetration IV.90 Notwithstanding concerted efforts to improve banking penetration across geographies, banking outreach at the sub-national level remains tilted towards western, southern and northern regions in terms of shares in credit, deposits and number of branches (Chart IV.42a). Accordingly, the average population served per bank branch remains significantly higher in eastern, central and north-eastern regions relative to other parts of the country (Chart IV.42b). 13. Regional Rural Banks IV.91 Combining the reach, familiarity and rural orientation of credit co-operatives and professionalism of commercial banks, regional rural banks (RRBs) attend to the basic banking and credit needs of small farmers, agricultural labourers, artisans and other rural poor. RRBs are jointly owned by the Government of India, the concerned State Government, and the sponsoring commercial bank. The ownership pattern espouses the spirit of co-operative federalism and aspires to achieve the goal of last mile financial inclusion. IV.92 The number of RRBs reduced from 45 to 43 during 2020-21, due to amalgamation of 3 RRBs in Uttar Pradesh as a part of the third phase of their consolidation programme. Amalgamation drives in RRBs have helped boost their profitability and improved their asset quality while strengthening their capital base (Box IV.5). Box IV.5: Impact of Amalgamation of Regional Rural Banks Since their inception in 1975, RRBs remained unprofitable for nearly two decades, constrained by limited operational flexibility, inadequate scope for expansion or diversification and small ticket but high-risk lending profiles. In 1994-95 the government initiated reforms which, coupled with capital infusion, helped them turn profitable. However, at end-March 2005, 42 per cent of the RRBs still carried legacy losses. In order to improve their operational viability and to take advantage of economies of scale, the government initiated a consolidation programme in 2005-0630. In the first phase (2005-2010), RRBs belonging to the same sponsor bank within a state were amalgamated; in the second phase (2012-2014), RRBs across sponsor banks within a state were amalgamated. The third phase of amalgamation was initiated in 2018-19 on the principle of ‘One state - One RRB’ in smaller states and reduction in the number of RRBs in larger states. As a result, the number of RRBs reduced from 196 in 2005 to 43 at end-March 2021, while the number of standalone RRBs that have never undergone any amalgamation since their inception came down to 9. Impact on Profitability: The share of profitable and sustainably viable31 RRBs improved continuously during the first two phases of amalgamation32 (Chart 1). The quantum of accumulated losses as a percentage of total assets declined throughout the two phases. RoA increased steeply during the first phase but declined after 2009-10 due to withdrawal of income tax concessions given to them and greater recognition of asset quality.
Impact on Capital Position: Improved profitability of RRBs post amalgamation, coupled with capital infusion in weak banks, boosted their leverage ratio, as well as the reserves to capital ratio33 (Chart 2). The percentage of RRBs requiring recapitalisation to achieve regulatory norm of 9 per cent CRAR decreased in the post amalgamation phases. Impact on Asset Quality: RRBs have historically had higher GNPA ratio than SCBs. Since the beginning of the amalgamation process, the difference between the two has decreased, partly reflecting increased professionalism and efficiencies of scale amongst RRBs. Post the AQR, while the GNPAs of both SCBs and RRBs increased, the increase in the latter was less sharp than in the former. This asset quality deterioration of RRBs was due to more transparent recognition of NPAs that were concentrated in economically aspirational regions (Chart 3). Impact on Business Parameters: The average growth rate in key business parameters viz., credit and deposits peaked during the first phase of amalgamation. While the C-D ratio consistently improved even subsequently, growth in credit and deposits was less sanguine. After the second phase of amalgamation, the C-D ratio reached a trough in 2016-17 due to sharp increase in deposits post demonetisation (Chart 4).
An additional benefit of the amalgamation drive was a renewed focus on priority sector lending. The share of PSL in gross loans and advances increased from an average of 76 per cent during the pre-amalgamation phase to 88 per cent after the second phase of amalgamation. The third phase of the consolidation programme is expected to further improve profitability, capital positions and asset quality of RRBs.
| 13.1 Balance Sheet Analysis IV.93 During 2020-21, ₹400 crores (of which Central Government’s share was ₹200 crore) was sanctioned towards recapitalisation of 7 RRBs which had CRAR less than 9 per cent. A few RRBs also received state governments’ share of recapitalisation sanctioned during the previous financial year. Catalysed by capital infusion and bolstered by growth in borrowings and deposits, the liabilities of RRBs grew robustly during 2020-21. Borrowings were mainly from NABARD, aided by the Special Liquidity Facility (SLF) and relaxations in eligibility criteria for availing refinance. IV.94 The availability of funds helped RRBs sustain their credit growth at rates higher than SCBs, as also their own 5-year average growth rate of 10.5 per cent. As a result, the C-D ratio of RRBs improved to 63.6 per cent at end-March 2021 from 62.2 per cent at end-March 2020. During 2020-21, the prevalence of excess liquidity also prompted RRBs to park more funds with the Reserve Bank (Table IV.29). IV.95 Priority sector lending with a focus on agriculture is the mainstay of RRBs’ operations. | Table IV.29: Consolidated Balance Sheet of Regional Rural Banks | | (Amount in ₹ Crore) | | Sr. No. | Item | At end-March | Y-o-Y Growth in Percent | | 2020 | 2021P | 2019-20 | 2020-21 | | 1 | 2 | 3 | 4 | 5 | 6 | | 1 | Share Capital | 7,849 | 8,393 | 16.5 | 6.9 | | 2 | Reserves | 26,814 | 30,348 | 5.6 | 13.2 | | 3 | Deposits | 4,78,737 | 5,25,226 | 10.2 | 9.7 | | | 3.1 Current | 10,750 | 11,499 | -3.4 | 7.0 | | | 3.2 Savings | 2,44,414 | 2,71,516 | 9.1 | 11.1 | | | 3.3 Term | 2,23,573 | 2,42,211 | 12.2 | 8.3 | | 4 | Borrowings | 54,393 | 67,864 | 1.6 | 24.8 | | | 4.1 from NABARD | 46,120 | 61,588 | -1.6 | 33.5 | | | 4.2 Sponsor Bank | 4,519 | 3,444 | 20.6 | -23.8 | | | 4.3 Others | 3,754 | 2,832 | 28.7 | -24.6 | | 5 | Other Liabilities | 20,227 | 19,754 | 13.2 | -2.3 | | | Total liabilities/Assets | 5,88,021 | 6,51,585 | 9.3 | 10.8 | | 6 | Cash in Hand | 2,860 | 2,954 | -1.8 | 3.3 | | 7 | Balances with RBI | 16,744 | 18,947 | -6.4 | 13.2 | | 8 | Balances in current account | 7,613 | 5,987 | 39.2 | -21.4 | | 9 | Investments | 2,50,859 | 2,75,658 | 10.9 | 9.9 | | 10 | Loans and Advances (net) | 2,80,220 | 3,15,181 | 7.0 | 12.5 | | 11 | Fixed Assets | 1,235 | 1,229 | -3.0 | -0.5 | | 12 | Other Assets # | 28,490 | 31,629 | 27.7 | 11.0 | | | 12.1 Accumulated Losses | 6,467 | 8,264 | 124.0 | 27.8 | Note: 1. #: Includes accumulated losses
2. P Provisional.
3. Totals may not tally on account of rounding off of figures in ₹ crore. Percentage variations could be slightly different as absolute numbers have been rounded off to ₹ crore.
Source: NABARD. |
Table IV.30: Purpose-wise Outstanding Advances by RRBs
(At end-March) | | (Amount in ₹ Crore) | | Sr. No. | Purpose | 2020 | 2021P | | 1 | 2 | 3 | 4 | | I | Priority (i to v) | 2,70,182 | 3,00,962 | | | Per cent of total loans outstanding | 90.6 | 90.1 | | | i Agriculture | 2,08,762 | 2,33,145 | | | ii Micro small and medium enterprises | 35,240 | 39,543 | | | iii Education | 2,358 | 2,132 | | | vi Housing | 19,814 | 21,127 | | | v Others | 4,008 | 5,016 | | II | Non-priority (i to vi) | 28,032 | 33,209 | | | Per cent of total loans outstanding | 9.4 | 9.9 | | | i Agriculture | 9 | 29 | | | ii Micro small and medium enterprises | 495 | 434 | | | iii Education | 74 | 92 | | | iv Housing | 3,538 | 4,347 | | | v Personal Loans | 7,069 | 8,311 | | | vi Others | 16,847 | 19,996 | | | Total (I+II) | 2,98,214 | 3,34,171 | Notes: 1. P: Provisional
2. Totals may not tally on account of rounding off of figures in ₹ crore.
Source: NABARD. | During 2020-21, agricultural lending constituted 70 per cent of total loans and advances of RRBs (Table IV.30). Even though their total asset size was only 3.3 per cent of that of SCBs, their loans to the sector were 16.8 per cent of the SCBs’ advances. With all except 3 RRBs lending more than 75 per cent of the previous year’s ANBC to the priority sector, they overachieved their target by 17 per cent in 2020-21 (Appendix Table IV.15). 13.2 Performance of RRBs IV.96 During 2020-21, RRBs, as a whole, turned around from losses in the preceding two years and reported net profit despite a moderation in their interest income as their interest expenses contracted (Table IV.31). Moreover, RRBs effectively utilised their high priority sector lending portfolio (particularly agriculture) to augment their income through sale of PSLCs. | Table IV.31: Financial Performance of Regional Rural Banks | | (Amount in ₹ Crore) | | Sr. No. | Item | Amount | Y-o-Y Change in per cent | | 2019-20 | 2020-21P | 2019-20 | 2020-21 | | 1 | 2 | 3 | 4 | 5 | 6 | | A | Income (i + ii) | 49,452 | 53,858 | 15.0 | 8.9 | | | i Interest income | 43,698 | 46,803 | 12.2 | 7.1 | | | ii Other income | 5,754 | 7,055 | 41.8 | 22.6 | | B | Expenditure (i+ii+iii) | 51,660 | 52,176 | 18.4 | 1.0 | | | i Interest expended | 25,985 | 25,588 | 9.6 | -1.5 | | | ii Operating expenses | 20,076 | 19,768 | 45.4 | -1.5 | | | of which, Wage bill | 14,654 | 15,101 | 56.2 | 3.0 | | | iii Provisions and contingencies | 5,599 | 6,819 | -8.5 | 21.8 | | | of which, Income Tax | 931 | 1,279 | 12.3 | 37.5 | | C | Profit | | | | | | | i Operating profit | 2,972 | 8,304 | -45.6 | 179.5 | | | ii Net profit | -2,208 | 1,682 | - | | | D | Total Average Assets | 5,55,660 | 6,17,305 | 7.2 | 11.1 | | E | Financial ratios # | | | | | | | i Operating profit | 0.5 | 1.3 | | | | | ii Net profit | -0.4 | 0.3 | | | | | iii Income (a + b) | 8.9 | 8.7 | | | | | (a) Interest income | 7.9 | 7.6 | | | | | (b) Other income | 1.0 | 1.1 | | | | | iv Expenditure (a+b+c) | 9.3 | 8.5 | | | | | (a) Interest expended | 4.7 | 4.1 | | | | | (b) Operating expenses | 3.6 | 3.2 | | | | | of which, Wage bill | 2.6 | 2.4 | | | | | (c) Provisions and contingencies | 1.0 | 1.1 | | | | F | Analytical Ratios (%) | | | | | | | Gross NPA Ratio | 10.4 | 9.4 | | | | | CRAR | 10.3 | 10.2 | | | Notes: 1. P- Provisional
2. # Financial ratios are percentages with respect to average total assets.
3. Totals may not tally and percentage variations could be slightly different on account of rounding off of figures in ₹ crore.
4. Provisions & Contingencies include Provision for Income Tax/ Income Tax paid.
Source: NABARD. | During 2020-21, the total volume of PSLCs traded by RRBs grew by 26 per cent and they accounted for 33 per cent of the total volume of PSLCs traded by all banks. IV.97 During 2020-21, even as 30 of the 43 RRBs posted net profit (Appendix Table IV.14), 17 RRBs carried accumulated losses of ₹8,264 crore as at end-March 2021, and 16 of them had CRARs less than the regulatory minimum of 9 per cent. IV.98 In the budget estimates for 2021-22, the Central Government allocated ₹1,200 crore for recapitalisation of RRBs, which is expected to further strengthen their capital buffers and help enhance their credit disbursement to the rural poor. IV.99 According to the Fraud Vulnerability Index (VINFRA) that measures adherence to fraud management guidelines, out of the 42 RRBs (for which data are available for 2020-21), 41 RRBs were categorised as Grade A, indicating least vulnerability. However, being a self-assessment tool, the gradation does not completely preclude the vulnerability of a bank against fraud. On the other hand, the Vulnerability Index for Cyber Security Framework (VICS), which is also a self-assessment tool, during 2020-21, indicated 21 out of the 43 RRBs were categorised as Grade A, while 6 RRBs fell under Grade C, reflecting the need for strengthening their cyber security framework (CSF). 14. Local Area Banks IV.100 Local Area Banks (LABs) were set up as private limited companies with the objective of enabling local institutions to mobilise rural savings and strengthen institutional credit mechanisms in local areas (up to three contiguous district towns). During 2020-21, the Reserve Bank cancelled the banking licence issued to Subhadra Local Area Bank Ltd., Kolhapur, Maharashtra and consequently, the number of LABs operational in the country reduced to two, accounting for a mere 0.006 per cent of the total assets of SCBs as at end-March 2021. IV.101 The consolidated balance sheet of LABs expanded during 2020-21. However, the credit–deposit ratio remained unchanged at around 81 per cent (Table IV.32). Table IV.32: Profile of Local Area Banks
(At end-March) | | (Amount in ₹ crore) | | | 2019-20 | 2020-21 | | 1. Assets | 1026.0 | 1170.8 | | | (10.8) | (14.1) | | 2. Deposits | 813.8 | 952.5 | | | (9.0) | (17.0) | | 3. Gross Advances | 660.5 | 769.2 | | | (18.0) | (16.5) | Notes: Figures in parenthesis represent y-o-y growth in per cent.
Source: Off-site returns, global operations, RBI. | 14.1 Financial Performance of LABs IV.102 The profitability of LABs improved during 2020-21 as the contraction in operating expenses, especially the wage bill, outweighed that in non-interest income, which resulted in boosting profitability ratios (Table IV.33). Table IV.33: Financial Performance of Local Area Banks
(At end-March) | | | Amount (in ₹ crore) | Y-o-Y growth (in per cent) | | 2020 | 2021 | 2019-20 | 2020-21 | | 1. Income (i+ii) | 135 | 148 | 14.9 | 9.5 | | i. Interest income | 107 | 123 | 10.6 | 14.8 | | ii. Other income | 28 | 25 | 35.0 | -10.4 | | 2. Expenditure (i+ii+iii) | 121 | 122 | 13.9 | 0.2 | | i. Interest expended | 52 | 55 | 14.8 | 6.5 | | ii. Provisions and contingencies | 13 | 20 | 53.8 | 47.1 | | iii. Operating expenses | 56 | 47 | 6.7 | -16.7 | | of which, wage bill | 26 | 22 | 8.1 | -15.9 | | 3. Profit | | | | | | i. Operating profit/loss | 27 | 46 | 37.3 | 69.7 | | ii. Net profit/loss | 14 | 27 | 24.6 | 91.3 | | 4. Net Interest Income | 55 | 68 | 6.9 | 22.7 | | 5. Total Assets | 1026 | 1171 | 10.8 | 14.1 | | 6. Financial Ratios @ | | | | | | i. Operating Profit | 2.7 | 3.9 | | | | ii. Net Profit | 1.4 | 2.3 | | | | iii. Income | 13.2 | 12.7 | | | | iv. Interest Income | 10.4 | 10.5 | | | | v. Other Income | 2.8 | 2.2 | | | | vi. Expenditure | 11.8 | 10.4 | | | | vii. Interest Expended | 5.0 | 4.7 | | | | viii. Operating Expenses | 5.5 | 4.0 | | | | ix. Wage Bill | 2.6 | 1.9 | | | | x. Provisions and contingencies | 1.3 | 1.7 | | | | xi. Net Interest Income | 5.4 | 5.8 | | | Notes: 1. Financial ratios for 2019-20 and 2020-21 are calculated based on the asset of current year only.
2. ‘Wage Bill’ is taken as payments to and provisions for employees.
3. @: Ratios as per cent of average assets of last two years.
Source: Off-site returns, global operations, RBI. | 15. Small Finance Banks IV.103 Small finance banks (SFBs), set up in 2016, provide a savings vehicle for underserved sections of the population and also meet credit needs of small borrowers, through high technology low-cost operations. These banks are expected to deploy 75 per cent of their ANBC in priority sectors, with at least 50 per cent below ₹25 lakh. As of November 2021, twelve SFBs were operational in the country, including recently licenced Shivalik Small Finance Bank Ltd. and Unity Small Finance Bank Ltd. 15.1 Balance Sheet of SFBs IV.104 Since their inception, the consolidated balance sheet of SFBs has been growing at a pace higher than that of SCBs, mainly reflecting inorganic growth in their operations. During 2020-21, this was aided by higher deposits on the liabilities side. With SFBs offering lucrative interest rates on savings accounts, the share of CASA in their total deposits increased to 23.9 per cent in 2020-21, from 15.4 per cent in 2019-20. On the assets side, growth was supported by higher accretion to investments. Although loans and advances was the dominant constituent—with share of more than 66 per cent of total assets—their growth decelerated, reflecting the overall system wide anaemic credit growth (Table IV.34). 15.2 Priority Sector Lending of SFBs IV.105 The share of SFBs’ PSL in total lending declined for the fourth consecutive year during 2020-21, with the non-priority sector accounting for more than 28 per cent of total loans as at end-March 2021. Within the priority sector, micro, small and medium enterprises remained the main focus of SFBs’ lending, although their share declined (Table IV.35). Table IV.34: Consolidated Balance Sheet of Small Finance Bank
(At end-March) | | (Amount in ₹ crore) | | Sr. No. | | 2020 | 2021 | Y-o-Y growth (in per cent) 2020-21 | | 1 | Share Capital | 5,150.9 | 5,375.4 | 4.4 | | 2 | Reserves & Surplus | 11,046.9 | 14,800.3 | 34.0 | | 3 | Tier II Bonds | 3,795.4 | 2,468.0 | -35.0 | | 4 | Deposits | 82,487.8 | 1,09,472.5 | 32.7 | | | 4.1 Current Demand Deposits | 2,381.2 | 3,964.2 | 66.5 | | | 4.2 Savings | 10,283.5 | 22,198.3 | 115.9 | | | 4.3 Term | 69,823.0 | 83,310.0 | 19.3 | | 5 | Borrowings (Including Tier II Bonds) | 30,004.2 | 27,828.2 | -7.3 | | | 5.1 Bank | 3,783.8 | 1,366.4 | -63.9 | | | 5.2 Others | 26,220.5 | 26,461.8 | 0.9 | | 6 | Other Liabilities & provisions | 4,078.4 | 6,076.3 | 49.0 | | | Total liabilities/Assets | 1,32,768.2 | 1,63,552.5 | 23.2 | | 7 | Cash in Hand | 975.9 | 1,052.2 | 7.8 | | 8 | Balances with RBI | 4,082.4 | 5,869.2 | 43.8 | | 9 | Other Bank Balances/Balances with Financial Institutions | 8,700.9 | 12,309.1 | 41.5 | | 10 | Investments | 24,203.1 | 30,659.8 | 26.7 | | 11 | Loans and Advances | 90,576.1 | 1,08,612.6 | 19.9 | | 12 | Fixed Assets | 1,649.3 | 1,676.3 | 1.6 | | 13 | Other Assets | 2,580.4 | 3,373.2 | 30.7 | Note: Data pertain to ten SFBs operational as at end March 2021.
Source: Off-site returns (domestic operations), RBI. | 15.3 Financial Performance of SFBs IV.106 Despite the significant acceleration in operating profits during 2020-21, net profits of SFBs grew moderately on higher provisioning for bad and restructured loans. The GNPA ratio nearly tripled, reflecting the impact of COVID-19 on asset quality. There was improvement in capital positions (CRARs) on the back of high-quality Tier-1 capital (Table IV.36). Table IV.35: Purpose-wise Outstanding Advances by Small Finance Banks
(Share in total advances) | | Purpose | 31-Mar-20 | 31-Mar-21 | | I Priority (i to v) | 76.0 | 71.8 | | Per cent to total loans outstanding | | | | i. Agriculture and allied activities | 22.1 | 21.8 | | ii. Micro small and medium enterprises | 34.4 | 25.9 | | iii. Education | 0.1 | 0.1 | | iv. Housing | 3.8 | 4.3 | | v. Others | 15.7 | 19.7 | | II Non-priority (i to vi) | 24.0 | 28.2 | | Total (I+II) | 100.0 | 100.0 | | Source: Off-site returns (domestic operations), RBI. |
Table IV.36: Financial Performance of Small Finance Banks
(At end-March) | | Sr. No. | Item | 2020 | 2021 | Y-o-Y growth (in per cent) 2020-21 | | 1 | 2 | 3 | 4 | 5 | | A | Income (i + ii) | 19,219.1 | 22,499.9 | 17.1 | | | i Interest Income | 16,947.9 | 19,523.4 | 15.2 | | | ii Other Income | 2,271.2 | 2,976.4 | 31.1 | | B | Expenditure (i+ii+iii) | 17,251.1 | 20,462.2 | 18.6 | | | i Interest Expended | 7,927.7 | 9,122.2 | 15.1 | | | ii Operating Expenses | 7,152.0 | 7,549.0 | 5.6 | | | of which, Staff Expenses | 3,811.2 | 4,301.8 | 12.9 | | | iii Provisions and contingencies | 2,171.5 | 3,791.0 | 74.6 | | C | Profit (Before Tax) | 2,678.6 | 2,580.9 | -3.6 | | | i Operating Profit (EBPT) | 4,141.4 | 5,828.7 | 40.7 | | | ii Net Profit (PAT) | 1,969.9 | 2,037.7 | 3.4 | | D | Total Assets | 1,32,768.2 | 1,63,552.5 | 23.2 | | E | Financial Ratios # | | | | | | i Operating Profit | 3.1 | 3.6 | | | | ii Net Profit | 1.5 | 1.2 | | | | iii Income (a + b) | 14.5 | 13.8 | | | | a. Interest Income | 12.8 | 11.9 | | | | b. Other Income | 1.7 | 1.8 | | | | iv Expenditure (a+b+c) | 13.0 | 12.5 | | | | a. Interest Expended | 6.0 | 5.6 | | | | b. Operating Expenses | 5.4 | 4.6 | | | | of which Staff Expenses | 2.9 | 2.6 | | | | c. Provisions and contingencies | 1.6 | 2.3 | | | F | Analytical Ratios (%) | | | | | | Gross NPA Ratio | 1.9 | 5.4 | | | | CRAR | 20.2 | 22.1 | | | | Core CRAR | 17.2 | 20.1 | | Note: # As per cent to total assets.
Source: Off-site returns (domestic operations), RBI. | 16. Payments Banks IV.107 Payments banks (PBs) were set up as differentiated banks that harness technology to further financial inclusion by providing low-cost banking solutions to small businesses, low-income households and other entities in the unorganised sector. By end-March 2021, six PBs were operational in the country. Unlike commercial banks, PBs are not permitted to undertake lending activities, with restrictions on deposit balances per customer. The Reserve Bank’s April 2021 move to enhance the limit of the maximum deposit balance per customer from ₹1 lakh to ₹2 lakh is expected to grant banks more flexibility in their operations. 16.1 Balance Sheet of PBs IV.108 In contrast to the flat growth in the SCBs’ balance sheet, that of PBs expanded by 48.9 per cent in 2020-21, on top of a growth of 17.5 per cent in 2019-20. The acceleration was led by deposits growth on the liabilities side and investments on the assets side (Table IV.37). The share of deposits in total liabilities increased to 36.8 per cent from 27.4 per cent a year ago and the recent enhancement in deposit balance limit is expected to further expand their deposit base. | Table IV.37: Consolidated Balance Sheet of Payments Banks | | (Amount in ₹ crore) | | Sr. No. | Item | March-19 | March-20 | March-21 | | 1. | Total Capital and Reserves | 1,899 | 1,868 | 1,792 | | 2. | Deposits | 882 | 2,306 | 4,622 | | 3. | Other Liabilities and Provisions | 4,392 | 4,254 | 6,133 | | | Total Liabilities/Assets | 7,172 | 8,429 | 12,547 | | 1. | Cash and Balances with RBI | 712 | 785 | 1,255 | | 2. | Balances with Banks and Money Market | 1,375 | 2,101 | 2,413 | | 3. | Investments | 3,136 | 4,077 | 7,102 | | 4. | Fixed Assets | 638 | 351 | 355 | | 5. | Other Assets | 1,311 | 1,115 | 1,421 | Note: Data for end-March 2019, end-March 2020 and end-March 2021 pertain to seven, six and six PBs, respectively. Hence, the data are not comparable across years.
Source: Off-site returns (domestic operations), RBI. | 16.2 Financial Performance of PBs IV.109 PBs are still in a nascent stage of development, incurring extensive investment costs for developing basic infrastructure. Moreover, their customer base is yet to develop fully, making break-even challenging. As a result, since inception, they have been suffering losses. The same trend held in 2020-21, despite improvement in their non-interest income (Table IV.38). IV.110 During 2020-21, efficiency of PBs measured in terms of cost-to-income ratio improved while their NIM declined. Their other performance metrics such as profit margin, RoA, and operating profit to working funds ratio remained negative, although the extent of losses reduced (Table IV.39). | Table IV.38: Financial Performance of Payments Banks | | (Amount in ₹ crore) | | Sr. No. | Item | March-19 | March-20 | March-21 | | A | Income (i + ii) | | | | | | i. Interest Income | 291 | 348 | 360 | | | ii. Non-Interest Income | 2,099 | 3,115 | 3,562 | | B | Expenditure | | | | | | i. Interest Expenses | 35 | 62 | 100 | | | ii. Operating Expenses | 3,265 | 4,324 | 4,584 | | | Provisions and Contingencies | 26 | -96 | 36 | | | of which, | | | | | | Risk Provisions | 2 | 3 | 9 | | | Tax Provisions | 16 | -100 | 22 | | C | Net Interest Income | 255 | 286 | 260 | | D | Profit | | | | | | i. Operating Profit (EBPT) | -911 | -923 | -762 | | | ii. Net Profit | -937 | -827 | -798 | Note: Data for end-March 2019, end-March 2020 and end-March 2021 pertain to seven, six and six PBs, respectively. Hence, the data are not comparable across years.
Source: Off-site returns (domestic operations), RBI. |
| Table IV.39: Select Financial Ratios of Payments Banks | | Sr. No. | Item | March-19 | March-20 | March-21 | | 1 | Return on Assets | -13.1 | -9.8 | -6.4 | | 2 | Return on Equity | -49.4 | -44.3 | -44.5 | | 3 | Investments to Total Assets | 43.7 | 48.4 | 56.6 | | 4 | Net Interest Margin | 6.1 | 4.8 | 2.8 | | 5 | Efficiency (Cost-Income Ratio) | 136.6 | 124.8 | 116.9 | | 6 | Operating profit to working funds | -12.7 | -10.9 | -6.1 | | 7 | Profit Margin | -39.2 | -23.9 | -20.3 | Note: : Data for end-March 2019, end-March 2020 and end-March 2021 pertain to seven, six and six PBs, respectively. Hence, the data are not comparable across years.
Source: Off-site returns (domestic operations), RBI. | 16.3 Inward and Outward Remittances of PBs IV.111 Total inward and outward remittances through PBs declined by more than 20 per cent in 2020-21, in terms of both volume and value. Given the predominance of small-value large-volume transactions in their operations, UPI had the largest share in total remittance business for the third consecutive year, followed by IMPS and E-wallets (Table IV.40). 17. Overall Assessment IV.112 Notwithstanding a sharp downturn in global as well as domestic macroeconomic conditions, the banking sector in India remained resilient, with strong profitability indicators, and improved asset quality. Various regulatory measures initiated by the Reserve Bank in response to the pandemic played a crucial role in protecting banks’ balance sheets, providing necessary liquidity support and stabilising the financial sector. Additionally, the establishment of the National Asset Reconstruction Company Limited (NARCL) by the Government of India is expected to aid the recovery process, while alleviating stress on banks’ balance sheets. | Table IV.40: Remittances through Payments Banks | | (Number in thousand, amount in ₹ crore) | | Channel | 2019-20 | 2020-21 | | Inward Remittances | Outward Remittances | Inward Remittances | Outward Remittances | | Number | Amount | Number | Amount | Number | Amount | Number | Amount | | 1. NEFT | 898 | 19,398 | 1,408 | 43,593 | 1,389 | 26,295 | 826 | 60,649 | | | (0.4) | (5.3) | (0.6) | (10.1) | (0.9) | (9.8) | (0.5) | (19.8) | | i) Bill Payments | 63 | 6,103 | 421 | 8,151 | 9 | 17 | 23 | 28 | | | (0.0) | (1.7) | (0.2) | (1.9) | (0.0) | (0.0) | (0.0) | (0.0) | | ii) Other than Bill Payments | 835 | 13,295 | 987 | 35,442 | 1,380 | 26,278 | 803 | 60,621 | | | (0.4) | (3.6) | (0.4) | (8.2) | (0.8) | (9.8) | (0.5) | (19.8) | | 2. RTGS | 20 | 81,411 | 7 | 56,794 | 19 | 56,460 | 2 | 35,107 | | | (0.0) | (22.2) | (0.0) | (13.2) | (0.0) | (21.0) | (0.0) | (11.4) | | 3. IMPS | 14,069 | 34,309 | 34,522 | 1,05,366 | 13,627 | 37,466 | 18,988 | 65,866 | | | (6.8) | (9.3) | (15.0) | (24.5) | (8.3) | (14.0) | (11.1) | (21.5) | | 4. UPI | 1,44,227 | 1,70,998 | 1,45,370 | 1,60,976 | 1,17,270 | 1,13,289 | 1,20,069 | 1,03,908 | | | (69.4) | (46.6) | (63.2) | (37.4) | (71.8) | (42.2) | (70.3) | (33.9) | | 5. E - Wallets | 33,960 | 23,427 | 40,316 | 41,274 | 23,162 | 20,406 | 30,150 | 38,317 | | | (16.3) | (6.4) | (17.5) | (9.6) | (14.2) | (7.6) | (17.7) | (12.5) | | 6. Micro ATM (POS) | 4,736 | 16,746 | 69 | 229 | 3 | 20 | 14 | 45 | | | (2.3) | (4.6) | (0.0) | (0.1) | (0.0) | (0.0) | (0.0) | (0.0) | | 7. ATM | - | - | 375 | 1,169 | - | - | 1 | 3 | | | - | - | (0.2) | (0.3) | - | - | (0.0) | (0.0) | | 8. Others | 10,045 | 20,740 | 7,840 | 21,515 | 7,821 | 14,384 | 719 | 2,866 | | | (4.8) | (5.7) | (3.4) | (5.0) | (4.8) | (5.4) | (0.4) | (0.9) | | Total | 2,07,955 | 3,67,030 | 2,29,908 | 4,30,916 | 1,63,292 | 2,68,321 | 1,70,768 | 3,06,761 | Notes: 1. Figures in the parentheses are percentage to total; -: Nil/Negligible.
2. Data for end-March 2020 and end-March 2021 pertain to six PBs each.
Source: Off-site returns (domestic operations), RBI. | IV.113 Although credit offtake by banks remained subdued in an environment of risk aversion and muted demand conditions during 2020-21, a pick up has started in Q2:2021-22, with the economy emerging out of the shadows of the second wave of COVID-19. Going forward, revival in bank balance sheets hinges around overall economic growth which is contingent on progress on the pandemic front. However, banks would need to further bolster their capital positions to absorb potential slippages as well as to sustain the credit flow, especially when monetary and fiscal measures unwind. Although most of the regulatory relaxation measures have run their course, full extent of their impact on banking is yet to unravel. IV.114 Banks would need to strengthen their corporate governance practices and risk management strategies to build resilience in an increasingly dynamic and uncertain economic environment. With rapid technological advancements in the digital payments landscape and emergence of new entrants across the FinTech ecosystem, banks have to prioritise upgrading their IT infrastructure and improving customer services, together with strengthening their cybersecurity.
|