by Anupam Prakash, Suraj S, Ishu Thakur and Mousumi Priyadarshini^ This study presents quarterly estimates of financial wealth of Indian households from June 2011 to March 2023, including their investments in listed equity accounting for variations in asset prices. As at end-March 2023, household financial assets stood at 135.0 per cent of GDP while their financial liabilities were 37.8 per cent of GDP; their net financial wealth was thus placed at 97.2 per cent of GDP. The spike in financial assets during the Covid-19 pandemic amidst restrictions on contact-intensive services and subdued growth in liabilities led to an increase of 12.6 percentage points in net financial wealth between end-March 2020 and end-March 2023. Equity and investment funds of households increased more than 1.5 times from 2011-12 to 2022-23. Household debt to financial assets ratio has remained stable during the period. Introduction Households1 form the bedrock of any macroeconomic framework as the key drivers of consumption, savings and overall economic activity. Household consumption depends upon their income as well as wealth. In this context, monitoring household financial position not only provides a better assessment of their own well-being, but also can help improve understanding of the evolving private consumption and economic activity for a forward-looking monetary policy (Lettau et al., 2002; Ludwig and Sløk, 2004). Apart from the periodic saving or dissaving, the net wealth of households, defined as the difference between total asset holdings (financial and non-financial) and liabilities accumulated over the periods is also affected by holding gains or losses (revaluations) and other changes in volume2 (OECD, 2017). The evolving trajectory of net financial wealth (NFW) focusing on the stock of financial assets net of liabilities can help assess the potential financial vulnerabilities and implications for household debt sustainability. The major data sources used for arriving at household wealth in most countries are: (i) the household wealth surveys and (ii) household balance sheet (HBS). The surveys, although more comprehensive in presenting wealth distribution including estimates of non-financial assets, can suffer from non-response and under-reporting, especially by the wealthier households (Shorrocks et al., 2023). In this context, the sectoral balance sheet data can provide a timely and more reliable source of household financial position3. Accordingly, the Reserve Bank of India (RBI), starting 2019, published the sector-wise stock of financial assets and liabilities along with the flow of funds data as financial stocks and flow of funds (FSF) of the Indian economy covering data since 2011-12 (NSC (2018), Prakash et al., 2019)4. Subsequently, the outstanding stock of select financial assets and liabilities of the household sector have been released on a quarterly basis, covering data since 2018 in the RBI Bulletin (Prakash et al., 2018). In continuation of these initiatives, this article presents quarterly household financial balance sheet5, i.e., stocks of financial assets and liabilities since June 2011 till March 2023. Apart from extending the data backwards till June 2011, this article also expands the scope by including the household investments in listed equity as well as the stock of pension and provident funds6. The rest of the article is structured as follows: current approaches of measuring household wealth, available data sources as well as estimation of equity wealth are discussed in Section II. Section III presents the estimates of quarterly series on household financial wealth with the evolving composition and trends. The last section concludes with persisting issues in the household wealth estimation and the way forward towards a more robust monitoring of household finances. II. Data and Methodology The compilation and dissemination of institutional sectoral flows and balance sheet data on annual and quarterly basis was underscored in recommendation II.87 of the G-20 Data Gap Initiative (DGI-2). Based on the data reported by the Organisation of Economic Cooperation and Development (OECD), 42 countries provide financial balance sheet (non-consolidated) data on quarterly basis (Table 1). In a developing economy, bulk of the household assets are non-financial, but as transition happens towards a market economy, the share of financial assets tends to rise (Shorrock et al., 2019). Given the data availability issues, this study focuses on the financial wealth of Indian households8. However, data on non-institutional sources of credit, i.e., landlord, agricultural moneylender, professional moneylender, input supplier, relatives and friends, chit funds, market commission agent/traders, etc., are not included due to data availability issues. It may also be noted that, according to All-India Debt and Investment Survey (NSO, 2021), there is an increase in the incidence of indebtedness (IOI)9 from institutional credit agencies together with a decline in the IOI from non-institutional credit agencies in comparison with the AIDIS 2013 results10. The annual FSF accounts released in RBI Bulletin include equity investments of households, with their value estimated on the basis of paid-up equity capital and do not capture changes due to market price fluctuations. This article attempts to incorporate the impact of valuation changes on household asset holdings. The article further includes employment-linked pension and provident fund assets, thus expanding the available time series in both length and breadth (Appendix Table 1). | Table 1: Countries Reporting Data to OECD | | Frequency | Financial Balance Sheets (Stocks) | Financial Accounts (Flows) | | Non-Consolidated | Consolidated | Non-Consolidated | Consolidated | | Annual | 44 | 40 | 45 | 40 | | Quarterly | 42 | 35 | 40 | 35 | Notes: 1. Consolidated data eliminates stock positions and flows that occur between institutional units that are grouped together, as if they constitute a single unit.
2. Data for India features in the annual financial balance sheet non-consolidated and financial accounts non-consolidated.
3. The count of countries is as on May 31, 2024.
Source: OECD Stats. | II.1 Data Sources and Classification In the absence of primary data for households, their accounts are estimated through data from counterparty sectors. In case of India, this counterparty information is well defined and regularly published by various agencies/regulators including RBI, Securities and Exchange Board of India (SEBI), Pension Fund Regulatory and Development Authority (PFRDA), Insurance Regulatory and Development Authority of India (IRDAI), Association of Mutual Funds of India (AMFI), Controller General of Accounts (CGA), Employees’ Provident Fund Organisation (EPFO), National Housing Bank (NHB), etc. Data from these entities fundamentally form the basis of compilation of both the household financial balance sheet and financial accounts. The current study provides financial balance sheet of households on quarterly basis from end-June 2011 (Q1:2011-12) to end-March 2023 (Q4:2022-23)11. The components of financial assets and liabilities with respective sources and instrument-wise classification are listed in Table 2. | Table 2: Financial Assets and Liabilities | | S. No. | Financial Assets | Source | Classification | | 1 | Currency | RBI, NHB | Currency | | 2 | Bank Deposits | Deposits | | 3 | Non-Bank Deposits (NBFCs and HFCs) | | 4 | Small Savings | CGA | | 5 | Equity (Listed Firms) | CMIE Prowess | Equity and Investment Funds | | 6 | Mutual funds | AMFI, SEBI | | 7 | Life Insurance Funds | IRDAI | Insurance Funds | | 8 | Pension Schemes (APY and NPS) | PFRDA | Pension Schemes | | 9 | EPFO Provident and Pension Funds | EPFO | | 10 | State Provident Funds | CGA, RBI | | 11 | Debt Securities | RBI | Debt Securities | | | Liabilities | Source | Classification | | 1 | Bank Credit | RBI | Loans | | 2 | Non-Bank Credit (NBFCs, HFCs and Insurance) | RBI, NHB, IRDAI | Note: NBFCs – Non-banking financial companies, HFCs – Housing Finance Companies, APY – Atal Pension Yojana, NPS – National Pension Scheme.
Source: Authors’ compilation. | The classification of financial assets and liabilities is aligned as per the framework of monetary and financial sector statistics delineated in the Monetary and Financial Statistics Manual and Compilation Guide (IMF, 2016) and SNA 200812. Deposits, which are standard non-negotiable contracts, representing funds placed for later withdrawal, include bank and non-bank deposits as well as small saving funds (SSF) comprising public provident fund (PPF), national saving deposits (NSD) and national saving certificates (NSC). Since the nature of PPF is that of a personal investment scheme instead of employment-based provident funds, the same has been considered as a part of deposits instead of pension and provident funds. NSC, being a non-negotiable certificate of deposit, is also classified under deposits instead of debt securities. Data for bank and non-bank13 deposits are sourced from banking statistics released by RBI, whereas the data on small savings are provided by the monthly accounts released by CGA. Pension schemes include the existing and future claims of employees against their employer, or a fund designated by the employer to compensate employees on retirement. Three employment-based pension schemes are included under this category: (i) EPFO managed provident and pension fund schemes, (ii) asset under management (AUM) of APY and NPS, and (iii) state provident funds (SPF) of centre and state governments. While the data for APY, NPS and central government SPF are available on monthly basis, the annual data of EPFO funds and state government SPF are allocated quarterly based on the quarterly trends in NPS and central government data, respectively. The market value of the equity holdings of households in listed corporates (discussed in the next sub-section), together with the stock of investments in mutual funds, form the equity and investment funds. Investments in mutual funds are taken as the sum of scheme-wise AUM14 published by AMFI on quarterly basis since September 2014, i.e., Q2:2014-15. Prior to that, the data were published by AMFI on semi-annual basis which are interpolated. Investments in life insurance funds are taken from the industry-wide statistics published by the IRDAI on annual basis; the quarterly data of sample life insurance companies are used to prepare the quarterly series. Household investments in the government bonds including treasury bills and sovereign gold bonds form part of debt securities. II.2 Household Wealth in Listed Equity Data on the ownership of equity in listed firms are available in the CMIE Prowess database on quarterly basis. It is broadly divided into ownership by two groups, i.e., promoter and non-promoter with further disaggregation (Exhibit 1). Equity wealth of households is estimated by summing up the market capitalisation as per the shareholding of two groups: (i) Indian promoter individuals and Hindu Undivided Families (HUFs) – promoter households; and (ii) non-promoter individuals – non-promoter households15 of the companies listed on the Bombay Stock Exchange (BSE)16. Household equity wealth in each listed company is calculated at quarterly level by multiplying the proportion of shares held by the promoter and non-promoter household groups with the total market capitalisation of the company. Accordingly, the total equity wealth is arrived at by aggregating the company level household equity holdings for all the listed companies (Equation 1). Household Equity Wealth = Σi [(Proportion of shares held with promoter households and non-promoter households)i × Market Capitalisationi], where i = BSE Listed company (1) The share of households in total market capitalisation during March 2010 to March 2023, averaged around 14.5 per cent, experiencing a generally rising trend with intermittent fluctuations. The post-pandemic recovery in the stock market coincided with an increase in household share in total market capitalisation mainly driven by rapid increase in shareholdings of non-promoter households (Chart 1).
As per the above estimation, the equity wealth of households stood at 10.3 per cent of GDP in Q1:2011-12, which rose to a peak of 19.4 per cent of GDP in Q3:2021-22, and then subsequently moderated to 14.9 per cent of GDP in Q4:2022-23. III. Trends in Household Financial Wealth in India As of March 2023, total household financial assets are estimated at ₹363.8 lakh crore, equivalent to 135.0 per cent of the gross domestic product (GDP). In contrast, the outstanding liabilities amounted to ₹101.8 lakh crore, accounting for 37.8 per cent of GDP. The resultant NFW is estimated at ₹262.0 lakh crore (97.2 percent of GDP). The pandemic period witnessed a jump in the financial assets and NFW for the two-year period from March 2020 to March 2022 (Chart 2). In 2022-23, with the resumption of normal economic activities, the NFW also normalised due to a strong revival in both bank and non-bank lending to households coupled with a relatively moderate growth in financial assets. For the entire period of study starting from June 2011 to March 2023, the financial assets rose at a compounded quarterly growth rate (CQGR) of 3.0 per cent, while the liabilities expanded at a CQGR of 3.3 per cent; NFW recorded a CQGR of 2.9 per cent during the same period (Chart 3). III.1 Compositional Shifts in Financial Assets Deposits have sustained their dominance in total financial wealth in the last decade, though with an increasing interest towards other investment instruments, viz., equity and investment funds and insurance and pension funds. The share of equity and investment funds in total financial wealth increased by more than 50 per cent between 2011-12 and 2022-23. Amidst exponential growth in digital payments, the currency share in household financial assets has moderated (Charts 4 and 5).
The Indian household participation in equity market has increased over time, with total demat accounts reaching 11.4 crore in 2022-23 from 3.6 crore in 2018-19 (SEBI, 2023). The share of listed equity holdings in the total financial assets of Indian households was 11.1 per cent as of March 2023 (Chart 6). The stock market decline after the onset of the pandemic pulled down the net financial wealth of households in Q4:2019-20 by around 3.0 per cent over the preceding quarter. This decline was more than offset by the accumulation of savings and deposits in 2020-21 due to the pandemic-induced restrictions on spending and the subsequent revival of the stock market. On a cumulative basis, the financial assets of households rose by ₹123.2 lakh crore between the quarter-ended December 2019 and the quarter-ended March 2023; around 23 per cent of this increase was due to asset price gains and the rest due to incremental financial savings17 (Chart 7 & 8).
III.2 Composition of Household Debt Mortgages make up the lion’s share (more than 50 per cent) of household debt in advanced economies (AEs), while in emerging market economies (EMEs) non-mortgage debt forms at least two-third of the total (IMF, 2017). The latter comprises both secured and unsecured personal loans, viz., vehicle loans, education loans, credit card outstanding, business loans for industry, trade, transport, finance and loans for agriculture. Similar to other EMEs, the banking sector in India dominates as a supplier of credit to the households with almost 80 per cent share in the total credit; non-bank entities i.e., HFCs and NBFCs are also emerging fast as the source of credit in the recent years. The share of non-bank debt increased by around 7.0 percentage points from end-March 2012 to end-March 2023 (Chart 9). 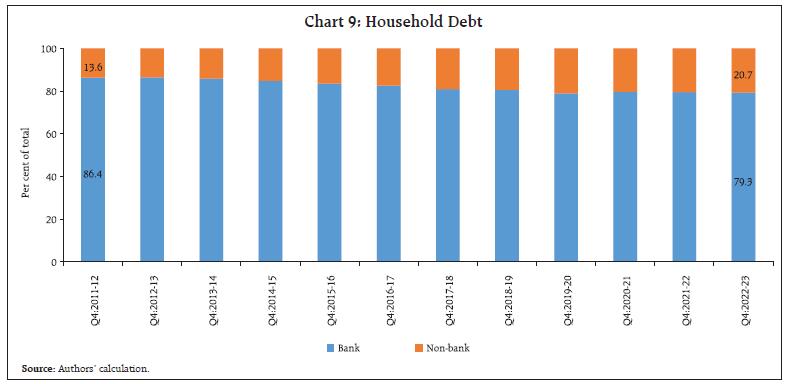 Adverse income shocks can get amplified in the presence of elevated debt levels (Mian et al., 2017, Zabai, 2017). While the indebtedness of Indian households has been on an upward trajectory reflecting financial deepening, it needs to be seen in the context of an increase in their financial assets as well. The household “leverage” ratio - defined as the ratio of household debt to financial assets - has remained largely flat and range-bound since 2011-12 (Chart 10). IV. Way Forward This article provides estimates of quarterly financial balance sheet of households and their net financial wealth for 2011-12 to 2022-23. The analysis indicates that deposits are still the most preferred instrument of saving although market-based instruments are gaining share. The accumulation of financial assets and net financial wealth jumped in 2020-21 due to the pandemic-induced restrictions on mobility and spending along with subdued growth in liabilities; net financial wealth has since exhibited some normalisation as household consumption picked up on the return of normalcy. 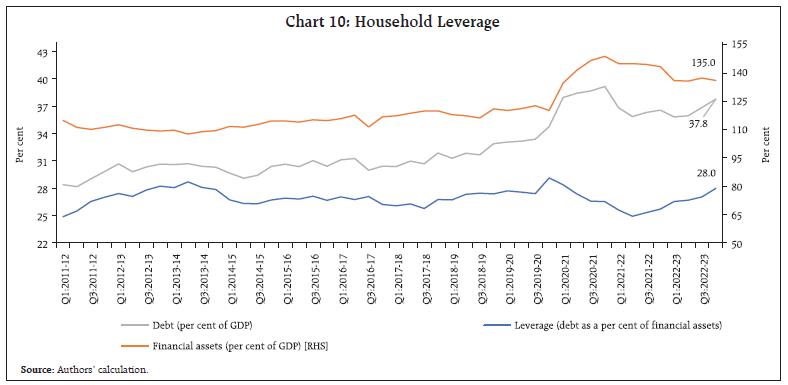 The estimation of the household financial wealth in this paper excludes the investments, particularly by the high-net-worth individuals, in the unlisted corporate sector, due to data availability issues. Globally, household financial wealth in unlisted equity holdings exceeds listed equity wealth, by around 36.6 per cent, 23.5 per cent and 11.6 per cent of GDP in France, Canada and the UK, respectively18. In India, there exist 17.1 lakh active unlisted/private limited companies as compared to only 6,658 listed companies as of end-May 2024; information on household holdings in these unlisted companies and consistency in their valuation would help to strengthen estimates of financial wealth presented in this study19. Furthermore, significant household investments in India still flow into non-financial assets such as real estate, gold and precious metals. Regular and comprehensive household wealth surveys can enrich the estimates of household overall wealth, encompassing both financial and physical assets and liabilities. References IMF (2016). Monetary and Financial Statistics Manual and Compilation Guide, 2016. Ludwig, A., and Sløk, T. (2004). The relationship between stock prices, house prices and consumption in OECD countries. Contributions in Macroeconomics, 4(1), 20121017. Mian, A., Sufi, A., & Verner, E. (2017). Household debt and business cycles worldwide. The Quarterly Journal of Economics, 132(4), 1755-1817. NSC (2018). Report of the Committee on Financial Sector Statistics. National Statistical Commission. May 2018. NSO(2021). All India Debt and Investment Survey 2019, NSS 77th Round, National Statistical Office, Ministry of Statistics and Programme Implementation, Government of India. OECD (2017). Understanding Financial Accounts. OECD Publishing. Prakash, A., Shukla, A. K., Ekka, A. P., Priyadarshi, K. and Bhowmick, C. (2019). Financial Stocks and Flows of the Indian Economy 2011-12 to 2017-18. RBI Bulletin, July, Reserve Bank of India. Prakash, A., Shukla, A. K., Ekka, A. P. and Priyadarshi, K. (2018). Quarterly Estimates of Households’ Financial Assets and Liabilities. RBI Bulletin, March, Reserve Bank of India. RBI (2023). Annual Report 2022-23. Reserve Bank of India. SEBI (2023). Annual Report 2022-23. Securities and Exchange Board of India. Shorrocks, A., Lluberas, R., Davies, J., Waldenström, D. (2023). Global Wealth Report 2023. Credit Suisse Research Institute (CSRI), Credit Suisse AG, UBS. SNA (2008). System of National Accounts 2008. United Nations. Zabai, A. (2017). Household debt: recent developments and challenges. BIS Quarterly Review, December.
| Appendix Table 1: Household Financial Assets and Liabilities | | (Per cent of GDP) | | Quarter | Financial Assets | Liabilities | Net Financial Wealth | | Jun-11 | 114.1 | 28.4 | 85.7 | | Sep-11 | 110.5 | 28.2 | 82.3 | | Dec-11 | 109.4 | 29.0 | 80.4 | | Mar-12 | 110.5 | 29.8 | 80.6 | | Jun-12 | 111.8 | 30.7 | 81.2 | | Sep-12 | 110.0 | 29.8 | 80.2 | | Dec-12 | 109.1 | 30.3 | 78.8 | | Mar-13 | 108.6 | 30.6 | 77.9 | | Jun-13 | 109.0 | 30.6 | 78.4 | | Sep-13 | 107.0 | 30.7 | 76.3 | | Dec-13 | 108.2 | 30.4 | 77.8 | | Mar-14 | 108.8 | 30.3 | 78.5 | | Jun-14 | 111.0 | 29.6 | 81.4 | | Sep-14 | 110.5 | 29.1 | 81.5 | | Dec-14 | 111.9 | 29.4 | 82.5 | | Mar-15 | 113.8 | 30.4 | 83.4 | | Jun-15 | 113.8 | 30.6 | 83.2 | | Sep-15 | 113.2 | 30.4 | 82.9 | | Dec-15 | 114.4 | 31.0 | 83.4 | | Mar-16 | 114.0 | 30.4 | 83.6 | | Jun-16 | 115.0 | 31.1 | 83.9 | | Sep-16 | 116.9 | 31.3 | 85.6 | | Dec-16 | 110.7 | 30.0 | 80.7 | | Mar-17 | 116.0 | 30.4 | 85.6 | | Jun-17 | 116.5 | 30.4 | 86.1 | | Sep-17 | 117.9 | 31.0 | 86.9 | | Dec-17 | 119.0 | 30.7 | 88.4 | | Mar-18 | 119.1 | 31.8 | 87.2 | | Jun-18 | 117.1 | 31.3 | 85.9 | | Sep-18 | 116.5 | 31.8 | 84.7 | | Dec-18 | 115.4 | 31.7 | 83.7 | | Mar-19 | 120.1 | 32.9 | 87.3 | | Jun-19 | 119.3 | 33.1 | 86.3 | | Sep-19 | 120.3 | 33.2 | 87.1 | | Dec-19 | 121.8 | 33.4 | 88.5 | | Mar-20 | 119.3 | 34.7 | 84.6 | | Jun-20 | 133.7 | 37.9 | 95.8 | | Sep-20 | 140.4 | 38.4 | 102.0 | | Dec-20 | 145.5 | 38.7 | 106.8 | | Mar-21 | 147.7 | 38.9 | 108.8 | | Jun-21 | 143.8 | 36.6 | 107.3 | | Sep-21 | 143.9 | 35.6 | 108.3 | | Dec-21 | 143.4 | 36.1 | 107.3 | | Mar-22 | 142.3 | 36.5 | 105.7 | | Jun-22 | 134.9 | 35.8 | 99.2 | | Sep-22 | 134.7 | 35.9 | 98.8 | | Dec-22 | 136.3 | 36.8 | 99.5 | | Mar-23 | 135.0 | 37.8 | 97.2 |
|