A Monetary Policy Framework Agreement (MPFA) was signed between the Government of India and the Reserve
Bank on February 20, 2015. The policy rate was reduced by 75 bps during 2015-16 and 25 bps during 2016-17 so
far, in support of an accommodative policy stance. The target for CPI inflation below 6 per cent by January 2016
was met and the focus has shifted to attaining the inflation target of 5 per cent by the end of 2016-17. Effective
liquidity management kept the weighted average call rate (WACR) tightly around the policy repo rate during
2015-16. In April 2016, the liquidity management framework was revised to progressively move to a position closer to
neutrality. The policy rate corridor around the repo rate was narrowed to +/- 50 bps. The Reserve Bank introduced
the Marginal Cost of Funds based Lending Rate (MCLR) system effective April 1, 2016. The Union Budget
2016-17 announced the constitution of a Monetary Policy Committee (MPC) by amending the RBI Act, 1934. The
amendment to the Act was notified in the Gazette of India on May 14, 2016 and came into force on June 27, 2016.
III.1 The conduct of monetary policy during
2015-16 was steered by the MPFA signed between
the Government of India and the Reserve Bank on
February 20, 2015 (Box III.1). Empowered by the
MPFA, the Reserve Bank set out an agenda for its
monetary policy operations: entrenching a durable
disinflationary process to take consumer price
index (CPI) inflation to the targets set for January
2016 and March 2017; improving transmission of
the policy rate to bank lending rates by ensuring
appropriate liquidity management consistent
with the monetary policy stance; and dampening
volatility of the WACR and other money market
rates around the repo rate, i.e., securing the first
leg of monetary transmission.
Agenda for 2015-16: Implementation Status
Disinflation
III.2 The first bi-monthly policy statement
of the Reserve Bank for 2015-16 maintained accommodative stance for monetary policy while
keeping focus on a gradual and durable disinflation
path that would take the CPI inflation below 6 per
cent by January 2016. The assessment at that time
was that inflation would be at 5.8 per cent by the
end of the year. Upside risks to the forecast such
as less than normal rainfall, large administered
price revisions, faster closing of the output gap and
possible geo-political spill-overs were expected
to be largely offset by downside risks originating
from global deflationary/disinflationary tendencies
and a soft outlook on global commodity prices.
Accordingly, the policy rate was kept unchanged
while awaiting transmission of past rate reductions
into banks’ lending rates, policy efforts to improve
food supply management and the unravelling of
global developments including the normalisation
of the US monetary policy. In June 2015, even as
concerns about a sub-normal south west monsoon
and its implications for food inflation remained, the
Reserve Bank reduced the policy repo rate by 25 bps, considering the weak investment climate
and the need to mitigate supply constraints. In
August 2015, the policy rate was kept unchanged
while awaiting clarity on domestic and global
developments and further transmission by banks.
Box III.1
Monetary Policy Framework Agreement (MPFA)
With the signing of the MPFA between the Government of
India and the Reserve Bank on February 20, 2015, flexible
inflation targeting (FIT) has been formally adopted in India.
Under the MPFA, the objective of monetary policy is to
primarily maintain price stability while keeping in view the
objective of growth. The Reserve Bank was to bring CPI
inflation below 6 per cent by January 2016. The target for
2016-17 and all subsequent years was set at 4 per cent with
a band of +/- 2 per cent. The MPFA also requires the Reserve
Bank to establish an operating target and an operating
procedure for monetary policy through which the operating
target is to be achieved. The Reserve Bank shall be seen to
have failed to meet the target if inflation remains above 6 per
cent or below 2 per cent for three consecutive quarters. In
such circumstances, the Reserve Bank is required to provide
the reasons for the failure, and propose remedial measures
and the expected time to return inflation to the target. The
Reserve Bank shall publish a document explaining the
sources of inflation as well as forecasts of inflation for the
next six to eighteen months.
The Reserve Bank has been publishing a bi-annual
Monetary Policy Report (MPR) since September 2014,
which provides forecasts of inflation and growth as well as
an assessment of the overall macroeconomic conditions.
The MPR also sets out the operating target and gives details
of the operating procedure of monetary policy and any
changes thereto.
With the amendment to the RBI Act on May 14, 2016, several
provisions of MPFA were subsumed in the amended Act. The
Central Government, in consultation with the Reserve Bank,
has notified the inflation target of 4.0 per cent (with 6.0 per
cent and 2.0 per cent as the upper and lower tolerance levels,
respectively) in the Official Gazette on August 5, 2016. This
inflation target is applicable for the period from August 5, 2016
to March 31, 2021. Moreover, factors that constitute a failure
to achieve the inflation target – i.e., if the average inflation is
more/less than the upper/lower tolerance level for three
consecutive quarters – have also been defined and notified
in the Official Gazette on June 27, 2016.
References:
RBI (2014), “Report of the Expert Committee to Revise and
Strengthen the Monetary Policy Framework” (Chairman: Urjit
R. Patel), January.
Government of India (2015), “Agreement on Monetary Policy
Framework between the Government of India and the Reserve
Bank of India”, February.
III.3 By September 2015, the receding
inflationary pressure emanating from benign
cereal prices and moderation in international
crude oil prices opened up space for monetary
policy action. The Reserve Bank front-loaded the
policy action by effecting a 50 bps cut in the policy
repo rate to boost domestic demand and stimulate
investment.
III.4 From September onwards, inflation began
rising prompting status quo on the policy rate
in December 2015. In February 2016, with a
softening in food and fuel inflation, it became clear that the January 2016 disinflation target would be
met and the subsequent data release which placed
CPI inflation for January 2016 at 5.7 per cent
confirmed this. With the target for January 2016
achieved, the focus of monetary policy shifted to
attaining the inflation target of 5 per cent by the end
of fiscal year 2016-17. Based on an assessment
that the target of 5 per cent inflation by March
2017 was achievable, particularly when the Union
Budget 2016-17 adhered to fiscal consolidation
and announced measures to re-invigorate the
rural economy, upgrade the social and physical
infrastructure, deepen institutional reforms and
improve the environment for business, the policy
rate was reduced further by 25 bps to 6.5 per cent
in April 2016, the lowest since March 2011. The
policy rate was kept unchanged in June 2016 in
view of uncertainties due to larger than seasonal inflationary pressures emanating from food items
and reversal in commodity prices. Continuing with
the accommodative stance, a status quo on the
policy repo rate was maintained in August 2016 as
a sharper-than-anticipated increase in food prices
pushed up the projected trajectory of inflation over
the rest of the year.
Operating Framework
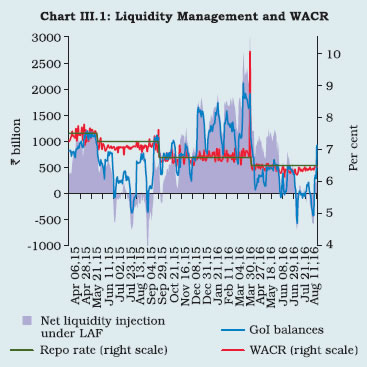
III.5 The goal of the operating framework of
monetary policy is to modulate liquidity conditions
in order to align the operating target – the WACR
– closely with the policy repo rate. During
2015-16, a considerable flux in autonomous liquidity
flows necessitated a pro-active assessment of
liquidity conditions and nimble responses through
a combination of regular facilities and fine-tuning
operations in the form of variable rate repo/reverse
repo auctions, drawing upon the revised liquidity
framework instituted in September 2014 (Chart
III.1). Liquidity conditions generally remained tight
during the second half of the year due to festival
related currency requirements and advance tax
outflows in Q3, followed by balance sheet
considerations and restraint in government spending in Q4. Accordingly, the daily recourse to
the Reserve Bank for liquidity which averaged ₹ 1.2
trillion during the second half of 2015-16 through
all liquidity windows, peaked at ₹ 3 trillion at end-
March 2016. The end-year spike in WACR was due
to the usual build-up of cash balances by banks
and the government. Effective liquidity management,
however, kept the WACR within +/- 10 bps and +/-
20 bps of the repo rate for 36 per cent and 79 per
cent of the total number of trading days, respectively,
during 2015-16.
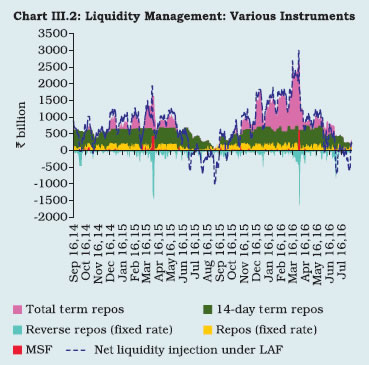
 III.6 With the institution of the revised liquidity
management framework, the role of term repo
auctions under the liquidity adjustment facility
(LAF) has become significant. Normal 14-day and
fine tuning term repos of varying tenors ranging
from 2 to 56-day accounted for about 90 per
cent of the average net liquidity injection under
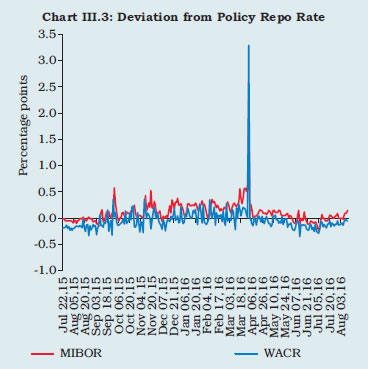
the LAF during the year (Chart III.2). Since July
22, 2015, the Financial Benchmark India Private
Limited (FBIL) has started compiling the Mumbai
Inter-Bank Offer Rate (MIBOR) based on actual
data of the interbank call market transactions
covering a one hour time span – from 9.00 a.m. to 10.00 a.m. Given the market microstructure, thick
trading in the first hour usually elevates MIBOR
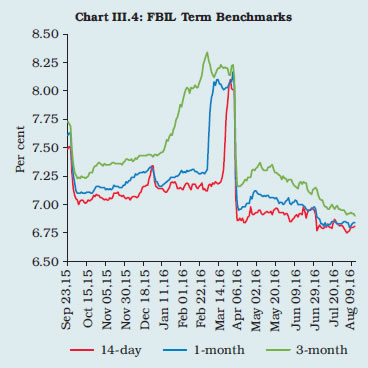
above WACR (Chart III.3). The FBIL has started
generating quote-based term benchmarks, but
their use in pricing of financial products and
transactions is yet to pick up (Chart III.4).
 III.7 In April 2016, the liquidity management
framework was revised in a move to progressively lower the average ex ante liquidity deficit to a
position closer to neutrality. The Reserve Bank
assured the market of meeting the requirements
of durable liquidity and then using its fine-tuning
operations to make short-term liquidity conditions
consistent with the stated policy stance.
Accordingly, in Q1 of 2016-17 the Reserve Bank
injected permanent liquidity of ₹ 805 billion through
open market operations (outright), more than
offsetting the impact of currency leakage of ₹ 696
billion during the same period. For ensuring non-disruptive
FCNR(B) redemptions, the Reserve
Bank pro-actively injected ₹ 100 billion through
open market purchase auction on August 11,
2016. With a view to further minimising volatility
in WACR, as also easing liquidity management for
banks without abandoning liquidity discipline, the
minimum daily maintenance of the cash reserve
ratio (CRR) was lowered from 95 per cent of the
requirement to 90 per cent effective April 16,
2016. Furthermore, the policy rate corridor around
the repo rate was narrowed from +/-100 bps to
+/- 50 bps.
 III.8 During 2015-16, as a part of the phased
implementation of the liquidity coverage ratio
(LCR), the minimum required high quality liquid
assets (HQLA) was raised from 60 per cent to
70 per cent of the total net cash outflow over the
next 30 calendar days under the stress scenario
effective January 01, 2016, which correspondingly
limited the capacity of banks to use the excess
statutory liquidity ratio (SLR) securities to access
collateralised liquidity from money markets and
the Reserve Bank. Recognising the scope for
providing greater flexibility to banks within the
prescribed SLR, effective February 11, 2016, the
Reserve Bank allowed banks to reckon additional
government securities held by them up to three
per cent of their NDTL within the mandatory SLR
requirement as level 1 HQLA for the purpose of
computing their LCR on top of the five per cent permitted in November 2014. On July 21, 2016,
additional headroom equivalent to 1 per cent of
NDTL was provided within the prescribed SLR.
Together, the total carve-out from SLR available
to banks stands at 11 per cent of their NDTL,
including 2 per cent of NDTL available under MSF.
Monetary Policy Transmission
III.9 In response to the reduction in the policy
repo rate by 150 bps during January 15, 2015
through April 05, 2016, the median base rate of
banks declined by 60 bps as against a higher
decline of 92 bps in median term deposit rates,
reflecting banks’ preference to protect profitability
in the wake of deteriorating asset quality and
higher provisioning (Table III.1). The weighted
average lending rate (WALR) on fresh rupee
loans declined by 100 bps (up to June 2016),
significantly more than the decline of 65 bps in
WALR on outstanding rupee loans.
Sectoral Lending Rates
III.10 Since December 2014, lending rates
across various sectors (except credit card) have
declined in the range of 16-110 bps, reflecting the varied credit conditions and risk appetite of
banks (Table III.2). Interest rates on fresh rupee
loans sanctioned for housing – personal and
commercial – declined more than that of the
respective categories of vehicle loans (Table III.3).
| Table III.1: Deposit and Lending Rates of
SCBs (Excluding RRBs) |
| (Per cent) |
| End-Month |
Repo Rate |
Term Deposit Rates |
Lending Rates |
| Median Term
Deposit Rate |
WADTDR |
Median
Base
Rate |
WALR
- Outstanding Rupee
Loans |
WALR
- Fresh
Rupee
Loans |
| 1 |
2 |
3 |
4 |
5 |
6 |
7 |
| Dec-14 |
8.00 |
7.55 |
8.64 |
10.25 |
11.84 |
11.45 |
| Mar-15 |
7.50 |
7.50 |
8.57 |
10.20 |
11.76 |
11.07 |
| Jun-15 |
7.25 |
7.22 |
8.43 |
9.95 |
11.61 |
11.03 |
| Sep-15 |
6.75 |
7.02 |
8.03 |
9.90 |
11.53 |
10.77 |
| Dec-15 |
6.75 |
6.77 |
7.83 |
9.65 |
11.31 |
10.59 |
| Mar-16 |
6.75 |
6.77 |
7.73 |
9.65 |
11.20 |
10.47 |
| Jun-16 |
6.50 |
6.63 |
7.52 |
9.65 |
11.19 |
10.45 |
| Variation (Percentage Points) (Jun-16 over Dec-14) |
-1.50 |
-0.92 |
-1.12 |
-0.60 |
-0.65 |
-1.00 |
| WADTDR: Weighted average domestic term deposit rate. |
Table III.2: Sector-wise WALR of SCBs (Excluding RRBs) - Outstanding Rupee Loans
(at which 60 per cent or more business is contracted) |
| (Per cent) |
| End-Month |
Agriculture |
Industry (Large) |
MSMEs |
Infra-structure |
Trade |
Profes- sional
Services |
Personal Loans |
Rupee Export Credit |
| Housing |
Vehicle |
Education |
Credit Card |
Other |
| 1 |
2 |
3 |
4 |
5 |
6 |
7 |
8 |
9 |
10 |
11 |
12 |
13 |
| Dec-14 |
10.93 |
12.95 |
13.05 |
13.05 |
13.09 |
12.39 |
10.76 |
11.83 |
12.90 |
37.86 |
14.24 |
12.16 |
| Mar-15 |
10.96 |
12.80 |
12.91 |
12.89 |
13.07 |
12.46 |
10.99 |
11.62 |
12.87 |
37.88 |
13.94 |
12.04 |
| Jun-15 |
10.76 |
12.62 |
12.36 |
12.24 |
12.52 |
12.03 |
10.81 |
11.39 |
12.58 |
37.87 |
13.75 |
11.63 |
| Sep-15 |
10.73 |
12.39 |
12.43 |
12.18 |
12.51 |
12.17 |
10.63 |
11.49 |
12.51 |
37.34 |
13.24 |
11.89 |
| Dec-15 |
10.51 |
12.47 |
12.34 |
12.25 |
12.72 |
12.74 |
10.36 |
11.00 |
12.35 |
34.04 |
13.86 |
11.60 |
| Mar-16 |
10.74 |
12.36 |
12.25 |
12.06 |
12.50 |
11.81 |
10.56 |
11.65 |
12.48 |
38.00 |
13.90 |
11.46 |
| Jun-16 |
10.77 |
12.17 |
12.08 |
12.20 |
11.99 |
11.64 |
10.50 |
11.39 |
12.32 |
38.26 |
13.96 |
11.17 |
| Variation (Percent- age Points) (Jun-16 over Dec-14) |
-0.16 |
-0.78 |
-0.97 |
-0.85 |
-1.10 |
-0.75 |
-0.26 |
-0.44 |
-0.58 |
0.40 |
-0.28 |
-0.99 |
| MSMEs: Micro, Small and Medium Enterprises. |
| Table III.3: WALR of Select Sectors of SCBs
(Excluding RRBs) - Fresh Rupee Loans
Sanctioned |
| (Per cent) |
| End-Month |
Personal |
Commercial |
| Housing |
Vehicle |
Housing |
Vehicle |
| 1 |
2 |
3 |
4 |
5 |
| Dec-14 |
10.53 |
12.29 |
11.74 |
12.53 |
| Mar-15 |
10.47 |
12.42 |
12.05 |
12.30 |
| Jun-15 |
10.10 |
12.53 |
12.06 |
12.29 |
| Sep-15 |
10.22 |
12.24 |
11.79 |
11.90 |
| Dec-15 |
10.02 |
11.97 |
11.08 |
11.64 |
| Mar-16 |
9.79 |
11.99 |
11.15 |
11.21 |
| Jun-16 |
9.64 |
11.80 |
10.53 |
11.49 |
| Variation (Percentage Points) (June-16 over Dec-14) |
-0.89 |
-0.49 |
-1.21 |
-1.04 |
Experience of the MCLR System
III.11 As set out in the agenda for 2015-16, the
Reserve Bank introduced the Marginal Cost of
Funds based Lending Rate (MCLR) system for
scheduled commercial banks (excluding RRBs),
effective April 1, 2016 whereby all new rupee
loans sanctioned and credit limits renewed would
be priced with reference to the MCLR.
III.12 Under the MCLR system, banks determine
their benchmark lending rates linked to marginal
cost of funds which is more sensitive to changes
in the policy rate, unlike the earlier base rate system
where banks adopted different methodologies
(average/marginal/blended principles) for
computing their cost of funds. MCLR consists of
four components: (a) marginal cost of funds
(marginal cost of borrowings comprising deposits
and other borrowings, and return on net worth), (b)
negative carry on account of CRR, (c) operating
costs and (d) term premium. The MCLR plus spread
is the actual lending rates for borrowers. The spread
comprises of only two components, viz., business
strategy and credit risk premium.
III.13 Under the MCLR system, transmission to
WALR is expected to improve on the assumption that the marginal cost of funds is more sensitive to
changes in the policy rate than the average cost of
funds. As expected, the MCLR for the overnight
segment, one year segment and up to three-year
segment (as on July 31, 2016) was lower by 70 bps,
25 bps and 36 bps, respectively, than the base rate
of 9.65 per cent (Table III.4).
III.14 There has hardly been any transmission
of a reduction in the policy rate to the actual
lending rates charged to customers during
2016-17 so far (up to June). While the cost of
funding by banks has declined somewhat leading
to a decline in shorter maturity MCLR, there has
been an increase in the term premia in respect
of term loans of one year and above, thereby attenuating the transmission to actual lending
rates charged to customers. Moreover, banks may
have been loading (i) a higher credit risk premia on
their new customers in order to attain their desired
return on net worth in a rising NPA environment;
and/or (ii) a higher strategic risk premia on their
riskier loans as part of their business strategy
to reorient their lending operations towards less
risky activities. The consequent rise in the spread
is reflected in a near unchanged WALR in respect
of both outstanding and fresh rupee loans during
2016-17 so far (up to June).
| Table III.4: MCLR and Base Rate of SCBs
(Excl. RRBs) |
| (Per cent) |
| Tenor |
Median MCLR |
Variation [col. 3-col. 2] (Percentage
Points) |
| April 04, 2016 |
July 31, 2016 |
| 1 |
2 |
3 |
4 |
| Overnight |
9.05 |
8.95 |
-0.10 |
| 1-Month |
9.20 |
9.03 |
-0.17 |
| 3-Month |
9.30 |
9.20 |
-0.10 |
| 6-Month |
9.40 |
9.28 |
-0.12 |
| 1-Yr |
9.45 |
9.40 |
-0.05 |
| 2-Yr |
9.60 |
9.55 |
-0.05 |
| 3-Yr |
9.65 |
9.63 |
-0.02 |
| 4-Yr |
9.65 |
9.68 |
0.03 |
| 5-Yr |
9.70 |
9.70 |
0.00 |
| 6-Yr |
9.73 |
9.73 |
0.00 |
| 7-Yr |
9.73 |
9.73 |
0.00 |
| 8-Yr |
9.73 |
9.73 |
0.00 |
| 9-Yr |
9.73 |
9.73 |
0.00 |
| 10-Yr |
9.73 |
9.73 |
0.00 |
| Up to 3-yrs |
9.38 |
9.29 |
-0.09 |
| Median Base Rate |
| |
9.65 |
9.65 |
0.00 |
| Variation (MCLR over Base Rate) (Percentage Points) |
| As on |
Overnight |
1-Yr |
Up to 3-Yrs |
| April 04, 2016 |
-0.60 |
-0.20 |
-0.27 |
| July 31, 2016 |
-0.70 |
-0.25 |
-0.36 |
III.15 In a competitive environment, it is expected
that the return on net worth of banks would vary in
a narrow range. Data for the month of June 2016,
however, show wide variations in the expected
return on net worth – between 0.33 per cent and
26.44 per cent (Table III.5).
Agenda for 2016-17
III.16 In the first bi-monthly policy statement for
2016-17, the Reserve Bank set a target for CPI
inflation at 5 per cent by March 2017. The eventual
aim is to move towards 4 per cent CPI inflation by
the end of 2017-18.
III.17 To strengthen the monetary policy
framework, the Union Budget 2016-17 announced
the formal constitution of a Monetary Policy
Committee (MPC) by amending the RBI Act, 1934,
which will be vested with the responsibility of setting the policy rate. With the introduction of MPC, the
decision making process will imbue diversity of
views, specialised experience and independence
of opinion, which will bring transparency to the
overall decision-making process. In this context,
as the cross-country experience shows, there is
an increasing recognition of the merit in following
a collegial approach to monetary policy decision
making, irrespective of whether the countries are
following inflation targeting or not (Box III.2).
| Table III.5: Return on Net Worth Expected by
Banks - June 2016 |
| (Per cent) |
| Bank Group |
Min |
Max |
Median |
| Public Sector Banks |
2.00 |
25.00 |
16.00 |
| Private Sector Banks |
2.81 |
22.00 |
16.50 |
| Old |
2.81 |
22.00 |
15.25 |
| New |
6.25 |
20.00 |
18.00 |
| Foreign Banks |
0.33 |
26.44 |
10.00 |
| SCBs |
0.33 |
26.44 |
14.00 |
III.18 The amended RBI Act, which was notified
in the Gazette of India on May 14, 2016 mandates
a Monetary Policy Committee to determine the
policy interest rate to achieve the inflation target
set by the Government. MPC is a new institutional
structure. The MPC shall consist of the Governor of
the Reserve Bank, the Deputy Governor-in-charge
of monetary policy, one officer of the Bank to be
nominated by the Central Board of the Reserve
Bank and three members to be appointed by the
Central Government. Each member shall have one
vote, and in the event of a tie, the Governor can
exercise a casting or second vote. The institution
of the MPC is the culmination of several preceding
processes and draws on the recommendations
of technical committees including the Committee
on Fuller Capital Account Convertibility, 2006
(Chairman: Shri S.S. Tarapore); the Committee on
Financial Sector Reforms, 2009 (Chairman: Dr.
Raghuram G. Rajan); the Committee on Financial
Sector Assessment, 2009 (Chairman: Dr. Rakesh
Mohan); the Financial Sector Legislative Reforms
Commission (FSLRC), 2013 (Chairman: Shri B.N.
Srikrishna) and the Expert Committee to Revise
and Strengthen the Monetary Policy Framework,
2014 (Chairman: Dr. Urjit R. Patel). It also
represents a progressive graduation of the initial
efforts towards collegial decision making under
the aegis of the Technical Advisory Committee on
Monetary Policy. The learning experience gained by the Reserve Bank will help refine and entrench
decision making under MPC with the passage of
time.
Box III.2
Committee Approach to Monetary Policy: International Experience
A committee approach to monetary policy decisions has
emerged as the preferred framework across the globe.
Several advantages have been cited for this: enabling a
confluence of specialised knowledge and expertise on the
subject domain; bringing together different stakeholders
and diverse opinion and improving representativeness; and
collective wisdom making the whole greater than the sum
of the parts (Blinder and Morgan, 2005 and Maier, 2010).
Even for countries like Canada, Israel and New Zealand
where the Governor is responsible for decision making de
jure, she/he is typically supported by an advisory committee
de facto. Within this committee approach, there are several
variants in terms of size and composition of the committee,
representation of the government, the manner in which
the members are appointed, the frequency of committee
meetings and how a decision is arrived at, i.e., by voting
or consensus, and whether there are external members or
not and if so full time or part time, all of which impact policy
outcomes (Table 1).
References:
Blinder A. and J. Morgan (2005), ‘Are Two Heads Better than
One? An Experimental Analysis of Group versus Individual
Decision-making’, Journal of Money, Credit and Banking 35(5).
Maier, P. (2010), ‘How Central Banks Take Decisions: An
Analysis of Monetary Policy Meetings’ in P.L. Siklos, M.T.
Bohl and M.E. Woher (eds), Challenges in Central Banking:
The Current Institutional Environment and Forces Affecting
Monetary Policy, Cambridge University Press, Cambridge.
| Table 1: Structure of MPC in Select Countries |
| Country |
Started |
Internal
Members |
External
Members |
Government
Representa-
tive (s) |
External
Members |
Decision
Making |
| Full time/part time |
Voting |
Consensus |
| 1 |
2 |
3 |
4 |
5 |
6 |
7 |
8 |
| Australia |
1959 |
3 |
6 |
Yes |
Part time |
✓ |
|
| Brazil |
1996 |
8 |
0 |
No |
NA |
|
✓ |
| Chile |
1990 |
5 |
0 |
No |
NA |
✓ |
|
| Czech Republic |
1998 |
7 |
0 |
No |
NA |
✓ |
|
| ECB |
– |
6 |
19 |
No |
Full time* |
|
✓ |
| Hungary |
1993 |
4-6 |
1-3 |
No |
Full time |
✓ |
|
| Indonesia |
2005 |
6 |
0 |
No |
NA |
|
✓ |
| Japan |
1998 |
3 |
6 |
Yes – no
voting rights |
Full time |
✓ |
|
| Mexico |
1994 |
5 |
0 |
No |
NA |
✓ |
|
| Norway |
2001 |
2 |
5 |
No |
Part time |
✓ |
|
| Poland |
1998 |
1 |
9 |
No |
Full time |
✓ |
|
| South Africa |
1999 |
8 |
0 |
No |
NA |
✓ |
|
| South Korea |
1997 |
2 |
5 |
No |
Full time |
✓ |
|
| Sweden |
1999 |
6 |
0 |
No |
NA |
✓ |
|
| Thailand |
2001 |
3 |
4 |
No |
Full time |
|
✓ |
| Turkey |
2001 |
6 |
1 |
Yes – no
voting rights |
Full time |
|
✓ |
| UK |
1997 |
5 |
4 |
Yes – no
voting rights |
Part time |
✓ |
|
| US |
1935 |
12 |
0 |
No |
NA |
✓ |
|
NA: Not applicable.
*: External members are governors of member central banks.
Sources: Central bank websites and CCBS Handbook No. 29, February 2012. |
III.19 The revised liquidity management
framework being implemented since April 2016 is
expected to smoothen the supply of durable liquidity
over the year and progressively lower the average
ex ante liquidity deficit in the system to a position
closer to neutrality. This warrants continuous
monitoring and preparedness to calibrate instruments to unforeseen liquidity developments
in pursuit of this objective. In particular, the risk
of easy liquidity conditions either driving WACR
below the repo rate or the associated lower term
repo auction volumes dampening the prospect of
development of a term money market will have
to be avoided. The Reserve Bank will objectively
assess the efficacy of MCLR vis-à-vis the earlier
base rate system in terms of monetary policy
transmission. |