Fundamental institutional changes impacted monetary policy in India following the amendment to
the Reserve Bank of India (RBI) Act, 1934, effected on June 27, 2016. The policy rate was reduced by
50 bps during 2016-17 and the policy stance shifted from accommodative to neutral in February 2017.
Even as inflation undershot the target of 5 per cent set for Q4 of 2016-17, monetary policy operations had to
contend with massive surplus liquidity conditions, necessitating a mix of conventional and unconventional
instruments of liquidity management. In spite of faster transmission of policy rate changes to marginal
cost of funds based lending rates (MCLRs), pass-through to actual lending rates remained incomplete.
III.1 The conduct of monetary policy in India
underwent a fundamental institutional reform
during the year 2016-17 in an environment fraught
with several challenges. Bouts of turbulence
ricocheting through global financial markets,
volatility in global crude oil prices, risk-laden
political climate globally, a distinctive break in
inflation formation in the domestic economy,
demonetisation and its side-effects, and new
data releases that overtook perceptions of the
state of the economy – all of these developments
impacted the setting of monetary policy with
different degrees of intensity and duration. In
this unsettled milieu, the agenda set for the
year was accomplished. The inflation target of 5
per cent for Q4 of 2016-17 was achieved with a
sizable undershoot as in the preceding two years
underscoring how extraordinary and intense ‘tail’
events, especially the food price dynamics, have
overwhelmed the trajectory of inflation in India.
The agenda for 2017-18 will be guided by the
mandate as enshrined in the RBI Act, 1934 “to
maintain price stability, while keeping in mind the
objective of growth’’. The materialisation of the path of monetary policy’s goal variable, viz., headline
consumer price inflation at 4.0 per cent with a ± 2
per cent tolerance band, and how it relates to the
conditional policy forecasts in numerical terms is
the recurring theme of the narrative of this chapter.
Even as inflation outcomes were falling off cliffs
during the year, the monetary policy framework
was undergoing a regime shift.
III.2 Parliament amended the RBI Act to accord
primacy to inflation as the goal of monetary policy
in India, while keeping in mind the objective of
growth. Subsequent notification in the Gazette
of India defined the goal. A Monetary Policy
Committee (MPC) was constituted and enjoined
to make the monetary policy decision under
explicitly laid out process of transparency and
accountability. The amended Act also required
the Reserve Bank to set out in the public domain
the operating procedure of monetary policy and
changes therein from time to time that would
secure the goals of monetary policy.
III.3 In accordance, a revised liquidity
management framework was implemented in April 2016 and published in the Monetary Policy
Report (MPR), which became a statutory bi-annual
requirement under the amended Act.
The operating framework of monetary policy was
further fine-tuned to enhance its effectiveness to
achieve the medium-term target of 4 per cent –
the centre of the target band – on a continuous
basis. Operations under this framework are
examined in the sub-section on The Operating
Framework: Liquidity Management especially in
the context of the exceptional swings in liquidity
that have characterised the year gone by. Issues
in the transmission of monetary policy impulses to
actual lending rates in the economy, particularly
those lost to structural impediments (Box III.1)
are addressed in sub-section on Monetary
Policy Transmission. Finally, the chapter sets out
an agenda that will guide the formulation and
implementation of monetary policy in 2017-18 in
pursuit of the mandate of price stability, keeping in
mind the objective of growth.
Agenda for 2016-17: Implementation Status
Monetary Policy
III.4 The first bi-monthly monetary policy
statement for 2016-17 issued in April was
formulated to subserve an accommodative
policy stance. The key policy repo rate was cut
by 25 bps to 6.5 per cent, its lowest since March
2011. Given the weak state of domestic demand
relative to potential, the policy rate reduction was
expected to help in reviving investment activity.
By the time of the second bi-monthly monetary
policy statement in June 2016, inflation readings
showed a sharper-than-anticipated upsurge,
driven primarily by food prices, interrupting the
phase of policy rate reductions signalled in April.
Accordingly, the policy rate was left unchanged
while persevering with an accommodative stance,
as further clarity from incoming data was awaited
on the evolving inflation trajectory.
III.5 Amendments to the RBI Act, which came
into force on June 27, 2016, provided the legislative
mandate to the Reserve Bank to operate the
monetary policy framework of the country with the
primary objective explicitly defined to “maintain
price stability while keeping in mind the objective
of growth”. While the monetary policy objective of
price stability has been explicitly specified in terms
of the commitment to meet the inflation target
based on the headline Consumer Price Index
(CPI), the factors that constitute a failure to achieve
the inflation target, i.e., if the average inflation is
more (less) than the upper (lower) tolerance level
for three consecutive quarters, have also been
defined and notified in the official Gazette. To
operationalise this mandate, the Government, on
August 5, 2016, notified the inflation target as four
per cent year-on-year growth in CPI-Combined
inflation, with upper and lower tolerance levels of
six per cent and two per cent, respectively.
III.6 The amended RBI Act also provided for
the constitution of a six member MPC. As per the
amended RBI Act, the MPC would be entrusted
with the task of fixing the benchmark policy rate
(repo rate) required to contain inflation within the
specified target level. Out of the six members of the
MPC, three members would be from the Reserve
Bank and the other three members would be
appointed by the central government. The three
external members would hold office for a period of
four years. The MPC is stipulated to hold meetings
at least four times a year. To ensure transparency
of the MPC proceedings, the amended RBI Act
prescribes for attributing the vote of each member
of the MPC. It also requires each member of the
MPC to write a statement specifying the reasons
for voting in favour of, or against the proposed
resolution. At the end of each meeting, the MPC
would publish the resolution adopted by the Committee. On the fourteenth day after every
meeting of the MPC, the minutes of the meeting
containing the resolution adopted at the meeting
of the MPC, the vote of each member of the MPC
ascribed to such member, and the statement of
each member of the MPC are required to be put out
in the public domain. In the case of failure to meet
the target, wherein the average inflation remains
more (less) than the upper (lower) tolerance level
of the inflation target for any three consecutive
quarters, the Reserve Bank would have to explain
in a report to the central government setting out
the reasons for failure to achieve the inflation
target; the remedial actions proposed to be taken
by the Reserve Bank; and an estimate of the time
period within which the inflation target would be
achieved.
III.7 The amended RBI Act also requires the
publication of MPR, once in every six months,
explaining the sources of inflation; and the
forecasts of inflation for the period between six
to eighteen months from the date of publication
of the document. The Reserve Bank has been
publishing the MPR since September 2014.
III.8 The third bi-monthly monetary policy
statement of August 2016 kept the policy repo rate
unchanged, assessing that risks to the inflation
target of 5 per cent for March 2017 still remained on
the upside, given the implications of the 7th Central
Pay Commission’s (CPC’s) award on inflation
trajectory and inflation expectations. Further,
uncertainty on trajectory of inflation excluding
food and fuel arose from the possibility of higher
input price pressures and whether the then benign
movement in crude prices would turn out to be
transient, feeding to output prices as output gap
continued to close. An upturn in inflation excluding
food and fuel on account of these factors, possibly
even counterbalancing the benefit of the expected easing of food inflation, was also highlighted by
the policy statement. However, the monetary
policy stance continued to be accommodative with
emphasis on pro-active liquidity management to
enable faster pass-through of the past policy rate
cuts to the banks’ MCLRs.
III.9 Under the new framework, the six-member
MPC constituted on September 29, 2016 met for
the first time on October 3 and 4, 2016 in the
context of the fourth bi-monthly monetary policy
statement. Observing that space had opened
up by the moderating trajectory of inflation,
underpinned by the supply side measures taken
by the Government, the MPC unanimously voted
for a reduction in the key policy rate by 25 bps. The
steady improvement in liquidity conditions from
deficit at the beginning of the year to surplus by July
2016, under the modified liquidity management
framework, helped transmit the policy rate
reduction to various segments of the market. The
MPC assessed that inflation would remain within 5
per cent by Q4 of 2016-17, though potential cost-push
pressures, including the impending 7th CPC’s
award on house rent allowances, and the increase
in minimum wages with potential spillovers to
minimum support prices, were flagged as upside
risks to inflation.
III.10 The MPC’s meeting of December 6 and
7, 2016 for the fifth bi-monthly monetary policy
statement was overcast by heightened uncertainty
around the outlook for growth and inflation in the
aftermath of demonetisation. In the MPC’s view,
short-run disruptions in economic activity in cash-intensive
sectors were likely to be transitory,
given the war-time drive launched by the Reserve
Bank to restore the pre-demonetisation stock
of currency in circulation by ramping up the
circulation of new currency notes, alongside
the greater usage of non-cash based payment instruments in the economy. The large surplus
liquidity following the demonetisation in November
2016, was also considered transitory in view
of liquidity management operations targeted at
restoring system-level liquidity to a position closer
to neutrality. Accordingly, the MPC unanimously
decided to keep policy repo rate unchanged, while
continuing with an accommodative policy stance.
III.11 In the sixth bi-monthly monetary policy
statement of February 8, 2017, the MPC judged
that growth would recover sharply in 2017-18 on
account of the following factors: (i) a resurgence
of discretionary consumer demand, held back
by demonetisation; (ii) quick revival of economic
activity in cash-intensive sectors; (iii) pick-up
in both consumption and investment demand
as the demonetisation-induced ease in bank
funding conditions leads to a sharp improvement
in transmission of past policy rate reductions into
MCLRs, and in turn, to lending rates for healthy
borrowers; and (iv) the positive impact on growth
of measures announced in the Union Budget for
2017-18 to step up capital expenditure, boost
the rural economy and affordable housing. The
MPC reiterated its commitment to bring headline
inflation closer to 4.0 per cent on a durable basis
and in a calibrated manner, noting that this required
further significant decline in inflation expectations.
While observing that the persistence of inflation
excluding food and fuel could set a floor on further
downward movements in headline inflation and
trigger second-order effects, the MPC indicated
that it needed more time to assess the manner in
which the transitory effects of demonetisation on
inflation and the output gap could play out. The
committee decided to change the policy stance
from accommodative to neutral while keeping the
policy rate on hold.
III.12 The headline inflation target of 5.0 per
cent for Q4 of 2016-17 undershot by around 140 bps largely driven by deflation in pulses and
vegetables. The sustained decline in food prices
since August 2016 has been unprecedented by
historical patterns. The initial drop in food prices
was driven by correction in prices of pulses and
vegetables in response to supply management
measures. Since November, collapse in vegetable
prices across the board was driven by demand
compression and fire sales of vegetables post
demonetisation in a scenario of high seasonal
supply. While the sharp decline in vegetable
prices was expected to be transitory as effects
of demonetisation fade, there was considerable
uncertainty on the timing and the strength of the
expected reversal, especially during the summer
months. Pulses were expected to remain soft on
the back of a sharp rise in production and imports.
III.13 In the first bi-monthly monetary policy
statement for 2017-18 of April 6, 2017, the MPC
held the policy repo rate unchanged at 6.25
per cent while persevering with a neutral policy
stance. The statement observed that although
CPI headline inflation fell to the then historic low
in January 2017 due to sharp moderation in food
inflation, inflation excluding food and fuel had
remained relatively sticky since September 2016
and was significantly above the headline inflation.
Though inflation was projected to be moderate
in the first half of the year, significant upside risks
remained in the form of uncertainty of monsoon,
implementation of allowances under the 7th CPC
even as moderation in crude prices and softening
of food prices could help contain inflation
impulses. Growth was projected to strengthen
to 7.4 per cent in 2017-18 from 6.7 per cent in
2016-17. As the output gap could gradually close,
aggregate demand pressures would build up, with
implications for the inflation trajectory, which was
projected to move up in the second half of the year. In this context, the MPC noted that the future
course of monetary policy would largely depend
on incoming data and evolving macroeconomic
conditions and underlined the need to closely and
continuously monitor inflation developments.
III.14 The second bi-monthly monetary policy
statement for 2017-18 of June 7, 2017 was
overshadowed by inflation falling below 4.0 per
cent in May 2017. While reiterating its commitment
to keep headline inflation close to 4.0 per cent on
a durable basis, the MPC took cognizance of the
unusual softening of headline inflation on account
of the sharp moderation in food inflation. inflation
projections were revised downwards to a range of
2.0-3.5 per cent in the first half of the year and
3.5-4.5 per cent in the second half of 2017-18. The
Committee noted that the risk of fiscal slippages,
which, by and large, could entail inflationary
spillovers, had risen with the announcements
of large farm loan waivers. This along with the
global, political and financial risks materialising
into imported inflation and the disbursement of
allowances under the 7th CPC’s award would be
the upside risks. Given, however, the uncertainty
surrounding the evolving inflation trajectory,
especially for the near months, the MPC was of the
view that premature monetary policy responses
risk disruptive policy reversals later and the loss
of credibility. The MPC’s resolution underlined
the need to revive private investment, restore
banking sector health and remove infrastructural
bottlenecks for monetary policy to play an effective
role. Accordingly, the MPC decided to keep the
policy repo rate unchanged at 6.25 per cent with
a neutral stance while remaining watchful of the
incoming data.
The Operating Framework: Liquidity Management
III.15 The operating framework of monetary
policy aims at aligning the operating target – the weighted average call rate (WACR) – with the policy
repo rate through proactive liquidity management
consistent with the stance of monetary policy.
Liquidity management during 2016-17 can
be heuristically categorised into two distinct
phases. First, active operations were launched to
progressively move the ex-ante liquidity position
in the system from deficit to closer to neutrality.
Second, managing the post-demonetisation surge
in surplus liquidity became an overriding priority,
warranting unorthodox instruments to augment
the arsenal of regular operations so as to prevent
excessive softening of money market rates under
the weight of the deluge of liquidity.
III.16 The liquidity management framework
was modified in April 2016 in the first phase. The
Reserve Bank proactively injected durable liquidity
of ₹2.1 trillion during the year up to November 8,
2016 (i.e., the pre-demonetisation period) in the
form of open market purchase operations, net forex
market operations, and buyback of government
securities. As a result, the system level ex-ante
liquidity position transited from a deficit of about
₹813 billion, on a daily average basis, in Q1 to a
surplus of ₹292 billion in Q2 and ₹64 billion in Q3
(up to November 8, 2016).
III.17 Two other changes under the modified
liquidity management framework worked in
combination to tightly anchor money market rates
with the policy rate. First, the cash reserve ratio
(CRR) maintenance requirement was reduced
to a daily minimum of 90 per cent from 95 per
cent earlier, which moderated banks’ holdings of
excess reserves. Second, the policy rate corridor
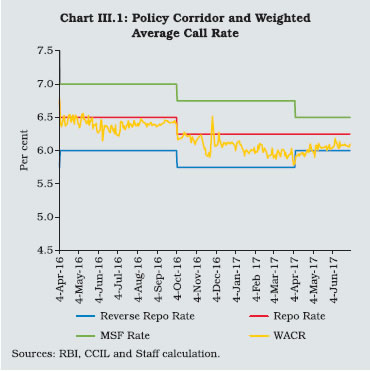
was narrowed to +/-50 bps on April 5, 2016, on the
back of assurance of both durable and frictional
liquidity. This narrowed the spread of WACR vis-à-vis
the repo rate and reduced its volatility (Charts
III.1 and III.2). The Reserve Bank also ensured front-loading of adequate liquidity proactively
in anticipation of potential pressure and market
concerns arising out of scheduled redemptions of
foreign currency non-resident (bank) [FCNR (B)]
deposits. As a result, liquidity turned into surplus
even prior to the announcement of demonetisation
on November 8, 2016.
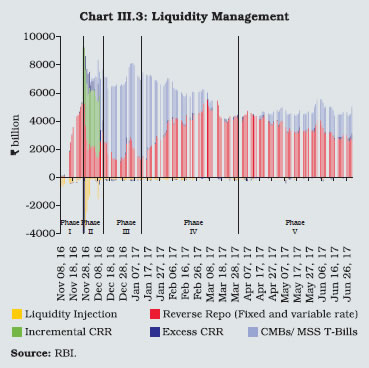
 III.18 With regard to the unprecedented surge
of surplus liquidity created by demonetisation, a
mix of instruments was employed by the Reserve
Bank at different points in time (Chart III.3).
Each instrument has distinct advantages and
disadvantages (Table III.1).
III.19 After demonetisation, currency in circulation
declined by about ₹8,997 billion (up to January 6,
2017), which resulted in a large increase in surplus
liquidity with the banking system, equivalent to a
cut in the CRR by about 9 per cent. This, in turn,
posed a formidable challenge to the Reserve
Bank’s liquidity management operations. Initially,
conventional instruments, especially reverse
repo auctions under the liquidity adjustment
facility (LAF) window, were deployed to absorb surplus liquidity. Recognising, however, that these
operations could potentially be constrained by the
finite stock of domestic securities available with
the Reserve Bank, a pre-emptive strategy was put
in place involving two unconventional measures.
 III.20 First, an incremental cash reserve ratio
(ICRR) of 100 per cent on the increase in net demand and time liabilities (NDTL) of banks
between September 16 and November 11,
2016 was applied. Second, the Government
was requested to enhance the limit of securities
issuable under the market stabilisation scheme
(MSS) to ₹6,000 billion from ₹300 billion. Open
market sales of cash management bills (CMBs)
issued under the MSS were undertaken (from
December 2, 2016 to January 13, 2017), which
marked a departure from the original intent of the
MSS of dealing with liquidity arising from surges in capital flows. The ICRR was withdrawn after
the Reserve Bank’s capacity to auction securities
expanded under the enhanced MSS limit.
| Table III.1: Advantages and Disadvantages of Instruments for Absorbing Surplus Liquidity |
| Instruments |
Advantages |
Disadvantages |
| Incremental cash reserve ratio |
Most effective in absorbing any amount of
surplus liquidity without being constrained by
collateral. |
Unremunerated and therefore a cost to
the banking system; not a market based
instrument. |
| Securities issued under the MSS |
This is a market based instrument and
suitable for absorbing liquidity for a longer
period relative to reverse repos under
the LAF. Market participants prefer this
instrument vis-à-vis reverse repo because of
liquidity of the underlying instrument. |
Requires timely consent of the Government
of India.
Can bid up yields due to repetitive auctions. |
| Open market (outright) operations – sales |
Key market based indirect instrument for
absorbing durable surplus liquidity; most
effective indirect instrument. |
Requires adequate stock of domestic
securities in the portfolio of the Reserve
Bank; large scale operations can potentially
influence yields that may not be consistent
with the stance of monetary policy. |
| Term reverse repo auctions |
Provide flexibility in terms of responding to
fast changing liquidity conditions on a daily
basis; rollover option; simultaneous auctions
of multiple tenor; can aid the development of
the term money market. |
Inadequate market appetite for longer-term
auctions; may not prevent significant easing
of WACR under persistently high surplus
liquidity conditions; domestic securities
available with the Reserve Bank can limit the
use of term reverse repo. |
| Fine tuning overnight reverse repo auctions |
Robust market appetite because of the ease
of rollover; ideal instrument for managing
frictional surplus liquidity. |
Not suitable for dealing with large durable
surplus; most effective not in isolation
but when used in conjunction with other
instruments. |
| Fixed rate reverse repo window (the floor of
the LAF corridor) |
Provides certainty to market participants
about the surplus liquidity to be parked
overnight at a rate that is known in advance.
As there is no limit on the amount that could
be parked, it prevents WACR falling below
the lower bound of the corridor. |
Extensive use can lead to excessive easing
of the WACR relative to the repo rate within
the LAF corridor; domestic securities
available with the Reserve Bank can limit
the amount of absorption; can lead to ‘lazy’
liquidity management by banks and thus
effectively shift the money market on to the
Reserve Bank’s balance sheet. |
III.21 With fast paced remonetisation, surplus
liquidity in the system declined by mid-January
2017. As a result, the Reserve Bank reverted to its
conventional instruments – reverse repo auctions
– and discontinued further issuances of MSS
securities from January 14, 2017. All outstanding
MSS securities matured by end-March 2017.
III.22 The post-demonetisation period has had
five different phases of liquidity management
(Chart III.3).
III.23 In the first phase (November 10 to
November 25, 2016), the Reserve Bank
extensively used variable rate reverse repos of
tenors ranging from overnight up to 91 days. The
outstanding amount of surplus liquidity absorbed
through reverse repos (both variable rate and
fixed rate auctions) reached a peak of ₹5,242
billion on November 25.
III.24 In the second phase (November 26 to
December 9, 2016), 100 per cent ICRR was
applied, which helped drain excess liquidity in the
system to the extent of about ₹4,000 billion.
III.25 In the third phase (December 10, 2016
to January 13, 2017), the surplus liquidity was
managed through a mix of reverse repos and
issuances of CMBs under the MSS, with a
gradually increased reliance on the latter. The
peak net outstanding liquidity absorbed was
₹7,956 billion on January 4, 2017 (₹2,568 billion
absorbed through reverse repos and ₹5,466 billion
through CMBs).
III.26 In the fourth phase (January 14 to end-
March 2017), the Reserve Bank returned to the
conventional reverse repo operations as the key
instrument to absorb surplus liquidity, particularly
the liquidity released through the maturing CMBs
under the MSS.
III.27 The usual year-end liquidity pressure
stemming from banks’ balance sheet adjustments
and tax payments to the government did not lead
to a very sharp spike in money market rates this
time around due to the large post-demonetisation
liquidity overhang. The absorption of liquidity
surplus using reverse repos (at both fixed and
variable rates) peaked at ₹5,522 billion on March
6, 2017. The surplus liquidity conditions continued in March, but net absorption of liquidity under
the LAF declined to ₹3,141 billion by end-March,
reflecting the build-up of cash balances by the
Government and higher excess CRR maintained
by banks.
III.28 In the fifth phase that began in April 2017
with the first auction of Treasury Bills (T-Bills)
under the MSS, surplus liquidity was managed
with a mix of issuance of T-Bills under the MSS
and reverse repo auctions. Anticipating that the
surplus liquidity conditions may persist through
2017-18, in April 2017 the Reserve Bank provided
guidance on liquidity, which contained the following
elements: (i) use of T- Bills and dated securities
under the MSS up to ₹1 trillion; (ii) issuances of
CMBs of appropriate tenors in accordance with
the memorandum of understanding (MoU) with
the Government of India to manage enduring
surpluses due to government operations up to
₹1 trillion; (iii) open market operations with a view
to moving system level liquidity to neutrality; and
(iv) fine tuning reverse repo/repo operations to
modulate day to day liquidity. The Reserve Bank
auctioned T-Bills (tenors ranging from 312 days to
329 days) aggregating ₹1 trillion in April and May
2017.
III.29 The WACR – the operating target of
monetary policy – traded at only about 15
basis points (bps) below the repo rate between
November 9, 2016 and January 13, 2017 and
about 27 bps below the repo rate on daily average
basis between January 14 and March 31, 2017.
While the WACR remained within the LAF
corridor, the large deviation of the WACR from the
policy repo rate during Q4 was mainly on account
of exclusive reliance on reverse repos to absorb
surplus liquidity arising out of maturing CMBs
(Chart III.4). After narrowing of the LAF corridor to
+/- 25 bps on April 6, 2017, the average spread of
WACR below the repo rate declined to 17 bps in June as compared with 31 bps and 21 bps in April
and May, respectively.
Monetary Policy Transmission
III.30 The Reserve Bank reduced the policy
repo rate by a cumulative 175 bps during January
2015 to June 2017. In response, banks reduced
their weighted average domestic term deposit
rate (WADTDR) by 126 bps during January
2015 to October 2016. The weighted average
lending rate (WALR) on fresh rupee loans and
outstanding rupee loans declined by 97 bps and
75 bps, respectively, during the same period. The
reduction in the WADTDR was significantly higher
than that in the lending rates (Table III.2).
III.31 Monetary transmission, however, improved
significantly post-demonetisation. Buoyed by the
surplus liquidity, the share of current account and
saving account (CASA) deposits in aggregate
deposits increased to 40.6 per cent as at end-March 2017 from 35.2 per cent at end-October
2016, before declining to 38.6 per cent on June 23,
2017 (Table III.3). As the cost of CASA deposits
(3.2 per cent) is significantly lower than the
WADTDR, the overall cost of borrowings declined,
enabling banks to cut their lending rates. Banks
also lowered their median term deposit rate by 56
bps during November 2016 to June 2017. As a
result, the WALR on fresh rupee loans declined
by 98 bps, while the WALR on outstanding rupee
loans declined by 42 bps (up to June 2017).
| Table III.2: Deposit and Lending Rates of SCBs (Excluding RRBs) |
| (Per cent) |
| End-Month |
Repo Rate |
Term Deposit Rates |
Lending Rates |
| Median Term
Deposit Rate |
WADTDR |
Median Base
Rate |
WALR -
Outstanding
Rupee Loans |
WALR - Fresh
Rupee Loans |
MCLR
1- Yr Median |
| 1 |
2 |
3 |
4 |
5 |
6 |
7 |
8 |
| Dec-2014 |
8.00 |
7.53 |
8.64 |
10.25 |
11.84 |
11.45 |
- |
| Mar-2015 |
7.50 |
7.49 |
8.57 |
10.20 |
11.76 |
11.07 |
- |
| Mar-2016 |
6.75 |
6.81 |
7.73 |
9.65 |
11.20 |
10.47 |
- |
| Apr-2016 |
6.50 |
6.65 |
7.64 |
9.65 |
11.23 |
10.59 |
9.45 |
| June-2016 |
6.50 |
6.63 |
7.59 |
9.65 |
11.19 |
10.43 |
9.45 |
| Sep-2016 |
6.50 |
6.52 |
7.41 |
9.65 |
11.13 |
10.35 |
9.35 |
| Oct-2016 |
6.25 |
6.54 |
7.38 |
9.64 |
11.09 |
10.48 |
9.30 |
| Dec-2016 |
6.25 |
6.22 |
7.19 |
9.64 |
11.07 |
10.12 |
9.15 |
| Mar-2017 |
6.25 |
6.15 |
6.97 |
9.55 |
10.80 |
9.74 |
8.60 |
| May-2017 |
6.25 |
6.08 |
6.86 |
9.50 |
10.66 |
9.84 |
8.55 |
| June-2017 |
6.25 |
5.98 |
6.81 |
9.50 |
10.67 |
9.50 |
8.53 |
| Variation (Percentage Points) |
|
|
|
|
|
|
|
| Oct-16 over Dec-14 |
-1.75 |
-0.99 |
-1.26 |
-0.61 |
-0.75 |
-0.97 |
- |
| Oct-16 over Mar-16* |
-0.50 |
-0.27 |
-0.35 |
-0.01 |
-0.11 |
0.01 |
-0.15 |
| Jun-2017 over Oct-16 |
0.00 |
-0.56 |
-0.57 |
-0.14 |
-0.42 |
-0.98 |
-0.77 |
WADTDR: Weighted Average Domestic Term Deposit Rate. WALR: Weighted Average Lending Rate.
MCLR was introduced on April 1, 2016.
*: For MCLR, the period pertains to October 2016 over April 2016.
Source: Special Monthly Return VIAB, RBI and banks’ websites. |
| Table III.3: Share of CASA Deposits in Aggregate Deposits |
| (Amount in ₹ billion) |
| Fortnight ended |
Demand Deposits@ |
Time Deposits@ |
Saving Deposits |
Aggregate Deposits |
Share of CASA Deposits (in per cent) |
| 1 |
2 |
3 |
4 |
5 |
6 |
| 18-Mar-16 |
6,874 |
59,530 |
23,930 |
90,333 |
34.1 |
| 28-Oct-16 |
7,175 |
62,295 |
26,673 |
96,143 |
35.2 |
| 31-Mar-17 |
10,135 |
61,774 |
32,022 |
1,03,931 |
40.6 |
| 23-Jun-17 |
8,356 |
62,586 |
31,034 |
1,01,976 |
38.6 |
@: Net of liabilities from saving account.
Source: Section 42 Banking Data, RBI. |
III.32 It is significant that the one-year median
MCLR declined by a cumulative 77 bps from
November 2016 to June 2017 even when the policy
rate was unchanged. This is in sharp contrast to
the decline in the median one-year MCLR by just 15 bps during the preceding seven months when
the policy rate was cut by 50 bps. The largest
reduction in MCLR post-demonetisation was
effected by public sector banks, followed by private
sector banks and foreign banks (Chart III.5).
Sectoral Lending Rates
III.33 Transmission was asymmetric across
sectors, reflecting varied credit conditions and
risk appetite. Since January 2015, lending rates
across sectors, barring credit card segment,
declined in the range of 15-238 bps, with the
largest transmission taking place in the case of
Rupee export credit (Table III.4).
III.34 Interest rates on fresh rupee loans declined
significantly in respect of housing in personal loan segment and vehicle loans in the commercial
segment during January 2015 to June 2017
(Table III.5).
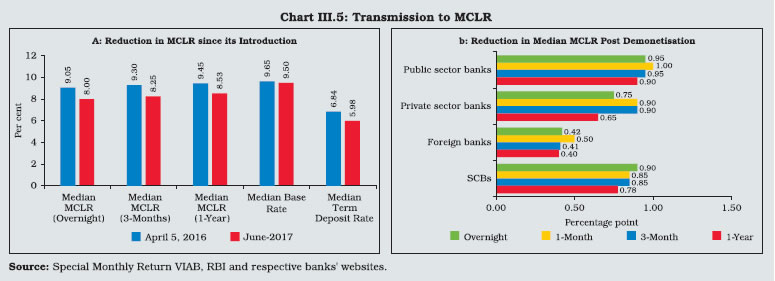
Table III.4: Sector-wise WALR of SCBs (Excluding RRBs) - Outstanding Rupee Loans
(at which 60 per cent or more business is contracted) |
| (Per cent) |
| End-Month |
Rupee Export Credit |
Trade |
Industry (Large) |
Profes- sional Services |
Infra- struc- ture |
Personal- Other@ |
Personal Education |
MSMEs |
Personal Housing |
Personal Vehicle |
Agricul-
ture |
Per- sonal Credit Card |
| 1 |
2 |
3 |
4 |
5 |
6 |
7 |
8 |
9 |
10 |
11 |
12 |
13 |
| Dec-14 |
12.16 |
13.09 |
12.95 |
12.39 |
13.05 |
14.24 |
12.90 |
13.05 |
10.76 |
11.83 |
10.93 |
37.86 |
| Mar-15 |
12.04 |
13.07 |
12.80 |
12.46 |
12.89 |
13.94 |
12.87 |
12.91 |
10.99 |
11.62 |
10.96 |
37.88 |
| Mar-16 |
11.46 |
12.50 |
12.36 |
11.81 |
12.06 |
13.90 |
12.48 |
12.25 |
10.56 |
11.65 |
10.74 |
38.00 |
| Jun-16 |
11.17 |
11.99 |
12.17 |
11.64 |
12.20 |
13.96 |
12.32 |
12.08 |
10.50 |
11.39 |
10.77 |
38.26 |
| Sep-16 |
10.54 |
11.91 |
11.68 |
11.65 |
12.07 |
12.89 |
12.09 |
12.18 |
10.01 |
11.46 |
10.91 |
39.07 |
| Oct-16 |
10.78 |
11.86 |
11.64 |
11.56 |
11.89 |
12.98 |
12.40 |
12.23 |
10.00 |
11.45 |
10.88 |
39.01 |
| Dec-16 |
10.61 |
11.78 |
11.63 |
11.49 |
11.78 |
13.11 |
11.95 |
12.03 |
9.95 |
11.24 |
10.86 |
38.84 |
| Mar-17 |
10.98 |
11.59 |
11.57 |
11.21 |
11.80 |
12.85 |
11.70 |
11.88 |
9.78 |
11.05 |
10.95 |
39.02 |
| May-17 |
10.61 |
11.36 |
11.44 |
10.97 |
11.94 |
12.97 |
11.79 |
11.73 |
9.75 |
11.00 |
10.81 |
38.93 |
| Jun-17 |
9.78 |
11.41 |
11.28 |
10.91 |
11.59 |
12.85 |
11.53 |
11.75 |
9.59 |
10.87 |
10.78 |
38.88 |
| Variation (Percentage Points) |
|
|
|
|
|
|
|
|
|
|
|
| Jun-17 over Dec-14 |
-2.38 |
-1.68 |
-1.67 |
-1.48 |
-1.46 |
-1.39 |
-1.37 |
-1.30 |
-1.17 |
-0.96 |
-0.15 |
1.02 |
| Jun-17 over Oct-16 |
-1.00 |
-0.45 |
-0.36 |
-0.65 |
-0.39 |
-0.13 |
-0.87 |
-0.48 |
-0.41 |
-0.58 |
-0.10 |
-0.13 |
@: Other than housing, vehicle, education and credit card loans.
Source: Special Monthly Return VIAB, RBI. |
| Table III.5: WALR of Select Sectors of SCBs
(Excluding RRBs) - Fresh Rupee
Loans Sanctioned |
| (Per cent) |
| End-Month |
Personal |
Commercial |
| Housing |
Vehicle |
Housing |
Vehicle |
| 1 |
2 |
3 |
4 |
5 |
| Dec-14 |
10.53 |
12.28 |
11.73 |
12.53 |
| Mar-15 |
10.47 |
12.42 |
12.04 |
12.30 |
| Mar-16 |
9.78 |
11.98 |
11.14 |
11.21 |
| Jun-16 |
9.64 |
11.79 |
10.53 |
11.49 |
| Sep-16 |
9.58 |
11.79 |
10.94 |
11.73 |
| Oct-16 |
9.55 |
11.50 |
10.70 |
11.79 |
| Dec-16 |
9.50 |
11.13 |
10.59 |
11.17 |
| Mar-17 |
8.94 |
10.77 |
10.03 |
10.24 |
| May-17 |
8.93 |
10.97 |
10.05 |
11.21 |
| Jun-17 |
8.99 |
10.81 |
10.42 |
10.83 |
| Variation (Percentage Points) |
|
|
|
| Jun-17 over Dec-14 |
-1.54 |
-1.47 |
-1.31 |
-1.70 |
| Jun-17 over Oct-16 |
-0.56 |
-0.69 |
-0.28 |
-0.96 |
| Source: Special Monthly Return VIAB, RBI. |
III.35 The pace of transmission to lending rates
was significantly slower than to deposit rates and
the MCLR on account of several factors. First,
banks treated the increase in CASA deposits as
transitory. The share of CASA deposits, which
had peaked in December 2016, declined with
progressive remonetisation; consequently, banks
were reluctant to adjust their lending rates fully.
Second, a sizeable share of past loans continues
to be priced with reference to the base rate. As
against a cumulative decline of 85 bps in the
1-year median MCLR during 2016-17, the median
base rate declined by only 10 bps over the same
period, resulting in a slower pace of transmission
to WALR on outstanding rupee loans. Third,
among the various components of the MCLR, only
the term deposit rates responded to the change in
the policy rate. Fourth, the higher lending spread
maintained by banks in the wake of stressed
asset quality of banks impeded transmission (Box III.1). Fifth, administered interest rates on
small savings have not moved adequately in line
with underlying changes in yields on government securities to which they are to be linked for
quarterly resetting. Going forward, greater liquidity
across various segments and maturity spectrum of financial markets, particularly, term money
and corporate bond markets, could facilitate
emergence of an external benchmark for pricing
of credit, contributing to speedier monetary policy
transmission.
Box III.1
MCLR, Lending Rates and Health of the Banking Sector
The MCLR system, introduced in April 2016, was expected
to improve monetary policy transmission to banks’ lending
rates. Preliminary evidence suggests that while transmission
of the policy rate to MCLR has improved, the transmission
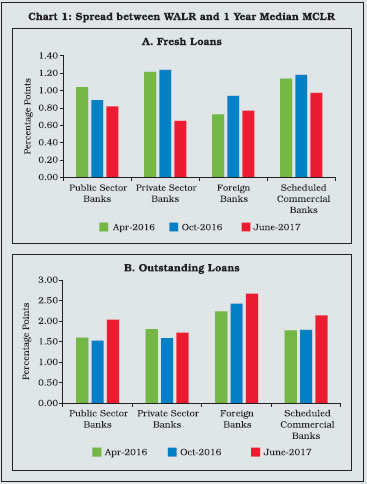
to lending rates has remained muted. This is because banks
often adjust the spread they charge over MCLR – both in
respect of the outstanding rupee loans and fresh rupee loans
sanctioned by banks (Chart 1). An inter-sectoral comparison
reveals that the spread between WALR and 1-year median
MCLR increased across most sectors during 2016-17
(Table 1). While some change in the spread is inevitable
due to sector-specific factors and the underlying risk, banks
appeared to have also changed spreads to improve their
net interest margins (NIMs), i.e., the difference between
interest income and interest expenditure, to compensate for
increased credit risk.
Regression analysis based on the data for the period
Q1:2010-11 to Q3:2016-17 suggests that an increase in stressed assets1 is associated with higher NIMs (Raj, et
al, 2017)2. The foreign banks that experienced increase in
stressed assets from relatively lower levels were also able
to increase their NIMs. The coefficient of stressed assets
in respect of public and private sector banks is positive but
statistically insignificant (Table 2).
| Table 1: Spread between WALR and 1-Year Median MCLR |
| (Basis Points) |
| Sector |
Apr-16 |
Mar-17 |
Jun-17 |
| Agriculture |
128 |
235 |
225 |
| Industry (Large) |
287 |
297 |
275 |
| MSMEs |
284 |
328 |
322 |
| Infrastructure |
281 |
320 |
306 |
| Trade |
307 |
299 |
288 |
| Professional Services |
230 |
261 |
238 |
| Personal Housing |
110 |
118 |
106 |
| Personal Vehicle |
220 |
245 |
234 |
| Education |
297 |
310 |
300 |
| Credit Card |
2891 |
3042 |
3035 |
| Rupee Export Credit |
180 |
238 |
125 |
| Source: Special Monthly Return VIAB, RBI. |
| Table 2: Determinants of Net Interest Margin |
| Variables |
Public Sector Banks |
Private Sector Banks |
Foreign Banks |
SCBs |
| 1 |
2 |
3 |
4 |
5 |
| NIM(-1) |
0.785* |
0.650* |
0.521* |
0.568* |
| Stressed Assets |
0.002 |
0.005 |
0.023* |
0.008* |
| CRAR |
-0.005 |
0.003 |
0.002** |
0.003* |
| Credit Growth |
0.000 |
-0.001 |
0.0003** |
0.0002** |
| Operating Expense |
0.213* |
0.296* |
0.128** |
0.162* |
*: Significant at 1 per cent level; **: Significant at 5 per cent level.
Notes:
Model Specification: Arellano-Bover/Blundell-Bond dynamic panel-data regression-System GMM with bank fixed effects.
NIM = (Interest income minus interest expense) to total assets (in per cent).
Stressed assets = (Restructured assets plus gross NPAs) to total assets (in per cent).
The regressions are controlled for seasonality, credit growth, bank size, capital adequacy, return on assets, operating expense, non-interest income,
investment in SLR securities, GVA growth and inflation.
Hansen test for over identification restrictions and Arellano-Bond test for residual auto correlations are found to be satisfactory.
Source: Supervisory Returns, RBI. |
Reference:
Raj, Janak, D.P. Rath, A. K. Mitra and J. John (2017), “Banks’ Health and Monetary Transmission”, Reserve Bank of India, mimeo. |
Agenda for 2017-18
III.36 The agenda for 2017-18 will be guided by
the mandate as enshrined in the RBI Act, 1934 “to
maintain price stability, while keeping in mind the
objective of growth’’. The key agenda for 2017-18,
therefore, will focus on studying those aspects,
which may have a significant bearing on inflation
projections going forward. This will include: (i)
examining the impact of implementation of the
7th CPC’s award on inflation; (ii) assessing the
impact of GST on inflation; (iii) analysing the
impact of farm loan waivers on the fiscal situation
and inflation; and (iv) assessing the output
gap position incorporating financial conditions
and infrastructure constraints. The agenda will
also include studies on inflation such as: (i) a reassessment of the Phillips curve relationship in
India; (ii) an analysis of food inflation in the recent
period – particularly in terms of behaviour of
perishables; and (iii) an assessment of exchange
rate pass-through.
III.37 Data suggest that investment has remained
depressed despite significant monetary easing
and pass-through of such easing to bank lending
rates. Capacity utilisation has also remained
below the long-term trend. In this backdrop, a
study will be conducted to analyse factors that
have impacted investment activity and capacity
utilisation.
III.38 The GST in India has been implemented
from July 01, 2017. This is expected to remove
distortions and improve productivity. A study will
be conducted to assess the impact of GST on
growth, including the second order effects.
III.39 The MCLR introduced in April 2016 has not
performed as expected. Although the introduction
of MCLR resulted in better transparency on fixing of lending rates by banks vis-à-vis the base
rate system, banks have frequently adjusted
the spreads, thereby impeding transmission
to the actual lending rates. A detailed inter-departmental
study will be conducted to examine
various aspects of MCLR with a view to bringing
necessary refinements and exploring market rates
as alternative benchmarks.
III.40 An effective monetary transmission is the
key to successful implementation of monetary
policy. In this context, the following studies will
be conducted. First, post-demonetisation, there
have been large swings in liquidity. A study will be
conducted to assess the impact of liquidity swings
on the transmission of monetary policy impulses.
Second, the poor health of the banking sector
has been a matter of concern. This appears to
have impacted monetary transmission as banks
have either not responded adequately to cuts in
the policy rate or did not cut their lending rates.
A detailed study will be conducted to assess
whether banks’ poor health has impeded monetary transmission. Third, the Basel III liquidity coverage
ratio (LCR) was introduced in a phased manner
beginning January 2015. In order to ensure the
smooth implementation, the Reserve Bank has
allowed a carve out of 11.0 per cent of statutory
liquidity ratio (SLR). The Reserve Bank has also
reduced SLR to provide flexibility to banks to meet
the LCR norms by January 2019 when banks have
to reach the minimum LCR of 100 per cent. The
initial experience suggests that the introduction
of LCR has altered banks’ activity in the call
money market in the post-LCR regime. A study
will be undertaken to assess as to whether the
introduction of the LCR has impacted monetary
transmission.
III.41 As surplus liquidity is expected to pose
a challenge, especially in the first half of 2017-
18, the Reserve Bank will endeavour to manage
liquidity using multiple instruments available at
its disposal. However, the use of any particular
instrument will be situation-specific with the sole
objective of ensuring closer alignment of the
operating target to the policy repo rate.
|