The Reserve Bank successfully managed the market borrowing requirements of the central and state governments
during 2016-17 in an orderly manner in the face of multiple challenges such as glide path for reduction in
Held to Maturity(HTM) category and Statutory Liquidity Ratio(SLR), supply concerns over increased state
government issuances, issuances of UDAY bonds and global uncertainties. The borrowing programme was
conducted in line with the debt management strategy of low cost, risk mitigation and market development
while factoring in domestic as well as global economic and financial conditions. The maturity profile of dated
securities was elongated to contain rollover risk while lowering overall borrowing cost, keeping risk at prudent
levels. Despite volatility triggered by both domestic and global factors during the year, G-sec yields witnessed
significant softening, particularly after demonetisation in November 2016 and the consequent surplus liquidity
of the banking system. However, the yields hardened in February 2017 in response to shift in the monetary policy
stance from accommodative to neutral. The agenda for 2017-18 includes elongation of maturity profile of
government debt and widening the bouquet of products for diverse investors.
VII.1 The Internal Debt Management
Department of the Reserve Bank manages
the domestic debt of the central government by
statute vide Sections 20 and 21 of the RBI Act,
1934 and that of 29 state governments and the
Union Territory of Puducherry in accordance with
bilateral agreements, as provided in Section 21A
of the said Act. The Reserve Bank also provides
short-term credit up to three months to both
central and state governments in the form of Ways
and Means Advances (WMA) to bridge temporary
mismatches in their cash flows in terms of Section
17(5) of the Act.
Agenda for 2016-17: Implementation Status
VII.2 During the year, the Reserve Bank
successfully managed the borrowing programme
of the central government and state governments,
notwithstanding multiple challenges in the form of
the glide path for reduction in HTM category of
banks’ investment portfolio and SLR requirements
and supply concerns over increased issuances by state governments, including Ujwal DISCOM
Assurance Yojana (UDAY) bonds. The borrowing
programme of the central government in 2016-17,
was conducted in accordance with the overall debt
management strategy of low cost, risk mitigation
and market development, while factoring in
domestic and global economic and financial
conditions. In line with the above objectives, a
strategy of active consolidation through buyback/
switches was adopted and debt to the extent of
₹641.33 billion and ₹405.10 billion was bought back
and switched, respectively. This had a salutary
effect on the weighted average maturity of central
government debt. To widen retail investments,
access was given to individuals under the non-competitive
bidding in the primary auction of
Treasury Bills (T-Bills). Following the deliberations
by the Cash Co-ordination Committee comprising
officials of the Reserve Bank and the Government
of India (GoI), GoI issued guidelines towards better
information sharing and cash flow forecasting.
VII.3 With a view to increasing acceptability
of the Sovereign Gold Bond (SGB) scheme and
widening the investor base of SGBs, the scheme
was modified suitably. The minimum subscription
amount was reduced to one gram of gold, a
discount of ₹50 offered on the face value of the
security and the number of receiving agencies
increased to include stock exchanges.
VII.4 As part of the ongoing endeavour to
consolidate the debt in State Development Loans
(SDLs) through buyback, the state of Maharashtra
repurchased its high cost debt. Further, the
states that do not maintain reserves in the form
of consolidated sinking fund (CSF) and guarantee
redemption fund (GRF) were encouraged to do so
as a prudent risk management measure.
VII.5 Government securities (G-sec) yields
witnessed significant softening during the
year, particularly after demonetisation and the
consequent surplus liquidity in the banking system.
The yields, however, hardened in February 2017
in response to the shift in monetary policy stance
from accommodative to neutral. The benchmark
yield softened thereafter on lower inflation data,
FPI buying and expectations of normal monsoon.
Debt Management of the Central Government
VII.6 The Reserve Bank in consultation with GoI
followed a strategy of front loading of issuances,
but modulated its market borrowings from the
budget estimates during the fourth quarter,
reducing thereby, the supply of sovereign paper in
the market. As against gross market borrowings of
₹6,000 billion through dated securities proposed
in the Union Budget 2016-17, the actual amount
mobilised was modulated to ₹5,820 billion on
the back of higher surplus cash balances of
the central government. Net market borrowings
through dated securities amounted to ₹4,082
billion in 2016-17, registering a decline of 7.4 per cent and financing 76.4 per cent of the gross
fiscal deficit (GFD), as against 82.0 per cent in
the previous year. On the other hand, net short
term market borrowings through T-Bills increased
to ₹186 billion during 2016-17 from ₹152 billion in
2015-16 mainly due to higher issuances in H1 of
2016-17. In the aggregate, however, net market
borrowing through dated securities and T-Bills
declined by ₹291 billion to ₹4,268 billion in
2016-17 (Table VII.1).
| Table VII.1: Net Market Borrowings of the
Central Government |
| (₹ billion) |
| Item |
2014-15 |
2015-16 |
2016-17 |
2017-18* |
| 1 |
2 |
3 |
4 |
5 |
| Net Borrowings |
4635 |
4559 |
4268 |
2517 |
| (i) Dated Securities |
4,532 |
4,406 |
4,082 |
1312 |
| (ii) 91-day T-Bills |
32 |
39 |
245 |
885 |
| (iii) 182-day T-Bills |
9 |
5 |
57 |
26 |
| (iv) 364-day T-Bills |
62 |
109 |
-115 |
5 |
| *: Up to June 30, 2017. |
Debt Management Operations
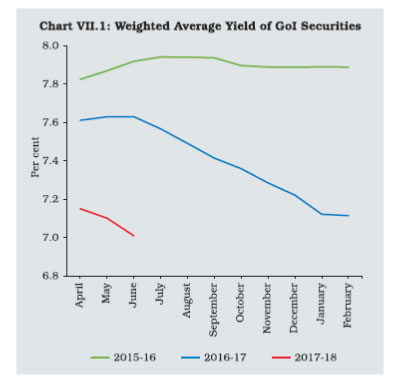
VII.7 The weighted average yield (WAY) of
dated securities of central government issued
during the year declined by 73 bps to 7.16 per
cent in 2016-17 while the weighted average
coupon (WAC) on the outstanding stock of
dated securities declined by 9 bps to 7.99 per
cent as on March 31, 2017. The declining trend
in yield continued in 2017-18 so far (upto June
30) reflecting benign market conditions and
increased liquidity (Chart VII.1).
 VII.8 The weighted average maturity (WAM)
of the outstanding stock increased marginally to
10.65 years as at end-March 2017 (Table VII.2).
However, the WAM of issuances during 2016-17
declined by 1.27 years to 14.76 years, reflecting
relatively larger issuances in the maturity buckets
below 19 years. The Reserve Bank continued
its policy of passive consolidation by way of
reissuances and active consolidation through buyback/switches. Out of 164 auctions, 156
were reissuances during the year. Buyback/
switches amounted to ₹1,046 billion in 2016-17
as compared to ₹611 billion in the previous year.
Furthermore, the share of issuances in the two
long maturity buckets declined from 38 per cent
in 2015-16 to 29 per cent in 2016-17, mirroring
the relatively muted demand for long bonds.
VII.9 During 2016-17, the residual maturity of 59
per cent of the market borrowings through dated
securities was 10 years and beyond, as compared with 66 per cent during the previous year, mirroring
an increase in the share of maturities less than 10
years (Table VII.3). With the objective of catering
to the demand for long term investors such as
insurance companies and pension funds, 30 and
35-year tenor bonds were issued during the year.
Primary Dealers and Devolvement
VII.10 The elevated supply of SDLs, including
UDAY bonds during 2016-17 resulted in
devolvement of central government securities on
Primary Dealers (PDs) on four instances for an
aggregate amount of ₹53 billion, as compared with
devolvement of ₹110 billion during the previous
year. The share of the PDs in the subscription to
primary auctions of central government securities
stood at 47.6 per cent in 2016-17, down from 54.2
per cent in 2015-16. The underwriting commission
paid to PDs during 2016-17 declined to ₹0.357
billion from ₹0.471 billion during 2015-16, mainly
on account of ample liquidity conditions. There was
only a single instance of devolvement amounting
to ₹32 billion in Q1 of 2017-18. All the standalone
PDs complied with their target commitments
in auction bidding, secondary market turnover
targets and continued to maintain capital to risk
weighted assets ratio (CRAR) above the minimum
requirement of 15 per cent.
| Table VII.2: Market Loans of Central Government – A Profile* |
| (Yield in per cent /Maturity in years) |
| Years |
Range of YTMs at Primary Issues |
Issued during the Year |
Outstanding stock |
| Under 5 years |
5-10 years |
Over 10 years |
Weighted
Average
Yield |
Range of
Maturities of
New Loans |
Weighted
Average
Maturity |
Weighted
Average
Maturity |
Weighted
Average
Coupon |
| 1 |
2 |
3 |
4 |
5 |
6 |
7 |
8 |
9 |
| 2012-13 |
8.21-8.82 |
7.86-8.76 |
7.91-8.06 |
8.36 |
5-30 |
13.50 |
9.66 |
7.97 |
| 2013-14 |
7.22-9.00 |
7.16-9.40 |
7.36-9.40 |
8.41 |
6-30 |
14.23 |
10.00 |
7.98 |
| 2014-15 |
- |
7.66-9.28 |
7.65-9.42 |
8.51 |
6-30 |
14.66 |
10.23 |
8.08 |
| 2015-16 |
- |
7.54-8.10 |
7.59-8.27 |
7.89 |
6-40 |
16.03 |
10.50 |
8.08 |
| 2016-17 |
- |
6.13-7.61 |
6.46-7.87 |
7.16 |
5-40 |
14.76 |
10.65 |
7.99 |
| 2017-18# |
- |
6.52-6.95 |
6.74-7.53 |
7.01 |
6-39 |
14.99 |
10.67 |
7.95 |
| Note: YTM: Yield to Maturity; #: Up to June 30, 2017; -: No issues; *: excluding buyback/switch in GoI securities and special securities. |
| Table VII.3: Issuance of Government of India Dated Securities – Maturity Pattern |
| (Amount in ₹ billion) |
| Residual Maturity |
2014-15 |
2015-16 |
2016-17 |
2017-18* |
| Amount
raised |
Percentage
to total |
Amount
raised |
Percentage
to total |
Amount
raised |
Percentage
to total |
Amount
raised |
Percentage
to total |
| 1 |
2 |
3 |
4 |
5 |
6 |
7 |
8 |
9 |
| Less than 5 years |
- |
- |
- |
- |
180 |
3.1 |
- |
- |
| 5 -9.99 years |
2,350 |
39.7 |
2,000 |
34.2 |
2,220 |
38.1 |
880 |
44.7 |
| 10-15.99 years |
1,510 |
25.5 |
1,600 |
27.4 |
1,710 |
29.4 |
519 |
26.4 |
| 16 -19.99 years |
960 |
16.2 |
1,120 |
19.1 |
820 |
14.1 |
250 |
12.7 |
| 20 years & above |
1,100 |
18.6 |
1,130 |
19.3 |
890 |
15.3 |
320 |
16.3 |
| Total |
5,920 |
100.0 |
5,850 |
100.0 |
5,820 |
100.0 |
1,969 |
100.0 |
| *: As on June 30, 2017; -: No Issues. |
Ownership of Securities
VII.11 The outstanding dated securities of central
government registered 8.4 per cent year-on-year
growth in 2016-17. Commercial banks, including
the PD segment remained the largest holder with
40 per cent share as at end-March 2017, followed
by insurance companies with a share of 22.9 per
cent. The Reserve Bank held 14.7 per cent while
provident funds held 6.3 per cent.
Sovereign Gold Bond Scheme
VII.12 The Reserve Bank successfully managed
the issuances of SGBs during 2016-17.
Four tranches of SGBs for an aggregate amount
of ₹34.69 billion (11.44 ton) were issued during
the year. Since the inception of the scheme in
November 2015, a total of ₹60.29 billion (20.73
ton) has been mobilised and SGBs have been
allotted to approximately 1.4 million retail investors
including the issuances of two tranches in (May
and July) 2017-18.
Medium Term Debt Management Strategy (MTDS)
VII.13 The MTDS was formulated as a debt
management framework in 2015, in consultation
with the Government of India, for a period of three
years and rolled over each year. It is premised on three broad pillars: low cost, risk mitigation and
market development. The MTDS, which is in line
with international best practices, calibrates certain
benchmarks on the composition of debt in terms
of short and long term, floating and fixed rate, and
maturity of debt. It also stipulates stress tests and
scenario analysis in relation to costs, maturity and
potential risks. The debt of the central government
has been reviewed against the MTDS benchmarks
and found to be stable and sustainable.
Treasury Bills
VII.14 With a view to encouraging wider
participation and retail holding of T-Bills and in
line with the first bi-monthly monetary policy
statement of 2015-16, the central government in
consultation with the Reserve Bank, extended
the non-competitive bidding facility in T-Bills to
retail investors up to a ceiling of 5 per cent of the
notified amount. As mentioned earlier, net market
borrowings through T-Bills increased during 2016-17. The yields on T-Bills largely mimicked the
declining trend in the yields of dated securities
in 2016-17. Reflecting the increase in appetite
for T-Bills from market participants, the Primary
Dealers’ share in T-Bills auctions declined to 74.4
per cent from 75.4 per cent during 2015-16. The
PDs individually achieved the stipulated minimum success ratio of 40 per cent in bidding while the
success ratio of the PD system as a whole was
58.8 per cent and 60.0 per cent during H1 and H2,
respectively, of 2016-17.
Market Stabilisation Scheme (MSS)
VII.15 With a view to absorbing excess liquidity
in the banking system following demonetisation
in November 2016, the limit for the MSS was
increased. Under MSS, the total amount of cash
management bills (CMBs) issued, for tenors
ranging from 14 to 63 days, amounted to ₹10,115
billion, with associated interest outgo of ₹57
billion. During 2017-18 (up to June 30), T-Bills
issued under MSS for tenors ranging from 312 to
329 days amounted to ₹1,000 billion.
Pradhan Mantri Garib Kalyan Deposit Scheme
(PMGKDS)
VII.16 In the wake of demonetisation, the central
government launched the PMGKDS on December
17, 2016, as a tax amnesty scheme available from
December 17, 2016 to March 31, 2017. Under
this scheme, the deposits are held at the credit of
the declarant of tax in the bonds ledger account
(BLA) maintained with the Reserve Bank and a
certificate of holding is issued to the declarant.
Deposits mobilised under this scheme amounted
to ₹12.4 billion.
Cash Management of the Central Government
VII.17 The WMA limits for the central government
for the first and the second halves of 2016-17
were increased each by ₹50 billion to ₹500 billion
and ₹250 billion, respectively. The government
was in WMA for 26 days during 2016-17
vis-à-vis 15 days during the previous year.
The accommodation to the central government
under WMA was ₹1,567 billion during 2016-17
as compared with ₹838 billion in 2015-16. The
government resorted to overdraft (amounting to
₹68 billion) only once during the year on July 5, 2016. The government’s cash position improved
subsequently, mainly on account of increased
tax flows and higher investments in intermediate/
auction treasury bills (ITBs/ATBs) by state
governments (Chart VII.2).
 VII.18 With the advancement of budget
presentation this year, the government units have
started to frontload expenditure, unlike in the
previous years. This combined with low net tax
receipts and large redemption pressure in the first
quarter of 2017-18, caused the cash balances of
the central government to move into prolonged
periods of deficit, warranting issue of CMBs of
₹1,300 billion during the Q1 of 2017-18. The switch
operations undertaken in January, March and
June 2017 helped in easing the stress in the cash
balances to a certain extent. The WMA limit for
the first quarter of 2017-18 was set at ₹600 billion
while the same for the second quarter would be
₹700 billion.
Debt Management of State Governments
VII.19 The gross market borrowings of the
state governments amounted to ₹3,820 billion in 2016-17 as compared with ₹2,946 billion in the
previous year (Table VII.4).
| Table VII.4: Market Borrowings of States through SDLs |
| (₹ billion) |
| Item |
2014-15 |
2015-16 |
2016-17 |
2017-18* |
| 1 |
2 |
3 |
4 |
5 |
| Maturities during the year |
334 |
352 |
393 |
74 |
| Gross sanction under article 293(3) |
2,435 |
3,060 |
4,000 |
2,980 |
| Gross amount raised during the year |
2,408 |
2,946 |
3,820 |
650 |
| Net amount raised during the year |
2,075 |
2,594 |
3,427 |
576 |
| Amount raised during the year to total sanctions (per cent) |
99 |
96 |
96 |
22 |
| Outstanding liabilities (at the end period)# |
12,757 |
16,389 |
20,896 |
21,472 |
| # Including UDAY and other special securities; *: Up to June 30, 2017. |
VII.20 The WAY of state government securities
issued during 2016-17 stood lower at 7.48 per
cent than that of 8.28 per cent in the previous year.
Despite softening of yield across securities, the
weighted average spread of SDL issuances over
the comparable central government securities
increased to 60 bps from 50 bps in 2015-16.
The inter-state spread which was on an average
in the range of 7 bps in 2016-17 same as in the
previous year though higher than 4 bps in 2014-15, however, does not reflect the fiscal strength of
the states in the pricing of SDLs.
VII.21 During 2016-17, thirteen states issued
UDAY bonds for ₹1,091 billion as against ₹990
billion raised by eight states in the previous year.
The spreads of UDAY bonds during 2016-17
declined to 35-75 bps over the corresponding
tenor/10-year FIMMDA G-Sec yield as compared
with a fixed spread of 75 bps in 2015-16.
Approximately 45 per cent of the total UDAY bond
issuances in 2016-17 were concentrated in Q4.
The large volume of SDL issuances including
UDAY, was one of the major factors that resulted
in weighted average spread to widen from 54 bps
in Q1 to 83 bps in Q4 of 2016-17.
VII.22 In 2016-17, five states including
Puducherry issued SDLs with tenors above 10
years and many states issued non-standard
securities of tenors ranging from 2 to 20 years. As
a strategic response to higher spreads, four states
rejected all the bids in some auctions. Furthermore,
the Reserve Bank has been working closely with
state governments to facilitate efficient cash and
liability management operations of states, with the
objective of consolidation through elongation of
debt, reissuances and buyback of high cost debt,
while keeping an eye on redemption capacities
of states. As part of the ongoing endeavour to
consolidate the debt in SDLs through buybacks,
the state of Maharashtra repurchased ₹10.83
billion of its debt.
Cash Management of State Governments
VII.23 The aggregate WMA limit for 28 states
and the Union Territory of Puducherry was
revised from ₹154 billion to ₹322 billion with effect
from February 1, 2016. Eleven states resorted
to WMA in 2016-17, the same number as in the
previous year. Consequent to the increase in
WMA limits, only 4 states resorted to overdrafts in
2016-17 as against 9 states in 2015-16.
VII.24 Outstanding investment of states in ITBs
increased further to ₹1,561 billion as at end-March
2017, while that in ATBs declined for the third year in succession to ₹366 billion (Table VII.5). With
the objective of dynamically aligning the interest
rate on ITBs with market levels, effective January
30, 2017, the discount rate on 14 days ITBs was
re-fixed at the reverse repo rate minus 200 bps,
subject to an upper ceiling of 5 per cent. The
rediscount rate has, consequently, also been re-fixed
at reverse repo rate minus 150 bps, subject
to an upper ceiling of 5.5 per cent.
| Table VII.5: Investments in ITBs and ATBs by
State Governments/UT |
| (₹ billion) |
| Item |
Outstanding as on March 31 |
| 2013 |
2014 |
2015 |
2016 |
2017 |
As on
June 30,
2017 |
| 1 |
2 |
3 |
4 |
5 |
6 |
7 |
| 14-Day (ITBs) |
1,181 |
862 |
842 |
1,206 |
1,561 |
1,179 |
| ATBs |
286 |
463 |
394 |
383 |
366 |
1,025 |
| Total |
1,466 |
1,325 |
1,236 |
1,589 |
1,927 |
2,204 |
Investments in Consolidated Sinking Fund (CSF)/
Guarantee Redemption Fund (GRF)
VII.25 Outstanding investment by states in the
CSF and the GRF as at end-March 2017 stood at
₹884 billion and ₹49 billion, respectively. During
the year, total investment in CSF and GRF was
₹176 billion (including fresh investment of ₹57
billion and reinvestments of ₹119 billion) as
compared to ₹134 billion during 2015-16.
Agenda for 2017-18
VII.26 The Union Budget 2017-18 projected
gross market borrowings of ₹5,800 billion through
dated securities, a marginal decline of ₹20 billion
from that in the previous year. Net short term
borrowings (i.e., through T-Bills) is budgeted at
₹20 billion, substantially lower than that of ₹186
billion in the previous year. Net market borrowings
via dated securities and T-Bills would finance 77.8 per cent of the GFD in 2017-18 as compared
with 79.6 per cent in 2016-17. In line with the
policy of front-loading of issuances, 64 per cent
(i.e., ₹3,720 billion) of the gross market
borrowings is slated to be raised in the first half of
2017-18. This, in turn, would also help to
manage the redemption pressure during H1 of
2017-18 when 90 per cent (i.e., ₹1,566 billion) of
the total redemptions would fall due. The borrowing
programme of the centre and state governments
would continue to be guided by the pillars of low
cost, risk mitigation and market development by
adopting the following strategic measures :
i. Issuance/re-issuance of longer tenor bonds to
help elongate the weighted average maturity
of debt.
ii. Host a single web link on the Reserve Bank
website for public debt through consolidation
of various links pertaining to internal and
external public debt information.
iii. Preparation of draft compendium for state
governments on best practices in cash
management and a model cash flow
statement on pilot basis.
iv. Capacity building programmes for
Finance Departments/AG Offices of state
governments/other central banks.
v. Keeping in view the fiduciary risk for state
governments, a Working Group on Monitoring
and Reporting of Contingent Liabilities at
the state level has been constituted under
the aegis of 29th State Finance Secretaries
Conference. The thrust of the Working Group
is towards identifying contingent liabilities
and standardising risk management and
mitigation measures, while bringing in
uniformity in disclosure across states for
better peer group analysis. The Working
Group is expected to submit its report shortly. |