With the cumulative interest rate increases of 250 basis points (bps) undertaken in 2022-23, headline inflation moderated and moved into the tolerance band during 2023-24 amidst intermittent food price spikes even as economic activity exhibited resilience. The monetary policy committee (MPC) kept the policy repo rate unchanged and maintained the stance of withdrawal of accommodation through 2023-24. The pace of transmission to banks’ deposit and lending rates moderated. Liquidity conditions evolved in sync with the monetary policy stance. III.1 During 2022-23, the monetary policy committee (MPC) increased the policy repo rate by cumulative 250 bps. The impact of the increase in the repo rate and softening input cost pressures was reflected in a steady decline in core consumer price index (CPI) inflation (CPI excluding food and fuel). CPI headline inflation also eased into the tolerance band, although transient shocks from vegetable prices pushed it occasionally above the upper tolerance threshold. Disinflation costs were minimised by the resilience of domestic economic activity in spite of formidable global headwinds. Accordingly, the MPC maintained status quo on the policy repo rate and persevered with a stance of withdrawal of accommodation during 2023-24. III.2 During the year, liquidity conditions evolved in line with the monetary policy stance. An incremental cash reserve ratio (I-CRR) was applied as a temporary measure during August 12 to October 7, 2023 to absorb the surplus liquidity resulting from the return of ₹2000 banknotes to the banking system. With system liquidity turning into a deficit in H2 on account of the build-up of government cash balances and festival related currency outgo, short-term money market rates firmed up. Long-term yields remained broadly stable. The Reserve Bank conducted two-way liquidity operations. The transmission of policy rate increases of 2022-23 to banks’ deposit and lending rates continued although its pace slowed during the course of the year. III.3 Against the above backdrop, section 2 presents the implementation status of the agenda set for 2023-24 along with major developments during the year, while section 3 sets out the agenda for 2024-25. Concluding observations are provided in the last section. 2. Agenda for 2023-24 III.4 The Department had set out the following goals for 2023-24: -
Application of machine learning (ML) techniques for improving nowcasting and forecasting of gross domestic product (GDP) [Utkarsh 2.0] (Paragraph III.5); -
Strengthening the analysis of transmission to lending rates of non-banking financial companies (NBFCs) and sectoral lending by them (Utkarsh 2.0) [Paragraph III.5]; and -
A review of the working of the external benchmark system for loans in monetary policy transmission (Utkarsh 2.0) [Paragraph III.5]. Implementation Status III.5 The nowcasting and forecasting models used for short-term projections of GDP were augmented by employing linear and non-linear ML techniques using high frequency indicators. Data on transmission and sectoral deployment of credit from major NBFCs are being collected and efforts are underway to streamline the data submission process under the centralised information management system (CIMS). A detailed review of the external benchmark-based lending rate (EBLR) system was conducted. Feedback and suggestions have been received from banks. III.6 Studies were carried out during the year (i) to assess properties of various core inflation measures in view of recurrent inflation shocks in recent years; (ii) to gauge the impact of the surge in digital payments on currency demand; (iii) to extract expectations on the policy rate from the 2-month overnight index swaps (OIS); (iv) to evaluate the operation of the standing deposit facility (SDF) after one year of its introduction; (v) to compare monetary transmission in the current tightening cycle vis-à-vis the previous easing phase; and (vi) to examine the pass-through of input prices to output prices in a cross-country framework. Major Developments Monetary Policy III.7 When the MPC met for its first meeting of 2023-24 in April, CPI headline inflation had accelerated to 6.4 per cent in February 2023 from 5.7 per cent in December 2022 amidst high inflation in several food sub-groups. The outlook for inflation remained uncertain in the backdrop of unseasonal rains and hailstorms, the lagged pass-through of input costs pressures into output prices, global financial market volatility and imported inflation risks, especially from crude oil prices. Assuming an annual average crude oil price (Indian basket) at US$ 85 per barrel and a normal monsoon, CPI inflation was projected at 5.2 per cent for 2023-24, with Q1 at 5.1 per cent, Q2 at 5.4 per cent, Q3 at 5.4 per cent and Q4 at 5.2 per cent, with risks evenly balanced. Real GDP growth for 2023-24 was projected at 6.5 per cent, underpinned by a good rabi crop, sustained buoyancy in contact-intensive services, the government’s thrust on capex, and double digit credit growth. The MPC unanimously decided to keep the policy repo rate unchanged at 6.50 per cent in April 2023 after six sequential rate hikes during 2022-23. The MPC emphasised that it would continue to keep a strong vigil on the evolving inflation and growth outlook and take further action, if required. The MPC also decided to remain focused on withdrawal of accommodation to ensure that inflation progressively aligns to the target while supporting growth, with a 5-1 vote. III.8 With inflation dipping into the tolerance band during March-April 2023, under the combined impact of monetary tightening and supply augmenting measures, and domestic activity remaining resilient, the MPC maintained status quo on policy rate by a unanimous decision and maintained the stance with a 5-1 vote in its June 2023 meeting. It noted that the cumulative rate hike of the past was still transmitting through the economy and its fuller impact should keep inflationary pressures contained in the coming months. The MPC resolved to take further monetary actions, as required, to keep inflation expectations firmly anchored and to bring down inflation to the target. III.9 When the MPC met in August 2023, the global economy was slowing with divergent growth trajectories across regions. Inflation was moderating but ruled above the target. Tight financial conditions, simmering geopolitical conflicts and geoeconomic fragmentation were the main risks. Domestic CPI inflation picked up from 4.3 per cent in May to 4.8 per cent in June, driven largely by price pressures in food items, most prominently in tomatoes. The uneven south-west monsoon, upward pressures on global food prices due to the hostile geopolitical environment and hardening crude oil prices on production cuts posed risks to the inflation outlook. Considering these factors and assuming a normal monsoon, the CPI inflation forecast was revised up to 5.4 per cent for 2023-24, with Q2 at 6.2 per cent, Q3 at 5.7 per cent and Q4 at 5.2 per cent, with risks evenly balanced. With the repo rate increases still working their way into the economy, the MPC unanimously decided to keep the policy repo rate unchanged at 6.50 per cent with preparedness to undertake policy responses, should the situation so warrant. The MPC also reiterated its stance of withdrawal of accommodation with a 5-1 vote. III.10 At the time of the October 2023 meeting, global growth was losing momentum but domestic real GDP had registered robust growth in Q1:2023-24. CPI headline inflation, after surging by 2.6 percentage points to 7.4 per cent in July due to a spike in vegetable prices, moderated to 6.8 per cent in August. Core inflation continued its descent in July-August. The MPC observed that the unprecedented food price shocks were impinging on the evolving trajectory of inflation and the recurring incidence of such overlapping shocks could impart generalisation and persistence. It noted that with headline inflation above the tolerance band, monetary policy needed to remain actively disinflationary. The MPC unanimously decided to keep the policy repo rate unchanged at 6.50 per cent while retaining its stance with a 5-1 vote. III.11 By the time the MPC met in December 2023, domestic economic activity had maintained resilience, underpinned by robust investment and government consumption. The projection of real GDP growth for 2023-24 was increased to 7.0 per cent. CPI headline inflation fell by about 2 percentage points to 4.9 per cent in October on sharp correction in prices of certain vegetables, deflation in fuel and a faster and broad-based disinflation in core prices. The CPI inflation forecast was retained at 5.4 per cent for 2023-24, with Q3 at 5.6 per cent; and Q4 at 5.2 per cent. Assuming a normal monsoon for 2024-25, CPI inflation for Q1:2024-25 was projected at 5.2 per cent; Q2 at 4.0 per cent; and Q3 at 4.7 per cent. The MPC unanimously decided to keep the policy repo rate unchanged at 6.50 per cent with readiness to take appropriate policy actions as and when required and retained its stance with 5-1 vote. III.12 Against the backdrop of continued momentum in economic activity, the MPC in its February meeting projected real GDP growth for 2024-25 at 7.0 per cent. CPI inflation had picked up in November and December, primarily on account of vegetable price increases, even as fuel deflation deepened and core inflation softened to a four year low of 3.8 per cent in December 2023. CPI inflation was projected at 5.4 per cent for 2023-24 with Q4 at 5.0 per cent. Assuming a normal monsoon, CPI inflation for 2024-25 was projected at 4.5 per cent with Q1 at 5.0 per cent; Q2 at 4.0 per cent; Q3 at 4.6 per cent; and Q4 at 4.7 per cent, with risks evenly balanced. While domestic activity was holding up well, large and repetitive food price shocks were interrupting the pace of disinflation. The MPC decided to keep the policy repo rate unchanged at 6.50 per cent with a 5-1 vote to sustain the path of disinflation. The MPC noted that monetary policy must continue to be actively disinflationary to ensure anchoring of inflation expectations and fuller transmission. The MPC also decided to remain focused on withdrawal of accommodation with a 5-1 vote. 
| Table III.1: Policy Rates – Major Central Banks | | Category | Country | Policy Rate (per cent)
(As on March 31, 2024) | Pause Since | | 1 | 2 | 3 | 4 | | AEs | US | 5.50 | July 2023 | | UK | 5.25 | August 2023 | | Euro Area | 4.50 | September 2023 | | Canada | 5.00 | July 2023 | | Sweden | 4.00 | September 2023 | | New Zealand | 5.50 | May 2023 | | EMEs | India | 6.50 | February 2023 | | Thailand | 2.50 | September 2023 | | Malaysia | 3.00 | May 2023 | | South Africa | 8.25 | May 2023 | US: United States.
UK: United Kingdom.
AEs: Advanced Economies.
EMEs: Emerging Market Economies.
Source: Central banks’ websites. | III.13 The MPC’s decisions during 2023-24 were marked by unanimity on rate actions barring the February meeting, but diversity in stance (Chart III.1). III.14 Globally, many central banks have kept rates on hold since mid-2023 (Table III.1). III.15 Monetary policy communication has gained prominence in anchoring expectations of economic agents (Box III.1). The Operating Framework: Liquidity Management III.16 In consonance with the monetary policy stance, liquidity management operations during 2023-24 were aimed at balancing out the level of liquidity in the banking system. Keeping in view the increase in surplus liquidity due to various factors (discussed below), the Reserve Bank imposed an incremental cash reserve ratio (I-CRR) of 10 per cent on the increase in net demand and time liabilities (NDTL) of all scheduled banks between May 19 and July 28, 2023, effective from the fortnight beginning August 12, 20232. The I-CRR was reviewed on September 8, 2023, and discontinued in a phased manner so that system liquidity was not subjected to sudden shocks and money markets functioned in an orderly manner. Accordingly, 25 per cent of the impounded I-CRR funds was released on September 9, another 25 per cent on September 23 and the remaining 50 per cent was released on October 7, 2023. Box III.1
Monetary Policy Communication in India Communication is an important strategy of central banks which fosters transparency and credibility of their policy announcements. The Reserve Bank’s communication on monetary policy includes the MPC’s resolutions, minutes of the MPC’s meetings, Governor’s statement, the Monetary Policy Report (MPR), press conferences on the day of announcement of the policy and the speeches delivered on various occasions. An analysis of MPC’s resolutions using natural language processing (NLP) techniques shows that the emphasis of communication varied, depending on situations; seven key topics emerged during October 2016 to October 2023 (Chart 1). Inflation remained as the central topic of discussion, followed by growth during the pre-COVID-19 period (October 2016 to February 2020). This sequence, however, reversed during the pandemic (March 2020 to February 2022); liquidity and COVID topics also received attention. The geopolitical crisis in 2022 and the resultant inflationary pressures shaped subsequent MPC discussions with inflation returning as the core topic (March 2022 to October 2023); the focus on external linkages also increased. As communication can supplement quantitative changes in the policy repo rate and impact financial markets, communication tone of monetary policy was used for analysis1. Communication tone on inflation resonated well with the policy cycle; during the tightening period, the tone was negative, while it was positive during the easing cycle. The tone on growth remained positive or negative, depending on prevailing economic conditions. 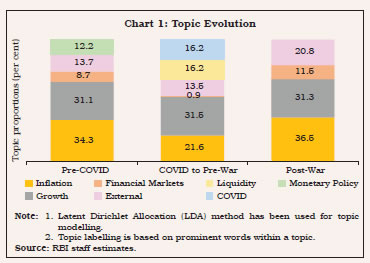 The impact of the weighted average call rate (WACR) [which mirrors changes in the policy repo rate], communication tone on inflation (MPC_INF) and growth (MPC_GR) is assessed on the overnight index swap (OIS) rates in an event-study approach (a five-day window before and after policy announcement). The analysis suggests that the WACR drives short-term OIS rates, but its influence decreases as the tenor increases (Table 1). The OIS rates exhibit a weak and insignificant correlation with communication tone on growth. Conversely, they have significant inverse relationship with inflation tone. Further, communication on inflation matters more during policy tightening phases (Table 2). An analysis of inflation outlook of professional forecasters reveals that both inflation projections (quantitative) and inflation tone influence their forecasts. When projection is lower and the tone is positive, moderation is seen in professionals’ forecasts and vice versa (Table 3). | Table 1: Impact of Communication on OIS Rates | | Item | OIS_1M | OIS_2M | OIS_3M | OIS_6M | OIS_9M | OIS_1Y | | 1 | 2 | 3 | 4 | 5 | 6 | 7 | | WACR | 0.484*** | 0.373*** | 0.327*** | 0.279* | 0.287* | 0.290* | | MPC_INF | -0.102 | -0.112 | -0.144 | -0.199* | -0.218* | -0.237* | | Constant | -0.032 | -0.016 | -0.012 | -0.006 | -0.003 | 0.001 | *** and * indicate significance levels at 1 per cent and 10 per cent, respectively.
Note: The analysis covers data from April 2018 to October 2023.
Source: RBI staff estimates. |
| Table 2: Impact of Communication on OIS Rates - Different Policy Cycles | | Item | OIS_1M | OIS_2M | OIS_3M | OIS_6M | OIS_9M | OIS_1Y | | 1 | 2 | 3 | 4 | 5 | 6 | 7 | | WACR | 0.401*** | 0.261* | 0.213 | 0.136 | 0.157 | 0.147 | | MPC_INF_Easing | -0.199 | -0.232 | -0.219 | -0.179 | -0.163 | -0.197 | | MPC_INF_Tightening | -0.239 | -0.306* | -0.391** | -0.639*** | -0.657*** | -0.698*** | | MPC_INF_Status quo | -0.040 | -0.029 | -0.057 | -0.081 | -0.108 | -0.118 | | Constant | -0.032 | -0.016 | -0.018 | -0.028 | -0.027 | -0.023 | ***, ** and * indicate significance levels at 1 per cent, 5 per cent and 10 per cent, respectively.
Source: RBI staff estimates. | Overall, the analysis suggests that effective communication can shape the expectations of economic agents. | Table 3: Impact of Communication on Inflation Outlook of Professional Forecasters | | Item | INF_Outlook | | 1 | 2 | | Inflation | 0.731*** | | MPC_INF | 0.340 | | INF_projection_1# | -0.156** | | INF_projection_2& | 0.047* | | Constant | 1.422*** | #: MPC_INF tone is positive and INF projection below 5 per cent.
&: MPC_INF tone is negative and INF projection above 5 per cent.
***, ** and * indicate significance levels at 1 per cent, 5 per cent and 10 per cent, respectively.
Source: RBI staff estimates. | References: 1. Blinder, A. S., Ehrmann, M., Fratzscher, M., De Haan, J., & Jansen, D. J. (2008), ‘Central Bank Communication and Monetary Policy: A Survey of Theory and Evidence’, Journal of Economic Literature, 46 (4), 910-945. 2. Das, Shaktikanta (2022), ‘Monetary Policy and Central Bank Communication’, Speech at the National Defence College, Ministry of Defence, Government of India, New Delhi, March 4. 3. Patra, M. D. (2022), ‘The Lighter Side of Making Monetary Policy’, Speech at the 9th SBI Banking and Economics Conclave, Mumbai, November 24. 4. Lagarde, C. (2023), ‘Communication and Monetary Policy’, Speech at the Distinguished Speakers Seminar Organised by the European Economics & Financial Centre, London, September 4. | Drivers and Management of Liquidity III.17 Government cash balances, currency movements and capital flows emerged as the major drivers of liquidity during 2023-24 (Table III.2). At the beginning of Q1:2023-24, liquidity conditions tightened in April due to the build-up of government cash balances and the repayment of remaining funds availed by banks under the targeted long-term repo operations (TLTROs)3 conducted in April 2020. Thereafter, liquidity conditions eased in May in the wake of (i) the return of currency to the banking system consequent upon the withdrawal of ₹2000 banknotes from circulation; (ii) an accelerated pace of government spending before the onset of the monsoon season; and (iii) the Reserve Bank’s market operations. In June, advance tax payments and goods and services tax (GST) related outflows moderated surplus liquidity, though the seasonal return of currency to the banking system ameliorated some of the pressure. A 14-day variable rate repo (VRR) auction (main operation) was conducted on May 19, 2023 followed by one fine-tuning VRR operation in June to assuage the transient tightness in liquidity conditions. | Table III.2: Liquidity – Key Drivers and Management | | (₹ crore) | | Item | 2022-23 | 2023-24 | Q1:2023-24 | Q2: 2023-24 | Q3: 2023-24 | Q4: 2023-24 | | 1 | 2 | 3 | 4 | 5 | 6 | 7 | | Drivers | | (i) CiC [withdrawal (-) / return (+)] | -2,44,804 | -1,37,011 | 18,103 | 71,253 | -73,831 | -1,52,536 | | (ii) Net Forex Purchases (+) / Sales (-) | -2,17,259 | 3,39,528 | 1,60,738 | -16,071 | -2,348 | 1,97,209 | | (iii) GoI Cash Balances [build-up (-) / drawdown (+)] | 84,028 | -2,75,156 | -2,37,937 | -1,79,913 | -6,606 | 1,49,301 | | (iv) Excess Reserves [build-up (-) / drawdown (+)] | 1,17,393 | -11,961 | 31,485 | 3,440 | -1,217 | -45,669 | | Management | | (i) Net OMO Purchases (+) / Sales (-) | -31,360 | -18,505 | - | -8,480 | -10,025 | - | | (ii) Required Reserves [including both change in NDTL and CRR / I-CRR] | 1,62,701 | -1,27,716 | -33,712 | -1,01,508 | 30,605 | -23,101 | | Memo Item: | | Daily Net Absorption (+) / Injection (-) as at end-period | 1,28,497 | -52,918 | 1,29,194 | -97,015 | -1,82,679 | -52,918 | CiC: Currency in Circulation.
GoI: Government of India.
-:Nil.
Note: 1. Inflow (+)/Outflow (-) to and from the banking system.
2. Data pertain to the last Friday of the respective period.
Source: RBI. | III.18 In Q2, liquidity conditions remained largely comfortable during July and the first half of August as government spending augmented surplus liquidity in the banking system. Surplus liquidity moderated from August 12, 2023, following the imposition of the I-CRR, which impounded about ₹1.1 lakh crore from the banking system. The build-up of government cash balances due to advance tax collections and GST payments further tightened liquidity conditions and average net liquidity adjustment facility (LAF) slipped into deficit mode in September for the first time since May 2019. Consequently, average net LAF absorption moderated to ₹0.89 lakh crore in Q2:2023-24 from ₹1.26 lakh crore in Q1. III.19 Liquidity turned into deficit with average net LAF injection of ₹0.76 lakh crore in Q3, driven by festival related currency outgo in October-November and build-up of government cash balances due to advance tax and GST payments in December 2023. To alleviate the liquidity stress, the Reserve Bank conducted four fine-tuning VRR operations. III.20 Net LAF injection averaged ₹1.36 lakh crore in Q4, with injections narrowing considerably in March 2024 from January-February. Increased government spending along with the Reserve Bank’s forex operations somewhat offset liquidity drainage due to currency withdrawal. The return-leg of a USD/INR Sell Buy swap auction for US$ 5 billion conducted by the Reserve Bank on March 8, 2022 also injected liquidity amounting to ₹42,800 crore on March 11, 2024. During Q4, the Reserve Bank injected liquidity through six main and 19 fine-tuning VRR operations. At the same time, fine-tuning variable rate reverse repo (VRRR) auctions were conducted intermittently to absorb surplus liquidity to ensure that money market rates evolve in alignment with the monetary policy stance. III.21 Currency in circulation is usually a predominant driver of structural liquidity in the banking system. The usual expansion in currency in circulation during 2023-24 was muted due to the return of currency to the banking system on account of the decision to withdraw ₹2000 banknotes from circulation on May 19, 2023 (Chart III.2). Liquidity Operations III.22 During 2023-24, average absorption under the SDF at ₹0.90 lakh crore constituted 78 per cent of the average daily total absorption (₹1.16 lakh crore) under the LAF, while the remaining 22 per cent was absorbed through VRRR auctions – both main and fine-tuning operations (Chart III.3). Reflecting tight liquidity conditions, banks’ recourse to the marginal standing facility (MSF) increased, with average daily borrowing under the facility amounting to ₹0.50 lakh crore during 2023-24, scaling a peak of ₹2.34 lakh crore on November 22, 2023. The simultaneous placement of substantial funds under the SDF while taking large recourse to the MSF is somewhat paradoxical. To enable better fund management by the banks, it was decided to allow reversal of liquidity facilities under both the SDF and the MSF even during weekends and holidays with effect from December 30, 2023. This provided banks with greater flexibility in their operations, alleviated the tightness in liquidity conditions during the weekends and imparted greater efficiency to liquidity management. 
 III.23 During 2023-24, VRRR fine-tuning operations and fortnightly 14-day main operations elicited average offer-cover ratios of 0.47 and 0.38, respectively. In contrast, VRR fine-tuning and main operations had average bid-cover ratio of 2.07 and 1.75, respectively, reflecting tight liquidity conditions. III.24 Driven by the shifting liquidity dynamics, the weighted average call rate (WACR) – the operating target of monetary policy – remained elevated during October 2023-January 2024. It eased between mid-February 2024 and the third week of March before hardening towards the year-end (Chart III.4). III.25 In tandem with the WACR, overnight rates in the collateralised segment rose during the year before easing since February (Table III.3). In the term money segment, yields firmed up on 3-month commercial paper (CP) for NBFCs, reflecting, inter alia, the regulatory measures announced by the Reserve Bank on November 16, 2023 (see Chapter VI). Tight liquidity conditions prompted banks to resort to issuances of certificates of deposit (CDs). Medium to long-term bond yields, however, eased from their March 2023 levels, taking cues from domestic developments notwithstanding the hardening of US treasury yields. | Table III.3: Interest Rates | | (Per cent) | | Indicator | Average for | | Mar-2023 | Jun-2023 | Sep-2023 | Mar-2024 | | 1 | 2 | 3 | 4 | 5 | | Rates | WACR | 6.52 | 6.54 | 6.76 | 6.60 | | Tri-party Repo | 6.47 | 6.47 | 6.74 | 6.54 | | Market Repo | 6.55 | 6.46 | 6.78 | 6.61 | | 3-Month T-Bill | 6.88 | 6.75 | 6.96 | 6.92 | | 3-Month CP | 7.78 | 7.15 | 8.40 | 8.19 | | 3-Month CD | 7.48 | 6.91 | 7.56 | 7.70 | | AAA Corporate Bond - 5-year | 7.85 | 7.56 | 7.69 | 7.66 | | G-Sec Yield - 5-year | 7.28 | 6.98 | 7.10 | 7.08 | | G-Sec Yield - 10-year | 7.35 | 7.04 | 7.18 | 7.06 | | Spreads (bps) | CP - T-Bill | 90 | 40 | 144 | 127 | | AAA 5-year - G-Sec 5-year | 57 | 58 | 59 | 59 | | Memo Items: | | Liquidity | Net LAF (₹ crore) | 14,185 | 1,30,246 | -14,586 | -29,323 | | Global Indicators | US 10-year G-sec Yield (Per cent) | 3.66 | 3.74 | 4.36 | 4.20 | | Crude Oil Price (Indian Basket) [US $ per barrel] | 79 | 75 | 93 | 85 | | Source: CCIL, RBI and Bloomberg. | Monetary Policy Transmission III.26 The transmission of the Reserve Bank’s policy rate changes to banks’ deposit and lending rates continued during 2023-24, albeit at a decelerated pace. Scheduled commercial banks’ (SCBs’) weighted average lending rate (WALR) on fresh rupee loans and WALR on outstanding loans increased by 5 bps and 13 bps, respectively, during 2023-24. In the case of deposits, the weighted average domestic term deposit rate (WADTDR) on outstanding term deposits increased in 2023-24, with an increasing proportion of deposits getting renewed at higher rates. The WADTDR on fresh term deposits increased by 14 bps during the year. Overall, since the beginning of the current tightening cycle in May 2022, banks have revised their repo-linked benchmark rates upwards by 250 bps and their 1-year marginal cost of funds-based lending rates (MCLR) by 167 bps. Consequently, the WALR on fresh rupee loans rose by 186 bps while that on outstanding loans rose by 113 bps during May 2022-March 2024. The WADTDR on fresh term deposits and outstanding term deposits increased by 259 bps and 185 bps, respectively, over the same period (Table III.4). | Table III.4: Transmission from the Policy Repo Rate to Lending and Deposit Rates of SCBs | | (Variation in basis points) | Period
(April-March) | Repo Rate | Term Deposit Rates | Lending Rates | | WADTDR – Fresh Deposits | WADTDR – Outstanding Deposits | 1-year MCLR
(Median) | EBLR | WALR – Fresh Rupee Loans | WALR – Outstanding Rupee Loans | | 1 | 2 | 3 | 4 | 5 | 6 | 7 | 8 | | 2021-22 | 0 | 27 | -25 | -5 | 0 | -29 | -36 | | 2022-23 | 250 | 236 | 113 | 150 | 250 | 169 | 98 | | 2023-24 | 0 | 14 | 72 | 30 | 0 | 5 | 13 | | Memo Items: | | February 2019 to March 2022 (Easing Cycle) | -250 | -259 | -188 | -155 | - | -232 | -150 | | May 2022 to March 2024 (Tightening Cycle) | 250 | 259 | 185 | 167 | 250 | 186 | 113 | -: Nil.
WADTDR: Weighted Average Domestic Term Deposit Rate.
WALR: Weighted Average Lending Rate.
MCLR: Marginal Cost of Funds-based Lending Rate.
EBLR: External Benchmark-based Lending Rate.
Note: Data on EBLR pertain to domestic banks.
Source: RBI. | III.27 In the current tightening cycle, the interest rates on savings deposits of banks - which account for roughly 30 per cent of total deposits - have remained almost unchanged, while current account balances (with around 9 per cent share in total deposits at end-March 2024) earn no interest. This has moderated the increase in the banks’ overall cost of funds, mirroring in higher interest rate spreads. During tightening cycles, interest rate spreads of SCBs tend to widen initially with faster upward adjustments in lending rates relative to deposit rates (Box III.2). With the phased repricing of deposits, net interest margins moderate/stabilise subsequently. III.28 Across bank-groups, the increase in the WALR on fresh rupee loans and WADTDR on fresh and outstanding term deposits was higher in case of public sector banks (PSBs) relative to private banks (PVBs) in the current tightening cycle (Chart III.5). The transmission was the highest in the case of foreign banks, facilitated by their low cost and lower duration deposits, which enables them to make quicker adjustments in response to policy rate changes. Box III.2
Interest Rate Spread and Monetary Policy Transmission The interest rate spread (IRS) - the difference between the weighted average lending rate on fresh loans and the weighted average rate on total deposits of banks - impacts monetary transmission. Drawing from Arellano-Bover (1995) and Blundell & Bond (1998), a dynamic panel framework using the system generalised method of moments (Roodman, 2009) on quarterly data of 27 SCBs (12 public and 15 private sector banks) for the period Q4:2018-19 to Q1:2023-24 with bank-specific control variables, viz., size (log of total assets of banks), gross non-performing asset (GNPA) ratio, capital to risk-weighted assets ratio (CRAR) and credit-deposit (CD) ratio indicates that a 100 bps increase in the WACR increases banks’ IRS in the short-run by 15-17 bps, as the pace of upward adjustment in term deposit rates lags that in lending rates. The model takes the following form:  
| Table 1: Interest Rate Spread of Banks in India | | Dependent Variable: IRS | Model I | Model II | | Explanatory Variable | | | | 1 | 2 | 3 | | IRS (-1) | 0.49*** | 0.51*** | | WACR | 0.08*** | | | WACR (-1) | 0.09*** | 0.15*** | | Size | | -0.16*** | | GNPA (-1) | | -0.02** | | CRAR (-2) | | 0.04*** | | CDRATIO (-2) | | 0.01 | | Constant | 2.34*** | 2.27*** | | Diagnostics | | | | AR (1) | -2.86** | -2.85** | | AR (2) | 1.03 | 1.26 | | Sargan (p) | 0.31 | 0.15 | | Number of Banks | 27 | 27 | | Observations | 486 | 486 | *** and ** represent significance levels at 1 per cent and 5 per cent, respectively.
Source: RBI staff estimates. | References: 1. Arellano, M., and Bover, O. (1995), ‘Another Look at the Instrumental Variable Estimation of Error-Components Models’, Journal of Econometrics, 68(1), 29-51. 2. Blundell, R., & Bond, S. (1998), ‘Initial Conditions and Moment Restrictions in Dynamic Panel Data Models’, Journal of Econometrics, 87(1), 115-143. 3. Roodman, D. (2009), ‘How to Do xtabond2: An Introduction to Difference and System GMM in Stata’, The Stata Journal, 9(1), 86-136. | External Benchmark-based Loan Rates III.29 The external benchmark regime introduced in October 2019 for loan pricing in select sectors has strengthened the pace of monetary transmission to the lending rates. The proportion of outstanding floating rate loans linked to external benchmarks increased from 44 per cent in March 2022 to 56.2 per cent in December 2023. The loans linked to external benchmarks thus account for the largest share in total floating rate loans. Concomitantly, the share of the MCLR-linked loans fell from 48.6 per cent to 39.4 per cent over the same period (Table III.5).  III.30 In the case of loans linked to the policy repo rate, the spread in respect of fresh rupee loans, i.e., WALR over the repo rate, was the highest for education loans, followed by micro, small and medium enterprise (MSME) loans. Among the domestic bank groups, the spreads charged by PSBs for housing, vehicle, education and other personal loans were lower than those of PVBs. In the case of MSME loans, however, the spread charged by PSBs was higher (Table III.6). The spreads have generally declined in 2023-24, moderating the extent of pass-through to lending rates. | Table III.5: Outstanding Floating Rate Rupee Loans of SCBs across Interest Rate Benchmarks | | (Per cent to total) | | Month | Base Rate | MCLR | EBLR | Others | Total | | 1 | 2 | 3 | 4 | 5 | 6 | | March 2021 | 6.4 | 62.3 | 29.5 | 1.8 | 100.0 | | March 2022 | 4.9 | 48.6 | 44.0 | 2.5 | 100.0 | | March 2023 | 3.1 | 45.4 | 49.6 | 1.9 | 100.0 | | December 2023 | 2.4 | 39.4 | 56.2 | 2.0 | 100.0 | Note: Data pertain to 73 scheduled commercial banks.
Source: RBI. | Sectoral Lending Rates III.31 The WALRs on fresh rupee loans rose marginally for agricultural loans, large industry, MSMEs, infrastructure and education, and declined marginally for sectors such as trade, housing, vehicle, and rupee export credit during 2023-24 (Table III.7). | Table III.6: Loans Linked to External Benchmark – Spread of WALR (Fresh Rupee Loans) over Repo Rate (March 2024) | | (Percentage points) | | Bank Group | Personal Loans | MSME Loans | | Housing | Vehicle | Education | Other Personal Loans | | 1 | 2 | 3 | 4 | 5 | 6 | | Public Sector Banks | 2.06 | 2.56 | 3.62 | 3.04 | 3.34 | | Private Sector Banks | 2.23 | 3.00 | 4.39 | 3.33 | 3.24 | | Domestic Banks | 2.18 | 2.64 | 3.98 | 3.08 | 3.27 | | Source: RBI. |
| Table III.7: Sector-wise WALR of SCBs (Excluding RRBs) - Fresh Rupee Loans | | (Per cent) | | End-Month | Agriculture | Industry
(Large) | MSMEs | Infrastructure | Trade | Professional Services | Personal Loans | Rupee Export Credit | | Housing | Vehicle | Education | Credit Card | | 1 | 2 | 3 | 4 | 5 | 6 | 7 | 8 | 9 | 10 | 11 | 12 | | Mar-22 | 9.06 | 6.55 | 8.66 | 7.09 | 7.36 | 7.68 | 7.01 | 8.85 | 8.74 | 36.04 | 5.53 | | Mar-23 | 10.12 | 8.34 | 9.84 | 8.56 | 8.87 | 8.80 | 9.02 | 10.47 | 10.26 | 37.06 | 8.09 | | Jun-23 | 10.03 | 8.21 | 9.78 | 8.47 | 8.75 | 9.13 | 8.53 | 10.23 | 9.92 | 36.58 | 7.34 | | Sep-23 | 10.03 | 8.11 | 9.88 | 8.46 | 8.88 | 8.96 | 8.68 | 10.33 | 10.12 | 35.74 | 7.54 | | Dec-23 | 9.99 | 8.15 | 9.93 | 8.45 | 8.90 | 9.47 | 8.62 | 9.99 | 10.20 | 36.98 | 7.76 | | Mar-24 | 10.18 | 8.39 | 9.99 | 8.74 | 8.53 | 9.58 | 8.65 | 9.21 | 10.45 | 37.72 | 7.21 | | Variation (Percentage Points) | | 2022-23 | 1.06 | 1.79 | 1.18 | 1.47 | 1.51 | 1.12 | 2.01 | 1.62 | 1.52 | 1.02 | 2.56 | | 2023-24 | 0.06 | 0.05 | 0.15 | 0.18 | -0.34 | 0.78 | -0.37 | -1.26 | 0.19 | 0.66 | -0.88 | | Source: RBI. | III.32 In the case of outstanding loans, the WALRs on loans to large industry and trade segment declined by 9 bps and 3 bps, respectively, during 2023-24. The WALR on loans to infrastructure, agriculture, MSMEs, professional services, housing, education, vehicle and rupee export credit increased during the year (Table III.8). | Table III.8: Sector-wise WALR of SCBs (Excluding RRBs) - Outstanding Rupee Loans | | (Per cent) | | End-Month | Agriculture | Industry
(Large) | MSMEs | Infrastructure | Trade | Professional Services | Personal Loans | Rupee Export Credit | | Housing | Vehicle | Education | Credit Card | | 1 | 2 | 3 | 4 | 5 | 6 | 7 | 8 | 9 | 10 | 11 | 12 | | Mar-22 | 9.35 | 7.76 | 9.28 | 8.31 | 8.14 | 8.11 | 7.46 | 9.06 | 9.30 | 30.51 | 6.55 | | Mar-23 | 9.84 | 8.78 | 10.28 | 8.96 | 9.49 | 9.29 | 8.86 | 9.36 | 10.20 | 30.44 | 7.71 | | Jun-23 | 9.99 | 8.84 | 10.27 | 9.08 | 9.47 | 9.56 | 8.97 | 9.33 | 10.27 | 29.85 | 8.07 | | Sep-23 | 10.05 | 8.76 | 10.25 | 9.08 | 9.51 | 9.50 | 9.00 | 9.41 | 10.41 | 29.56 | 7.90 | | Dec-23 | 10.11 | 8.73 | 10.35 | 9.09 | 9.61 | 9.53 | 8.96 | 9.47 | 10.44 | 28.81 | 8.10 | | Mar-24 | 10.16 | 8.69 | 10.31 | 9.11 | 9.46 | 9.54 | 8.90 | 9.48 | 10.46 | 28.84 | 7.96 | | Variation (Percentage Points) | | 2022-23 | 0.49 | 1.02 | 1.00 | 0.65 | 1.35 | 1.18 | 1.40 | 0.30 | 0.90 | -0.07 | 1.16 | | 2023-24 | 0.32 | -0.09 | 0.03 | 0.15 | -0.03 | 0.25 | 0.04 | 0.12 | 0.26 | -1.60 | 0.25 | | Source: RBI. | 3. Agenda for 2024-25 III.33 The conduct and formulation of monetary policy would be enriched by providing high quality inputs on inflation and growth outlook. The analysis of liquidity conditions would be refined further with a view to improving the short-term projections. Measures for strengthening monetary policy transmission would be pursued alongside evaluation of credit conditions and sectoral flows. Against this backdrop, the Department would focus on the following: -
Strengthening further the analysis of transmission of policy impulses to lending rates of NBFCs (Utkarsh 2.0); -
Measuring the sectoral credit flows of NBFCs (Utkarsh 2.0); -
Examining the feasibility of introduction of the EBLR system of loan pricing for credit extended by NBFCs to select sectors; -
Computing a financial conditions index for India; -
Studying behaviour of banks under varying reserve requirements; and -
Publishing CPI diffusion indices. 4. Conclusion III.34 Going forward, on the basis of the experience gained in 2023-24, strong macroeconomic fundamentals are expected to support domestic economic activity. Headline inflation is expected to moderate further, although its trajectory would depend critically upon the evolving supply-side and weather conditions. While proactive supply-side interventions by the government are critical to keep food price pressures under check, monetary policy will remain resolute in its pursuit of price stability so that inflation is aligned with its target of 4 per cent on a durable basis and inflation expectations are anchored. The Reserve Bank will undertake liquidity management operations in sync with the monetary policy stance while meeting the needs of the productive sectors of the economy.
Index |