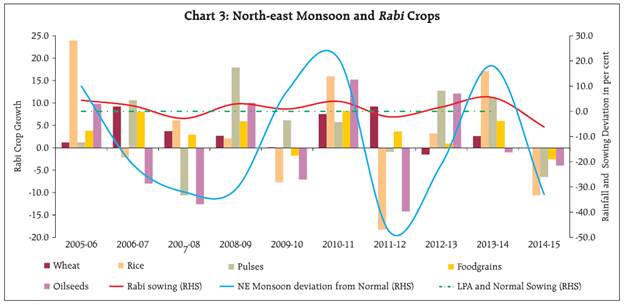
Indian agriculture remains vulnerable to monsoon shocks, as the experience of 2014-15 confirms. Over the years, the volatility of monsoon outcomes has, in fact, increased undermining the accuracy of forecasting and contingent planning. Structural factors such as climate change and rising greenhouse emissions could be at work alongside one-off events such as El Nino. The silver lining is that crop output turns out to be statistically more sensitive to net area sown than to monsoon variations. This provides the rationale for strategic long-range planning encompassing expansion of net sown area by reclaiming arid and semiarid areas, introducing better technology and efficient water management to make Indian agriculture weather proofed over time. Introduction The Indian monsoons, among the most prominent and oldest weather patterns in the world, are perhaps unique in terms of their profound economic significance, affecting the lives of 25 per cent of the world’s population that live in the Indian sub-continent. In India alone, monsoon rains are vital to the farm sector which accounts for 14 per cent of the national economy and around 50 per cent of employment. Moreover, half of India’s farmland lacks irrigation. Yet, it has proven notoriously difficult to predict, and understanding of the phenomenon is still evolving. The India Meteorological Department (IMD) has forecast that the southwest monsoon (SWM) may be 93 per cent of its long period average (LPA)1 in 20152 rekindling the uncertainties surrounding its outcome that were in full play in 2014-15. In April 2014, ahead of the season of 2014 (June-September), the IMD projected that rainfall would be 5 per cent below the LPA, which was downgraded to a 7 per cent shortfall by June. Eventually, rainfall turned out to be 12 per cent below the LPA. the worst outcome in the last five years - reviving memories of the 22 per cent shortfall in 2009 that precipitated a drought. Moisture deficiency was marked in the states of Uttar Pradesh, Andhra Pradesh and parts of Maharashtra and consequently, crops like rice, bajra, tur and groundnut were endangered. The SWM was shadowed at its very onset by the IMD’s warning of a 60 per cent probability of the occurrence of the El Nino phenomenon – an abnormal warming up of sea surface temperatures in the eastern tropical Pacific Ocean that can last up to a year and often associated with droughts in India3 - and this was assigned more than 70 per cent probability in June before its possibility of occurrence was finally ruled out. In the event, despite a massive deficiency of 43 per cent in June and flash floods in north India, a late surge in the monsoon in the key planting months of July and August and a surplus in September helped evade a widespread drought and, in fact, boosted prospects of winter crops such as wheat and rapeseed which are grown in irrigated areas fed by reservoirs. Later in the year, the Indian economy was buffeted by a second shock as the post-SWM winds reversed direction with the cooling of the northern land mass of the Indian sub-continent and the northeast monsoon (NEM) set in over the rice bowls of south India -Karnataka, Andhra Pradesh and Tamil Nadu. The season (October-December) commenced with high expectations of NEM compensating for the SWM shortfall. Although eventually vigorous over Andhra Pradesh and south interior Karnataka, and active over Tamil Nadu and Kerala, it was not until the mid of October that rainfall commenced over these regions. The progress of the NEM deteriorated in November to 51 per cent below the LPA. These developments unduly delayed rabi sowing and put at risk the prospects for crops such as gram grown in parts of Andhra Pradesh and Maharashtra. Moreover, low water reservoir levels and moisture content also threatened other rabi crops like wheat and mustard. Deficiency in rainfall throughout the season became more acute in the closing days of December. The overall shortfall in rainfall during NEM was 33 per cent with rabi sowing being 6.2 per cent below last year’s acreage. In the final analysis, the performance of the monsoon has to be evaluated in terms of production – kharif in the case of the SWM and rabi for the NEM, although the division is not so clear-cut since soil moisture and reservoir conditions spill over seasons. The second advance estimates of the Ministry of Agriculture (released on February 18, 2015) indicate that production of foodgrains may be only 3.2 per cent lower than in 2013-14 (final) although production of pulses may have taken a larger hit, being lower by 7.1 per cent. It is against the backdrop of these developments that this article asks the following questions: (I) what explains the vagaries of the monsoon at least in terms of the received wisdom, however inadequate? Are there one-off phenomena like the El Nino at work or are there more deep-seated transformations underway? (II) what does all this simply for the prospects for Indian agriculture – are they weather-proofed or still monsoon dependent? The rest of the article is divided into five sections. Section II lays out some stylised facts on the monsoon and related cropping patterns. Section III explores the significance of El Nino events for rainfall patterns in India. Structural factors such as climate change and its impact on the monsoon are also discussed. Section IV examines the dynamics of the relationship between agriculture and the monsoon. Section V concludes the article with some medium-term policy perspectives. II. Some Stylised Facts South West Monsoon The SWM accounts for 75-80 per cent of the total rainfall that the country receives and is the mainstay of the kharif crop. Reasonably close co-movement is observed between rainfall intensity (expressed in terms of the deviation from normal) and sowing activity (Chart 1). The extent to which soil moisture and reservoirs get replenished during the season also determine the prospects of the cropping seasons that follow. 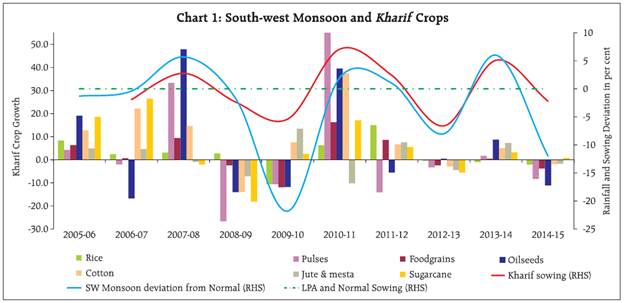 In 2014, the SWM advanced over the Andaman Sea 2 days earlier than the normal date - May 20, but its onset over Kerala was delayed by five days from its normal date of June 1. This delayed onset, uneven distribution and acute deficiency resulted in a drought-like situation in many parts of the country in the early part of the season. The situation improved subsequently, with the revival of rainfall covering the entire country by July 17. Rainfall during SWM 2014 across the four geographically homogeneous regions namely, northwest India, central India, south peninsula and northeast (NE) India were deficient by 21 per cent, 10 per cent, 7 per cent and 12 per cent respectively. These developments serve to highlight the low predictive power of monsoon projections (Box 1). Box 1: Forecasting the South West Monsoon The old saying that the Indian budget is a gamble on monsoon rains holds good even today. First tentative forecasts of rainfall using snowfall in the Himalayas as a predictor dates back to 1882 and was prompted by the nationwide drought in 1877. In 1886, the confidence infused by the success of this tentative forecast spurred regular long range forecast (LRF) of the SWM under the leadership of Sir H.F. Blanford, the first Chief Reporter of the IMD. The LRF for the second half of the season (August-September) was started in 1892. Since then, the IMD has been issuing two-stage LRF for SWM, albeit with changes in its format and content. The quest for better forecasts continued under Sir Gilbert T. Walker, the Director General of IMD (1904-1924). To begin with, correlation and regression techniques were introduced. The initially identified potential predictors of the LRF for SWM were Southern Oscillation, North Atlantic Oscillation and North Pacific Oscillation. In 1988, the IMD introduced 16-parameter power regression and parametric models. However, the failure of 2002 forecast for the SWM led the IMD to introduce a new two-stage forecast strategy in 2003. The first stage forecast for the season, which also included a forecast for the five homogeneous geographical regions, issued in April used and eight-parameter power regression (PR) model and a linear discriminant analysis (LDA) model. The second stage forecast update issued in June used a 10 parameter PR and LDA models. Since 2007, the IMD has been using a new statistical forecasting system, based on indigenously developed ‘ensemble’ technique of forecasting. The first stage forecasts use five predictors for the relevant periods, namely, sea surface temperature (SST) gradient between north Atlantic and north Pacific, equatorial south Indian Ocean SST, east Asia mean sea level pressure, northwest Europe land surface air temperature, and equatorial Pacific warm water volume. The June update for SWM forecast uses six parameters: the central Pacific (Nino 3.4) SST, north Atlantic mean sea level pressure, north central Pacific 850 zonal wind gradient and the first three parameters of the April forecast. For the second half of the season, the IMD’s forecast released in June uses a principal component analysis model. In addition to these forecasts, the IMD in coordination with different climate research centers from India and abroad makes experimental forecast for the SWM using a coupled forecasting system (CFS). Some of the experimental models used are the ensemble multiple linear regression (EMR), the projection pursuit regression (PPR), the principal component regression (PCR), and artificial neural network (ANN). SWM forecasts are handicapped by the large bands of uncertainties around external determinants. As early as April 2014, the US National Oceanic and Atmospheric Administration put the likelihood of El Nino at more than 50 per cent and the Australian Meteorological Bureau put it at 70 per cent. Accordingly, in its June release of the LRF, the IMD raised the likelihood of El Nino to 70 per cent from 60 per cent earlier, but as rainfall picked-up the probability of El Nino conditions emerging was reduced to 50 per cent in August. | Long Range Forecasts and Actual Rainfall 2014 | | Region | Period | Forecast (per cent of LPA) | Actual
(per cent of LPA) | | April 24th | 9th June
(1st Update) | 12th August
(2nd Update) | | All India | June to September | 95 ± 5 | 93 ± 4 | 87 ± 4 | 88 | | Northwest India | June to September | | 85 ± 8 | 76 ± 8 | 79 | | Central India | June to September | | 94 ± 8 | 89 ± 8 | 90 | | Northeast India | June to September | | 99 ± 8 | 93 ± 8 | 88 | | South Peninsula | June to September | | 93 ± 8 | 87 ± 8 | 93 | | All India | July | | 93 ± 9 | – | 90 | | All India | August | | 96 ± 9 | 96 ± 9 | 90 | | All India | August to September | | – | 95 ± 8 | 97 | For 2015, international agencies like the National Oceanic and Atmospheric Administration’s (NOAA), USA, the European Centre for Medium Range Weather Forecast, the Australian Meteorological Bureau and the European Centre for Medium-range Weather Forecasts and Japan’s Agency for Marine-Earth Science and Technology are expecting a normal SWM without substantial delay in its onset. According to these agencies, El Nino is currently weak even though the NOAA has put the likelihood of weak El Nino emerging during summer 2015 at 50-60 per cent. Across the 36 meteorological sub-divisions, the SWM pattern exhibited considerable heterogeneity. In June, as many as 31 sub-divisions out of the total of 36 sub-divisions received deficient/scanty rainfall. Rainfall in four (4) sub-divisions (i.e., Himachal Pradesh, west Uttar Pradesh, east Uttar Pradesh and Telangana) was deficient/scanty during all the four months of the season. Cumulatively, 23 sub-divisions (67 per cent of the total area of the country) received normal rainfall, 12 sub-divisions (30 per cent area) received deficient rainfall and one sub-division - south interior Karnataka (3 per cent area) - received excess rainfall. Out of the 12 deficient sub-divisions with deficient/scanty rainfall, 6 sub-divisions were from north-west India, 2 from central India, one from northeast India and 3 from the south peninsula. A foodgrains production weighted rainfall index (PRN)4 constructed by the Reserve Bank on the basis of area weighted average rainfall suggests that the SWM 2014 was 23 per cent below LPA as against the IMD’s measurement of 12 per cent below LPA. The PRN is more meaningful from the point of view of the impact of rainfall on foodgrains production (Chart 2). | Table 1: Reservoir Status | | Status | 01.10.2008 | 01.10.2009 | 30.9.2010 | 29.9.2011 | 27.9.2012 | 03.10.2013 | 01.10.2014 | | (81 Reservoirs) | (81 Reservoirs) | (76 Reservoirs) | (81 Reservoirs) | (84 Reservoirs) | (85 Reservoirs) | (85 Reservoirs) | | Total Live Storage (BCM) | 111.96 | 90.48 | 114.45 | 131.49 | 115.8 | 133.5 | 121.39 | | Percentage to Live Capacity at FRL (Per Cent) | 74 | 60 | 75 | 87 | 75 | 86.0 | 78 | | Source: Central Water Commission. | As regard the position of reservoirs, the live to total storage ratio at the end of the season (October 1, 2014) in the 85 major reservoirs across the country was 78 per cent as against 86 per cent a year ago5. Deficient SWM adversely affected the replenishment of reservoirs and to an extent, contributed to the less than expected compensation of kharif crops by the rabi harvest (Table 1). Notwithstanding the late arrival of the SWM, acute deficiency in the early part of the season and skewed dispersal, kharif sowing recovered in mid-July on the back of resurgence of rainfall, but could not fully achieve the normal acreage level and remained 2.2 per cent lower than a year ago. The shortfall in sowing translated into a decline in the production of most kharif crops (Table 2). North East Monsoon (NEM) The NEM (October-December), also called the post-monsoon rainfall, is source to around 10 per cent of the total rainfall the country receives every year. Nevertheless, a normal NEM augurs well for rabi crops, although their prospects are influenced by reservoir and carryover of soil moisture. Over the past ten years, rabi foodgrains and pulses constituted around 49 per cent and 65 per cent of total production, respectively. Barring wheat, most rabi crops suffered declines in production during 2014-15 (Chart 3). | Table 2: Progress of Kharif Sowing and Production | | (Area in million hectares and production in million tonnes) | | Crops | Sowing October 10 | Production | Percentage Change | | Normal Full Season | 2013 | 2014 | 2013-14 | 2014-15* | Sowing 2014 (col 4/col 3) | Production 2014-15 (col 6/col 5) | | 1 | 2 | 3 | 4 | 5 | 6 | 7 | 8 | | Foodgrains | 70.6 | 68.2 | 66.5 | 128.7 | 123.8 | -2.5 | -3.8 | | Rice | 39.1 | 37.6 | 38 | 91.5 | 89.6 | 1.1 | -2.1 | | Coarse Cereals | 20.8 | 19.6 | 18.2 | 31.2 | 28.7 | -7.1 | -8.0 | | Maize | 7.2 | 8.2 | 7.8 | 17.1 | 16.5 | -4.9 | -3.5 | | Pulses | 10.8 | 10.9 | 10.2 | 6 | 5.5 | -6.4 | -8.3 | | Tur | 3.8 | 3.9 | 3.6 | 3.2 | 2.8 | -7.7 | -12.5 | | Urad | 2.3 | 2.4 | 2.5 | 1.2 | 1.2 | 4.2 | 0.0 | | Oilseeds | 18.3 | 19.5 | 17.8 | 22.6 | 20.1 | -8.7 | -11.1 | | Groundnut | 4.6 | 4.3 | 3.7 | 8.1 | 5.6 | -14 | -30.9 | | Soyabean | 10 | 12.2 | 11 | 11.9 | 11.6 | -9.8 | -2.5 | | Sugarcane | 4.7 | 5 | 4.9 | 352.1 | 355 | -2 | 0.8 | | Cotton# | 11 | 11.4 | 12.7 | 35.9 | 35.2 | 11.4 | -1.9 | | Jute & Mesta## | 0.9 | 0.8 | 0.8 | 11.7 | 11.5 | 0 | -1.7 | | All Crops | 105.5 | 105.0 | 102.7 | - | - | -2.2 | - | #: Million bales of 170 kgs each. ##: Million bales of 180 kgs each. -: Not Available.
*: Second Advance Estimates.
Source: Ministry of Agriculture, GoI. |
 During 2014, it was expected that the recovery of SWM during September and the fading possibility of a strong El Nino towards the end of the season would benefit the NEM in terms of lending continuity to precipitation. However, it was not until October 18 that the NEM commenced over the south peninsula, the core region of precipitation for the season. Rainfall remained deficient throughout the season. The realized NEM rainfall for the country as a whole was 75 per cent, 49 per cent and 64 per cent of LPA during October, November and December, respectively, with the exception of three weeks – the last week of October, mid-November and mid-December. To begin with, rabi sowing was unduly delayed by the late arrival of NEM. At end-November, rabi sowing under all crops was 4.7 per cent below the previous year and 6.2 per cent below by end-February 2015. Also, the deficiency in rainfall adversely affected replenishment of reservoirs, with the live to total storage ratio in the 85 major reservoirs declining from 69 per cent at end-November to 43 per cent by end- February. The second advance estimates of the Ministry of Agriculture indicate that during 2014-15 rabi foodgrains and oilseeds production was 2.6 per cent and 4.0 per cent respectively below last year’s levels (Table 3). III. Exploring the Vagaries of the Monsoon A striking characteristic of the monsoon in India is its high variability, with heavy rains in some years causing floods in several parts of India, and too little or not at all in other years causing droughts. In some years, the rain quantity has been normal but its timing has turned out to be off expectations and/or its distribution substantially skewed. A number of factors impact the formation of the monsoon, its onset and its spread. Differential heating of land masses and the seas, differences in atmospheric pressure that distributes thermal energy across the planet, shifts in jet streams and even low-probability factors such as desert dust over the Arabian Sea are all believed to be causal factors. It is also believed that there may be more deep-seated forces at work on which these factors may be just an overlay. | Table 3: Progress of Rabi Sowing and Production | | (Area in million hectares and production in million tonnes) | | Crops | Sowing February 13 | Production | Percentage Change | | Normal Full Season | 2014 | 2015 | 2013-14 | 2014-15* | Sowing 2014 (col 4/col 3) | Production 2014-15 (col 6/col 5) | | 1 | 2 | 3 | 4 | 5 | 6 | 7 | 8 | | Foodgrains | 52.8 | 56.7 | 53.5 | 136.9 | 133.3 | -5.6 | -2.6 | | Rice | 4.3 | 2.9 | 2.5 | 15.2 | 13.5 | -13.8 | -11.2 | | Wheat | 29.0 | 31.5 | 30.6 | 95.9 | 95.8 | -2.9 | -0.1 | | Coarse Cereals | 6.2 | 6.0 | 5.8 | 12.1 | 11.1 | -3.3 | -8.3 | | Maize | 1.3 | 1.6 | 1.5 | 7.1 | 6.5 | -6.3 | -8.5 | | Pulses | 13.2 | 16.2 | 14.6 | 13.8 | 12.9 | -9.9 | -6.5 | | Urad | 0.8 | 0.8 | 0.9 | 0.6 | 0.5 | 12.5 | -16.7 | | Oilseeds | 8.7 | 9.0 | 8.1 | 10.1 | 9.7 | -10.0 | -4.0 | | Groundnut | 0.9 | 0.8 | 0.7 | 1.7 | 1.8 | -12.5 | 5.9 | | All Crops | 61.4 | 65.7 | 61.6 | - | - | -6.2 | - | -: Not Available.
*: Second Advance Estimates.
Source: Ministry of Agriculture, GoI. | El Nino Over the past 50 years, El Nino conditions have occurred 31 per cent of the time (Earth Science, 2014). However, the prevalence of El Nino has not always caused a drought. While five of India’s major droughts since 1950 coincided with an El Nino, the strongest El Nino in the 20th century that occurred in 1997-98 did not result in a drought and instead, India experienced above-average rainfall. In 2002 by contrast, the El Nino effect was weak/moderate but the monsoon was severely deficient. In fact, in most El Nino years since 1950s, summer rains ranged from well below average to average and even above average (DiLiberto, 2014). One strand in the literature also suggests that the inverse relationship between El Nino and Indian summer monsoon rainfall has weakened in recent decades. Sliding correlations on a 21-year moving window between monsoon rainfall and the El Nino index were found to be strong during the period 1856 to 1997 but relatively weak during 1970s, 1980s and 1990s (Kumar et al., 1999). Two possible inferences can be gleaned out of studies on the monsoon. First, the specific location of warming in the Pacific Ocean is a significant determinant of its impact on the Indian monsoon. It has been observed that warming of the Pacific Ocean does not always occur at the same location during El Nino years. For instance, in 2002, when India experienced a very dry monsoon season, the warming of the Pacific was located in the central part of the ocean while in 1997 – the strongest El Nino of the 20th century as alluded to earlier, warming occurred in the eastern part of the Pacific and India was not affected. Secondly, increased surface temperatures over Eurasia in winter and spring, which are part of the global warming trend, may favor the enhanced land-ocean thermal gradient conducive for a strong monsoon. This is substantiated by the fact that northern hemispheric surface temperatures during January and February have been shown to be positively correlated with the following summer’s monsoon rainfall. Some recent studies have also suggested an intensification of the Asian summer monsoon rainfall with increased atmospheric greenhouse gas concentrations. These observations raise the possibility that Eurasian warming in recent decades has helped in sustaining the monsoon rainfall at normal levels despite strong El Nino events (Kumar et al., 2006). Spatial and Temporal Distribution Recent experience shows that it is not only the overall quantum of precipitation per se that affects agricultural production, but also the spatial and temporal distribution of rainfall. Therefore, understanding the pattern of the onset of monsoon, the distribution of active days and breaks in rainfall during the season, both temporal and spatial, assumes importance. Studies in this regard show that during 1951-2007, there were seven days of active and break events during July-August on average. Spells of break (or dry spells), in general, last longer than active spells. During the period, almost 80 per cent of the active spells lasted three to four days (Rajeevan M. et al, 2008). Extreme climatic events like abnormal cold or heat conditions, hailstorms, floods and cyclones are also found to significantly affect rainfall conditions as also crop production. For instance, in March 2004-05, temperatures were higher in the India-Gangetic plains by 3-6°C. As a result, the wheat crop matured 10-20 days earlier than usual and its production dropped by more than four million tonnes(Committee on Agriculture 2010-11, 26th Report, 15th Lok Sabha). However, there is a decreasing trend in the frequency of wet days in most parts of the country (Guhathakurta P. et al, 2010). Extreme rainfall events over northern parts of west coast adjoining Maharashtra have shown a significant increasing trend (Joshi U. R. and M. Rajeevan, 2006). Structural Changes Global climate change is associated with the rise in global temperature, contraction of snow cover, rise in sea levels, increased frequency of natural calamities like earthquakes, droughts and floods, depletion of soil and water resources and changes in rainfall patterns. The rate of warming across the globe over the last 50 years (0.24ºF per decade) is almost double the rate of warming over the last 100 years (0.13ºF per decade) (EPA, April 2010). It is estimated that for an increase of 1-3°C in global mean temperature, productivity declines for some cereals in low latitudes, whereas it increases in high latitudes. However, there would be a general decline in productivity if the global mean temperature rises above 3-4°C (IPCC 2007, WG II).6 Average global temperature is projected to rise by 0.5-1°C by 2030s, by 2-4.5 °C by 2080s and by 1.4-5.8°C by 2100. At the same time, global carbon dioxide (CO2) concentration in the atmosphere is expected to rise from the safe level of 350 parts per million (ppm) to over 400 ppm by 2030. At higher levels of temperature, increased atmospheric concentration of CO2 is expected to stimulate photo-synthesis and have a fertilizing effect on many crops. Given the benefit of the rise in atmospheric CO2 levels and with temperature rising by only 0.5-1°C, the overall effect of climate change on global food production by 2030 is likely to be small (IPCC 2007, WG II). Temperate regions are expected to witness increase in yields. In the tropics, increased evaporation due to rise in temperature may lower soil moisture levels making some cultivated areas unsuitable for cropping and tropical grasslands increasingly arid. In East Asia, the Sahel and Southern Africa, the outcome of climate change on agriculture could be either positive or negative; in other developing regions a decline in yields is more likely. In all of these cases, the potential yield changes could range between ± 2.5 per cent by 2030 and ±5 per cent by 2050 (FAO, 2003). Rising temperature could also expand the range of agricultural pests with increased ability to survive harsh climate, while the rise in ocean temperature may reduce plankton growth and disrupt fish breeding and feeding patterns. A rise in the mean sea level by 15 to 20 cm by 2030 and 50 cm by 2100, as projected, will lead to loss of low-lying land through flooding, sea water intrusions and storm surges. It would also have an adverse impact on vegetable growing and aquaculture in low-lying areas, and fisheries dependent on mangrove swamps. The impact will be most serious in coastal zones, especially heavily populated deltas used for agriculture in Bangladesh, China, Egypt, India and mainland Southeast Asia. In India alone, losses by 2030 could range from 1,000 to 2,000 square km, destroying 70,000 to 150,000 livelihoods (FAO, 2003). In fact, the adverse impact of climate change is likely to be disproportionately higher for the poor. Hardest hit will be small-scale farmers and other low-income groups in areas prone to drought, flooding, salt water intrusion or sea surges. Fishermen would be affected by falling catches caused by higher sea temperatures and shifts in currents. The areas most likely to suffer increased climate variability and extreme events are mostly those that are already handicapped by these same phenomena (FAO, 2003; IPCC 2007, WG II). The Intergovernmental Panel on Climate Change predicted that mean temperatures will rise by 2.7-4.3 OC over India by the 2080s (IPCC 2007, WG II). The panel also predicted an increase in rainfall over the Indian sub-continent by 6-8 per cent and rise in the sea level by 88 centimeters by 2100. It is believed that global warming has pushed up the temperature of the Himalayas by up to 0.60OC in the past 30 years. The rate of glacial retreat has increased since the latter half of the 1900s as a result of a rise in global temperatures, and has been more rapid than the global average. A 1OC increase in temperature may reduce yields of wheat, soybean, mustard, groundnut and potato by 3-7 per cent and much higher losses may be observed at higher average temperature. The productivity of most crops is expected to decline only marginally by 2020 but by 10- 40 per cent by 2100. Increase in CO2 content to 550 ppm (parts per million), however, may increase yields of rice, wheat and oilseeds by 10-20 per cent. Apart from crop yield, climate change may also affect reproduction of livestock due to heat distress, resulting into loss of milk production (Aggarwal et al, 2009). For India, the impact of climate change on agricultural production is also likely to vary across regions. For instance, the adverse impact of climate change on the irrigated rice production in the coastal regions (a decline of 10 per cent) would be more severe than in the Western Ghats (a decline of 4 per cent). For rain-fed rice, the reduction in yield would be up to 10 per cent in the Western Ghats. On the other hand, rain-fed rice yields are projected to increase up to 15 per cent in many districts in the east coast but reduce by up to 20 per cent in the west coast. Coconut yields are projected to increase by as much as 30 per cent in the majority of the regions in the Western Ghats by the 2030s. The increase in coconut yield is mainly attributed to the projected increase in rainfall (10 per cent) and relatively less increase in temperatures, apart from fertilization benefits (INCCA, 2010). Some simulations suggest that monsoon rainfall in the future would be accompanied by increased annual variability. Warmer climate leading to increased moisture content and sealand thermal contrast would result in heavier rainfall in the future (Turner & Annamalai, 2012). In this milieu, a better understanding of the pattern of monsoon, the El Nino phenomenon and the fuller implications of global warming and climate change would significantly help in formulating strategies and contingency plans for meeting weather related eventualities. IV. Is Indian Agriculture Monsoon Proofed? Irrigation potential in India has increased from 22.6 million hectares (mha) in 1951 to about 106 mha in 2009 (Rajya Sabha Question, 2009). India’s ultimate irrigation potential has been estimated to be 139.5 mha. Even after achieving the full irrigation potential, nearly 50 per cent of the total cultivation area will remain rain-fed (Dehadrai P.V., 2008). This highlights the persisting importance of the monsoon for Indian agriculture. According to the IMD, the long period average (LPA) rainfall (also called the normal seasonal rainfall) for SWM (June-September) over the period 1951-2000 is about 890.0 mm.7 Over this period, the SWM remained marginally below LPA (by around 1.2 per cent), with mean rainfall at around 887.5 mm, but its trend growth turned negative since the mid-1960s (Chart 4).8 Historically, years of deficient rainfall have often been associated with decline in agricultural production. Since 1980, there have been four all-India drought years, as per the IMD’s definition. These drought years also happened to be years with severe El Nino. In these years, foodgrains production declined in the range of 2-18 per cent. However, there have been outliers too, like 2000-01 when the El Nino effect was not severe but crop production declined significantly, despite a very meager shortfall in rainfall. Against this backdrop, an evaluation of the degree of insulation of Indian agriculture to monsoon variations assumes importance in academic and policy discussions, especially in the context of concerted efforts to ensure food security for the country. Initiatives taken to make agriculture less dependent on rainfall include provision of cost effective credit, capital investments in irrigation, water and soil conservation, better seeds and fertilizers, extension services, and special schemes such as the Rashtriya Krishi Vikas Yojana (RKVY), the mission mode scheme of Bringing Green Revolution to Eastern India (BGREI), the National Food Security Mission (NFSM), the National Mission on Sustainable Agriculture (NMSA) and Integrated Scheme of Oilseeds, Pulses, Oil Palm, and Maize (ISOPOM) (Economic Survey, GoI).9 A simple analytical approach that is reasonably robust with regard to the absence of unit roots and multi-collinearity reveals that although the impact of variations in the SWM on crop production is statistically significant, it is much less than the effect of net sown area (Technical Appendix 1). Illustratively, a 34 percentage point change in the SWM can affect growth of agricultural production10 by about 8 percentage points while a 6 percentage point change in net sown area could change agricultural production by 7.0 percentage points. A more realistic picture emerges when the differential impacts of positive and negative monsoon shocks are separated out (Chart 5). What is revealing is the secularly waning sensitivity of agricultural production to positive monsoon shocks over time.11 This can be attributed to saturation of land use (especially, reduced marginal productivity of land), inability to increase yields and total sowing acreage and diversification of land use towards urbanization that decelerates/reduces sowing area.12 Thus, it appears that Indian agriculture has yet not been fully immunized from monsoon shocks, especially in view of the steady impact of negative monsoon shocks (Chart 5). Empirical evidence on the insulation of Indian agriculture remains inconclusive. For instance, although the SWM was deficient by around 22 per cent during 2009-10, value addition in the crop sector declined by only 0.2 per cent. Earlier in 1999-2000 by contrast, value addition in crops expanded by 2.1 per cent despite a shortfall in SWM by 8.5 per cent. Apparently, it is the crops component of Indian agriculture which is more vulnerable to the changing pattern of SWM rainfall (Technical Appendix II). Accordingly, ongoing efforts towards diversification of agriculture in favour of allied activities could yield greater resilience to monsoon variations than alternative strategies (Chart 6). In this regard, it has been observed that agriculture does not fully support livelihoods in the rain-fed regions, given the unpredictability and changing nature of production. The higher the contributions from common pool resources and livestock, the lower the vulnerability of households and their dependence on wage labour (NABARD OP-60, 2014). 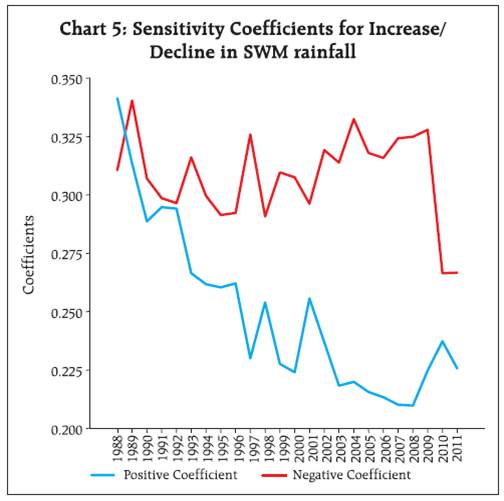 A game changer in this context is the degree of preparedness of the government to tackle eventualities like drought, prolonged dry spells and other extreme climatic conditions adversely affecting sowing and standing crops. The 2009-10 experience alluded to earlier is a case in point. A well laid out contingency plan and drought relief mechanism in anticipation of a less than normal monsoon comprised provisions for availability of quality and short duration seeds, agricultural inputs, rabi campaign and action plans for the next cropping season, media telecasting and awareness campaigns, enhanced availability of funds under centrally sponsored programmes, and additional diesel subsidy for protective irrigation for saving standing crops. In the absence of these contingency measures, the impact of deficient monsoon on crops production could have been much more severe. 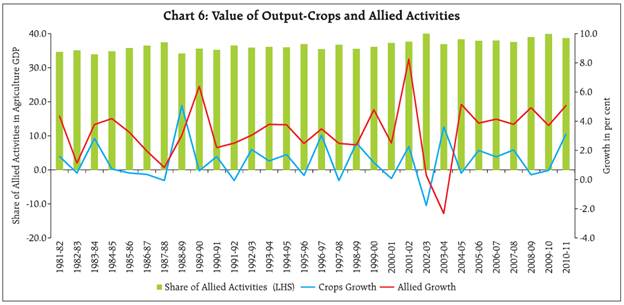 With 68 per cent of the total net sown areas classified as drought prone, of which 50 per cent is classified as “severe”, an integrated National Disaster Management Authority (NDMA) was set up in 2005 with the Ministry of Home Affairs, GoI as the nodal agency. The NDMA prepares plans for the prevention and mitigation as well as preparedness and response to natural disaster. As regard drought and agricultural related plans, district-wise contingency plans are prepared in collaboration with organizations like the Central Research Institute for Dryland Agriculture (CRIDA), State Agricultural Universities, and Indian Council of Agricultural Research (ICAR). These plans and policies are aimed at lowering the impact of droughts by encouraging water management practices, and ensuring access to food and fodder. Schemes like the National Mission on Climate Change which aims at increasing forest cover and restoring multiple ecosystems, the on-going Integrated Watershed Development Programme (IWDP), the National Food Security Mission, and the RKVY for incentivizing state investment in agriculture have been playing significant roles in making agriculture drought resilient. The synergy of these integrated schemes with the large repository of indigenous technical knowledge (ITK) relating to cloud formation, wind direction, and lightning which have evolved over centuries, and enhanced capacity for early warning and impact monitoring mechanisms is expected to help reduce the impact of drought and climate change on agriculture significantly (Rathore B.M.S. et al, 2014). V. Conclusion To conclude, Indian agriculture has not become completely insulated from large fluctuations in rainfall. However, as the 2009-10 experience shows, the impact of adverse monsoon shocks can be ameliorated by proactive policy measures. Of high concern is the declining sensitivity of the value of crop production to positive monsoon shocks, which suggests saturation of land use - exhaustion of economies of scale and stagnation in productivity. Sustainable agriculture and food security warrant comprehensive interventions, including another green revolution in pulses and oilseeds alongside the one that is underway in eastern India. A reasonable policy choice could be to earmark a share of priority sector credit for farmers/others specifically for reclamation/ development of uncultivable/fallow land in the country that can increase the total sown area. A seminal example of land reclamation can be seen in Saurashtra and neighboring Kutch - a half-desert, half-salty marsh region has now become a shining example of a farming revolution. Coupled with a number of advanced initiatives in agriculture sector development, Gujarat has become one of the fastest growing agricultural economies in the country. Another recent initiative has been undertaken by Madhya Pradesh to reclaim hillocks and plateaus of the Chambal valley in order to increase area for farm cultivation. As various studies have indicated, climate change may emerge as a significant constraint on the supply and availability of agricultural produce. Thus, large investments in micro irrigation, rainwater harvesting, efficient groundwater management, land improvements/ reclamation and more intensive use of technology to enhance productivity can help in mitigating the risks of climate change materialising in the form of monsoons shocks. Since allied activities are less sensitive to variations in the monsoon, ongoing efforts towards diversification of agriculture in favour of allied activities are expected to yield greater resilience than alternative strategies.
References Aggarwal P.K. et al, 2009, “Vulnerability of Indian Agriculture to Climate Change: Current State of Knowledge” available at http://www.moef.nic.in/sites/default/files/Vulnerability_PK%20Aggarwal.pdf Agricultural Statistics at a Glance, Various Issues, Ministry of Agriculture, Government of India, available at http://agricoop.nic.in/Agristatisticsnew.html Chand Ramesh and Raju S S (2009), “Dealing with Effects of Monsoon Failures” Economic and Political Weekly Volume XLIV No 41 October 10, 2009. Dehadrai P.V., 2008, “Irrigation in India” FAO Corporate Document Repository, available at http://www.fao.org/docrep/007/y5082e/y5082e08.htm DiLiberto, Tom, “ENSO and the Indian Monsoon… not as straightforward as you’d think’’, available at http://www.climate.gov, July 2, 2014. Earth Science Australia, available at http://earthsci.org/flooding/index.html Economic Survey, Various Issues, Government of India, http://indiabudget.nic.in/survey.asp EPA, April 2010, “Climate Change Science Facts” US Environment Protection Agency (EPA), available at http://www.epa.gov/climatechange/downloads/Climate_Change_Science_Facts.pdf FAO 2003, “World agriculture: towards 2015/2030 – An FAO Perspective” available at http://www.fao.org/fileadmin/user_upload/esag/docs/y4252e.pdf Guhathakurta P., Menon P., Mazumdar A.B., Sreejith O.P., “Changes in Extreme Rainfall Events and Flood Risk in India during last Century” , (NCC Research Report, RR No. 3/2010. ICIMOD (International Centre for Integrated Mountain Development), “Hindu Kush Himalayan Glaciers – Frequently Asked Questions” available at http://www.icimod.org/?q=1179 INCCA 2010, “Climate Change and India: A 4x4 Assessments” India Network for Climate Change Assessment (INCCA), available at http://www.moef.nic.in/downloads/public-information/fin-rpt-incca.pdf IPCC, 2007, “Impacts, Adaptation and Vulnerability” Working Group II. Available at http://www.ipcc.ch/pdf/assessment-report/ar4/wg2/ar4_wg2_full_report.pdf Joshi U. R., and Rajeevan M., “Trends in Precipitation Extremes over India”, National Climate Centre Research Report No: 3/2006. K. Krishna Kumar, “Impact of Climate Change on India’s Monsoonal Climate and Development of High Resolution Climate Change Scenarios for India” Indian Institute of Tropical Meteorology, Pune October 2009. Kumar, K. Krishna, B. Rajagopalan, M. Cane, 1999: On the Weakening Relationship between the Indian Monsoon and ENSO. Science, 284, 2156 -2159. Kumar, K. Krishna, B. Rajagopalan, M. Hoerling, G. Bates, M. Cane, 2006: Unraveling the Mystery of Indian Monsoon Failure during El Niño. Science, 314, 115-119. NABARD OP(Ocassional Paper No.60), “A Commons Story in the Rain Shadow of Green Revolution”, Mumbai, 2014. NASA, Kids Earth, “El Nino - and What is the Southern Oscillation Anyway?”, Available at http://kids.earth.nasa.gov/archive/nino/intro.html Rajeevan M., Gadgil S., Bhate J., “Active and Break Spells of the Indian Monsoon”, NCC Research Report, 7/2008.’ Rajya Sabha question (2009), Unstarred Question No. 3219 (Water Resources – Budgetary Allocation for Irrigation) dated 17.12.2009 Rathore B.M.S. et al, “Drought Conditions and Management Strategies in India” country report prepared for the regional workshop for Asia-Pacific as part of the UN-Water Initiative on “Capacity Development to Support National Drought Management Policies, Hanoi, Vietnam May 6-9, 2014. Reserve Bank of India, Annual Report 2013-14, “Low Rainfall and its Consequences” (Box I.1, Chapter I) available at http://rbidocs.rbi.org.in/rdocs/AnnualReport/PDFs/01P1AR150814.pdf Samra J S and Singh G. 2004, Heat wave of March 2004: Impact on agriculture. Indian Council of Agricultural Research. 32 pp. Synthesis and Assessment Product 4.3 (SAP 4.3): The Effects of Climate Change on Agriculture, Land Resources, Water Resources, and Biodiversity in the United States, 2008. Turner & Annamalai (2012); Climate Change and the South Asian Monsoon, Nature Climate Change 2: 587- 595, doi: 10.1038/nclimate1495.
Technical Appendix I Sensitivity of Crop Production to Monsoon Variations For the data period 1981-82 to 2010-11, the value of overall production of crops at constant prices is regressed on southwest monsoon rainfall, net irrigated area, net area sown, fertilizer consumption, real agricultural credit and gross fixed capital formation in agriculture. Fertiliser consumption, gross fixed capital formation in agriculture, real agricultural credit and net irrigated area were not statistically significant and so were dropped from the equation. In order to ensure no collinearity, variance inflation factors (VIF) test of multicollinearity was conducted. The calculated values of VIF test for the remaining predictors i.e., net area sown and south west monsoon rainfall was found to be less than 10, indicating no multi-collinearity. The final variables were then converted to first differences of their natural logarithms to transform them into annual growth rates as well as to render them stationary. The empirical result of the first order autoregression is as follows: 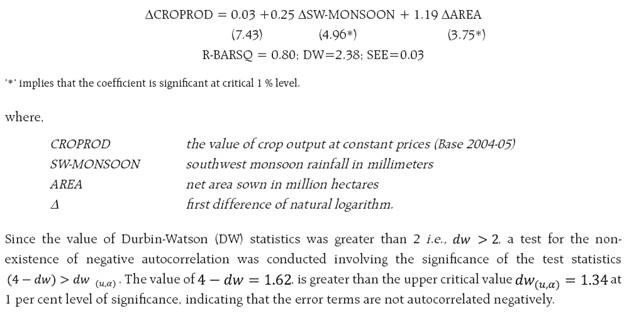
Technical Appendix II Crop Production, Allied Activities and Monsoon OLS regressions of the value of crop output and the value of output of allied activities (both at constant prices) on the dummy for deficient southwest monsoon years confirms that the impact of monsoon deficiency on allied activities during the period is statistically insignificant but it is significant for crops.
|