The annual survey on Computer Software and Information Technology Enabled Services (ITES) Exports collects information on various dimensions of exports of computer services and ITES exports, including Business Process Outsourcing (BPO). Details on export of software services are collected as per the type of activity/services (on-site/offsite) and country of destination along with the modes of supply. The results of the 2015-16 round of the survey, covering more than three-fourths of the sector’s export, are presented here. The article analyses the trend in major aggregates based on the recent survey rounds and also examines any changes in the characteristics of software services exports. I. Introduction The Reserve Bank conducts annual survey on ‘Computer Software and Information Technology Enabled Services (ITES) Exports’ for estimation of various aspects of export of Computer Services/ITES/ Business Process Outsourcing (BPO) since 2002-03 as per the recommendations of the National Statistical Commission (2001). The survey collects details of exports of computer services following the Balance of Payments and International Investment Position Manual (BPM6) of the International Monetary Fund (IMF) and the Manual on Statistics of International Trade in Services (MSITS), which is a joint effort of seven international agencies, as well as other select information on ITES/BPO services exports. The previous round of this survey1 was conducted for the reference year 2014-15. As per the MSITS, international trade in services can be conducted through four different modes, viz. (i) transactions between resident and non-resident covering cross-border supply (Mode-1), consumption abroad(Mode-2) and presence of natural person (Mode- 4) and (ii) services provided locally by the affiliates established abroad, i.e., commercial presence (Mode-3). However, as per the BoP manual, foreign affiliates established abroad are treated as the domestic units in the host economy and hence the services delivered by them are not considered as the exports of the home country. To this extent, data on services exports in BoP differs from those in the Foreign Affiliates Trade Statistics (FATS). For latest survey round, which was tenth in the series, the survey schedule was canvassed among around 7,200 companies, of which 1,162 companies including most of the large IT companies, responded. 123 of these were for Nil-return or for closed companies and the remaining 1,039 companies together accounted for 77.6 per cent of the total software services exports during the year. The methodology for estimation of software exports of the non-responding companies is given in the Annex. II. Software Services Exports from India – Recent Trends Computer Software and IT-enabled services are important activity in the Indian economy, which also have significant net exports. As per balance of payments (BoP) statistics, India’s software services exports (other than on-site exports), stood at ₹4,854.6 billion in 2015- 16, which constituted nearly 48 per cent of total services exports of India and stood at around 3.6 per cent of GDP. Export of Software services are divided into two major categories in this survey: (i) Computer Services exports which include IT services as well as Software Product Development; and (ii) ITES/BPO services (including engineering services). During 2015-16, export of computer software services and ITES/BPO services are estimated at ₹4,104.4 billion (US$ 62.7 billion) and ₹1,658.7 billion (US$ 25.3 billion), respectively. In addition, there was substantial export through overseas commercial presence. 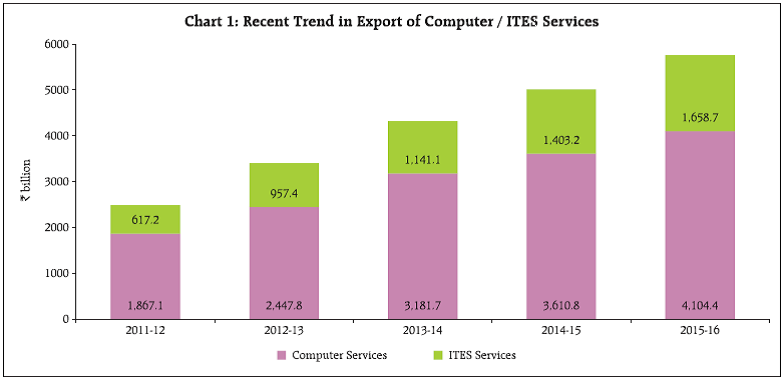 India’s total export of computer services and ITES/ BPO services by Mode-1, Mode-2 and Mode-4 (i.e., excluding commercial presence) is estimated at ₹5,763.1 billion (US$ 88.0 billion), indicating that the annual growth decelerated to 7.3 per cent in US $ terms as compared with more than 14 per cent growth in the preceding three years. Computer services continue to be the dominant component of India’s software services exports during 2015-16 (around 71.2 per cent share: Chart 1 and Table 1). The share of ITES/BPO services in the total Computer software and ITES services exports continued to rise during the year. ‘IT services’ remained the major component in the ‘Computer Services’ category. | Table 1: Components of Software Services Exports from India | | (₹ billion) | | Activity | Software Services Exports | Share in Total (%) | | 2011-12 | 2012-13 | 2013-14 | 2014-15 | 2015-16 | 2011-12 | 2014-15 | 2015-16 | | (1) | (2) | (3) | (4) | (5) | (6) | (7) | (8) | | A) Computer Services | 1,867.1 | 2,447.8 | 3,181.7 | 3,610.8 | 4,104.4 | 75.2 | 72.0 | 71.2 | | Of which: i) IT services | 1,661.8 | 2,256.7 | 2,936.7 | 3,399.7 | 3,862.8 | 66.9 | 67.8 | 67.0 | | ii) Software Product Development | 205.3 | 191.1 | 245.0 | 211.1 | 241.6 | 8.3 | 4.2 | 4.2 | | B) ITES/BPO Services | 617.2 | 957.4 | 1,141.1 | 1,403.2 | 1,658.7 | 24.8 | 28.0 | 28.8 | | Of which: i) BPO Services | 523.0 | 789.6 | 934.2 | 1,089.2 | 1,336.8 | 21.0 | 21.7 | 23.2 | | ii) Engineering Services | 94.2 | 167.8 | 206.9 | 314.0 | 321.9 | 3.8 | 6.3 | 5.6 | | Total Export of Software Services (A+B) | | | | | | | | | | in ₹ billion (A+B) | 2,484.3 | 3,405.2 | 4,322.8 | 5,014.0 | 5,763.1 | 100.0 | 100.0 | 100.0 | | in US $ billion * | 51.8 | 62.6 | 71.4 | 82.0 | 88.0 | | | | | Annual Growth (in US $ terms) | | 20.8 | 14.1 | 14.9 | 7.3 | | | | | * Using Average Exchange Rate for the year (applicable for all tables) |
| Table 2: Industry-wise Share of ITES/BPO Services Exports | | (per cent) | | Activity | 2011-12 | 2012-13 | 2013-14 | 2014-15 | 2015-16 | | (1) | (2) | (3) | (4) | (5) | | BPO Services | 84.7 | 82.5 | 81.9 | 77.6 | 80.6 | | Customer interaction services | 14.4 | 10.9 | 8.4 | 4.6 | 3.5 | | Finance and Accounting, auditing, book keeping and tax consulting services | 23.5 | 9.7 | 11.2 | 12.2 | 11.2 | | HR Administration | 0.2 | 0.9 | 0.7 | 0.9 | 1.2 | | Procurements and logistics | 0.0 | 0.4 | 0.3 | 0.5 | 0.5 | | Medical transcription | 0.2 | 0.7 | 1.3 | 1.0 | 0.8 | | Document Management | 0.4 | 0.5 | 0.9 | 0.7 | 0.4 | | Content development and management and publishing | 0.7 | 1.4 | 0.9 | 0.9 | 0.8 | | Other BPO services | 45.3 | 58.0 | 58.2 | 56.8 | 62.2 | | Engineering Services | 15.3 | 17.5 | 18.1 | 22.4 | 19.4 | | Embedded Solutions | 2.1 | 4.1 | 5.3 | 4.1 | 4.3 | | Product Design Engineering (mechanical, electronics excluding software) | 7.0 | 5.9 | 5.5 | 5.9 | 5.1 | | Industrial automation and enterprise asset management | 0.0 | 2.4 | 0.2 | 0.2 | 0.1 | | Other Engineering services | 6.2 | 5.1 | 7.1 | 12.2 | 9.9 | | Total BPO Services | 84.7 | 82.5 | 81.9 | 22.4 | 100.0 | III. Industry-wise Distribution of ITES/BPO Services Exports Exports of ITES/BPO services are compiled for industry classification given by the Department of Information Technology (DIT-2003), Government of India. Among the BPO services exports, ‘Finance and Accounting, auditing, book-keeping and tax consulting services’ and ‘Customer interaction services’ were the major components during 2015-16. There was substantial increase of ₹247.6 billion in export of BPO services as compared with an increase of ₹155.1 billion in the previous year. On the other hand, the increase in exports in Engineering services moderated to only ₹7.9 billion (₹107.1 billion in the previous year) (Table 1). Among BPO services, the share of ‘Customer interaction services’ and the share of ‘Finance and Accounting, auditing, book-keeping and tax consulting services’ declined (Table 2). The share of ‘Embedded Solutions’ among Engineering services increased marginally during the year. However, ‘other BPO services’ (i.e., Legal services, Animation, Gaming, Pharmaceuticals and biotechnology services, etc., as well as combination of services) constituted more than half of the ITES/BPO services, which recorded an increase of ₹236.2 billion in 2015-16 (Table 2). IV. Organisation-wise Distribution of Software Services Exports The increased presence of foreign subsidiaries of Indian companies resulted in higher share of Private Limited Companies in total software exports. Public limited companies, however, continued to have the dominant share of the total software services exports but their share continued to show downward trend and reached to 54.4 per cent in 2015-16 from 64.6 per cent in 2012-13 (Table 3). | Table 3: Organisation-wise Share of Software Services Exports | | (per cent) | | Organisation | 2011-12 | 2012-13 | 2013-14 | 2014-15 | 2015-16 | | (1) | (2) | (3) | (4) | (5) | | Private Limited Companies | 41.2 | 35.3 | 36.0 | 43.1 | 44.3 | | Public Limited Companies | 58.7 | 64.6 | 63.6 | 55.6 | 54.4 | | Others | 0.1 | 0.1 | 0.4 | 1.3 | 1.3 | | Total | 100.0 | 100.0 | 100.0 | 100.0 | 100.0 |
V. Country-wise Distribution of Software Services Exports United States & Canada remained the top destination for software services exports from India, followed by Europe, which had nearly one-fourth share. The share of United States & Canada in software export increased to 61.7 per cent during 2015-16 from 59.9 per cent in the previous year, whereas the share of Europe and Asia declined (Chart 2). VI. Currency Composition of Software Services Exports US Dollar remained the leading invoice currency for export of software services. During 2015-16, nearly three-fourth of total invoicing was US dollardenominated. Software exports invoicing in Indian Rupee declined to 1.3 per cent in 2015-16 from 3.4 per cent in the previous year. The shares of USD, GBP and EUR currencies increased during 2015-16 (Chart 3).
| Table 4: Share of On-site and Off-site Exports | | (per cent) | | Type of Services | 2011-12 | 2012-13 | 2013-14 | 2014-15 | 2015-16 | | (1) | (2) | (3) | (4) | (5) | | On-site (Mode-4) | 17.8 | 15.8 | 19.8 | 20.0 | 19.9 | | Off-site (Mode-1 & Mode-2) | 82.2 | 84.2 | 80.2 | 80.0 | 80.1 | | Total | 100.0 | 100.0 | 100.0 | 100.0 | 100.0 | VII. Modes of Software Services Exports India’s export of Software services are through both on-site and off-site routes. The share of export of software services through on-site mode and off-site mode in 2015-16 remained around the previous year’s level (Table 4). The survey collected the software services trade data on all four modes of supply. The total international trade in computer services by India of all four modes of supply together stood at ₹7,102.8 billion (US$ 107.1 billion) in 2015-16. The share of software services exports by India through Mode-3 (commercial presence) increased in 2015-16, while that through Mode-1 (cross-border supply: which has highest share among all modes) declined (Table 5). VIII. Software Business of Subsidiaries/Associates For the purpose of Foreign Affiliates Trade Statistics (FATS), the survey also collects information on the software business of foreign subsidiaries/associates of Indian companies under the heads of software business done in the host country, i.e., locally, to India and to other countries. The total software business of the foreign affiliates of Indian companies (excluding the services provided to India) increased to ₹1,513.8 billion (US$ 23.2 billion) as compared with ₹998.6 billion (US$ 16.6 billion) in the previous year. The business of these subsidiaries to India decreased to ₹323.0 billion (US$ 4.9 billion) in 2015-16 as compared with ₹335.7 billion (US$ 5.5 billion) in the previous year. | Table 5: Software Services Exports by Different Modes | | (per cent) | | Type of Mode | 2011-12 | 2012-13 | 2013-14 | 2014-15 | 2015-16 | | (1) | (2) | (3) | (4) | (5) | | Mode 1 (cross-border supply) | 69.0 | 74.7 | 69.1 | 68.4 | 64.8 | | Mode 2 (consumption abroad) | 0.5 | 1.6 | 0.1 | 0.1 | 0.2 | | Mode 3 (commercial presence) | 15.4 | 9.4 | 13.7 | 14.4 | 18.9 | | Mode 4 (presence of natural person) | 15.1 | 14.3 | 17.1 | 17.1 | 16.1 |
| Table 6: Software Business by Foreign Affiliates of Indian Companies | | (₹ billion) | | Activity | 2011-12 | 2012-13 | 2013-14 | 2014-15 | 2015-16 | | Locally | To India | Other Countries | Locally | To India | Other Countries | Locally | To India | Other Countries | Locally | To India | Other Countries | Locally | To India | Other Countries | | (1) | (2) | (3) | (4) | (5) | (6) | (7) | (8) | (9) | (10) | (11) | (12) | (13) | (14) | (15) | | IT services | 27.5 | 10.7 | 5.4 | 23.9 | 1.8 | 0.4 | 37.4 | 2.0 | 3.0 | 28.5 | 2.2 | 3.1 | 36.5 | 3.2 | 8.1 | | Software Product Development | 1.6 | 0.7 | 8.0 | 5.0 | 2.3 | 11.2 | 0.0 | 0.0 | 14.1 | 7.4 | 0.6 | 16.4 | 3.7 | 0.5 | 15.8 | | BPO Services | 31.0 | 4.4 | 12.3 | 15.9 | 0.4 | 3.6 | 7.1 | 0.1 | 0.2 | 17.4 | 2.3 | 6.2 | 58.0 | 0.9 | 7.6 | | Engineering Services | 1.5 | 0.3 | 20.6 | 1.6 | 0.5 | 0.0 | 0.1 | 0.0 | 0.0 | 4.5 | 0.0 | 0.1 | 0.9 | 0.2 | 0.1 | | Other services | 391.8 | 0.4 | 20.8 | 307.4 | 184.6 | 28.9 | 644.3 | 274.6 | 118.9 | 783.9 | 330.6 | 131.1 | 1,240.6 | 318.2 | 142.5 | | Total (₹ billion) | 453.4 | 16.4 | 67.0 | 353.8 | 189.6 | 44.1 | 689.0 | 276.7 | 136.2 | 841.7 | 335.7 | 156.9 | 1,339.7 | 323.0 | 174.1 | | Total (USD billion) | 9.5 | 0.3 | 1.4 | 6.5 | 3.5 | 0.8 | 11.4 | 4.6 | 2.3 | 13.8 | 5.5 | 2.6 | 20.5 | 4.9 | 2.7 | Indian companies providing the combination of the four broad group of services (viz., IT services, Software product development, BPO services and Engineering services) were classified under ‘Other services’ category. Under ‘Other Services’ category, foreign affiliates were the major source for generating the software business outside India. Software services provided by foreign affiliates in all countries increased for ‘IT services’ and ‘BPO services’, whereas it decreased for ‘Software product development’ and ‘Engineering services’. USA accounted for nearly two-third share of total software business by foreign affiliates in 2015-16, followed by UK which had around nine per cent share. Among other major countries, the share of USA and Canada decreased, whereas the share of UK and Germany increased in the total software business of foreign affiliates during the year (Table 7). | Table 7: Software Business by Foreign Affiliates of Indian Companies- Country-wise Distribution | | (per cent) | | Country | 2011-12 | 2012-13 | 2013-14 | 2014-15 | 2015-16 | | (1) | (2) | (3) | (4) | (5) | | USA | 65.0 | 71.3 | 65.4 | 66.7 | 64.6 | | United Kingdom | 5.3 | 6.6 | 7.9 | 8.0 | 9.2 | | Canada | 3.6 | 4.1 | 4.1 | 3.3 | 2.4 | | Germany | 2.9 | 3.0 | 3.5 | 2.4 | 2.9 | | Singapore | 4.4 | 2.7 | 3.3 | 3.3 | 3.3 | | Netherlands | 4.3 | 2.1 | 3.2 | 2.3 | 2.5 | | Other Countries | 14.5 | 10.2 | 12.6 | 14.0 | 15.1 | | Total | 100.0 | 100.0 | 100.0 | 100.0 | 100.0 | IX. Conclusion Indian software industry has been recording respectable export growth, including through overseas presence, despite moderation in the pace of global growth in the recent years. The pace of growth in India’s export of computer software and ITES/BPO companies, however, moderated during 2015-16, in US dollar terms. During the year, export of computer software services recorded slower growth than the ITES/BPO export. Total international trade in software services by India, including the services delivered by foreign affiliates established abroad, is estimated at ₹7,102.8 billion (US$ 108.5 billion) in 2015-16, where software exports by foreign affiliates of Indian companies stood at ₹1,836.8 billion (US$ 28.1 billion) in 2015-16. Mode- 1 (cross-border supply) continued to be the major mode of software services exports and on-site exports accounted for another one-fifth of total software exports in 2015-16. USA continued to remain the major destination for software exports as well as software business by foreign affiliates of Indian companies though there was some diversification in recent years. US dollar remained the invoice currency for nearly three-fourths of the software exports. Box: Comparison of survey results with NASSCOM and BoP data The Reserve Bank publishes the software exports data in BoP using data reporting by Authorised Dealers (ADs), STPI and also the software exports data released by the NASSCOM. This accounts for only non-physical offsite software exports. As per the BoP data released by RBI, non-physical (off-site) software exports stood at ₹4,854.6 billion in 2015-16 which does not include on-site software exports. Adding the on-site software exports of ₹1,145.7 billion (US$ 17.5 billion), as reported in the survey, the total software services exports in 2015-16 worked out to ₹6,000.3 billion (US$ 91.7 billion). NASSCOM publishes exports of IT-BPO industry which is based on the global software business of the Indian software companies, i.e., software exports of Indian companies together with the software business of their overseas subsidiaries. Accordingly, in order to make the data generated through the RBI’s survey on Software & ITES/BPO Services Exports comparable with NASSCOM data, the software business of overseas subsidiaries of Indian companies have been added to the estimated software services exports of India, based on the survey. Based on the survey, export of software services from India in 2015-16 was estimated at ₹5,763.1 billion (US$ 88.0 billion) and the software business done by the Indian subsidiaries abroad in 2015-16 was estimated at ₹1,339.7 billion (US$ 20.5 billion). Thus, the global software export of India based on the survey was ₹7,102.8 billion (US$ 108.5 billion) as against ₹7,070 billion (US$ 108.0 billion) published by the NASSCOM. The software business done by the overseas subsidiaries of Indian companies accounted for 18.9 per cent of the global software business, estimated through the survey. The survey results are quite comparable with the software exports data released by NASSCOM and also with the software service exports data of BoP. | Reconciliation of Software Exports of India during 2015-16 | | (₹ billion) | | Software exports as per NASSCOM (Global business) | Software Exports based on annual Survey | Software Exports based on Balance of Payment Statistics | | Indian companies (Mode 1, Mode 2 & Mode 4) | Subsidiaries abroad (Mode 3 & export of Subsidiaries other than India) | Global Business | Software Exports based on BoP data | On-site software exports based on survey (Mode 4) | Total Software Services Exports of India | | (1) | (2) | (3) | (4)=(2)+(3) | (5) | (6) | (7)=(5)+(6) | | 7,070.6 | 5,763.1 | 1,339.7 | 7,102.8 | 4,854.6 | 1,145.7 | 6,000.3 |
Annex Methodology for estimation of Software Services Exports of Non-responding companies Annual survey on Software and IT Services Exports for the period 2015-16 was launched among nearly 7,200 Software and ITES/BPO companies. Of these, 1,162 companies responded to the survey which included 123 NIL and closed companies. The nonrespondent companies were generally the smaller companies, as the 1,039 active companies that supplied data included all major companies in the sector. Using the observed proportion, number of companies with NIL exports was estimated from 6,038 nonrespondent companies and software exports have been estimated for the remaining 5,399 nonresponded companies, using the following method: I. Based on the ITES/BPO reported activity, companies have been classified in four groups, viz.; IT Services, ITES/BPO Services, Engineering Services and Software Product Development Services (having 100 per cent business under respective group). II. For classifying the other companies having combination of these as their business activity, reported proportions of their exports done in IT, BPO, Engineering and Software Product Development services have been used. III. Based on the reported data, it was observed that ‘On-site’ software export was primarily reported by the major companies. Therefore, only offshore software exports component was used for estimating software export of non-responded companies. IV. As the observed distribution of exports was highly positively skewed in each of these groups, median was used for estimating software exports in each group. Estimated software exports for ith group of nonresponding companies The total software export of India has been compiled as the sum of reported software exports and the estimated software export for non-responded companies in each of the four groups. Using the methodology given above, the software services exports of non-respondent companies was estimated to the tune of ₹1290.3 billion (around 22.4 per cent of total software services exports).
|