This article analyses the key features of the Union Budget 2017-18 against the backdrop of an uncertain economic and political environment globally but with major policy initiatives undertaken domestically. The aim to “Transform, Energise and Clean (TEC) India” will warrant stepped-up expenditure for the poor and the underprivileged within the overall framework of fiscal prudence and economic reforms to accelerate growth. Union Budget 2017-18: Highlights • With the Central Government’s targets for 2016-17 in terms of key deficit indicators being achieved through buoyant tax and non-tax revenues, the gross fiscal deficit (GFD) and the revenue deficit (RD) are budgeted to decline in 2017-18, reflecting continued commitment to fiscal consolidation even as the GFD-GDP (gross domestic product) target of 3.0 per cent has been deferred to 2018-19 from 2017-18. • On the receipts side, gross tax revenue is expected to be driven by buoyant income tax collections while the growth in indirect taxes would moderate. • Outlook on disinvestment receipts in 2017-18 is bullish notwithstanding the shortfall of about 20 per cent in 2016-17. • Revenue expenditure is budgeted to decelerate sharply to accommodate a sustained pace of capital expenditure, even as the expenditure classification between Plan and Non-Plan has been eliminated. • Overall, the Budget carries a pro-farmer prorural focus, with targeted policy for sectors most affected after demonetisation such as housing, Small and Medium Enterprises (SMEs) and the farm sector designed to stimulate consumption demand while higher infrastructure spending is encouraged to strengthen the pace of growth. The major policy initiatives proposed in the Budget are highlighted in Box 1. Box 1: Union Budget 2017-18 - Key Initiatives Ten elements of a cohesive development strategy were announced in the Budget. Taken together, they carry important implications for the evolving trajectory of the Indian economy which can be distilled into three broad categories. I. Fiscal Discipline For the first time, a consolidated Outcome Budget, covering all Ministries and Departments, was presented along with the other Budget documents. The gross fiscal deficit for 2017-18 is targeted at 3.2 per cent of GDP and 3 per cent in the following year. The revenue deficit for 2017-18 is pegged at 1.9 per cent as against 2.0 per cent mandated by the FRBM Act. Extensive efforts are planned for the smooth implementation of the goods and services tax (GST). II. Financial Sector Reforms Key financial sector reforms proposed in the Budget include: (i) allocation of ₹ 100 billion for recapitalisation of banks in line with the ‘Indradhanush’ roadmap; (ii) listing the shares of Railway public sector enterprises (PSEs) like Indian Railway Catering and Tourism Corporation Limited (IRCTC), Indian Railway Finance Corporation (IRFC) and Indian Railway Construction Company (IRCON) on stock exchanges; (iii) revised mechanism and procedure to ensure time bound listing of identified central public sector enterprises (CPSEs) on stock exchanges; (iv) establishing a Computer Emergency Response Team for Financial Sector (CERT-Fin) to safeguard the integrity and stability of the financial sector; (v) a Bill relating to resolution of financial firms to be introduced to contribute to stability and resilience of the financial system; (vi) a Bill to curtail the menace of illicit deposit schemes to be introduced to protect the poor from unscrupulous entities; and (vii) no transaction above ₹ 3 lakh to be permitted in cash subject to certain exceptions. III. Structural Reforms Major structural reforms include: (i) framing a model law on contract farming for States for better price realisation and reduction of post-harvest losses; (ii) setting up a Dairy Processing and Infrastructure Development Fund in National Bank for Agriculture and Rural Development (NABARD) to ensure adequate milk processing infrastructure; (iii) increasing Mahatma Gandhi National Rural Employment Guarantee Act (MGNREGA) allocation and reorienting the scheme to support doubling farmers’ income; (iv) the National Housing Bank (NHB) to refinance individual housing loans of about ₹ 20,000 crore in 2017-18 to facilitate higher investment in affordable housing; (v) amending the Drugs and Cosmetics Rules to ensure availability of drugs at reasonable prices; (vi) abolishing the Foreign Investment Promotion Board (FIPB) and further liberalization of the FDI policy; (vii) launching a new and restructured Central scheme, namely, Trade Infrastructure for Export Scheme (TIES); (viii) amending the Airport Authority of India Act to enable effective monetisation of land assets; (ix) creating a Payments Regulatory Board in the Reserve Bank of India by replacing the existing Board for Regulation and Supervision of Payment and Settlement Systems; and (x) rationalising the number of tribunals and merging of tribunals wherever appropriate. Other reforms include limiting the maximum amount of cash donation from one person to a political party to ₹2000 and amending the Reserve Bank of India Act to enable the issuance of electoral bonds in accordance with a scheme to be framed by the Government of India. I. Fiscal Performance in 2016-17 (Revised Estimates) Central finances were shored up as a continuation of the recent phase of fiscal consolidation that commenced from 2012-13. RD at 2.0 per cent of GDP was lower than the budgeted target of 2.3 per cent while the GFD was contained at the budgeted 3.5 per cent in 2016-17 (Chart 1). 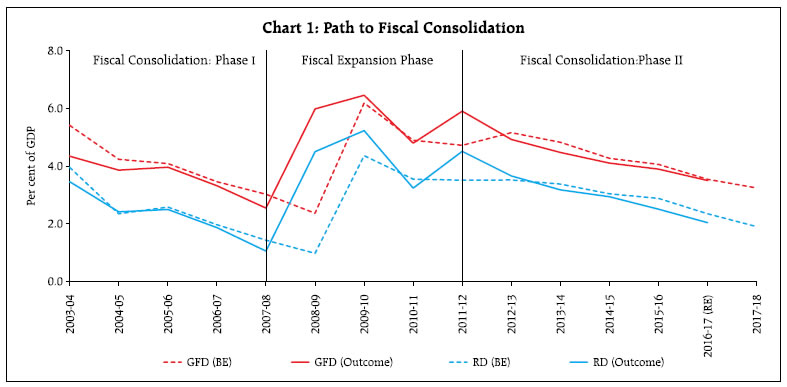 The fiscal strategy for 2016-17 was mainly revenue-driven, with buoyant tax and non-tax inflows comfortably funding additional expenditure commitments relating to implementation of the seventh Central pay commission (CPC-VII) and one rank one pension (OROP) awards. In fact, total revenues from direct and indirect taxes (net of devolution to states) exceeded the budget estimate (BE) significantly. While direct tax revenues were bolstered by collections of around ₹ 674 billion under the Income Declaration Scheme (IDS), indirect taxes posted strong growth in terms of collections of union excise duty (34.5 per cent) and service tax (17.1 per cent). Revenue from union excise duty was 21.6 per cent higher than budgeted reflecting the impact of upward revision in the clean environment cess, the imposition of the infrastructure cess on certain motor vehicles, additional excise duty on jewellery articles and increase in excise duty on tobacco products. Imposition of krishi kalyan cess on services with effect from June 1, 2016 and pruning of the Negative List provided a boost to service tax collections. Non-tax revenues exceeded the budgetary targets by 3.7 per cent due to higher receipts from dividends and profits, despite shortfalls in: (i) net receipts from communication services (₹ 787 billion vis-a-vis ₹ 990 billion in the BE) as high value bands remained unsold and (ii) proceeds from disinvestment. Total non-debt receipts turned out to be higher than budgeted by 1.8 per cent. Revenue expenditure was broadly contained at the budgeted level despite the pressure of additional expenditure referred to earlier. Capital expenditure significantly exceeded the BE (by 13.3 per cent), recording a growth of 10.6 per cent over and above the growth of 28.6 per cent in the previous year - indicating sustained improvement in the quality of fiscal consolidation. II. Budget Estimates for 2017-18 Centre’s GFD and RD are budgeted to decline by 0.3 percentage point and 0.1 percentage point to 3.2 per cent and 1.9 per cent of GDP, respectively, in 2017- 18 (Statement 1). The Government, however, deferred the achievement of the GFD-GDP target of 3.0 per cent by one year i.e., from 2017-18 to 2018-19,1 which is also at variance with the fiscal roadmap espoused by the recently released FRBM Review Committee, 2017 (Chairman: N. K. Singh)2. The effective revenue deficit (ERD)3 is estimated at 0.7 per cent of GDP – an improvement of 0.2 per cent of GDP over 2016-17 (RE). The elimination of ERD was postponed beyond 2019-20 on account of structural issues relating to booking of grant in aid for creation of capital assets in the revenue side4 (Table 1). | Table 1: Deficit Targets – Shifting Goal Posts | | Deficit Indicator | Target
(as % of GDP) | Year for achievement of Target | | As per amended FRBM Act/Rules (2013) | Union Budget 2014-15 | Union Budget 2015-16 | Union Budget 2016-17 | Union Budget 2017-18 | | 1 | 2 | 3 | 4 | 5 | 6 | 7 | | Revenue Deficit | 2 | 2014-15 | 2015-16 | 2017-18 | 2017-18 | 2017-18 | | Effective Revenue Deficit | 0 | 2014-15 | 2016-17 | 2017-18 | 2018-19 | Postponed beyond 2019-20 | | Gross Fiscal Deficit | 3 | 2016-17 | 2016-17 | 2017-18 | 2017-18 | 2018-19 | The targets for fiscal indicators are expected to be achieved through an increase in non-debt receipts, particularly through tax revenues and disinvestment proceeds while making room for enhanced budgetary allocation towards the farm and rural sector, the social sector, infrastructure and employment generation (Table 2). | Table 2: Fiscal Position of the Central Government | | | Per cent to GDP | Growth (%) | | 2015-16 | 2016-17 (RE) | 2017-18 (BE) | 2015-16 | 2016-17 (RE) | 2017-18 (BE) | | 1 | 2 | 3 | 4 | 5 | 6 | 7 | | Receipts | | | | | | | | Revenue Receipts | 8.7 | 9.3 | 9.0 | 8.5 | 19.1 | 6.5 | | (i) Tax Revenue (Net) | 6.9 | 7.1 | 7.3 | 4.4 | 15.4 | 12.7 | | (ii) Non-Tax Revenue | 1.8 | 2.2 | 1.7 | 27.0 | 33.2 | -13.7 | | Non Debt Capital Receipts | 0.5 | 0.4 | 0.5 | 22.3 | -10.2 | 49.2 | | of which : Disinvestment receipts | 0.3 | 0.3 | 0.4 | 11.6 | 8.0 | 59.3 | | Expenditure | | | | | | | | Revenue Expenditure | 11.2 | 11.4 | 10.9 | 4.8 | 12.8 | 5.9 | | Capital Expenditure | 1.9 | 1.8 | 1.8 | 28.6 | 10.6 | 10.7 | | Total Expenditure | 13.1 | 13.2 | 12.7 | 7.6 | 12.5 | 6.6 | | Scheme Expenditure | 5.3 | 5.7 | 5.6 | - | 20.0 | 8.6 | | Expenditure on other than schemes | 7.8 | 7.5 | 7.1 | - | 7.4 | 5.0 | | of which | | | | | | | | 1. Interest Payments | 3.2 | 3.2 | 3.1 | 9.7 | 9.4 | 8.3 | | 2. Subsidies | 1.9 | 1.7 | 1.6 | 2.3 | -1.4 | 4.5 | | Note: - : Data not available | II.1 Non-Debt Receipts II.1.a. Tax Revenue The budgeted growth in tax revenues in 2017-18 [12.2 per cent (gross) and 12.7 per cent (net)] is expected to raise the gross tax revenue-GDP ratio to 11.3 per cent - the highest since 2007-08. Another noteworthy evolution is the increasing reliance on direct taxes vis-à-vis indirect taxes in mobilising revenues (Chart 2). Direct taxes are budgeted to grow sharply in 2017- 18, mainly on account of the levy of a surcharge of 10 per cent on tax payable for individual assesses in the income bracket of ₹ 50 lakh - 1 crore that will facilitate income tax collections to grow by an estimated 24.9 per cent. Indirect taxes, on the other hand, are estimated to grow at a modest pace, reflecting: (i) the high base of 2016-17; and (ii) conservative accounting of potential revenue from the likely implementation of the GST. The government has not announced any additional revenue mobilisation (ARM) measure relating to indirect taxes in 2017-18. The greater emphasis on direct taxes in 2017-18 is also reflected at the disaggregated level in terms of higher buoyancy of corporation and personal income taxes (Table 3). 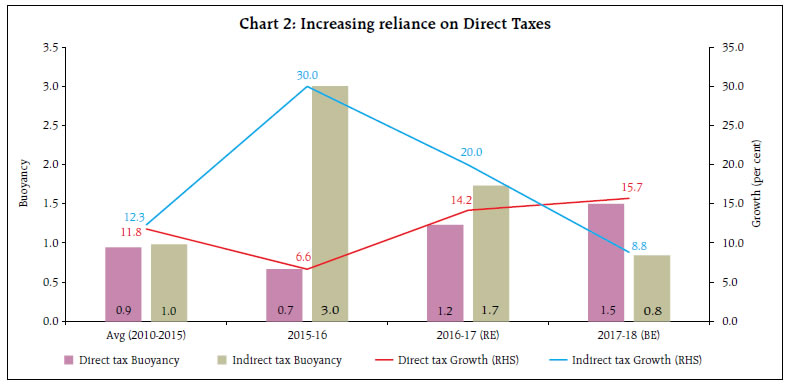
| Table 3: Tax Buoyancy | | | Average Tax Buoyancy
(2008-09 to 2016-17) | Post Crisis Tax Buoyancy
(2010-11 to 2016-17) | 2016-17 Revised Estimates | Budgeted Tax Buoyancy for 2017-18 | | 1 | 2 | 3 | 4 | 5 | | Gross Tax Revenue | 0.97 | 1.19 | 1.48 | 1.17 | | Corporation Tax | 0.81 | 0.78 | 0.78 | 0.87 | | Income Tax | 1.02 | 1.21 | 1.98 | 2.38 | | Customs Duty | 0.66 | 1.05 | 0.27 | 1.23 | | Union Excise Duty | 1.26 | 1.80 | 2.99 | 0.48 | | Service Tax | 1.56 | 1.84 | 1.48 | 1.06 | The Government has refrained from proposing changes in the current regime of excise and service taxes owing to the imminent implementation of the GST in 2017-18. Measures like reduction in the personal income tax in the lowest bracket and in the corporation tax for SMEs with turnover below ₹ 50 crores are likely to increase disposable income and enhance compliance at the lower level of the corporate pyramid. II.1.b Non-Tax Revenue Non-tax revenues comprising dividend payments from PSEs, public sector undertaking (PSU) banks, the Reserve Bank of India and proceeds from spectrum auctions are budgeted to decline by 13.7 per cent in 2017-18 due to estimated lower spectrum auction receipts compared to the previous year. Accordingly, telecom receipts are projected to decrease to ₹ 443 billion in 2017-18 (BE) from ₹ 787 billion in 2016-17 (RE). II.1.c Non-debt Capital Receipts The target for disinvestment has been projected to grow by 59.3 per cent in 2017-18 (BE) over 2016-17 (RE) (Box 2). Box 2: Disinvestment Shortfall - Downside Risk The Budget has pegged disinvestment at ₹ 725 billion - ₹ 465 billion stake sale in PSEs, ₹ 150 billion disinvestment in strategic and minority stake holdings and ₹ 110 billion through listing of insurance companies. In 2016-17 (RE), the target set for PSU stake sale was achieved but strategic disinvestment fell short of the target by ₹ 150 billion. Consequently, actual disinvestments turned out to be around 80 per cent of the budget estimate (Chart I). 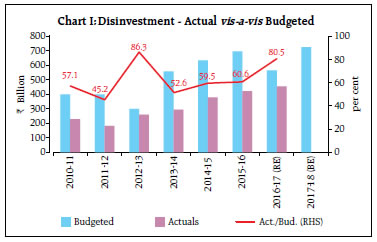 In view of the record of non-realisation of disinvestment targets, it is prudent to evaluate the impact of these slippages on the gross fiscal deficit. Three scenarios are presented. In Scenario 1, the average of actual disinvestment during the six years (2010-11 to 2015-16) is taken as the outcome for 2017-18. In Scenario 2, the highest disinvestment realised during these six years is assumed as the actual realisation for 2017-18. In Scenario 3, the highest proportion of actual to budgeted levels during the same period is projected as the realised proportion for 2017-18. Scenario 1 works out to a GFD-GDP ratio of 3.5 per cent, i.e., a GFD slippage of 0.3 per cent of GDP from the budgeted 3.2 per cent for 2017-18. In Scenario 2, the GFD-GDP ratio rises to 3.4 per cent (slippage of 0.2 per cent). The slippage works out to 0.1 per cent of GDP, i.e., GFD-GDP of 3.3 per cent in Scenario 3. Since the Government has resorted to conservative accounting for projecting tax revenue in view of the GST, shortfalls on disinvestment are unlikely to be met by tax revenues and poses a downside risk to fiscal consolidation. II.2 Total Expenditure The Government has implemented a major reform by removing the classification between Plan and Non-Plan expenditure and replaced it with the constitutionally mandated and universally accepted practice of classifying aggregate expenditure into revenue and capital. Total expenditure of the Central Government is budgeted to grow slower in 2017-18 than a year ago. With growth in revenue expenditure projected to moderate vis-a-vis capital expenditure, the revenue:capital proportion is estimated at 86:14 as against the five year average of 87:13. Total expenditure in 2017-18 (BE) is, however, 2.3 per cent higher than the projection made in the medium term expenditure framework (MTEF) statement. II.2.a Revenue Expenditure Revenue expenditure growth is estimated to moderate in 2017-18 relative to the previous year when additional expenditure was required for implementation of CPC VII and OROP awards. In continuation with reforms, expenditure on total subsidies as a proportion of GDP is estimated to decrease in 2017-18 from 2016-17 (RE) (Table 4). The Government has taken important steps towards rationalisation of major subsidies. With diesel and petrol being fully decontrolled from January 1, 2015, petroleum subsidies now relate mainly to kerosene and liquefied petroleum gas (LPG). Having implemented direct benefit transfer (DBT) for LPG subsidies, the Government has initiated reforms in kerosene subsidies. Accordingly, while the PDS kerosene allocations to states have been rationalised from 2016-17 in line with the Expenditure Management Commission’s recommendations, steps are also being taken to enhance DBT coverage for kerosene. While adoption of the National Food Security Act has expanded the food subsidy coverage to approximately 80 crore beneficiaries, the Government aims at containing the food subsidy through reduced leakages - automation of fair price shops in six states and seeding of 72 per cent of ration cards with Aadhar. In order to improve allocative efficiency and better targeting of fertiliser subsidies, the Department of Fertiliser has chalked out a programme to implement DBT in revised form through pilot projects in 16 districts. | Table 4 : Total Subsidies | | (₹ Billion) | | Items | 2015-16 | 2016-17 (BE) | 2016-17 (RE) | 2017-18 (BE) | | Amount | Per cent to GDP | Amount | Per cent to GDP | Amount | Per cent to GDP | Amount | Per cent to GDP | | 1 | 2 | 3 | 4 | 5 | 6 | 7 | 8 | 9 | | Total Subsidies | 2,641 | 1.9 | 2,631 | 1.7 | 2,605 | 1.7 | 2,723 | 1.6 | | i. Food | 1,394 | 1.0 | 1,348 | 0.9 | 1,352 | 0.9 | 1,453 | 0.9 | | ii. Fertiliser | 724 | 0.5 | 700 | 0.5 | 700 | 0.5 | 700 | 0.4 | | iii. Petroleum | 300 | 0.2 | 290 | 0.2 | 275 | 0.2 | 250 | 0.1 | | iv. Interest subsidy | 167 | 0.1 | 190 | 0.1 | 194 | 0.1 | 232 | 0.1 | | v. Other subsidies | 55 | 0.0 | 103 | 0.1 | 84 | 0.1 | 87 | 0.1 | II.2.b Capital Expenditure Capital expenditure is budgeted to grow by 10.7 per cent in 2017-18 over the previous year, reflecting the Government’s intent on improving the revenue-capital balance. Capital outlay excluding defence, which has strong multiplier effects, is budgeted to increase by a robust 12.7 per cent in 2017-18 (10.8 per cent in 2016-17 RE). While the overall non-defence capital outlay remained broadly stable at 1.1 per cent of GDP, capital outlay on major infrastructure sectors (viz., irrigation, energy, railways, roads and bridges, civil aviation, ports and light houses, and communication) has steadily increased over the last few years (Chart 3). II.2.c Scheme/ Non-Scheme Expenditure In the Union Budget 2017-18, the Central Government introduced a new method of classifying expenditure viz., Scheme and Non-Scheme. Scheme expenditure comprises Government’s expenditure on Central Sector Schemes and Centrally Sponsored Schemes. Non-Scheme expenditure, on the other hand, includes inter alia expenditure on interest payments, pensions, salaries and allowances, expenditure on regulatory/statutory/autonomous bodies, Finance Commission transfers and transfers under Article 275(1) of the Constitution to state Governments. Scheme and non-scheme expenditures, which account for 44.0 per cent and 56.0 per cent of total expenditure, respectively, are estimated to grow by 8.6 per cent and 5.0 per cent, respectively, in 2017-18. With a view to enhancing accountability and efficacy of budgetary outlays towards Central Sector and the Centrally Sponsored Schemes, the Government has put forth Outcome Budgets of various Ministries/Departments. This document links the budgeted outlays for different schemes of Ministries/ Departments with physical and financial outputs/ deliverables as well as the medium term outcomes. III. Resource Transfer to States States’ share in central taxes is budgeted to increase by 11 per cent in 2017-18 (BE), over and above a 20 per cent increase in 2016-17 (RE) pursuant to the recommendations of the Fourteenth Finance Commission (FC-XIV) for higher devolution of taxes5 (Table 5). In 2017-18 (BE), gross transfers are budgeted to decline by 0.1 of GDP, while net transfers are retained at the previous year’s level. 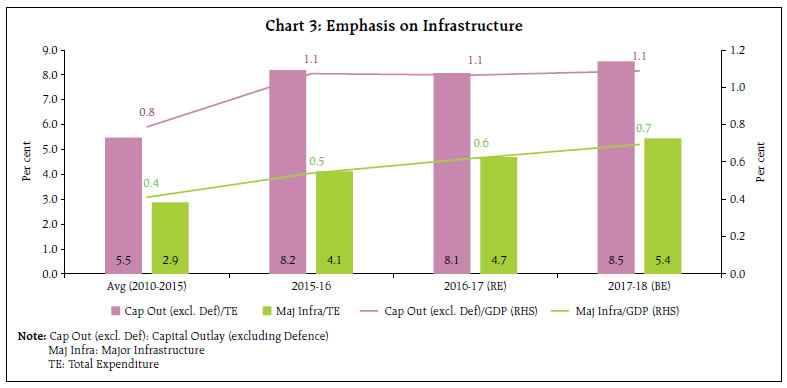
| Table 5: Gross and Net Transfers from Centre to States | | (₹ billion) | | Items | 2015-16 | 2016-17 (BE) | 2016-17 (RE) | 2017-18 (BE) | | 1 | 2 | 3 | 4 | 5 | | 1. States' share in Central Taxes | 5,061.9 | 5,703.4 | 6,080.0 | 6,745.7 | | 2. Finance Commission Grants | 845.8 | 1,006.5 | 991.2 | 1,031.0 | | 3. Other Central Transfers to States | 2,385.7 | 2,543.7 | 2,776.5 | 3,034.1 | | a. Scheme Related Transfers | 1,950.5 | 1,904.4 | 2,013.6 | 2,124.7 | | b. Other Transfers | 431.4 | 354.6 | 448.6 | 484.5 | | c. Transfer to North Eastern States | 3.8 | 284.7 | 314.2 | 425.0 | | 4. Total Transfers to UTs with legislature | 51.4 | 53.2 | 55.5 | 40.0 | | 5. Gross Transfers to State & UTs (1 to 4) | 8,344.8 | 9,306.7 | 9,903.1 | 10,850.7 | | 6. Less Recovery of Loans and Advances | 115.1 | 94.7 | 91.6 | 95.2 | | 7. Net Resources transferred to State and UT (5-6) | 8,229.7 | 9,212.0 | 9,811.5 | 10,755.6 | | Gross Transfers / GDP (per cent) | 6.1 | 6.2 | 6.5 | 6.4 | | Net Transfers / GDP (per cent) | 6.0 | 6.1 | 6.4 | 6.4 | IV. Market Borrowings and Liabilities The Budget has estimated that out of the total borrowing requirements of ₹ 5,465 billion, net market borrowings (dated securities and 364-day treasury bills) would finance 63.7 per cent of GFD in 2017-18 as against 62.8 per cent in 2016-17 (RE) (Table 6). As a proportion to GDP, net market borrowing is placed at 2.1 per cent in 2017-18 as against 2.2 per cent in 2016-17 (RE). Total liabilities-GDP ratio of the Central Government is budgeted to decline to 47.3 per cent in 2017-18 from 48.8 per cent in 2016-17 (RE). Notably, the FRBM Review Committee, 2017 has recommended a debt-GDP ratio of 40 per cent for the Central Government by 2022-23. Interest payment as proportion of revenue receipts, which is an indicator of debt servicing capacity, is budgeted to increase marginally from the previous year (Chart 4). | Table 6: Financing Pattern of Gross Fiscal Deficit | | (₹ Billion) | | Items | 2015-16 | 2016-17 (RE) | 2017-18 (BE) | | 1 | 2 | 3 | 4 | | Gross Fiscal Deficit | 5327.9 | 5342.7 | 5465.3 | | | (100.0) | (100.0) | (100.0) | | Financed by | | | | | Net Market Borrowings* | 4149.3 | 3357.1 | 3482.3 | | | (77.9) | (62.8) | (63.7) | | Other treasury bills | 398.1 | 301.4 | 20.0 | | | (7.5) | (5.6) | (0.4) | | Securities Issued against Small Savings (net) | 524.7 | 903.8 | 1001.6 | | | (9.8) | (16.9) | (18.3) | | External Assistance | 127.5 | 148.7 | 157.9 | | | (2.4) | (2.8) | (2.9) | | State Provident Fund | 118.6 | 130.0 | 140.0 | | | (2.2) | (2.4) | (2.6) | | NSSF | 149.1 | -261.0 | 0.0 | | | (2.8) | (4.9) | (0.0) | | Reserve Fund | -33.2 | -82.4 | -10.4 | | | -(0.6) | -(1.5) | -(0.2) | | Deposits and Advances | 134.7 | 387.0 | 502.1 | | | (2.5) | (7.2) | (9.2) | | Draw Down of Cash Balances | 131.7 | 402.3 | 128.4 | | | (2.5) | (7.5) | (2.4) | | Others | -372.5 | 56.0 | 43.4 | | | -(7.0) | (1.0) | (0.8) | *Includes Dated Securities and 364-day Treasury Bills, taking into account the net impact of switching off securities & buybacks.
Note: Figures in parenthesis represent percentages to GFD. |
V. Overall Assessment The Union Budget for 2017-18 carries a pro-farmer pro-rural focus even as it seeks to address the financing needs of social and physical infrastructure. Yet, the deferment of the GFD target intended for 2017-18 by one year raises concerns about the commitment to fiscal consolidation. The projected tax revenues appear realistic and based on conservative accounting. The reliance on disinvestment receipts, however, continues to be a downside risk. In the infrastructure sector, the merger of the Railway Budget with the Union Budget is expected to facilitate multi modal transport planning between railways, highways and inland waterways and a more integrated plan for a holistic transport system. In this regard, the curtailment of revenue expenditure and emphasis on infrastructure development augurs well for future growth. The Budget also has far reaching implications for external competitiveness. It proposes to reduce/ eliminate customs duty and/or countervailing duty on various inputs and raw materials to reduce costs and encourage domestic production. Sectors such as chemicals and petro chemicals and leather with export potential in global market should benefit from lower costs of production. In the long-run, this may bode well for India’s participation in global value chains. Finally, the abolition of the FIPB signals further reduction in procedural formalities for FDI approvals which may help improve India’s ranking in terms of the ease of doing business. | Statement 1: Budget at a Glance | | (₹ billion) | | Items | 2015-16
(Accounts) | 2016-17
(Budget Estimates) | 2016-17
(Revised Estimates) | 2017-18
(Budget Estimates) | Variation (%) | | Col. 4 over Col. 2 | Col. 5 over Col. 4 | | 1 | 2 | 3 | 4 | 5 | 6 | 7 | | 1. Revenue Receipts (i+ii) | 11,950.3 | 13,770.2 | 14,235.6 | 15,157.7 | 19.1 | 6.5 | | i) Tax Revenue (Net to Centre) | 9,437.7 | 10,541.0 | 10,887.9 | 12,270.1 | 15.4 | 12.7 | | ii) Non-tax Revenue | 2,512.6 | 3,229.2 | 3,347.7 | 2,887.6 | 33.2 | -13.7 | | of which: | | | | | | | | Interest Receipts | 253.8 | 296.2 | 181.5 | 190.2 | -28.5 | 4.8 | | 2. Capital Receipts | 5,957.5 | 6,010.4 | 5,908.5 | 6,309.6 | -0.8 | 6.8 | | of which: | | | | | | | | i) Net Market Borrowings* | 4,149.31 | 4,251.8 | 3,357.09 | 3,482.26 | -19.1 | 3.7 | | ii) Recoveries of Loans | 208.4 | 106.3 | 110.7 | 119.3 | -46.9 | 7.8 | | iii) Miscellaneous Capital Receipts | 421.3 | 565.0 | 455.0 | 725.0 | 8.0 | 59.3 | | 3. Total Receipts (1+2) | 17,907.8 | 19,780.6 | 20,144.1 | 21,467.4 | 12.5 | 6.6 | | 4. Revenue Expenditure | 15,377.6 | 17,310.4 | 17,345.6 | 18,369.3 | 12.8 | 5.9 | | 5. Capital Expenditure | 2,530.2 | 2,470.2 | 2,798.5 | 3,098.0 | 10.6 | 10.7 | | 6. Expenditure on Other Than Schemes | 10,656.7 | 11,760.9 | 11,445.6 | 12,016.6 | 7.4 | 5.0 | | of which: | | | | | | | | i) Interest Payments | 4,416.6 | 4,926.7 | 4,830.7 | 5,230.8 | 9.4 | 8.3 | | ii) Defence | 2,259.0 | 2,491.0 | 2,480.1 | 2,623.9 | 9.8 | 5.8 | | iii) Major Subsidies | 2,418.3 | 2,338.3 | 2,327.0 | 2,403.4 | -3.8 | 3.3 | | 7. Scheme Expenditure | 7,251.1 | 8,019.7 | 8,698.5 | 9,450.8 | 20.0 | 8.6 | | 8. Total Expenditure (4+5)=(6+7) | 17,907.8 | 19,780.6 | 20,144.1 | 21,467.4 | 12.5 | 6.6 | | 9. Revenue Deficit (4-1) | 3,427.4 | 3,540.2 | 3,110.0 | 3,211.6 | -9.3 | 3.3 | | | (2.5) | (2.3) | (2.0) | (1.9) | | | | 10. Effective Revenue Deficit | 2,109.8 | 1,871.8 | 1,395.3 | 1,258.1 | -33.9 | -9.8 | | | (1.5) | (1.2) | (0.9) | (0.7) | | | | 11. Gross Fiscal Deficit [8-(1+2ii+2iii)] | 5,327.9 | 5,339.0 | 5,342.7 | 5,465.3 | 0.3 | 2.3 | | | (3.9) | (3.5) | (3.5) | (3.2) | | | | 12. Gross Primary Deficit (11-6i) | 911.3 | 412.3 | 512.1 | 234.5 | -43.8 | -54.2 | | | (0.7) | (0.3) | (0.3) | (0.1) | | | Notes : 1) Capital Receipts are net of repayments and include drawdown of cash balances.
2) * include Dated Securities and 364-day Treasury Bills, taking into account the net impact of switching off securities & buybacks.
3) Figures in parenthesis are in proportion to GDP.
Source : Budget documents of the Government of India, 2017-18. |
|