The select 2,92,308 non-government non-financial (NGNF) private limited companies witnessed deceleration in sales as well as output growth in 2015-16 as compared with the previous year. Lower raw material costs helped in containing operating expenses and resulted in a higher profit margin. In turn, debt serviceability of the companies improved. More than half of the funds generated by the companies were utilised in fixed assets formation, indicating improvement in business expectations. This article presents the financial performance of select 2,92,308 NGNF private limited companies, based on their audited annual accounts for the period from 2013-14 to 2015-16. The data are available on the Reserve Bank’s website at https://dbie.rbi.org.in/DBIE/dbie.rbi?site=statistics#!2_45. These companies covered 32.9 per cent of the paid-up capital (PUC) of all NGNF private limited companies registered with the Ministry of Corporate Affairs (MCA) as on March 31, 2016. The distribution of NGNF private limited companies is skewed, with 95 per cent classified as small1 (with net sales below ₹ 250 million) and their share in aggregate sales being only 20 per cent. 1. Income and Expenditure 1.1. Sales growth of the private limited companies halved in 2015-16 as compared with the previous year. Although softening of prices of raw materials restrained the increase in operating expenses, the growth of operating profits decelerated. In this context, the deceleration in the growth of gross value added (GVA), was noteworthy (Statement 1, Chart 1, Chart 2 and Chart 3). 1.2. Large companies (with snet sales ₹ 1 billion and above) benefitted the most from the decline in raw material prices and as a result, their operating profits picked up in 2015-16 despite significant sales deceleration. While sales of small companies contracted, the sharper contraction in operating expenses resulted in reasonable growth of profits. Medium sized companies (net sales between ₹ 250 million to ₹ 1 billion) – many of them belongs to the service sector-did not benefit as much from the decline in raw material costs (Statement 1). 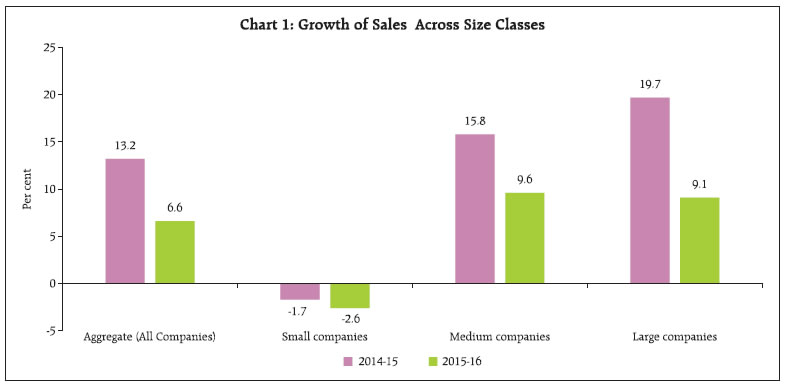 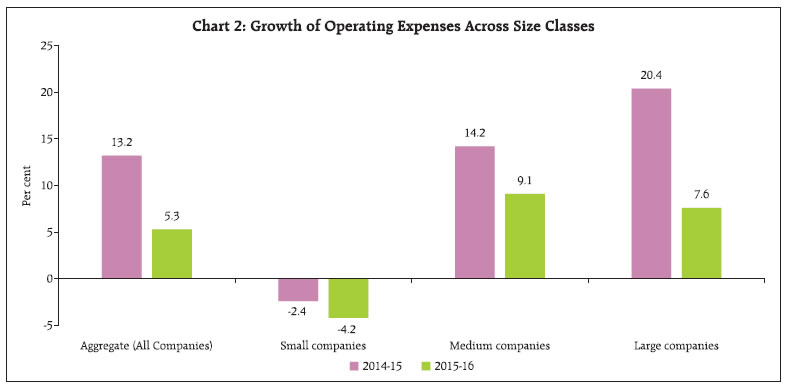 1.3. The poor performance of companies in textiles; chemicals and chemical products; and iron and steel industries pulled down the sales growth of the manufacturing sector as a whole. The growth of sales as well as operating profits of the services sector companies plummeted due to weak demand conditions. Operating profits of the companies in the mining and quarrying sector contracted on the back of deceleration in sales, coupled with increased operating expenditure (Statement 1). 1.4. Lower operating expenses growth improved the profitability of the companies in the aggregate. For both small and large sized companies, operating profit margin and return on equity were higher in 2015-16 than in the previous year (Statement 1 and Statement 2). 1.5. Across sales size classes, interest expenses of small companies (as a proportion to sales) continued to increase, mainly due to high growth in total borrowings (Chart 4 and Statement 1). 2. Leverage and Vulnerability 2.1. Rising indebtedness of the companies remained a concern as their debt (long term borrowings) to equity ratio increased successively during the period from 2013-14 to 2015-16. However, on the positive side, companies’ debt servicing capacity (in terms of interest coverage ratio, i.e., ICR, defined as EBIT2 to interest expenses) improved due to increased profitability (Statement 2). 2.2. Heightened risk aversion among banks and their reluctance to reduce lending rates resulted in sluggish growth in bank borrowings by the companies. The share of banks in total borrowings declined in 2015- 16 over the previous year and across all size classes (Chart 5). 2.3. Highly leveraged companies (with debt to equity ratio of more than 200 per cent or with negative net worth) held more than 50 per cent of total bank borrowings and had poor debt serviceability. The profitability of these companies was lower than other companies and half of them made losses in 2015-16. 2.4. Vulnerable companies i.e., companies with debt to equity ratio more than 200 per cent and ICR less than 1 (including companies with negative net worth) held a larger share of bank borrowings in 2015-16 than in 2014-15 (Table 1). | Table 1: Share of Bank Borrowings Held by Vulnerable Companies | | Year | Number of Vulnerable Companies* | Share of Debt of Vulnerable Companies in 2,92,308 Companies’ Total Debt (Per cent) | Share of Bank Borrowings of Vulnerable Companies in 2,92,308 Companies’ Bank Borrowings (Per cent) | | 2013-14 | 30050 | 43.1 | 30.4 | | 2014-15 | 28274 | 41.2 | 28.5 | | 2015-16 | 29733 | 40.6 | 29.0 | | * Includes companies with negative net worth |
2.5. At the industry level, the construction sector and real estate industry in the services sector had high and increasing debt to equity ratio. Debt servicing capacity of the companies in the iron and steel industry weakened further in 2015-16 (Statement 2). 3. Sources and Uses of Funds 3.1. Of the funds raised by the companies, the share of total borrowings remained the same. The share of bank borrowings, however, declined sharply from 18.3 per cent in 2014-15 to 7.5 per cent in 2015-16. On the other hand, accounts payable registered a decline in share, implying slowdown in new purchases by the companies during the year (Statement 4). 3.2. More than half of the funds generated during 2015-16 were utilised for fixed assets formation by the companies. Correspondingly, depreciation provisions also increased. On the other hand, inventories were drawn down and companies kept less cash with themselves (Statement 4). 4. Conclusion The select NGNF private limited companies covered in this article experienced deceleration in sales as well as in nominal GVA, pointing to the overall sluggishness in the manufacturing and services sector of the economy. Saving on raw material costs shored up their profitability especially in the manufacturing sector. Increasing leverage in the companies emerged as a major concern, particularly with the more leveraged among them suffering erosion in debt service capacity. Higher fixed capital formation in uses of funds could be reflecting some optimism on the business outlook.
| Statement 1: Growth Rates of Select Parameters of 292,308 NGNF Private Limited Companies (Contd.) | | (Per cent) | | | Growth Rates | | Sales | Operating expenses | Operating profit | Net profit | | 2014-15 | 2015-16 | 2014-15 | 2015-16 | 2014-15 | 2015-16 | 2014-15 | 2015-16 | | Aggregate (All Companies) | 13.2 | 6.6 | 13.2 | 5.3 | 21.9 | 12.9 | 19.0 | 13.9 | | Sales-wise | | | | | | | | | | Less than ₹ 250 million | -1.7 | -2.6 | -2.4 | -4.2 | 16.9 | 9.7 | 11.4 | 16.4 | | ₹ 250 million – ₹ 1 billion | 15.8 | 9.6 | 14.2 | 9.1 | 33.4 | 7.1 | 36.5 | 4.3 | | ₹ 1 billion and above | 19.7 | 9.1 | 20.4 | 7.6 | 18.2 | 19.4 | 13.5 | 21.0 | | Industry-wise | | | | | | | | | | Mining and quarrying | 7.9 | 5.2 | 6.7 | 7.4 | 7.8 | -13.9 | 1.1 | -38.3 | | Manufacturing | 10.6 | 5.0 | 10.8 | 3.5 | 9.4 | 21.1 | 2.4 | 28.7 | | Food products and beverages | 10.2 | 10.1 | 10.0 | 9.6 | 14.6 | 17.0 | 4.6 | 25.0 | | Textiles | 7.1 | 2.7 | 6.0 | 2.9 | 15.0 | -0.8 | 14.8 | -2.5 | | Chemicals and chemical products | 10.4 | 5.2 | 8.9 | 4.4 | 22.7 | 17.1 | 25.2 | 25.4 | | Iron and steel | 10.4 | 0.7 | 10.0 | -0.4 | 42.5 | -3.5 | # | # | | Machinery and equipments’ | 12.0 | 12.8 | 10.8 | 12.3 | 22.2 | 8.9 | 45.0 | -3.5 | | Electrical machinery and apparatus | 11.1 | 18.3 | 8.7 | 19.8 | 25.1 | 11.6 | 62.8 | 21.6 | | Motor vehicles and other transport equipment’s | 7.2 | 10.3 | 5.5 | 11.3 | 42.4 | 3.4 | # | -23.7 | | Construction | 8.8 | 8.9 | 8.3 | 5.0 | 58.1 | 10.2 | 118.5 | 17.1 | | Services | 16.7 | 8.2 | 16.7 | 7.5 | 27.2 | 9.4 | 23.4 | 8.5 | | Wholesale and retail trade | 24.2 | 4.7 | 26.5 | 4.1 | 25.3 | -3.4 | 13.0 | -2.3 | | Transport, storage and communication | 14.0 | 5.2 | 14.3 | 5.4 | 10.2 | 7.2 | 13.6 | -2.1 | | Real Estate | 17.7 | 4.8 | 12.0 | 2.2 | # | -2.9 | # | -9.5 | | Computer and related activities | 17.0 | 15.2 | 15.3 | 16.1 | 24.6 | 11.0 | 23.5 | 15.1 | | # Denominator negative nil or negligible |
| Statement 1: Growth Rates of Select Parameters of 292,308 NGNF Private Limited Companies (Concld.) | | (Per cent) | | | Growth Rates | | Net worth | Total borrowings | Total net asset | | 2014-15 | 2015-16 | 2014-15 | 2015-16 | 2014-15 | 2015-16 | | Aggregate (All Companies) | 10.5 | 7.8 | 10.1 | 9.9 | 12.3 | 8.4 | | Sales-wise | | | | | | | | Less than ₹ 250 million | 5.6 | 4.0 | 11.6 | 13.3 | 8.2 | 7.7 | | ₹ 250 million – ₹ 1 billion | 13.2 | 9.0 | 11.5 | 7.2 | 13.4 | 9.0 | | ₹ 1 billion and above | 18.0 | 13.3 | 6.7 | 5.6 | 18.0 | 9.0 | | Industry-wise | | | | | | | | Mining and quarrying | 23.2 | 9.3 | 1.2 | 24.3 | 8.1 | 13.2 | | Manufacturing | 11.8 | 10.5 | 6.4 | 3.3 | 9.8 | 8.1 | | Food products and beverages | 12.0 | 8.8 | 9.3 | 10.1 | 11.3 | 12.8 | | Textiles | 12.0 | 9.1 | 6.0 | 6.8 | 8.7 | 7.8 | | Chemicals and chemical products | 16.9 | 11.2 | 8.0 | 4.6 | 12.2 | 10.2 | | Iron and steel | -1.9 | -3.5 | 9.5 | 3.2 | 9.6 | 1.2 | | Machinery and equipments’ | 12.8 | 11.7 | 13.0 | 5.5 | 9.6 | 9.2 | | Electrical machinery and apparatus | 12.8 | 15.4 | 0.1 | -0.7 | 7.9 | 12.8 | | Motor vehicles and other transport equipment’s | 14.2 | 13.8 | 2.2 | -1.3 | 8.2 | 7.1 | | Construction | 5.2 | 4.9 | 13.1 | 10.5 | 12.8 | 7.2 | | Services | 10.6 | 7.0 | 10.8 | 13.3 | 13.7 | 8.5 | | Wholesale and retail trade | 8.9 | 2.1 | 7.5 | 14.1 | 14.6 | 4.2 | | Transport, storage and communication | 13.5 | 9.1 | 4.9 | 15.1 | 8.4 | 10.7 | | Real Estate | 6.1 | 3.8 | 15.3 | 16.1 | 14.6 | 9.8 | | Computer and related activities | 18.9 | 17.3 | 36.3 | 10.0 | 20.5 | 13.7 |
| Statement 2: Ratios of Select Parameters of 292,308 NGNF Private Limited Companies (Contd.) | | (Per cent) | | | Ratios | | Operating profit to Sales | PAT to net worth | Total borrowings to equity | | 2013-14 | 2014-15 | 2015-16 | 2013-14 | 2014-15 | 2015-16 | 2013-14 | 2014-15 | 2015-16 | | Aggregate (All Companies) | 8.8 | 9.5 | 10.1 | 11.9 | 12.8 | 13.6 | 86.3 | 86.0 | 87.6 | | Sales-wise | | | | | | | | | | | Less than ₹ 250 million | 10.7 | 12.7 | 14.3 | 9.0 | 9.5 | 10.7 | 81.4 | 86.0 | 93.7 | | ₹ 250 million – ₹1 billion | 10.4 | 12.0 | 11.7 | 24.3 | 29.3 | 28.0 | 112.6 | 110.9 | 109.1 | | ₹ 1 billion and above | 7.2 | 7.1 | 7.8 | 11.6 | 11.2 | 11.9 | 83.4 | 75.4 | 70.3 | | Industry-wise | | | | | | | | | | | Mining and quarrying | 9.7 | 9.7 | 8.0 | 12.0 | 9.8 | 5.5 | 114.1 | 93.7 | 106.7 | | Manufacturing | 6.9 | 6.8 | 7.9 | 13.4 | 12.3 | 14.3 | 95.6 | 91.0 | 85.1 | | Food products and beverages | 5.1 | 5.3 | 5.6 | 10.2 | 9.6 | 11.0 | 100.3 | 97.8 | 99.0 | | Textiles | 7.1 | 7.6 | 7.4 | 18.3 | 18.8 | 16.8 | 145.4 | 137.6 | 134.7 | | Chemicals and chemical products | 8.8 | 9.7 | 10.8 | 13.5 | 14.4 | 16.3 | 69.6 | 64.3 | 60.5 | | Iron and steel | 2.8 | 3.6 | 3.4 | -0.1 | -1.2 | -6.1 | 135.2 | 150.9 | 161.2 | | Machinery and equipments’ | 11.6 | 12.6 | 12.2 | 18.5 | 23.8 | 20.5 | 55.7 | 55.8 | 52.7 | | Electrical machinery and apparatus | 7.8 | 8.8 | 8.3 | 13.4 | 19.4 | 20.4 | 91.2 | 80.9 | 69.6 | | Motor vehicles and other transport equipment’s | 3.7 | 4.9 | 4.6 | 3.7 | 10.4 | 7.0 | 125.8 | 112.6 | 97.6 | | Construction | 11.4 | 16.6 | 16.8 | 3.1 | 6.5 | 7.3 | 179.0 | 192.4 | 200.7 | | Services | 10.4 | 11.3 | 11.5 | 13.1 | 14.6 | 14.8 | 64.7 | 64.8 | 68.6 | | Wholesale and retail trade | 2.3 | 2.3 | 2.1 | 2.5 | 2.6 | 2.5 | 45.8 | 45.3 | 50.6 | | Transport storage and communication | 12.1 | 11.7 | 11.9 | 22.8 | 22.9 | 20.5 | 119.9 | 110.9 | 117.0 | | Real Estate | 4.1 | 16.1 | 14.9 | -1.3 | 4.0 | 3.5 | 135.8 | 147.6 | 165.0 | | Computer and related activities | 18.7 | 19.9 | 19.2 | 37.1 | 38.5 | 37.8 | 29.3 | 33.6 | 31.5 |
| Statement 2: Ratios of Select Parameters of 292,308 NGNF Private Limited Companies (Concld.) | | (Per cent) | | | Ratios | | Debt to equity | Interest coverage ratio* | | 2013-14 | 2014-15 | 2015-16 | 2013-14 | 2014-15 | 2015-16 | | Aggregate (All Companies) | 51.2 | 52.2 | 53.8 | 3.4 | 3.5 | 3.7 | | Sales-wise | | | | | | | | Less than ₹ 250 million | 52.7 | 57.0 | 63.0 | 3.5 | 3.7 | 3.9 | | ₹ 250 million – ₹1 billion | 68.5 | 67.5 | 66.1 | 3.6 | 4.0 | 3.9 | | ₹ 1 billion and above | 41.0 | 38.1 | 35.4 | 3.0 | 3.1 | 3.4 | | Industry-wise | | | | | | | | Mining and quarrying | 65.9 | 58.1 | 64.2 | 2.8 | 2.7 | 2.0 | | Manufacturing | 47.9 | 46.9 | 44.7 | 2.8 | 2.7 | 3.2 | | Food products and beverages | 45.6 | 43.6 | 44.2 | 2.6 | 2.5 | 2.8 | | Textiles | 76.6 | 74.5 | 73.1 | 2.5 | 2.5 | 2.4 | | Chemicals and chemical products | 35.6 | 36.3 | 36.5 | 3.5 | 4.1 | 5.0 | | Iron and steel | 70.4 | 80.1 | 82.4 | 1.0 | 0.9 | 0.7 | | Machinery and equipments’ | 26.9 | 25.4 | 24.2 | 5.2 | 6.4 | 6.3 | | Electrical machinery and apparatus | 43.7 | 41.1 | 35.6 | 2.8 | 3.7 | 4.1 | | Motor vehicles and other transport equipment’s | 58.2 | 57.0 | 53.6 | 1.4 | 1.8 | 1.8 | | Construction | 123.4 | 130.1 | 137.2 | 1.6 | 1.9 | 1.9 | | Services | 39.1 | 39.8 | 42.5 | 4.8 | 5.2 | 5.1 | | Wholesale and retail trade | 23.4 | 24.0 | 27.9 | 2.0 | 1.9 | 1.9 | | Transport storage and communication | 71.4 | 66.8 | 72.1 | 3.7 | 3.9 | 3.6 | | Real Estate | 87.3 | 94.5 | 101.1 | 1.0 | 1.9 | 1.6 | | Computer and related activities | 19.7 | 20.3 | 19.2 | 21.8 | 24.7 | 24.9 | | * Actual ratio |
| Statement 3: Composition of Liabilities and Assets of 292,308 NGNF Private Limited Companies | | (Per cent) | | A. Composition of liabilities | | Year | 2013-14 | 2014-15 | 2015-16 | | 1. Shareholders' Funds | 39.2 | 37.5 | 37.0 | | (i) Share Capital | 9.2 | 9.3 | 9.4 | | (ii) Reserves and Surplus | 29.9 | 28.1 | 27.6 | | (a) Capital reserve | 17.7 | 17.6 | 17.0 | | 2. Long-term borrowings (debt) | 17.3 | 17.9 | 18.4 | | (a) Bonds/ Debentures | 1.8 | 1.7 | 2.0 | | (b) Term loans from banks | 8.8 | 8.8 | 8.9 | | 3. Short-term borrowings | 10.9 | 11.6 | 11.4 | | of which, from banks | 4.7 | 3.3 | 3.6 | | 4. Trade payable | 10.8 | 10.5 | 10.9 | | 5. Provision | 2.7 | 2.7 | 2.7 | | 6. Other Liability | 19.2 | 19.8 | 19.6 | | (i) Non-current | 2.4 | 3.0 | 2.8 | | (ii) Current | 9.8 | 8.9 | 9.5 | | TOTAL | 100.0 | 100.0 | 100.0 |
| B. Composition of assets | | Year | 2013-14 | 2014-15 | 2015-16 | | 1. Gross Fixed Assets | 34.7 | 32.2 | 36.1 | | (a) Tangible assets | 27.1 | 24.8 | 28.2 | | (b) Capital work in progress | 3.4 | 2.8 | 3.2 | | (c) Intangible asset | 3.9 | 4.4 | 4.5 | | 2. Depreciation (i) Tangible | 8.2 | 5.3 | 9.3 | | (ii) Intangible | 0.6 | 0.7 | 0.8 | | 3. Net fixed assets | 25.9 | 26.3 | 25.9 | | 4. Non-current investments | 12.1 | 11.2 | 11.2 | | 5. Current investments | 2.8 | 2.8 | 2.8 | | 6. Loans and advances | 16.0 | 15.4 | 15.6 | | 7. Inventories | 17.9 | 18.2 | 18.2 | | 8. Trade receivables | 14.9 | 15.3 | 15.2 | | 9. Cash and cash equivalents | 5.4 | 6.8 | 6.9 | | 10. Other assets | 5.0 | 4.0 | 4.1 | | (i) Non-current | 1.2 | 1.4 | 1.3 | | (ii) Current | 3.8 | 2.6 | 2.8 | | TOTAL | 100.0 | 100.0 | 100.0 |
| Statement 4: Sources and Uses of Funds of 292,308 NGNF Private Limited Companies | | (Per cent) | | Sources of Funds | | Period | 2014-15 | 2015-16 | | By Increase in Equity and Liability | | 1. Paid-Up Capital | 11.2 | 7.0 | | 2. Reserves and Surplus | 4.3 | 4.5 | | 3. Provisions | 1.9 | 39.4 | | (a) Depreciation provision | - | 37.5 | | (b) Other provisions | 1.9 | 1.9 | | 4. Share Capital and Premium | 13.8 | 10.3 | | 5. Long Term Borrowings | 18.0 | 16.1 | | of which, (a) Bonds, Debentures | 5.6 | 3.9 | | (b) From Banks | 7.7 | 5.1 | | 6. Short-term borrowings | 6.2 | 7.7 | | of which, From Banks | 10.6 | 2.4 | | 7. Trade Payables | 16.8 | 5.0 | | 8. Other Liabilities | 17.9 | 9.9 | | (i) Non-Current | 5.2 | 0.9 | | (ii) Current | 12.7 | 9.0 | | TOTAL | 90.2 | 99.8 | | By Decrease in Assets | | 9. Plant and machinery | 2.4 | - | | 10. Capital Work-in-progress | 1.9 | - | | 11. Other assets | 5.5 | 0.2 | | (i) Non-current | - | 0.2 | | (ii) Current | 5.5 | - | | TOTAL | 9.8 | 0.2 | | GRAND TOTAL | 100.0 | 100.0 |
| Statement 4: Sources and Uses of Funds of 292,308 NGNF Private Limited Companies | | (Per cent) | | Uses of Funds | | Period | 2014-15 | 2015-16 | | By Increase in Assets | | 1. Gross Fixed Assets | 15.3 | 50.9 | | (i) Tangible Assets | 7.6 | 42.7 | | of which, Plant and machinery | - | 20.4 | | (ii) Capital Work-in-progress | - | 4.7 | | (iii) Intangible assets | 7.7 | 3.6 | | 2. Non-current investments | 3.9 | 6.7 | | 3. Current investments | 2.5 | 1.5 | | 4. Loans and advances | 9.6 | 11.1 | | 5. Inventories | 18.7 | 11.6 | | 6. Trade Receivables | 16.6 | 9.3 | | 7. Cash and cash equivalents | 16.2 | 5.5 | | 8. Other assets | 2.0 | 3.4 | | (i) Non-current | 2.0 | - | | (ii) Current | - | 3.4 | | TOTAL | 84.7 | 100.0 | | By Decrease in Equity and Liability | | 9. Depreciation provision | 15.3 | - | | TOTAL | 15.3 | - | | GRAND TOTAL | 100.0 | 100.0 | | ‘-’ : Nil or Negligible. |
|