1 Introduction 1.1 Inflation expectations of households play an important role in their decision on spending and saving, which, in turn, inform the setting of monetary policy. In this context, the Reserve Bank of India (RBI) has been conducting the Inflation Expectations Survey of Households (IESH) since September 2005. At present, the survey is conducted in 18 cities covering a sample size of 5500 households in each round (Annex). The survey elicits qualitative and quantitative responses of households’ perceptions and expectations on prices and inflation, three months ahead and one year ahead1. The present annual article analyses the results of four quarterly rounds of the survey (Rounds: 44- 47)2 conducted during 2016-17. 2 Survey Results 2.1 The proportion of respondents expecting general prices to rise in the ensuing three months and one year were lower in Q2:2016-17 to Q4:2016-17 than in the corresponding quarter of 2015-16. On a quarter-to- quarter basis, the share of such responses for the three months ahead period declined from 85.2 per cent in Q1:2016-17 to 73.8 per cent in Q4:2016-17, with a low at 59.9 per cent in Q3:2016-17. Similarly, the proportions for the one year ahead period declined from 90.4 per cent in Q1:2016-17 to 81.0 per cent in Q4:2016-17, with a low at 68.1 per cent in Q3:2016- 17 (Chart 1). The coincidence of the seasonal decline in prices of many food products and demonetisation could have led to the sharp moderation in households’ inflation outlook in Q3:2016-17. 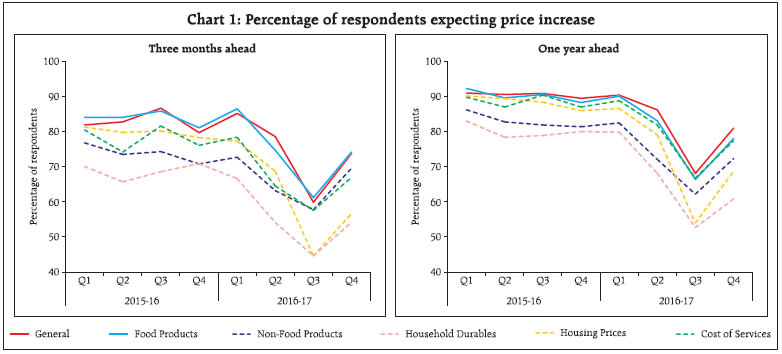 2.2 Respondents expecting the general price level to go up were asked to assess the rate of increase in prices in the next three months and in the year ahead. On a year-on-year (y-o-y) basis, the share of respondents expecting general prices to increase at more than the current rate was higher in each quarter of 2016-17, barring Q3, with a peak in Q2:2016-17, in line with the seasonal pattern. 2.3 Price expectations relating to various product groups also witnessed significant moderation during 2016-17, both three months ahead and one year ahead. It was observed most prominently for housing and household durables, with a significant shift in the proportion of respondents expecting decline in prices. Nonetheless, the share of respondents expecting product level prices to go up at more than the current rate remained generally at a higher level than a year ago across product groups, except for Q3 (Chart 2). 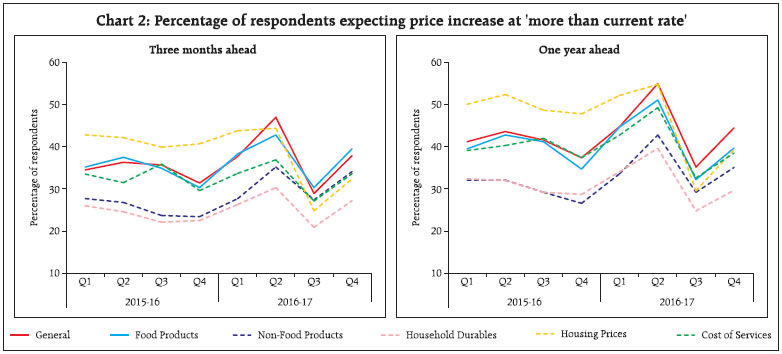 2.4 In terms of respondents’ quantitative assessment of the level of expected inflation (within a band of 1 percentage point) for the next three months as well as for the next one year, three months ahead median inflation expectations were lower in each quarter of 2016-17 on a y-o-y basis (Table 6). While the decline ranged between 60 and 90 basis points, it fell sharply by 260 basis points in Q3:2016-17. A similar pattern was observed in the case of one year ahead expectations, except in Q2:2016-17, when the median was slightly higher than in Q2:2015-16 (Chart 3 and Table 6). Median inflation expectations in Q3:2016-17 was the lowest in the survey’s history, except for the period of the global financial crisis. The gap between median current perceptions and three months ahead inflation expectations, which had narrowed sharply in the second half of 2015-16, widened again during 2016-17, with mean inflation expectations exhibiting similar movements. 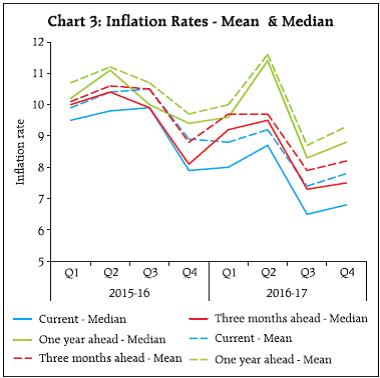 2.5 Analysis of variance (ANOVA) shows that ‘city’ has been a significant source of variation for inflation perceptions and expectations (Table 7). Inter-city disparity has reduced somewhat in recent quarters. Guwahati and Ahmedabad, which recorded relatively higher median inflation expectations during the first half of 2016-17, polled a sharp decline during the second half. On the other hand, Raipur recorded an increase in median inflation through 2016-17, with a peak in Q4:2016-17 (Chart 4 and 5, Table 8). 2.6 Retired persons and daily workers generally reported relatively higher median inflation perceptions and expectations, while financial sector employees and others reported lower median inflation perceptions and expectations (Chart 6). 2.7 The smaller bootstrap confidence intervals (99 per cent) for mean inflation3 with a width of around 0.30 indicate that point estimates are reasonably precise for estimating the population mean of households’ inflation perceptions and expectations (Table 9) 3 Conclusions 3.1 Inflation expectations of households moderated during 2016-17 and most significantly in the post demonetisation period. This ebbing spanned all product groups, but more prominently in respect of prices of housing and household durables. The cities of Guwahati and Ahmedabad, where the median inflation expectations were much higher than the all-India average till the first half of 2016-17, also recorded a sizeable decline. However, the gap between currently perceived inflation and the outlook for three months and one year ahead reflected persistence.
Annex-Data Tables | Table 1: Cross-tabulation of General Price Expectations for Three Months Ahead and One Year Ahead Q1: 2016-17 | | One Year Ahead | General price expectations Three Months Ahead | | | Price increase more than current rate | Price increase similar to current rate | Price increase less than current rate | No change in prices | Decline in prices | Total | | Price increase more than current rate | 29.4 | 8.8 | 3.2 | 2.8 | 0.6 | 44.8 | | Price increase similar to current rate | 4.2 | 16.1 | 3.9 | 2.9 | 0.4 | 27.6 | | Price increase less than current rate | 2.3 | 2.3 | 9.9 | 2.9 | 0.5 | 18.0 | | No change in prices | 1.1 | 1.1 | 1.2 | 2.3 | 0.5 | 6.3 | | Decline in prices | 0.7 | 0.4 | 0.5 | 0.5 | 1.3 | 3.4 | | Total | 37.7 | 28.7 | 18.8 | 11.4 | 3.4 | 100.0 | | General price expectations for one year ahead dependent on general price expectations for three months ahead at 5 per cent level of significance, across the study period (Table 1-4) |
| Table 2: Cross-tabulation of General Price Expectations for Three Months Ahead and One Year Ahead Q2: 2016-17 | | One Year Ahead | General price expectations Three Months Ahead | | | Price increase more than current rate | Price increase similar to current rate | Price increase less than current rate | No change in prices | Decline in prices | Total | | Price increase more than current rate | 36.2 | 7.0 | 5.0 | 5.5 | 1.3 | 55.0 | | Price increase similar to current rate | 5.4 | 7.9 | 2.1 | 4.1 | 0.9 | 20.4 | | Price increase less than current rate | 2.1 | 1.4 | 4.6 | 2.2 | 0.5 | 10.8 | | No change in prices | 2.4 | 1.7 | 0.8 | 3.0 | 1.3 | 9.2 | | Decline in prices | 0.8 | 0.6 | 0.5 | 0.9 | 1.8 | 4.6 | | Total | 47.0 | 18.5 | 13.0 | 15.7 | 5.8 | 100.0 |
| Table 3: Cross-tabulation of General Price Expectations for Three Months Ahead and One Year Ahead Q3: 2016-17 | | One Year Ahead | General price expectations Three Months Ahead | | | Price increase more than current rate | Price increase similar to current rate | Price increase less than current rate | No change in prices | Decline in prices | Total | | Price increase more than current rate | 22.5 | 5.3 | 1.5 | 4.9 | 0.9 | 35.2 | | Price increase similar to current rate | 3.3 | 13.5 | 1.5 | 5.7 | 1.0 | 24.9 | | Price increase less than current rate | 0.6 | 0.9 | 3.6 | 2.4 | 0.5 | 8.0 | | No change in prices | 2.0 | 2.4 | 0.9 | 11.5 | 3.0 | 19.8 | | Decline in prices | 0.7 | 0.8 | 0.4 | 2.4 | 7.8 | 12.1 | | Total | 28.9 | 23.0 | 8.0 | 26.9 | 13.3 | 100.0 |
| Table 4: Cross-tabulation of General Price Expectations for Three Months Ahead and One Year Ahead Q4: 2016-17 | | One Year Ahead | General price expectations Three Months Ahead | | | Price increase more than current rate | Price increase similar to current rate | Price increase less than current rate | No change in prices | Decline in prices | Total | | Price increase more than current rate | 30.5 | 6.6 | 1.4 | 5.4 | 0.6 | 44.5 | | Price increase similar to current rate | 4.3 | 16.0 | 1.8 | 6.0 | 0.4 | 28.5 | | Price increase less than current rate | 0.8 | 1.5 | 4.3 | 1.3 | 0.1 | 8.0 | | No change in prices | 1.8 | 2.7 | 0.8 | 7.4 | 1.0 | 13.6 | | Decline in prices | 0.5 | 0.6 | 0.3 | 1.4 | 2.7 | 5.4 | | Total | 37.9 | 27.3 | 8.6 | 21.5 | 4.7 | 100.0 |
| Table 5: Distribution of Inflation Rate – Perception and Expectations (2016-17) | | (in per cent) | | Inflation Rate | Current | Three Months Ahead | One Year Ahead | | Q1 | Q2 | Q3 | Q4 | Q1 | Q2 | Q3 | Q4 | Q1 | Q2 | Q3 | Q4 | | <1 | 0.9 | 0.8 | 3.3 | 1.8 | 1.0 | 1.2 | 3.2 | 1.8 | 0.7 | 0.3 | 3.6 | 1.6 | | 1-2 | 1.8 | 0.6 | 1.3 | 1.2 | 2.0 | 1.2 | 1.6 | 2.7 | 1.8 | 0.4 | 1.8 | 1.7 | | 2-3 | 2.5 | 1.9 | 4.5 | 4.3 | 3.2 | 5.3 | 4.5 | 5.1 | 2.3 | 0.8 | 3.6 | 2.5 | | 3-4 | 3.6 | 3.2 | 6.5 | 5.5 | 3.2 | 4.4 | 5.6 | 4.9 | 4.1 | 1.3 | 3.5 | 3.6 | | 4-5 | 10.0 | 4.7 | 7.9 | 8.2 | 5.0 | 3.5 | 7.0 | 5.5 | 9.1 | 2.3 | 5.1 | 4.7 | | 5-6 | 16.0 | 14.5 | 21.4 | 21.2 | 7.1 | 6.5 | 13.2 | 11.6 | 8.6 | 3.7 | 10.1 | 8.5 | | 6-7 | 7.6 | 7.5 | 9.8 | 10.3 | 10.1 | 6.3 | 11.4 | 11.5 | 5.2 | 5.5 | 8.1 | 8.5 | | 7-8 | 8.0 | 10.2 | 10.8 | 11.6 | 9.5 | 9.3 | 13.0 | 13.5 | 6.5 | 5.8 | 10.6 | 10.3 | | 8-9 | 7.1 | 9.7 | 7.1 | 6.5 | 7.1 | 8.3 | 8.3 | 9.5 | 6.4 | 6.3 | 10.4 | 10.7 | | 9-10 | 10.5 | 4.4 | 2.8 | 3.9 | 8.9 | 7.2 | 5.2 | 5.4 | 9.4 | 6.7 | 6.6 | 7.6 | | 10-11 | 8.9 | 20.1 | 12.1 | 9.7 | 7.7 | 11.3 | 9.2 | 8.0 | 7.6 | 13.8 | 12.4 | 12.5 | | 11-12 | 1.6 | 1.7 | 0.9 | 1.8 | 5.2 | 4.6 | 2.5 | 2.6 | 4.4 | 7.8 | 2.7 | 2.9 | | 12-13 | 1.2 | 1.9 | 0.8 | 0.8 | 3.9 | 6.7 | 2.7 | 3.5 | 3.1 | 7.5 | 3.9 | 4.6 | | 13-14 | 0.5 | 0.7 | 0.3 | 0.6 | 2.4 | 2.4 | 1.0 | 1.3 | 2.2 | 3.0 | 1.4 | 1.6 | | 14-15 | 2.4 | 0.7 | 0.5 | 0.8 | 3.4 | 1.4 | 0.8 | 1.0 | 4.2 | 3.3 | 1.2 | 1.7 | | 15-16 | 3.1 | 5.0 | 2.7 | 2.4 | 4.2 | 5.6 | 3.2 | 3.6 | 5.5 | 8.6 | 6.3 | 5.5 | | >=16 | 14.4 | 12.4 | 7.4 | 9.3 | 16.0 | 14.8 | 7.5 | 8.5 | 19.0 | 22.9 | 8.6 | 11.6 | | Total | 100.0 | 100.0 | 100.0 | 100.0 | 100.0 | 100.0 | 100.0 | 100.0 | 100.0 | 100.0 | 100.0 | 100.0 |
| Table 6: Inflation Rate – Mean, Median and Std. Dev. | | Survey Round | Quarter | Current | Expectation | | Three Months Ahead | One Year Ahead | | Mean | Median | SD | Mean | Median | SD | Mean | Median | SD | | 40 | Q1:2015-16 | 9.9 | 9.5 | 4 | 10.1 | 10 | 4.4 | 10.7 | 10.2 | 4.4 | | 41 | Q2:2015-16 | 10.4 | 9.8 | 4.3 | 10.6 | 10.4 | 4.3 | 11.2 | 11.1 | 4.5 | | 42 | Q3:2015-16 | 10.5 | 9.9 | 4.2 | 10.5 | 9.9 | 4.1 | 10.7 | 10 | 4.3 | | 43 | Q4:2015-16 | 8.9 | 7.9 | 4.4 | 8.8 | 8.1 | 4.6 | 9.7 | 9.4 | 4.6 | | 44 | Q1:2016-17 | 8.8 | 8.0 | 4.4 | 9.7 | 9.2 | 4.4 | 10.0 | 9.6 | 4.7 | | 45 | Q2:2016-17 | 9.2 | 8.7 | 4.0 | 9.7 | 9.5 | 4.4 | 11.6 | 11.4 | 3.9 | | 46 | Q3:2016-17 | 7.4 | 6.5 | 3.9 | 7.9 | 7.3 | 4.1 | 8.7 | 8.3 | 4.3 | | 47 | Q4:2016-17 | 7.8 | 6.8 | 4.0 | 8.2 | 7.5 | 4.1 | 9.3 | 8.8 | 4.2 |
| Table 7: ANOVA Results: Factors that Explain the Total Variability | | Survey Round | Survey Quarter | Current | Three Months Ahead | One Year Ahead | | 43 | Q4:2015-16 | City, Age-Group | City | City, Category | | 44 | Q1:2016-17 | City, Age-Group, Category | City, Category | City, Category | | 45 | Q2:2016-17 | City, Age-Group | City, Age-Group | City | | 46 | Q3:2016-17 | City, Gender, Age-Group | City, Category, Age-Group | City, Category | | 47 | Q4:2016-17 | City, Age-Group | City, Category | City, Category |
| Table 8: City-wise Median Inflation Perceptions and Expectations | | City | Current | Three Months Ahead | One Year Ahead | | Q1 | Q2 | Q3 | Q4 | Q1 | Q2 | Q3 | Q4 | Q1 | Q2 | Q3 | Q4 | | Ahmedabad | 16.0 | 15.6 | 10.1 | 8.5 | 16.2 | 16.1 | 10.1 | 9.8 | 16.2 | 16.3 | 11.0 | 10.7 | | Bengaluru | 5.1 | 6.8 | 4.2 | 5.0 | 5.2 | 6.6 | 5.3 | 3.2 | 4.4 | 7.9 | 6.5 | 5.3 | | Bhopal | 5.8 | 8.9 | 5.5 | 5.7 | 8.0 | 9.5 | 6.3 | 7.8 | 8.3 | 11.4 | 7.3 | 10.4 | | Bhubaneswar | 9.1 | 15.6 | 6.6 | 5.6 | 11.0 | 16.2 | 8.0 | 6.8 | 11.9 | 16.3 | 9.4 | 7.4 | | Chennai | 7.7 | 8.5 | 5.9 | 6.7 | 10.1 | 8.6 | 7.4 | 8.8 | 9.5 | 15.2 | 9.9 | 10.9 | | Delhi | 5.8 | 7.7 | 5.1 | 6.2 | 7.6 | 9.7 | 5.6 | 6.8 | 6.5 | 10.7 | 5.9 | 7.7 | | Guwahati | 16.2 | 15.4 | 11.9 | 11.8 | 16.2 | 15.7 | 13.8 | 8.9 | 16.2 | 16.3 | 13.4 | 10.9 | | Hyderabad | 6.5 | 6.7 | 7.3 | 6.7 | 6.5 | 6.4 | 7.3 | 7.3 | 8.7 | 9.3 | 7.9 | 8.3 | | Jaipur | 9.4 | 10.3 | 8.1 | 8.0 | 10.9 | 10.6 | 8.6 | 8.9 | 12.6 | 12.1 | 10.0 | 10.2 | | Kolkata | 10.6 | 9.8 | 7.9 | 8.5 | 12.6 | 10.3 | 7.7 | 9.1 | 14.3 | 12.2 | 9.3 | 10.1 | | Lucknow | 7.8 | 7.3 | 5.3 | 6.2 | 6.5 | 5.4 | 5.5 | 7.4 | 9.0 | 10.0 | 6.3 | 8.3 | | Mumbai | 7.1 | 7.2 | 7.5 | 6.9 | 8.1 | 8.4 | 8.6 | 7.5 | 7.7 | 10.3 | 10.1 | 8.0 | | Nagpur | 3.6 | 8.2 | 5.7 | 5.9 | 4.7 | 8.2 | 6.8 | 7.2 | 5.3 | 10.3 | 8.0 | 9.0 | | Patna | 8.7 | 9.0 | 6.0 | 6.1 | 10.0 | 10.3 | 7.0 | 6.8 | 10.8 | 11.9 | 8.0 | 8.2 | | Thiruvananthapuram | 12.7 | 10.7 | 7.1 | 10.4 | 10.3 | 10.1 | 7.3 | 10.3 | 12.1 | 14.9 | 8.4 | 12.4 | | Chandigarh | 13.3 | 8.3 | 7.8 | 7.9 | 14.1 | 9.7 | 7.0 | 8.5 | 16.0 | 12.3 | 7.3 | 9.2 | | Ranchi | 8.1 | 9.1 | 7.4 | 4.6 | 9.4 | 10.2 | 8.1 | 5.0 | 10.3 | 11.4 | 9.5 | 6.6 | | Raipur | 5.0 | 5.7 | 6.8 | 9.3 | 6.8 | 5.9 | 6.2 | 9.7 | 5.8 | 8.3 | 8.0 | 10.1 |
| Table 9: Bootstrap Confidence Intervals (BCI) based on 10,000 resamples - 99 Percent | | Survey Round | Survey Quarter | Current | Three Months Ahead | One Year Ahead | | BCI for Mean | Interval Width | BCI for Mean | Interval Width | BCI for Mean | Interval Width | | 44 | Q1:2016-17 | (8.62, 8.93) | 0.30 | (9.52, 9.83) | 0.31 | (9.78, 10.12) | 0.33 | | 45 | Q2:2016-17 | (9.10, 9.38) | 0.29 | (9.55, 9.86) | 0.31 | (11.48, 11.77) | 0.29 | | 46 | Q3:2016-17 | (7.30, 7.58) | 0.29 | (7.75, 8.04) | 0.29 | (8.58, 8.89) | 0.31 | | 47 | Q4:2016-17 | (7.62, 7.91) | 0.29 | (8.03, 8.33) | 0.30 | (9.14, 9.45) | 0.31 |
Annex: Inflation Expectations Survey of Households - Sample Coverage and Survey Schedule The quarterly rounds of the survey were conducted in 18 cities covering a sample size of 5500 households in each round, with 500 households each from four metropolitan cities, viz., Delhi, Kolkata, Mumbai and Chennai, and 250 households each from fourteen major cities viz., Ahmedabad, Bengaluru, Bhopal, Bhubaneswar, Chandigarh, Guwahati, Hyderabad, Jaipur, Lucknow, Nagpur, Patna, Raipur, Ranchi, and Thiruvananthapuram4. The survey schedule of IESH is organized into four blocks. Block 1 collects information on respondent’s profile like name, gender, age, category of respondent etc. Blocks 2 and 3 captures qualitative responses on price expectations for general and various product groups, for three months and one year ahead, respectively, wherein, the respondent’s price expectations are captured using five options, viz., (i) price increase more than current rate, (ii) price increase similar to current rate, (iii) price increase less than current rate, (iv) no change in prices, and (v) decline in prices. Block 4 collects quantitative response on current and expected inflation rates for three months ahead and one year ahead periods, wherein, the inflation rate ranges from ‘less than 1 per cent’ to ‘16 per cent and above’, with intermediate class intervals of size 100 basis points.
|