The performance of non-government non-financial foreign direct investment (FDI) companies deteriorated in 2015-16, with the pace of sales, gross value added and operating profit decelerating and significantly lower return on equity. Net earnings in foreign currencies turned positive on account of a substantial contraction in imports. Funds raised by these companies were predominantly used for fixed capital formation. This article presents an analysis of the financial performance of non-government non-financial (NGNF) foreign direct investment (FDI)1 companies for the financial year 2015-16, based on the audited annual accounts of 6,433 FDI companies which closed their accounts on March 31, 20162. Of these companies, 593 were public limited companies and the other 5,840 were private limited companies. These companies were classified into various industry groups on the basis of the information available on activity in the corporate identity number (CIN) of the company. FDI was mostly received in 4,070 services sector companies, of which 1,292 were engaged in computer and related activities. In the manufacturing sector, the bulk of FDI was received in machinery and machine tools. Data on FDI companies for 2015-16 were released in April 2017 as a press release on the Reserve Bank’s website along with explanatory notes. The article is organised into seven sections. In section 1, the performance of FDI companies is assessed in terms of sales and output (gross value added – GVA). Section 2 deals with exports and imports of these companies. Profit generating capacity as well as returns are presented in section 3. Section 4 discusses the capital structure and debt serviceability, while the composition of assets in the financial structure of FDI companies is set out in section 5. Funds raised from various sources and utilisation of these funds in various assets is addressed in section 6. Concluding observations are given in section 7. 1. Income and Expenditure 1.1 Sales growth of FDI companies decelerated in 2015-16, consistent with the pattern of sales in non-FDI companies, but was comparatively better than the latter at the aggregate level (Chart 1A and Statement 1). 1.2 The slow down in sales growth was observed across manufacturing and services sectors companies. In the manufacturing sector, sales lost pace across industry groups except motor vehicles and other transport equipment and electrical machinery and apparatus (Statement 1). 1.3 On the expenditure side, operating expenses decelerated mainly due to softening of raw materials costs and easing power and fuel prices. Expenditure on research and development (R&D), which plays an important role in sustaining the business of a company, accelerated and as a result, royalty paid by FDI companies also rose marginally (Chart 1B and Statement 1). 1.4 Output as measured in terms of gross value added (GVA) moderated, reflecting the decline in sales growth and this pattern was also observed in non-FDI companies. Moderation in the growth of GVA occurred in the manufacturing and the services sectors of FDI companies though they outperformed non-FDI companies at the aggregate level as well as at the sectoral level (Statement 1). 2. Earnings and Expenditure in Foreign Currencies 2.1 Export intensity measured as the ratio of exports to sales weakened gradually over the three-year period 2013-14 to 2015-16. This led to deceleration in growth of total earnings in foreign currencies. However, there was a net inflow of foreign currencies due to a substantial contraction in imports. The situation was exactly the opposite for non-FDI companies in the manufacturing sector, where exports contracted but imports expanded in 2015-16 (Chart 2A, Chart 2B and Statement 1). 2.2 The improvement in export performance of FDI companies in the manufacturing sector was largely contributed by entities producing chemical and chemical products and motor vehicles and other transport equipment. In the services sector, export intensity and export growth softened mainly for services related to wholesale and retail trade across FDI and non-FDI companies (Statement 1). 3. Profitability 3.1 Operating profit and gross profit recorded subdued growth, with persistently high interest expenses pulling down the growth of profit after tax (PAT) significantly. Profit parameters for non-FDI companies also decelerated significantly in 2015-16 (Chart 3A and Statement 1). 3.2 The operating profit margin of FDI companies was maintained in 2015-16, but their return on equity (RoE), measured as ratio of PAT to net worth, declined, gradually over the three-year period 2013-14 to 2015-16. Operating profit improved in the manufacturing sector in most of the industry groups except for food products and beverages and machinery and machine tools. In the services sector, however, the operating profit margin decelerated in all the major industry groups. Similarly, operating profit margin of non-FDI companies in the manufacturing sector improved marginally but declined in the services sectors (Chart 3B, Statement 1 and Statement 2). 4. Capital Structure and Debt Serviceability 4.1 The balance sheets of FDI companies expanded, but at a slower pace than in the preceding year. The composition of liabilities showed that the shares of shareholders’ funds and the long-term borrowings in total liabilities increased marginally in 2015-16 with a corresponding reduction in the share of short-term borrowings (Chart 4 and Statement 2). 4.2 The leverage ratio (ratio of total borrowings to equity) for FDI companies came down gradually, indicating deleveraging. While the leverage ratio declined marginally in the services sector mainly for companies involved in transport, storage and communication, the leverage ratio had moved up marginally in the manufacturing sector especially for companies in food products and beverages and chemical and chemical products. In contrast with the FDI companies, the leverage ratio of non-FDI companies rose steadily over the same period. Debt serviceability of FDI companies measured by the interest coverage ratio (ratio of earnings before interest and tax to interest expenses) did not show any improvement in 2015-16. In the manufacturing sector, it inched up mainly on account of the companies in motor vehicles and other transport equipments sand rubber and rubber products industries. On the contrary, the debt serviceability of companies in the services sector declined (Chart 4 and Statement 2). 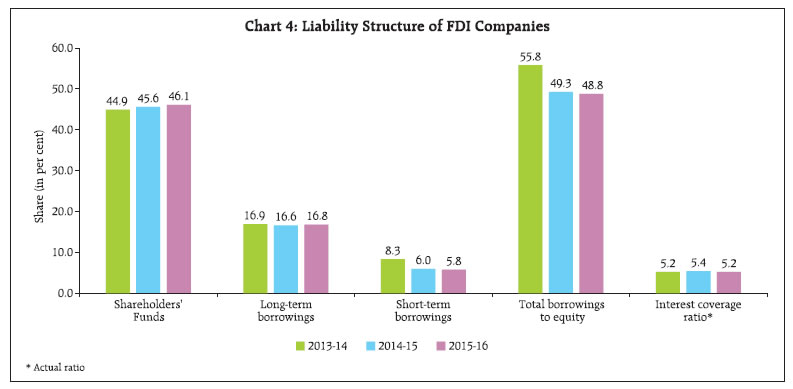 5. Assets Pattern 5.1 The share of gross fixed assets in total assets of FDI companies went up in 2015-16 after a slip in the preceding year. Moreover, the share of non-current investments also improved. By contrast, the share of current investments fell and so did the share of inventories (Chart 5 and Statement 3). 6. Sources and Uses of Funds 6.1 In the sources of funds generated by FDI companies, there was an increase in the shares of borrowings and accrual to provisions, with a significant reduction in the trade payables. Liquidation of non-current investments and other current assets also added to the sources of funds. For non-FDI companies, larger accrual to provisions was the change factor (Statement 4). 6.2 FDI companies utilised about 37 per cent of fresh funds in gross fixed capital formation. Non-current investments and cash and cash equivalents were other major uses of funds. Non-FDI companies also used around one-third of fresh funds in gross fixed capital formation in 2015-16, but close to 45 per cent of funds were used in non-current investments (Statement 4). 7. Concluding Observations Select FDI companies continued to perform relatively better than non-FDI companies in 2015-16 although the performance of both FDI and non-FDI companies deteriorated during the year in terms of growth in sales, GVA and profit. The operating profit margin of FDI companies was maintained on account of the fall in the cost of raw materials. They undertook deleveraging in their capital structure during 2013-16. Nonetheless, debt serviceability as measured by the interest coverage ratio did not improve. The share of funds used for capital formation increased significantly for both FDI and non-FDI companies. | Statement 1: Growth Rates of Select Parameters of FDI and non-FDI Companies | | (Per cent) | | FDI Companies | | Year | No. of Cos. | Sales | Operating Expenses | Operating profit | Profit After Tax (PAT) | | 2014-15 | 2015-16 | 2014-15 | 2015-16 | 2014-15 | 2015-16 | 2014-15 | 2015-16 | | Aggregate (All Companies) | 6,433 | 13.8 | 6.9 | 14.0 | 6.0 | 13.8 | 7.1 | 12.2 | 2.6 | | FDI-share-wise | | 10 per cent-25 per cent | 394 | 10.8 | 2.4 | 10.4 | 0.7 | 14.8 | 1.6 | 27.9 | -10.8 | | 25 per cent-50 per cent | 728 | -0.3 | 3.5 | -2.9 | 2.6 | 2.7 | 12.8 | -19.3 | 23.0 | | 50 per cent and above | 5,311 | 19.0 | 9.3 | 19.9 | 8.5 | 20.9 | 11.4 | 21.3 | 2.0 | | Industry-wise | | Manufacturing | 1,820 | 9.0 | 5.0 | 7.1 | 3.0 | 21.1 | 15.0 | 36.5 | -2.1 | | Food products and beverages | 101 | 14.3 | 4.2 | 12.6 | 5.6 | 30.1 | -1.1 | 34.3 | -24.9 | | Chemicals and chemical products | 283 | 7.0 | 3.8 | 5.3 | 2.2 | 18.0 | 18.2 | 8.4 | 67.4 | | Rubber and plastic products | 88 | 19.1 | 6.4 | 19.4 | 3.3 | 2.1 | 64.4 | -109.0 | # | | Motor vehicles and other transport equipment | 88 | 9.1 | 12.1 | 7.3 | 9.7 | 34.0 | 27.4 | 55.0 | 11.0 | | Machinery and machine tools | 425 | 16.3 | 14.0 | 13.8 | 12.1 | 41.6 | 12.8 | 77.5 | 1.0 | | Electrical machinery and apparatus | 162 | 13.7 | 14.2 | 9.9 | 15.2 | 45.3 | 17.7 | 140.3 | 47.3 | | Services | 4,070 | 22.0 | 11.4 | 25.6 | 11.7 | 13.5 | 7.0 | 9.7 | 9.1 | | Wholesale and retail trade | 433 | 61.3 | 4.1 | 79.3 | 3.5 | -122.2 | # | # | # | | Computer and related activities | 1,292 | 18.8 | 18.3 | 21.1 | 20.9 | 12.5 | 6.4 | 8.2 | 2.9 | | Transport, storage and communication | 183 | 13.9 | 12.4 | 14.8 | 16.1 | 8.4 | -8.2 | 1.0 | -21.9 | | Non-FDI companies | | Aggregate (All Companies) | 3,04,978 | 8.5 | 4.2 | 8.3 | 3.6 | 14.1 | 4.8 | 19.5 | 1.9 | | Industry-wise | | Manufacturing | 78,337 | 7.1 | 2.3 | 7.1 | 1.7 | 9.1 | 4.4 | 18.6 | 0.3 | | Food products and beverages | 7,630 | 6.4 | 5.9 | 6.6 | 5.5 | 3.2 | 9.5 | -3.9 | 9.3 | | Chemicals and chemical products | 11,647 | 9.8 | 5.6 | 10.1 | 5.0 | 5.0 | 10.8 | 20.2 | 2.7 | | Rubber and plastic products | 4,637 | 8.1 | 6.2 | 7.1 | 5.8 | 10.5 | 12.2 | 1.9 | 10.4 | | Motor vehicles and other transport equipment | 1,507 | 12.0 | 14.2 | 11.5 | 14.3 | 23.0 | 16.1 | 47.4 | 19.9 | | Machinery and machine tools | 8,366 | 7.8 | 4.9 | 8.0 | 4.5 | 11.6 | 1.3 | 37.1 | 0.6 | | Electrical machinery and apparatus | 3,926 | 8.4 | 7.6 | 7.3 | 7.7 | 14.7 | 12.1 | 26.9 | 18.9 | | Services | 1,75,926 | 10.6 | 6.3 | 10.0 | 5.9 | 18.0 | 5.3 | 19.9 | 7.2 | | Wholesale and retail trade | 50,361 | 13.1 | 5.2 | 12.7 | 4.8 | 26.5 | 4.4 | 30.5 | 8.5 | | Computer and related activities | 18,040 | 14.2 | 10.8 | 12.6 | 11.6 | 19.0 | 8.0 | 18.0 | 13.5 | | Transport, storage and communication | 8,352 | 12.3 | 5.4 | 12.6 | 6.0 | 14.6 | 5.1 | 41.9 | 0.4 | | # Denominator is negative, nil or negligible. |
| Statement 1: Growth Rates of Select Parameters of FDI and non-FDI Companies (Concld.) | | (Per cent) | | FDI Companies | | Year | GVA | Total borrowings | Exports | Imports | | 2014-15 | 2015-16 | 2014-15 | 2015-16 | 2014-15 | 2015-16 | 2014-15 | 2015-16 | | Aggregate (All Companies) | 14.7 | 11.5 | 1.0 | 9.2 | 12.1 | 1.5 | -14.7 | -13.3 | | FDI-share-wise | | 10 per cent-25 per cent | 11.9 | 6.1 | 2.3 | 26.8 | 38.8 | -20.1 | # | -16.7 | | 25 per cent-50 per cent | 5.7 | 13.1 | -0.2 | -6.8 | -23.0 | 6.0 | -86.3 | 50.2 | | 50 per cent and above | 18.5 | 13.7 | 0.7 | 3.0 | 14.7 | 7.5 | 10.4 | -17.6 | | Industry-wise | | Manufacturing | 19.1 | 13.4 | -5.5 | 10.5 | -2.4 | 22.3 | -31.6 | -7.3 | | Food products and beverages | 26.0 | 1.0 | -23.2 | 22.0 | -55.0 | -59.3 | -63.4 | -46.3 | | Chemicals and chemical products | 15.8 | 15.5 | 17.4 | 11.7 | -8.4 | 15.2 | -1.6 | -9.7 | | Rubber and plastic products | 14.7 | 33.0 | 3.0 | -14.0 | -48.7 | -14.9 | -14.8 | -0.8 | | Motor vehicles and other transport equipment | 29.5 | 21.0 | -21.3 | -15.0 | -50.8 | 75.0 | -12.3 | 11.7 | | Machinery and machine tools | 30.3 | 13.6 | -0.7 | -4.0 | 10.2 | 9.4 | 68.8 | -36.5 | | Electrical machinery and apparatus | 28.8 | 13.1 | -1.4 | -32.0 | 10.1 | -27.4 | -16.0 | -5.2 | | Services | 13.9 | 13.0 | 6.6 | 8.4 | 43.5 | -24.1 | 69.9 | -23.3 | | Wholesale and retail trade | 0.3 | 27.5 | 13.6 | 32.2 | # | -88.6 | 135.4 | -49.7 | | Computer and related activities | 14.1 | 13.4 | 14.9 | 23.0 | -6.4 | 28.3 | 204.1 | -59.3 | | Transport, storage and communication | 16.4 | 10.1 | 9.9 | 4.0 | -24.7 | 88.4 | 120.3 | 158.5 | | Non-FDI companies | | Aggregate (All Companies) | 12.5 | 8.9 | 9.5 | 8.1 | 5.8 | 1.9 | 7.0 | -2.7 | | Industry-wise | | Manufacturing | 9.6 | 7.4 | 5.1 | 5.7 | 5.8 | -2.3 | 0.4 | 1.7 | | Food products and beverages | 6.1 | 12.0 | 3.3 | 10.0 | -7.8 | 11.1 | 9.9 | -8.5 | | Chemicals and chemical products | 7.4 | 11.8 | 3.5 | 10.6 | -10.8 | -6.7 | -16.2 | 18.1 | | Rubber and plastic products | 11.0 | 14.5 | 6.5 | 5.0 | 6.1 | 1.2 | 7.9 | 9.5 | | Motor vehicles and other transport equipment | 18.0 | 15.2 | -1.8 | 5.9 | 54.0 | 15.2 | 22.5 | -18.2 | | Machinery and machine tools | 9.1 | 4.4 | 9.4 | 7.1 | 12.2 | -5.2 | 14.5 | -10.7 | | Electrical machinery and apparatus | 12.5 | 13.2 | 6.5 | 3.1 | 0.8 | -14.5 | 4.6 | -6.5 | | Services | 14.2 | 10.6 | 11.2 | 7.9 | 7.1 | 3.7 | 23.4 | -6.4 | | Wholesale and retail trade | 15.2 | 11.0 | 5.3 | 9.9 | -4.7 | -6.9 | 59.5 | -14.4 | | Computer and related activities | 16.3 | 13.4 | 34.6 | 0.4 | 104.3 | -21.0 | -27.2 | -29.9 | | Transport, storage and communication | 14.3 | 9.3 | 2.4 | 9.4 | 195.7 | -49.4 | 15.2 | -3.3 | | # Denominator is negative, nil or negligible. |
| Statement 2: Ratios of Select Parameters of FDI and non-FDI Companies | | (Per cent) | | FDI Companies | | Year | Operating profit to sales | Return on equity (RoE) | | 2013-14 | 2014-15 | 2015-16 | 2013-14 | 2014-15 | 2015-16 | | Aggregate (All Companies) | 14.6 | 14.7 | 15.0 | 14.9 | 14.6 | 13.6 | | FDI-share-wise | | 10 per cent-25 per cent | 18.7 | 19.4 | 19.2 | 14.0 | 15.3 | 12.9 | | 25 per cent-50 per cent | 18.8 | 19.4 | 21.1 | 16.9 | 12.7 | 14.0 | | 50 per cent and above | 11.8 | 12.0 | 12.2 | 14.5 | 15.1 | 13.7 | | Industry-wise | | Manufacturing | 12.0 | 13.3 | 14.5 | 12.5 | 14.9 | 13.4 | | Food products and beverages | 8.8 | 10.1 | 9.6 | 36.6 | 42.3 | 30.3 | | Chemicals and chemical products | 10.9 | 12.0 | 13.6 | 10.4 | 9.4 | 14.3 | | Rubber and plastic products | 5.7 | 4.9 | 7.6 | 3.1 | -0.2 | -0.3 | | Motor vehicles and other transport equipment | 8.5 | 10.5 | 11.9 | 9.6 | 13.1 | 12.8 | | Machinery and machine tools | 12.1 | 14.8 | 14.6 | 12.9 | 20.3 | 18.4 | | Electrical machinery and apparatus | 8.4 | 10.7 | 11.0 | 4.8 | 10.4 | 14.2 | | Services | 16.4 | 15.2 | 14.6 | 17.5 | 16.4 | 15.7 | | Wholesale and retail trade | 1.6 | -0.2 | -0.7 | -2.1 | -8.6 | -8.4 | | Computer and related activities | 21.7 | 20.6 | 18.5 | 30.0 | 30.3 | 26.0 | | Transport, storage and communication | 16.5 | 15.7 | 12.8 | 20.9 | 19.8 | 13.9 | | Non-FDI companies | | Aggregate (All Companies) | 9.5 | 10.0 | 10.0 | 9.7 | 10.8 | 10.4 | | Industry-wise | | Manufacturing | 8.2 | 8.3 | 8.5 | 11.6 | 12.8 | 12.0 | | Food products and beverages | 6.0 | 5.8 | 6.0 | 11.1 | 9.8 | 9.9 | | Chemicals and chemical products | 10.9 | 10.4 | 10.9 | 13.2 | 14.6 | 13.7 | | Rubber and plastic products | 8.9 | 9.1 | 9.6 | 18.1 | 16.5 | 16.5 | | Motor vehicles and other transport equipment | 6.1 | 6.7 | 6.8 | 12.2 | 16.1 | 17.3 | | Machinery and machine tools | 12.3 | 12.7 | 12.3 | 15.4 | 19.4 | 18.0 | | Electrical machinery and apparatus | 8.4 | 8.9 | 9.3 | 12.4 | 14.3 | 15.9 | | Services | 10.5 | 11.2 | 11.1 | 10.4 | 11.7 | 11.9 | | Wholesale and retail trade | 3.7 | 4.1 | 4.1 | 3.1 | 4.0 | 4.1 | | Computer and related activities | 19.2 | 20.0 | 19.5 | 31.3 | 33.1 | 34.2 | | Transport, storage and communication | 11.1 | 11.3 | 11.3 | 12.4 | 16.3 | 15.3 |
| Statement 2: Ratios of Select Parameters of FDI and non-FDI Companies (Concld.) | | (Per cent) | | FDI Companies | | Year | Total borrowings to equity | Export intensity of sales | Interest coverage ratio* | | 2013-14 | 2014-15 | 2015-16 | 2013-14 | 2014-15 | 2015-16 | 2013-14 | 2014-15 | 2015-16 | | Aggregate (All Companies) | 55.8 | 49.3 | 48.8 | 7.6 | 7.5 | 7.1 | 5.2 | 5.4 | 5.2 | | FDI-share-wise | | 10 per cent-25 per cent | 79.6 | 69.6 | 83.6 | 5.5 | 6.9 | 5.4 | 3.9 | 4.1 | 3.7 | | 25 per cent-50 per cent | 57.8 | 53.8 | 45.1 | 7.8 | 6.0 | 6.1 | 5.7 | 4.9 | 5.2 | | 50 per cent and above | 43.7 | 37.8 | 34.8 | 8.4 | 8.0 | 7.9 | 6.0 | 6.8 | 6.8 | | Industry-wise | | Manufacturing | 68.7 | 56.7 | 57.6 | 8.4 | 7.6 | 8.8 | 4.0 | 4.7 | 5.0 | | Food products and beverages | 78.6 | 52.0 | 60.4 | 4.6 | 1.8 | 0.7 | 6.6 | 8.3 | 7.1 | | Chemicals and chemical products | 39.8 | 38.7 | 39.4 | 15.1 | 12.9 | 14.3 | 4.9 | 6.0 | 7.4 | | Rubber and plastic products | 57.2 | 51.6 | 39.6 | 16.7 | 7.2 | 5.7 | 2.7 | 1.4 | 2.8 | | Motor vehicles and other transport equipment | 26.8 | 18.6 | 13.9 | 1.5 | 0.7 | 1.0 | 5.9 | 7.5 | 10.9 | | Machinery and machine tools | 39.3 | 34.5 | 29.8 | 15.7 | 14.8 | 14.2 | 6.5 | 9.7 | 9.3 | | Electrical machinery and apparatus | 72.8 | 65.3 | 41.0 | 16.7 | 16.2 | 10.3 | 1.7 | 2.8 | 4.2 | | Services | 38.3 | 34.7 | 33.2 | 6.6 | 7.7 | 5.3 | 7.6 | 7.6 | 7.2 | | Wholesale and retail trade | 50.4 | 31.9 | 41.0 | 6.0 | 17.2 | 1.9 | 0.7 | -1.2 | -0.8 | | Computer and related activities | 14.2 | 15.2 | 15.6 | 4.2 | 3.3 | 3.6 | 32.3 | 31.9 | 27.2 | | Transport, storage and communication | 79.9 | 82.4 | 76.7 | 0.7 | 0.5 | 0.8 | 3.6 | 3.7 | 3.2 | | Non-FDI companies | | Aggregate (All Companies) | 87.9 | 89.9 | 91.8 | 6.5 | 6.4 | 6.2 | 2.6 | 2.7 | 2.8 | | Industry-wise | | Manufacturing | 95.2 | 92.8 | 91.9 | 7.7 | 7.7 | 7.3 | 2.5 | 2.5 | 2.6 | | Food products and beverages | 116.4 | 110.5 | 112.6 | 6.4 | 5.5 | 5.8 | 2.2 | 2.1 | 2.3 | | Chemicals and chemical products | 69.0 | 65.7 | 66.3 | 14.9 | 12.1 | 10.7 | 3.3 | 3.4 | 3.8 | | Rubber and plastic products | 102.6 | 97.9 | 93.2 | 7.2 | 7.0 | 6.7 | 2.9 | 2.9 | 3.1 | | Motor vehicles and other transport equipment | 80.1 | 70.3 | 66.7 | 2.3 | 3.2 | 3.2 | 2.3 | 2.9 | 3.7 | | Machinery and machine tools | 60.8 | 61.5 | 60.7 | 10.7 | 11.2 | 10.1 | 4.1 | 4.6 | 4.6 | | Electrical machinery and apparatus | 83.9 | 81.6 | 78.4 | 5.1 | 4.8 | 3.8 | 3.0 | 3.2 | 3.4 | | Services | 67.3 | 70.5 | 71.8 | 5.0 | 4.8 | 4.7 | 3.4 | 3.7 | 3.7 | | Wholesale and retail trade | 46.8 | 48.1 | 50.7 | 6.2 | 5.2 | 4.6 | 2.1 | 2.2 | 2.3 | | Computer and related activities | 38.1 | 45.9 | 41.9 | 3.6 | 6.5 | 4.6 | 12.4 | 13.6 | 15.2 | | Transport, storage and communication | 115.9 | 110.2 | 112.6 | 0.4 | 1.0 | 0.5 | 2.6 | 3.0 | 2.8 | | *Actual ratio |
| Statement 3: Composition of Liabilities and Assets of FDI and non-FDI Companies | | (Per cent) | | Year | FDI companies | Non-FDI companies | | 2013-14 | 2014-15 | 2015-16 | 2013-14 | 2014-15 | 2015-16 | | CAPITAL AND LIABILITIES | | A. Shareholders' Funds | 44.9 | 45.6 | 46.1 | 37.9 | 37.6 | 37.1 | | Of which, (i) Share Capital | 11.7 | 12.1 | 12.3 | 9.1 | 9.4 | 9.3 | | (ii) Reserves and Surplus | 33.2 | 33.5 | 33.8 | 28.8 | 28.2 | 27.8 | | Of which, Capital reserve | 16.9 | 17.9 | 18.2 | 15.4 | 15.2 | 15.0 | | B. Non-current liabilities | 19.2 | 19.0 | 19.5 | 22.4 | 23.0 | 23.3 | | Of which, Long-term borrowings | 16.9 | 16.6 | 16.8 | 19.7 | 20.1 | 20.5 | | Of which, Term loans | 9.5 | 8.3 | 7.2 | 10.4 | 10.5 | 10.2 | | Of which, Term loans from banks | 9.5 | 8.3 | 7.2 | 10.4 | 10.5 | 10.2 | | C. Current liabilities | 35.6 | 35.1 | 34.4 | 39.3 | 39.2 | 39.4 | | Of which, (i) Short-term borrowings | 8.3 | 6.0 | 5.8 | 14.0 | 13.8 | 13.8 | | Of which, Loans repayable on demand | 4.1 | 3.6 | 3.6 | 5.8 | 6.3 | 6.4 | | Of which, from banks | 4.1 | 3.6 | 3.6 | 5.8 | 6.3 | 6.4 | | (ii) Trade payables | 12.9 | 13.7 | 12.9 | 11.7 | 11.7 | 11.5 | | Assets | | D. Non-current assets | 53.5 | 52.4 | 54.0 | 50.7 | 49.9 | 49.7 | | Of which, (i) Gross Fixed Assets | 66.7 | 63.0 | 63.8 | 41.8 | 39.3 | 42.9 | | Of which, Tangible assets | 44.1 | 41.7 | 43.0 | 31.4 | 29.7 | 32.5 | | (ii) Non-current investments | 4.6 | 4.8 | 5.4 | 12.1 | 11.7 | 11.4 | | Of which, Equity instruments/shares | 3.8 | 1.0 | 4.6 | 9.0 | 1.3 | 8.2 | | (iii) Long term loans and advances | 6.4 | 6.4 | 6.1 | 6.7 | 6.2 | 5.9 | | E. Current assets | 46.5 | 47.6 | 46.0 | 49.3 | 50.1 | 50.3 | | Of which, (i) Current investments | 4.1 | 4.5 | 3.5 | 2.7 | 2.7 | 2.6 | | (ii) Inventories | 11.3 | 11.3 | 10.6 | 16.1 | 16.4 | 16.3 | | (iii) Trade receivables | 13.1 | 13.4 | 13.3 | 14.2 | 14.3 | 14.4 | | (iv) Short-term loans and advances | 5.9 | 5.6 | 5.5 | 8.6 | 8.9 | 8.9 | | (v) Cash and cash equivalents | 3.8 | 7.5 | 10.7 | 3.5 | 4.6 | 4.7 |
| Statement 4: Composition of Sources and Uses of Funds of Select FDI and non-FDI Companies* | | (Per cent) | | Year | FDI companies | Non-FDI companies | | 2014-15 | 2015-16 | 2014-15 | 2015-16 | | SOURCES OF FUNDS | | Increase in Liabilities | | 1. Paid-up Capital | 9.1 | 7.4 | 5.2 | 3.2 | | 2. Reserves and Surplus | 6.7 | 8.1 | 4.0 | 3.5 | | 3. Provisions | 6.5 | 12.1 | 0.9 | 20.3 | | 4. Share Capital and premium | 14.3 | 10.7 | 4.7 | 4.5 | | 5. Long-term borrowings | 9.8 | 12.2 | 11.1 | 9.1 | | 6. Short-term borrowings | 1.0 | 2.2 | 11.9 | 5.1 | | 7. Trade payables | 11.8 | 2.2 | 5.0 | 3.2 | | 8. Other liabilities | 13.2 | 9.1 | 7.2 | 7.2 | | 9. Total increase in liabilities | 72.4 | 64.1 | 50.0 | 56.3 | | Decrease in Assets | | 10. Gross Assets | 3.0 | - | 3.4 | - | | (i) Tangible assets | - | - | 2.3 | - | | Of which, Plant and machinery | - | - | 1.5 | - | | (ii) Capital Work-in-progress | 3.0 | - | - | - | | (iii) Intangible assets | - | - | 1.1 | - | | 11. Non-Current Investment | 13.9 | 17.8 | 43.1 | 43.7 | | Of which, (i) Equity instruments / shares | 12.6 | - | 36.6 | - | | (ii) Others | - | 17.8 | - | 43.7 | | 12. Current investments | - | 3.5 | - | - | | 13. Inventory of raw materials, components etc. | 0.3 | - | - | - | | 14. Other current assets | 10.4 | 14.6 | 3.4 | - | | 15. Total decrease in assets | 27.6 | 35.9 | 50.0 | 43.7 | | 16. Total sources of funds | 100.0 | 100.0 | 100.0 | 100.0 | *To comprehend the analysis of sources and uses of funds, the sources of funds were represented either as an increase in liabilities or decrease in the assets, while uses of funds was presented as either increase in assets or decrease in liabilities.
- Nil or negligible |
| Statement 4: Composition of Sources and Uses of Funds of Select FDI and non-FDI Companies* (Concld.) | | (Per cent) | | USES OF FUNDS | | Increase in Assets | | 17. Non-Current assets | 46.1 | 63.6 | 55.7 | 80.3 | | Of which, (i) Gross Fixed Assets | 23.4 | 36.9 | 7.7 | 33.7 | | Of which, Tangible assets | 13.8 | 28.4 | 6.5 | 26.0 | | Of which, Plant and machinery | 6.7 | 16.3 | - | 13.4 | | (ii) Non-current investments | 17.5 | 23.8 | 46.5 | 45.8 | | (iii) Long-term loans and advances | 3.9 | 1.7 | 0.1 | 0.4 | | 18. Current assets | 44.1 | 32.3 | 27.6 | 19.6 | | Of which, (i) Current investments | 4.3 | - | 1.1 | 0.5 | | (ii) Inventories | 6.8 | 1.8 | 8.2 | 5.2 | | (iii) Trade receivables | 9.6 | 5.9 | 6.2 | 6.0 | | (iv) Short-term loans and advances | 2.2 | 1.7 | 4.9 | 3.4 | | (v) Cash and cash equivalents | 21.2 | 22.9 | 7.2 | 2.2 | | 19. Total increase in assets | 90.3 | 95.9 | 83.4 | 99.9 | | Decrease in Liabilities | | 20. Share application money pending allotment | 0.1 | 1.0 | 0.9 | - | | 21. Depreciation | - | - | 8.0 | - | | 22. Long Term Borrowings | 1.3 | 2.7 | 0.5 | - | | Of which, (i) Term loans from banks | 0.7 | 2.3 | - | - | | (ii) Deposits | - | - | 0.3 | - | | (iii) Loans and advances from related parties | - | - | 0.2 | - | | 23. Short-term borrowings | 8.2 | 0.4 | 7.2 | - | | Of which, (i) Deposits | - | 0.3 | - | - | | (ii) Other loans and advances | 8.0 | - | 7.2 | - | | 24. Total decrease in liabilities | 9.7 | 4.1 | 16.6 | 0.1 | | 25. Total uses of funds | 100.0 | 100.0 | 100.0 | 100.0 | *To comprehend the analysis of sources and uses of funds, the sources of funds were represented either as an increase in liabilities or decrease in the assets, while uses of funds was presented as either increase in assets or decrease in liabilities.
- Nil or negligible |
|